US Steel - Clairton - Installation Permit Application ...€¦ · Installatiol1 Permit Application...
310
Prepared for: United States Steel Corporation Clairton Works Clairton, PA 15025 RECEIVED ALLEGHENY COUt{TY HEALTH OEPT. (Jj AIR QUAliTY? Installatiol1 Permit Application for the Proposed C Battery Project EI\JSR Corporation January, 2008 Document No.: 06975-355-300 ENSR AECOM
Transcript of US Steel - Clairton - Installation Permit Application ...€¦ · Installatiol1 Permit Application...

Prepared for: United States Steel Corporation Clairton Works Clairton, PA 15025
RECEIVED
ALLEGHENY COUt{TY HEALTH OEPT. (JjAIRQUAliTY?
Installatiol1 Permit Application for the Proposed C Battery Project
EI\JSR Corporation January, 2008 Document No.: 06975-355-300
ENSR AECOM
Prepared for: -~~ United States Steel Corporation
Clairton Works Clairton, PA 15025
Installation Permit Application for the Proposed C Battery Project
=V~R-Prepared By
Reviewed By
ENSR Corporation January, 2008
./, Document No.: 06975-355-300
ENSR AECOM

ES-1 January 2008 D:\final permit application 12-31-07\Permit Application
Technical Support Document Dec 31.doc
Contents
1.0 Introduction ............................................................................................................................................ 1-1 1.1 Project Overview.............................................................................................................................. 1-1 1.2 The Applicant ................................................................................................................................... 1-1
2.0 Project Description................................................................................................................................ 2-1 2.1 Overview .......................................................................................................................................... 2-1 2.2 Comparison of 1-3 Battery with C Battery Emission Controls ....................................................... 2-2
2.2.1 Coal Handling .................................................................................................................... 2-2 2.2.2 Charging Coal to Ovens .................................................................................................... 2-3 2.2.3 Coking Process.................................................................................................................. 2-4 2.2.4 Pushing .............................................................................................................................. 2-4 2.2.5 Travel ................................................................................................................................. 2-6 2.2.6 Quench Tower ................................................................................................................... 2-6 2.2.7 Coke Handling ................................................................................................................... 2-6
2.3 Summary of Emissions.................................................................................................................... 2-7
3.0 Applicable Regulations......................................................................................................................... 3-1 3.1 Allegheny County Health Department Rules and Regulations, Article XXI Air Pollution Control . 3-2 3.2 Prevention of Significant Deterioration and Non-attainment New Source Review Applicability
Analysis............................................................................................................................................ 3-5 3.2.1 Regulatory Background.................................................................................................. 3-5 3.2.2 Overview of Emissions Netting Procedures................................................................ 3-6 3.2.3 Future Allowable Emissions from New Equipment .................................................... 3-8 3.2.4 Baseline Actual Emissions ............................................................................................ 3-8 3.2.5 Contemporaneous Emission Changes ........................................................................ 3-8 3.2.6 Results of Emissions Netting Analysis ...................................................................... 3-14
3.3 Federal Regulations ...................................................................................................................... 3-16 3.4 Commonwealth of Pennsylvania Regulations .............................................................................. 3-16 3.5 Summary of Applicable Emission Limits and Work Practice Standards ..................................... 3-16
4.0 Best Available Control Technology Analysis .................................................................................... 4-1 4.1 BACT Assessment Approach ......................................................................................................... 4-1
4.1.1 Identification of Available Control Technology Options............................................ 4-2 4.1.2 Ranking of Technically Feasible Control Options ...................................................... 4-2 4.1.3 Environmental Impact Analysis..................................................................................... 4-3 4.1.4 Energy Impact Analysis.................................................................................................. 4-3 4.1.5 Economic Impact Analysis............................................................................................. 4-3
4.2 BACT for C Battery Coking Cycle COG Combustion..................................................................... 4-4

ES-2 January 2008 D:\final permit application 12-31-07\Permit Application
Technical Support Document Dec 31.doc
4.3 BACT for C Battery Pushing ........................................................................................................... 4-9 4.4 BACT for C Battery Fugitives ........................................................................................................ 4-12 4.5 BACT for C Battery Traveling........................................................................................................ 4-15 4.6 BACT for C Battery Quench Tower............................................................................................... 4-17 4.7 BACT for C Battery Coke Handling............................................................................................... 4-19 4.8 BACT Determination Summary..................................................................................................... 4-20
List of Appendices Appendix A Allegheny County Health Department Installation Permit Application Forms
Appendix B Process Flow Diagrams, Site Layouts and Project Specification Sheets
Appendix C Emission Calculations
Appendix D Literature on the PROven® System
Appendix E Best Available Control Technology Backup
Appendix F Fugitive Dust Control Plan
Appendix G ACHD Permits List
ES-3 January 2008 D:\final permit application 12-31-07\Permit Application
Technical Support Document Dec 31.doc
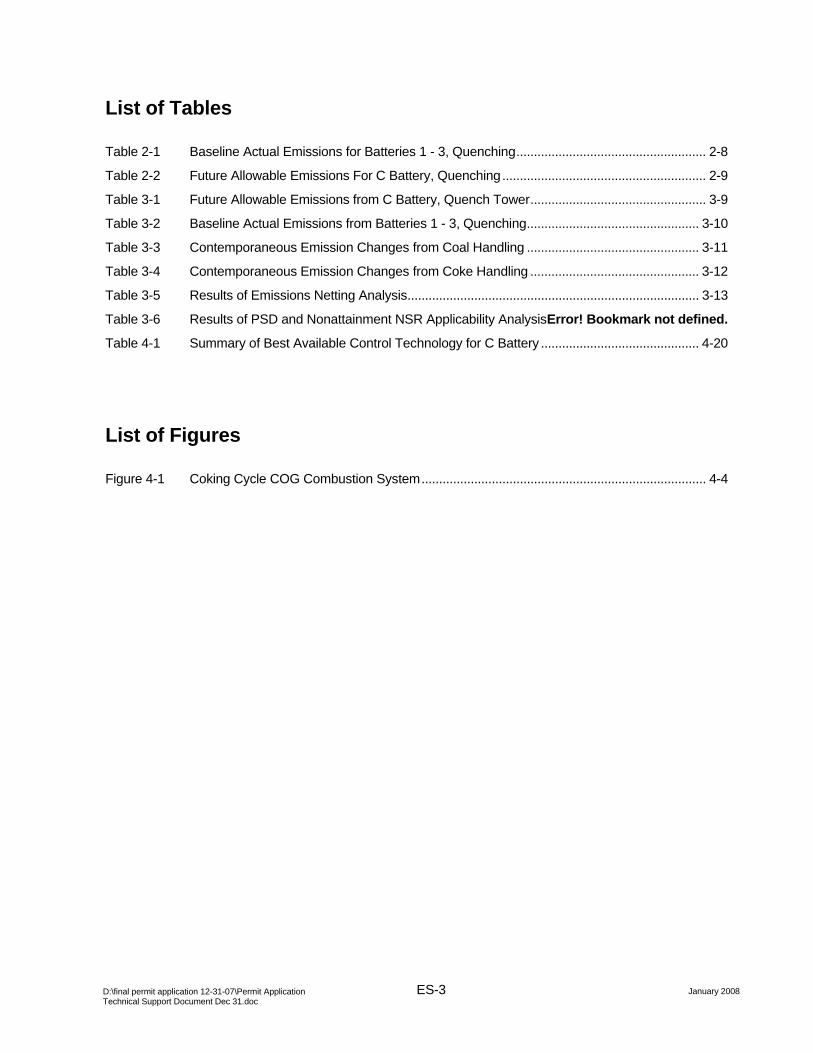
List of Tables
Table 2-1 Baseline Actual Emissions for Batteries 1 - 3, Quenching...................................................... 2-8 Table 2-2 Future Allowable Emissions For C Battery, Quenching.......................................................... 2-9 Table 3-1 Future Allowable Emissions from C Battery, Quench Tower.................................................. 3-9 Table 3-2 Baseline Actual Emissions from Batteries 1 - 3, Quenching................................................. 3-10 Table 3-3 Contemporaneous Emission Changes from Coal Handling ................................................. 3-11 Table 3-4 Contemporaneous Emission Changes from Coke Handling ................................................ 3-12 Table 3-5 Results of Emissions Netting Analysis................................................................................... 3-13 Table 3-6 Results of PSD and Nonattainment NSR Applicability AnalysisError! Bookmark not defined. Table 4-1 Summary of Best Available Control Technology for C Battery ............................................. 4-20
List of Figures
Figure 4-1 Coking Cycle COG Combustion System................................................................................. 4-4

1-1 January 2007 D:\final permit application 12-31-07\Permit Application
Technical Support Document Dec 31.doc
1.0 Introduction
1.1 Project Overview
The United States Steel Corporation, Clairton Works operates 12 coke batteries at full capacity utilization produces up to 13,000 tons of coke per day from the destructive distillation (carbonization) of more than 18,000 tons of coal. During the carbonization process, approximately 225 million cubic feet of coke oven gas are produced. The volatile products of coal contained in the coke oven gas are recovered in the by-products plant. In addition to the coke oven gas, daily production of these by-products include 145,000 gallons of crude coal tar, 55,000 gallons of light oil, 35 tons of elemental sulfur, and 50 tons of anhydrous ammonia.
Clairton Works is located approximately 20 miles south of Pittsburgh on 392 acres along 3.3 miles of the west bank of the Monongahela River. The plant was built by St. Clair Steel Company in 1901 and bought by U.S. Steel in 1904. The first coke batteries were built in 1918. The coke produced is used in the blast furnace operations in the production of molten iron for steel making. Most of the coke is used by sister plants with a portion sold in the commercial market.
The Clairton Works is a major source of CO, NOX, PM, PM10, PM2.5, SO2, VOCs and Hazardous Air Pollutants (HAPs). The emission sources at the plant can be divided into four general categories
• Coke oven batteries and related equipment
• Coke By-Products and Desulfurization Plant
• Coal and coke handling facilities
• Miscellaneous facilities
United States Steel is proposing two projects that will replace some of the old coke oven batteries with new batteries. In the first project a new C Battery will replace existing Batteries 1 - 3. In the second project a new D Battery, (subject of a separate permit application), will replace Batteries 7 - 9. The new batteries will contain the latest emission control technology and will emit less air pollution per ton of coal charged and per ton of coke produced than the old batteries. The project will reduce total emissions. Due to the emission reductions, the projects will not trigger review under the Prevention of Significant Deterioration (PSD) regulations and Nonattainment New Source Review (NNSR).
1.2 The Applicant
The Applicant for this Project is United States Steel Corporation, Clairton Works. The primary contact with overall responsibility for the Project and this Application is:
Anton Lukac
General Manager
United States Steel Corporation, Mon Valley Works
P.O. Box 878
Dravosburg, PA 15034
Tel: (412) 675-2600

1-2 January 2007 D:\final permit application 12-31-07\Permit Application
Technical Support Document Dec 31.doc
The applicant retained ENSR Corporation to prepare this application and perform supporting analyses. The primary contact person at ENSR responsible for preparation of this document is:
David Shea
ENSR Corporation
2 Technology Park Drive
Westford, MA 01886
Tel: (978) 589-3113
The Project will require an Installation Permit from the Allegheny County Health Department (ACHD). This document constitutes the permit application for the C Battery Replacement project. Section 2 of this document contains a detailed project description. Section 3 presents a regulatory review, including a demonstration that the Project will not trigger review under the PSD regulations and will not trigger NNSR for PM2.5 and ozone. Section 4 presents the Best Available Control Technology (BACT) analysis for the new C Battery. The following appendices are included:
• Appendix A Allegheny County Health Department (ACHD) Installation Permit Forms
• Appendix B Process Flow Diagrams, Site Layout Drawings and Project Specification Sheets
• Appendix C Emission Calculations
• Appendix D Literature on the PROven® System
• Appendix E Best Available Control Technology (BACT) Backup
• Appendix F Fugitive Dust Control Plan
• Appendix G ACHD Permits List
2-1 January 2007 D:\final permit application 12-31-07\Permit Application
Technical Support Document Dec 31.doc
2.0 Project Description
2.1 Overview
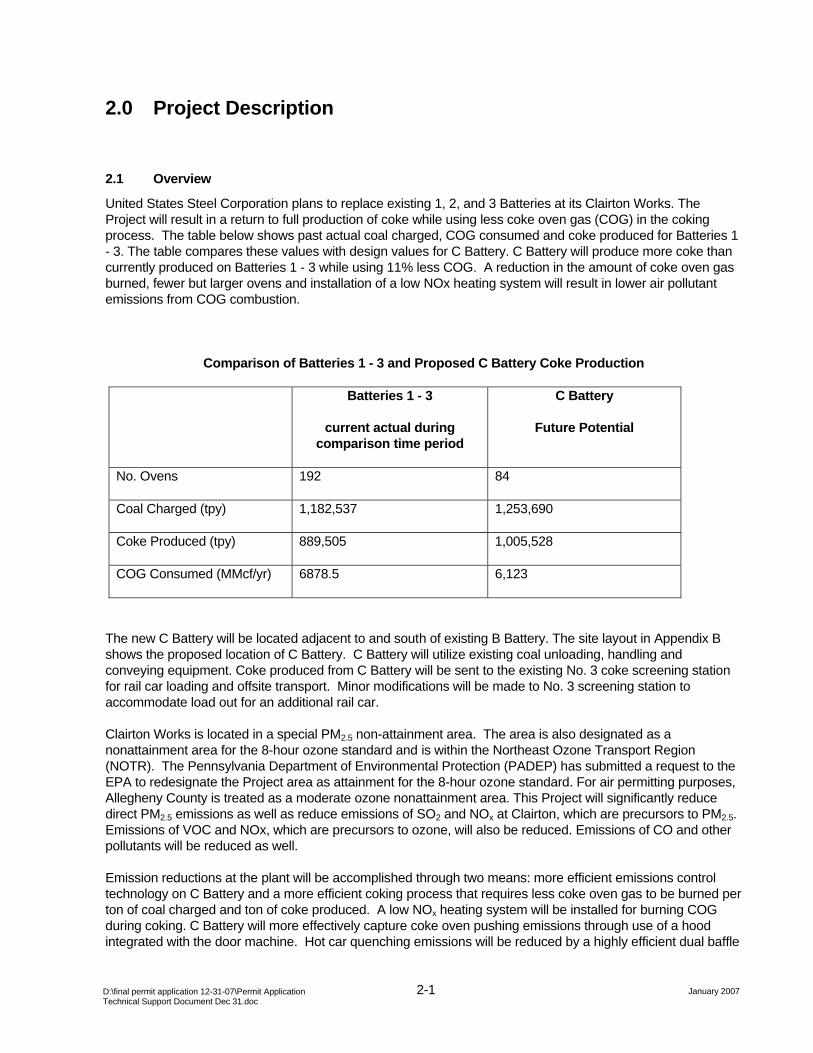
United States Steel Corporation plans to replace existing 1, 2, and 3 Batteries at its Clairton Works. The Project will result in a return to full production of coke while using less coke oven gas (COG) in the coking process. The table below shows past actual coal charged, COG consumed and coke produced for Batteries 1 - 3. The table compares these values with design values for C Battery. C Battery will produce more coke than currently produced on Batteries 1 - 3 while using 11% less COG. A reduction in the amount of coke oven gas burned, fewer but larger ovens and installation of a low NOx heating system will result in lower air pollutant emissions from COG combustion.
Comparison of Batteries 1 - 3 and Proposed C Battery Coke Production
Batteries 1 - 3
current actual during comparison time period
C Battery
Future Potential
No. Ovens 192 84
Coal Charged (tpy) 1,182,537 1,253,690
Coke Produced (tpy) 889,505 1,005,528
COG Consumed (MMcf/yr) 6878.5 6,123
The new C Battery will be located adjacent to and south of existing B Battery. The site layout in Appendix B shows the proposed location of C Battery. C Battery will utilize existing coal unloading, handling and conveying equipment. Coke produced from C Battery will be sent to the existing No. 3 coke screening station for rail car loading and offsite transport. Minor modifications will be made to No. 3 screening station to accommodate load out for an additional rail car.
Clairton Works is located in a special PM2.5 non-attainment area. The area is also designated as a nonattainment area for the 8-hour ozone standard and is within the Northeast Ozone Transport Region (NOTR). The Pennsylvania Department of Environmental Protection (PADEP) has submitted a request to the EPA to redesignate the Project area as attainment for the 8-hour ozone standard. For air permitting purposes, Allegheny County is treated as a moderate ozone nonattainment area. This Project will significantly reduce direct PM2.5 emissions as well as reduce emissions of SO2 and NOx at Clairton, which are precursors to PM2.5. Emissions of VOC and NOx, which are precursors to ozone, will also be reduced. Emissions of CO and other pollutants will be reduced as well.
Emission reductions at the plant will be accomplished through two means: more efficient emissions control technology on C Battery and a more efficient coking process that requires less coke oven gas to be burned per ton of coal charged and ton of coke produced. A low NOx heating system will be installed for burning COG during coking. C Battery will more effectively capture coke oven pushing emissions through use of a hood integrated with the door machine. Hot car quenching emissions will be reduced by a highly efficient dual baffle
2-2 January 2007 D:\final permit application 12-31-07\Permit Application
Technical Support Document Dec 31.doc
system and a taller quench tower that provides greater draft. No. 3 coke screening station emissions will be reduced using enclosures and a more efficient baghouse than currently exists. An application to install this baghouse had previously been submitted to the ACHD. This document includes an updated version of that application.
As part of the C Battery Project, United States Steel will install the PROven® system, developed by Uhde Corporation, the engineer for this project. The PROven® system (Pressure Regulated Oven) regulates pressure within each oven chamber where the collector main operates under a negative pressure during coking in order to almost eliminate fugitive emissions from the ovens during charging and coking.
The existing three underfire battery stacks are the largest sources of SO2, NOx and CO in Batteries 1 - 3 and the third largest emitters of particulate matter. In C Battery there will be only 84 ovens compared to the 192 ovens in Batteries 1 - 3. Although the C Battery ovens will be larger and the amount of coke produced higher than current levels due to battery deterioration, the amount of coke oven gas burned in C Battery will be 11% less per ton of coal charged due to better combustion efficiencies with the larger ovens. Burning less COG produces lower emissions.
2.2 Comparison of 1-3 Battery with C Battery Emission Controls
The following text presents a comparison of operations and emissions controls for Batteries 1 - 3 and C Battery.
2.2.1 Coal Handling
The general procedure for coal handling involves the transfer of coal from barges or trucks onto several conveyor belts which in turn transfer the coal into mixing bins or surge bins where the coal is stored until needed in the process. Figure B-2 in Appendix B is a flow diagram of the process. As required, the coal is transported from the surge bins into pulverizers where it is pulverized to a pre-selected size after which it is blended with a wetting agent (oil or water) to regulate the bulk density of the mixture. This mixture is stored in bunkers until a larry car picks up a specific mass (or volume) of the mixture before charging it to the ovens.
Coal is delivered presently to Clairton Plant via barges and trucks.
1. Coal from barges is unloaded using a 3-strand unloader, consisting of 47 buckets each, into an apron feeder. The apron feeder delivers the coal to a conveyor (conveyor No. 12A) which in turn delivers the coal to another conveyor (12C).
2. The coal from storage is loaded into trucks which deliver the coal to a hopper feeding a conveyor (12B) which in turn transfers the coal onto conveyor 12C.
The coal from both means (barges and trucks) finally meets at conveyor 12C after which conveyor 12D which transfers the coal onto shuttle conveyors 12E and 12F. Conveyors 12E and 12 F are movable conveyors which drop the coal into four silos intended for storing coal.
Each silo is equipped with two weigh belt feeders. The weigh belt feeders on the east deliver a weighed mass of coal onto conveyor 12K. Conveyor 12K delivers the coal into the primary pulverizer for Batteries 1-3 and 7-9. The pulverized coal drops onto a reversing conveyor 12U which transfers the coal onto conveyor 1A which then transfers the coal onto 1B.
From conveyor 1B, the coal splits into two streams; the first stream goes onto shuttle conveyor 1C to the coal bunkers for Batteries 7, 8 and 9. The second stream goes onto conveyor 1D which transfers it to shuttle conveyor 1E. Shuttle conveyor 1E discharges the coal into bunkers for Batteries 1, 2 and 3.

2-3 January 2007 D:\final permit application 12-31-07\Permit Application
Technical Support Document Dec 31.doc
The west weigh belt feeder conveys the coal to conveyor 12P which delivers it to conveyor 12S. Conveyor 12S discharges the coal into a secondary pulverizer which pulverizes coal for the feed stream to the B Battery. The pulverized coal is transferred to the B Battery coal bunkers using seven different conveyors.
It is worthwhile to note that barring the conveyors 1A, 1B, 1C, 1D and the coal bunkers for Batteries 1-3 and 7-9, all the equipment is enclosed signifying controlled emission points.
The Battery C project will not include any new coal handling equipment or any modification to the existing equipment. However, the shutdown of Batteries 1 - 3 will result in a significant reduction in the mass of coal conveyed to conveyors 1A, 1B, 1D, 1E and the existing coal bunkers used by 1 – 3 Batteries.
There will be an increase in the mass of coal conveyed by the conveyors 12P, 12S, 12R1, 12RT1, 12R2, IT2, IT3A, 2B1, 2C1 and by the existing coal bunkers used by B Battery since B and C Batteries will be sharing a common set of coal bunkers. Fugitive dust emissions from coal handling are expected to increase slightly as a result of increased.
2.2.2 Charging Coal to Ovens
The Clairton Works operates 12 by-product coke oven batteries. By-product coke ovens are designed and operated to permit collection of the volatile material evolved from coal during the coking process. Each battery contains from 61 to 87 ovens. Coal is charged through openings in the top of the ovens. Emissions from the coke batteries during coal charging are controlled by:
• volumetric controls to ensure the proper amount of coal is charged to the oven (extra coal would block gas passages);
• stage charging, wherein not all of a larry car's hoppers are emptied at once so the exhaust system is not overwhelmed; (Larry cars receive coal from coal storage bins and are equipped with four hoppers that discharge a measured volume of coal to the oven. They move along rails on top of the battery.)
• currently in Batteries 1 - 3, steam aspirators are used in the battery offtakes to create exhaust suction to draw emissions into the collecting main;
• automatic lid lifters, where available, on newer batteries minimize the time that lids remain open;
• dual collector mains on existing Batteries 1 - 3, and
• after charging is completed, the charging holes are lidded and sealed and steam aspirators are turned off.
Batteries 1 - 3operate as follows. A specific amount of coal (stored in the coal bunkers) is discharged from the bunker into a larry car. A larry car is an electrically operated vehicle that is capable of carrying the coal over the entire length of the battery. The process of charging begins with the positioning of the larry car over the coke oven, known as spotting. At this time, the lids on the charging ports are removed and coal is dropped from the larry car into the oven.
Steam aspiration is used to suck the gases generated in the oven chamber into the collector mains, thus reducing charging emissions. Once the larry car has passed over and dropped coal into the oven chamber, a leveling bar evens the coal out to create a uniform free space above the coal charge. This assists in the unobstructed flow of offtake emissions through the collector main to the by-product plant. In the case of Batteries 1 - 3, the ovens are maintained at a slight positive top pressure throughout the coking cycle due to the rapid evolution of gas, which may result in charging emissions and leaks from doors and lids.
2-4 January 2007 D:\final permit application 12-31-07\Permit Application
Technical Support Document Dec 31.doc
With the installation of C battery, a screw feed larry car will allow for more controlled charging of coal into the ovens. Steam aspiration will no longer be used to suck the gases into the collector main. Instead, charging emissions are expected to decrease as a result of the use of the PROven® system installed in the gas offtake of each oven system. Figure B-3 in Appendix B shows the arrangement of C Battery. The Pressure Oven Regulated system or the PROven® system is an electronic control system that individually controls the pressure in each individual oven depending on the stage of coking that each oven is experiencing. The collector main is also maintained at a negative pressure to draw the off gases released during charging and coking thus reducing emissions. The high spikes in oven pressure currently experienced will be eliminated. A complete description of the PROven® system is contained in Appendix D.
2.2.3 Coking Process
Once the ovens have been charged with coal, the coking process begins. The walls of the ovens contains heating flues, of which half burn COG and the other half transport the residual heat from the combustion flues to a heat exchanger called a regenerator. The waste gases coming out of the heat exchanger are discharged from the combustion stack. The average coking time depends on oven conditions and the coke quality and quantity specifications of customers. Oven conditions can affect the ability of an oven to produce at the desired quality level at the design coking rate. At Clairton Plant, the coking time varies between 18 hours and 22 hours depending on demand as well as on oven conditions and the quality of coal being charged. The destructive distillation of coal produces raw coke oven gas, which is cleaned and used as a fuel in the heating flues. To prevent the entry of air into the oven during coking, a slight positive pressure is maintained in the oven. The by products of coking (gases) are carried through the offtake system to the byproduct recovery plant. At the conclusion of the coking cycle, the doors are removed and the incandescent coke is pushed by a ram into the hot car.
Atmospheric emissions during coking result from fugitive emissions (chargin, offtake, door and lid leaks) and from point sources (combustion stack). Emissions from soaking and decarbonization are included in the totals for the coking process as well. Soaking refers to emissions directed to the atmosphere for a short period when the oven is disconnected from the collector main just before the doors are removed in preparation of the push, i.e., the standpipe caps are opened to the atmosphere. Coke that is still “green” would emit pollutants to the atmosphere through the stand pipes. Decarbonization emissions occur after pushing and after the doors have been replaced. The lids are kept cracked or off and the oven left empty for 20-30 minutes to burn off excess wall or roof carbon.
With the installation of C battery and the PROven® system, the leaks from doors and lids, emissions from soaking due to poor seal between the oven and collector main, and offtake leaks will be minimized since the emissions will be conveyed to the collector main which is maintained at a negative pressure. (Refer to Figure B-3 in Appendix B).
C Battery will also burn 11% less COG per ton of coke produced currently than Batteries 1 - 3. NOx emissions will be controlled using a low NOx heating system. These emission reductions are a significant part of the Project.
The C Battery design production rate will be 30.67 tons of coal charged per oven for a design coking time of 18 hours to produce 23.98 tons of coke per push. There would be 112 pushed ovens per day. A total of 3,435 tons of coal would be charged per day to produce 2,686 tons total coke per day.
2.2.4 Pushing
The existing Batteries 1 - 3 consist of 64 ovens per battery for a total of 192 ovens. Batteries 1 - 3 use a moveable hood/fixed duct system to capture pushing emissions. The system consists of a hood that covers the quench car. The hood connects to a duct, which in turn is connected to a baghouse. Coke pushing begins when the coke side door is removed and ends when the hot car enters the quench tower. During the push,
2-5 January 2007 D:\final permit application 12-31-07\Permit Application
Technical Support Document Dec 31.doc
gases are drawn from the quench car into the hood where they are channeled to the exhaust duct. The fan capacities on the moveable hood/fixed duct control systems have all been recently increased which has increased their capture efficiencies.
During pushing, air pollutants can be released for a short time into the atmosphere from the open door with no hood above the door. The Pushing Emission Control (PEC) system consists of a moveable hood with a stationary baghouse (PEC BH). Batteries 1 - 3 operate with one hot car that receives the hot coke from pushing, one moveable hood placed over the hot car on the coke side of the oven and two door machines. Pushing typically occurs in the following sequence:
• The door machine removes the coke side door
• The door machine takes the door to the door cleaner in the transfer area
• The hood arrives at the open oven
• The door machine returns to the open oven and lines up the coke guide with the open oven
• The quench (hot) car arrives at the open oven
• The PEC baghouse (PEC BH) is turned on
• The pusher starts pushing coke into the hot car
• When the oven is empty (i.e., all the coke is in the hot car), the hot car moves to the quench tower and the PEC BH is turned off;
• The door machine cleans the door jamb
• The door machine replaces the door
Most of the emissions from the hot coke are captured by the hood (74.1%). These emissions are directed up through the PEC BH, controlled, and the remainder emitted to the atmosphere. The PEC BH emits SO2, NOx, PM, VOC, CO and very small amounts of other pollutants. The current PEC BH has a permitted outlet grain loading of 0.030 gr/dscf.
The emissions not captured by the hood are called PEC fugitives.
While pushing is occurring at one oven, the second door machine has moved to another oven, spotted up and goes through the door cleaning. Once pushing at the first oven has been completed, the hood slowly moves to catch up with the door machine at the second oven.
The emissions from the open oven prior to the coke mass beginning to move are part of pushing emissions. The amount of emissions to the atmosphere depends upon the amount of time the door has been removed before the hood is in place. When the hood is in place over the hot car, the PEC BH fans are turned on and coke pushing begins.
C Battery will consist of 84 larger ovens with filling dimensions of 6 meters in height x 18 inches wide (average) x 16.7 meters in length. The PEC system on C Battery will consist of a hood that is integral to the door machine, thus reducing pushing fugitive emissions, that is, whenever a coke oven door is opened, there will be a hood to capture emissions. The hood’s capture efficiency is guaranteed at 90%, thus also reducing PEC fugitives. The PEC BH will have an outlet grain loading of 0.005 gr/dscf.

2-6 January 2007 D:\final permit application 12-31-07\Permit Application
Technical Support Document Dec 31.doc
2.2.5 Travel
After receiving the hot coke, the hot car travels to the quench tower. Batteries 1 - 3 all use the same quench tower. During travel the hot car is uncovered. Emissions to the atmosphere consist mainly of particulate released as part of the hot air rising from the coke in the car. Smaller amounts of SO2, NOx, CO and other pollutants are also released.
For C Battery, there will be a new hot car and quench tower. Hot car travel-related emissions will be lower than those from Batteries 1 - 3 for several reasons. (see Figure B-4 in Appendix B). There will be fewer trips traveling to the quench tower. Travel distance to the C Battery quench tower will be less, resulting in fewer trip miles per year. Also, the C Battery hot car will be larger than the Batteries 1 - 3. The coke in the larger C Battery hot car will have greater surface area exposed to the atmosphere, thus higher emissions per car. However, the larger hot car will have a smaller surface area to volume ratio, thus emitting less pollutant per volume or per ton of coke in the hot car. The net effect is lower annual emissions from C Battery traveling.
2.2.6 Quench Tower
Incandescent coke, after it is pushed from the ovens, is transported by means of a quench car or hot car to a quench tower. Quenching of coke minimizes it from burning from further exposure to air.
Currently, 1 – 3 Batteries use the quench tower P013. It is equipped with baffles which help capture and remove the entrained water droplets (which contain particulate matter). It is estimated that baffles control up to 87% of the PM emissions from quenching operations. It uses water from the Monongahela River as make-up which is the closest water body to the facility. Approximately 162 gallons of water are lost to evaporation during the quenching of a ton of coke.
As part of the C Battery Replacement Project, the quench tower P013 will be shut down along with the B battery auxiliary tower which will be demolished. A new quench tower (ID: P047) will be installed for the C Battery. This new quench tower will also serve as the auxiliary quench tower for the B Battery. This new quench tower will have an exit area of 1406.1 ft2 and will have a height of 164.2 feet above grade. It will have Kiro-Nathaus baffles installed within it which are more efficient at capturing the entrained water droplets than the baffles in the quench tower currently being used by Batteries 1 - 3. In addition to the new quench tower, the C Battery system will employ a new quench car to transport the coke from C Battery to the new quench tower.
The quench sump for C Battery will be larger than Batteries 1 - 3 quench sump for better settling and thus cleaner water. It will also have a rake to remove the settled solids.
The B Battery quench tower (exit area = 774.7 ft2 and height = 131.5 feet above grade) will serve as the auxiliary tower for quenching the coke from C Battery.
2.2.7 Coke Handling
Quenched coke is transferred from the coke wharf to one of three screening stations. No. 1 Screening Station (P034) receives coke from Batteries 1-3 and 7-9, No. 2 Screening Station (P035) receives coke from Batteries 13-15 and 19 & 20, and No. 3 Screening Station receives coke from B Battery. As part of the Project, C Battery coke will be transferred to No. 3 Screening Station. No. 1 Screening Station will receive coke from Batteries 7 - 9 only.
After being quenched with water, coke is discharged onto an inclined surface called the coke wharf which allows for the drainage of excess water. The heat transfer during this time also brings the coke to a lower temperature making it safe to handle. After this, the coke is transported via conveyors to screening stations where it is segregated based on size.

2-7 January 2007 D:\final permit application 12-31-07\Permit Application
Technical Support Document Dec 31.doc
At present, the hot car carries the quenched coke over the wharf where the bottom doors of the hot car open up and drop the coke onto the wharf. It is assumed that the coke coming out of the quench tower contains only moisture and no particulates. The coke is held for a period on the wharf so that the moisture attached to it evaporates. The low moisture coke is conveyed off the wharf to the screening station. In the screening station, a metal screen sifts and separates the coke based on size. During this time, a surfactant is added to the coke as a dust suppressant. The large fractions, known as blast furnace coke are dropped from the screening station into a rail car while the small fractions, known as coke breeze are dropped into a bin then into a truck. Additional surfactant is mixed with the coke breeze at this time to prevent particulate emissions during transport.
In the future, the new quench car of C Battery will dump the quenched coke on the wharf where most of the moisture will be evaporated from the coke. The coke will be transferred from the wharf onto the conveyor B1 (currently being used by the B Battery) from where it will drop onto the conveyor B2 which will carry the coke into the No 3 screening station (currently being used by B Battery). The No. 3 screening station will be equipped with a new bag house (fabric filter) for particulate collection. It will also have a two track loadout (similar to No. 1 screening station). The blast furnace coke will be dropped into rail cars and the coke breeze will be dropped into trucks. Since the conveyors B1 and B2 as well as the No. 3 screening station are enclosed, emissions of pollutants are collected and controlled. The coke breeze loadout emissions will be captured by a dedicated dust capture hood. The new bag house will have an outlet grain loading of 0.0065 grains per dry standard cubic feet.
2.3 Summary of Emissions
The tables below presents total emissions from C Battery and from Battery 1 - 3. Emissions for C Battery are maximum allowable. Emissions for Batteries 1 - 3 are baseline actual annual emissions derived from a 2-year period starting May 1, 2002 and ending April 30, 2004. Emissions are presented for each component of the processes involved in making coke. The Table indicates that emission decreases will be achieved for most process components.

2-8 January 2007 D:\final permit application 12-31-07\Permit Application
Technical Support Document Dec 31.doc
Table 2-1 Baseline Actual Emissions for Batteries 1 - 3, Quenching
PROCESS NOx SO2 VOC PM totalPM10
TOTAL (filt+cond)
CO
tons/year tons/year tons/year tons/year tons/year tons/year
Pre-Push Emissions 5.937
WITHOUT HOODPushing Fugitives 0.1 0.7 0.6 8.1 3.9 0.5
WITH HOODPEC BH 13.0 48.4 45.1 5.4 3.0 36.9
Traveling 12.5 46.7 26.8 10.1 10.0PEC fugitives 9.7 36.3 15.8 223.3 108.0 10.3
Quenching 25.7 0.3 695.6 521.7
STACK TOTAL 892.6 118.1 32.4 38.2 36.6 398.4
Ball Mill 0.0 0.0Soaking 0.6 58.5 3.5 8.9Decarbonization 688.2
FugitivesDoors 26.0 21.3 13.0Lids 9.6 0.2 0.1
Charging 0.9 0.9 0.6Offtakes 9.6 0.6 0.3
TOTALS 928.6 334.5 143.9 1029.2 689.2 1158.3
Actual Annual Emissions for BATTERIES 1-3

2-9 January 2007 D:\final permit application 12-31-07\Permit Application
Technical Support Document Dec 31.doc
Table 2-2 Future Allowable Emissions For C Battery, Quenching
PROCESS NOx SO2 VOC PM totalPM10 TOTAL
(filt+cond) CO
tons/year tons/year tons/year tons/year tons/year tons/year
Pre-Push Emissions 0.3
WITHOUT HOODPushing Fugitives 0.1 0.4 0.3 4.8 2.3 0.3
WITH HOODPEC BH 14.4 53.6 48.0 2.9 1.6 39.3
Traveling 7.4 27.7 15.9 6.0 5.9PEC fugitives 13.7 51.1 6.5 93.5 45.1 4.7
Quenching 5.8 13.4 10.1
STACK TOTAL 794.6 105.2 28.8 16.7 20.6 319.7
Ball Mill 0.0 0.0Soaking 0.3 31.0 1.9 4.7Decarbonization 628.9
FugitivesDoors 5.8 4.8 2.9Lids 0.1 0.1 0.0
Charging 0.5 0.4 0.2Offtakes 0.1 0.1 0.1
TOTALS 830.5 274.9 92.1 157.2 85.9 1002.1
Future Allowable Emissions for C BATTERY
3-1 January 2007 D:\final permit application 12-31-07\Permit Application
Technical Support Document Dec 31.doc
3.0 Applicable Regulations
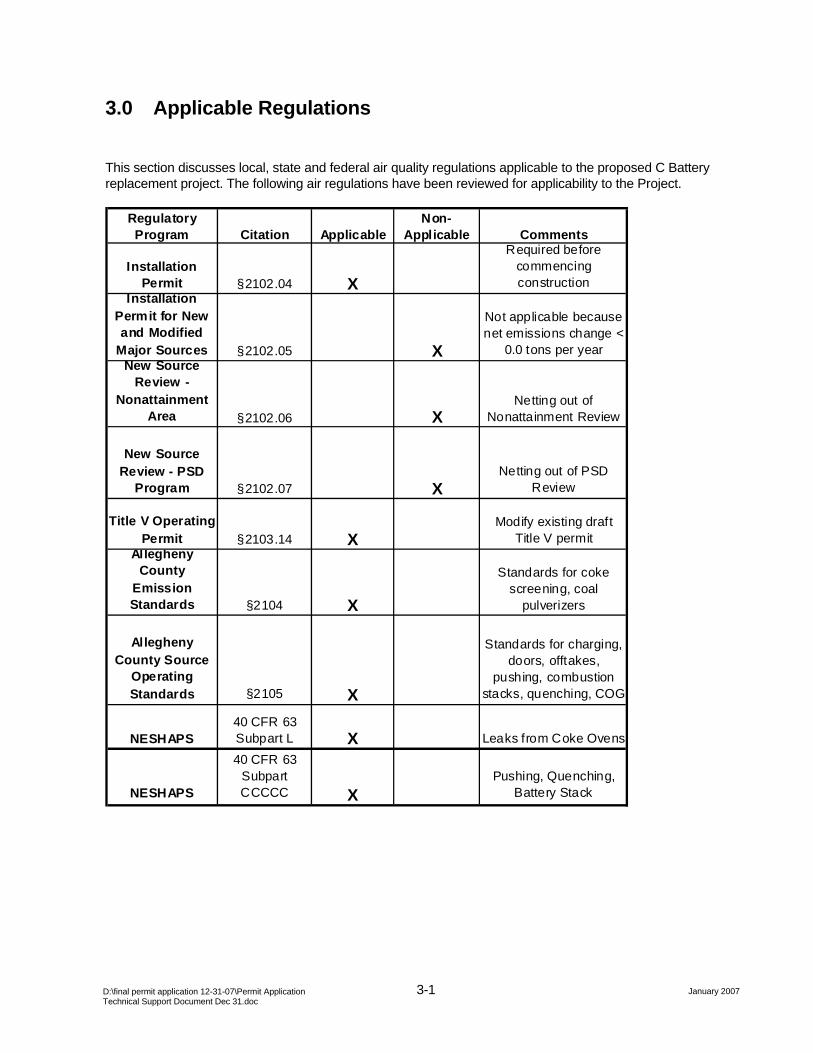
This section discusses local, state and federal air quality regulations applicable to the proposed C Battery replacement project. The following air regulations have been reviewed for applicability to the Project.
Regulatory Program Citation Applicable
Non-Applicable Comments
Installation Permit §2102.04 X
Required before commencing construction
Installation Permit for New and Modified
Major Sources §2102.05 X
Not applicable because net emissions change <
0.0 tons per yearNew Source
Review - Nonattainment
Area §2102.06 XNetting out of
Nonattainment Review
New Source Review - PSD
Program §2102.07 XNetting out of PSD
Review
Title V Operating Permit §2103.14 X
Modify existing draft Title V permit
Allegheny County
Emission Standards §2104 X
Standards for coke screening, coal
pulverizers
Allegheny County Source
Operating Standards §2105 X
Standards for charging, doors, offtakes,
pushing, combustion stacks, quenching, COG
NESHAPS40 CFR 63 Subpart L X Leaks from Coke Ovens
NESHAPS
40 CFR 63 Subpart CCCCC X
Pushing, Quenching, Battery Stack

3-2 January 2007 D:\final permit application 12-31-07\Permit Application
Technical Support Document Dec 31.doc
3.1 Allegheny County Health Department Rules and Regulations, Article XXI Air Pollution Control
This Installation Permit Application document has been prepared in order to address all Article XXI requirements.
§2102.04 Installation Permits
This Section requires United States Steel to obtain an Installation Permit (Permit) to install the proposed C Battery project. This section also describes the standards for issuance of the Permit and what must be included in the application. These include:
• Identification of other Permits issued by the Department (see Appendix G) • Nature and amount of emissions from the sources affected • Location, design, construction and operation of the sources affected and from associated mobile
sources; • Compliance with NAAQS in attainment areas and no interference with achievement of reasonable
further progress in non attainment areas (modeling to be submitted separately) • Compliance with all applicable emissions limits established by this Article • Application of Best Available Control Technology (BACT) for new sources; • Compliance with applicable NSPS, MACT and NESHAPS standards; • Compliance with all applicable requirements of the Air Pollution Control Act by all existing air pollution
sources within the Commonwealth which are required to have operating permits; • A plan to prevent fugitive dust from becoming airborne during construction (See Appendix F)
§2102.05 Installation Permits for New and Modified Major Source
This Section would apply to the Project if the Project increases the amount of any air contaminant emitted by the source or if the Project will results in the emission of any air contaminant not previously emitted.
Requirements of this Section include:
• Interstate notification • Public hearing and notice
§2102.06 Major Sources Locating in or Impacting a Nonattainment Area
This section applies to any major new sources and to any major modification of an existing source which is located in a nonattainment area or transport region of the County or which will have a significant impact on any nonattainment area or transport region.
The Clairton Works is located in a PM2.5 nonattainment area and within the Northeast Ozone Transport Region (NOTR). However, this Section of the regulations does not apply to the Project because the Project will not be a major modification, that is, it will produce emission increases that are less than the emission rate thresholds specified in 25 Pa. Code §127.203 for PM10 (used as a surrogate for PM2.5)1 and less than the proposed emission rate thresholds for direct PM2.5 emissions and significance levels for PM2.5 precursors SO2 and NOx (Fed. Reg. V. 70, No. 210, Nov. 1, 2005, p. 66034). The Project will also produce less than significant
1 While EPA finalized certain provisions of the PM2.5 implemented rule on April 5, 2007, EPA has not finalized the PM2.5 implemented rule for NSR.
3-3 January 2007 D:\final permit application 12-31-07\Permit Application
Technical Support Document Dec 31.doc
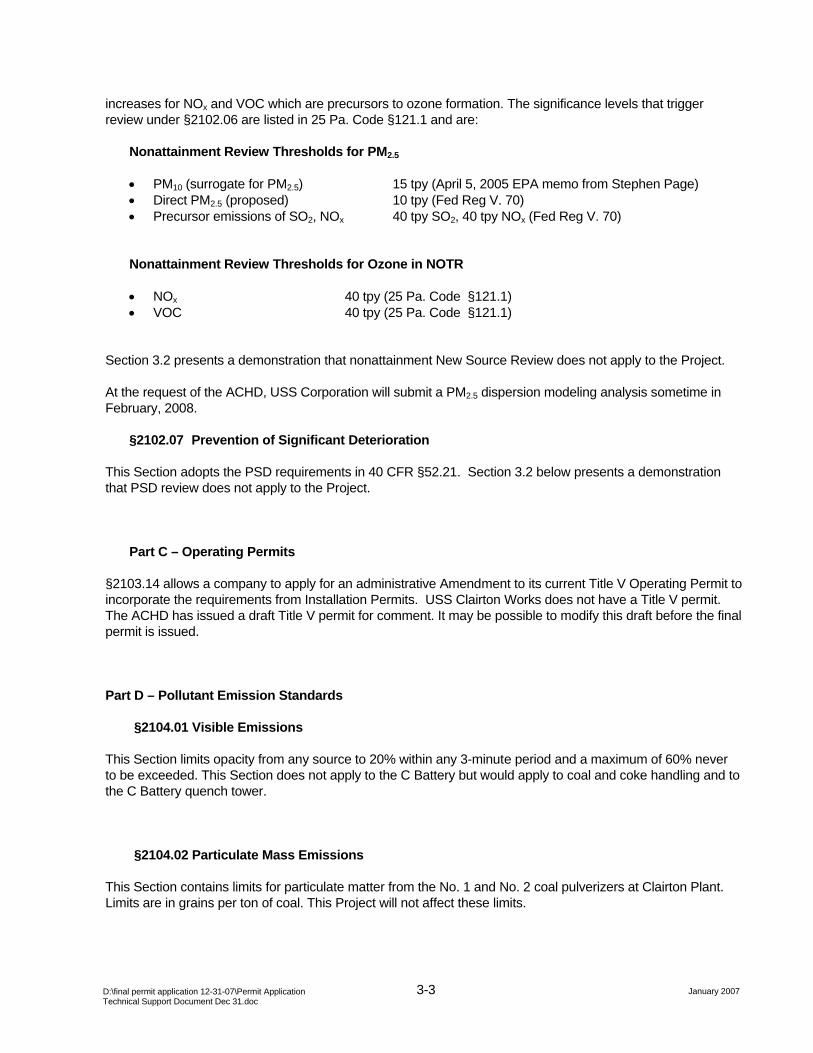
increases for NOx and VOC which are precursors to ozone formation. The significance levels that trigger review under §2102.06 are listed in 25 Pa. Code §121.1 and are:
Nonattainment Review Thresholds for PM2.5
• PM10 (surrogate for PM2.5) 15 tpy (April 5, 2005 EPA memo from Stephen Page) • Direct PM2.5 (proposed) 10 tpy (Fed Reg V. 70) • Precursor emissions of SO2, NOx 40 tpy SO2, 40 tpy NOx (Fed Reg V. 70)
Nonattainment Review Thresholds for Ozone in NOTR
• NOx 40 tpy (25 Pa. Code §121.1) • VOC 40 tpy (25 Pa. Code §121.1)
Section 3.2 presents a demonstration that nonattainment New Source Review does not apply to the Project.
At the request of the ACHD, USS Corporation will submit a PM2.5 dispersion modeling analysis sometime in February, 2008.
§2102.07 Prevention of Significant Deterioration
This Section adopts the PSD requirements in 40 CFR §52.21. Section 3.2 below presents a demonstration that PSD review does not apply to the Project.
Part C – Operating Permits
§2103.14 allows a company to apply for an administrative Amendment to its current Title V Operating Permit to incorporate the requirements from Installation Permits. USS Clairton Works does not have a Title V permit. The ACHD has issued a draft Title V permit for comment. It may be possible to modify this draft before the final permit is issued.
Part D – Pollutant Emission Standards
§2104.01 Visible Emissions
This Section limits opacity from any source to 20% within any 3-minute period and a maximum of 60% never to be exceeded. This Section does not apply to the C Battery but would apply to coal and coke handling and to the C Battery quench tower.
§2104.02 Particulate Mass Emissions
This Section contains limits for particulate matter from the No. 1 and No. 2 coal pulverizers at Clairton Plant. Limits are in grains per ton of coal. This Project will not affect these limits.

3-4 January 2007 D:\final permit application 12-31-07\Permit Application
Technical Support Document Dec 31.doc
This Section also requires an emission control device on No. 3 Coke Screening Station and limits particulate to 2.8 grains/ton of coke at any time. Coke produce by C Battery will use No. 3 Screening Station. This emission limit is in error and is being revised by ACHD to 0.0065 gr/dscf.
§2104.04 Odor Emissions
This Section prohibits off property odors.
§2104.05 Materials Handling
This Section prohibits visible off property emissions generated by material handling.
§2104.07 Stack Heights
This Section incorporates the Federal stack height regulations and prohibits taking dispersion credit for stacks taller than Good Engineering Practice height.
§2104.08 National Emission Standards for Hazardous Air Pollutants
This Section incorporates the Federal regulations. See Section 3.2 above for specific NESHAP applicability to the C Battery Project.
§2105.21 Coke Ovens and Coke Oven Gas.
This Section regulates existing coke oven operations at the Clairton Plant, including visible emissions from charging, visible emissions from doors, charging ports and offtake piping. Pushing operations must have a control device that meets Best Available Control Technology (BACT). Mass emission limits and opacity limits are established for the control device. Particulate emission limits are set for the Battery combustion stacks. Quenching must use clean water and the coke quenching emissions must be vented through a baffled quench tower. Unburned coke oven gas must not be vented into the open air unless the hydrogen sulfide content of the gas meets a specified limit. Testing requirements are listed.
Enforcement Orders and Consent Decrees and Agreements
Section 202.E. Order Requiring Monthly Reports to Determine Compliance with Sections 520 and 530 of Article XX at USS Clairton Works, March 28, 1990.
Requires reporting to the ACHD of monthly coke plant operation.
3-5 January 2007 D:\final permit application 12-31-07\Permit Application
Technical Support Document Dec 31.doc
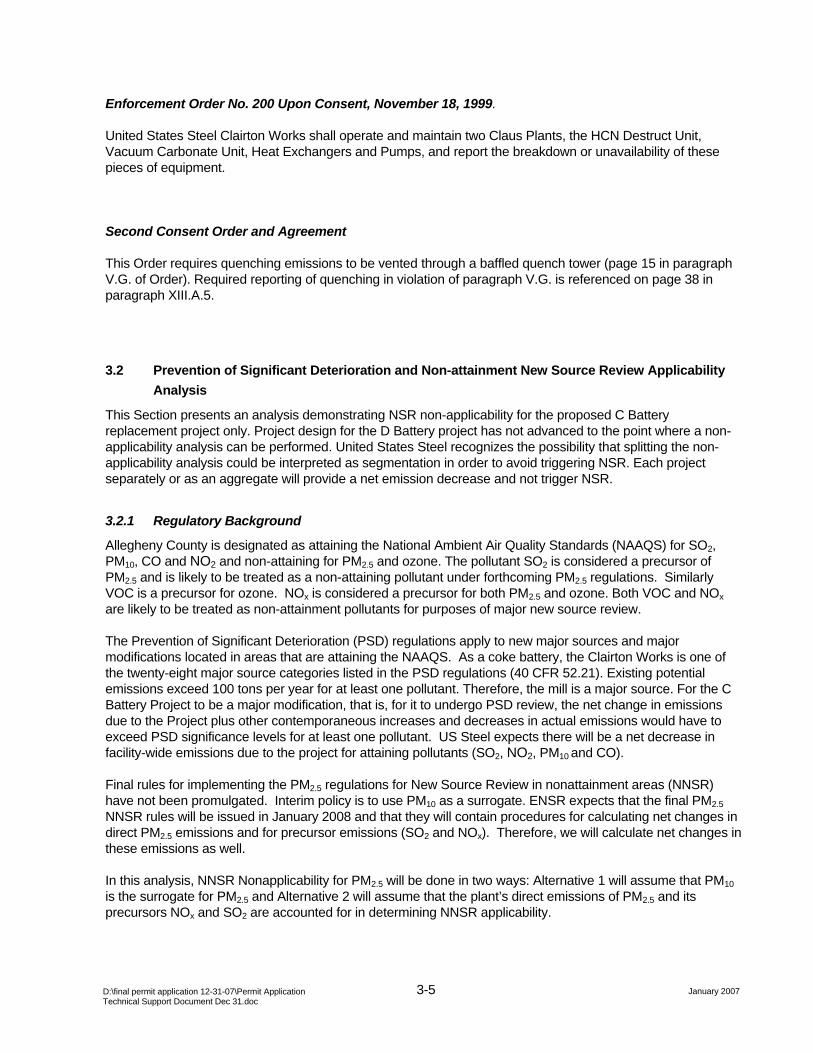
Enforcement Order No. 200 Upon Consent, November 18, 1999.
United States Steel Clairton Works shall operate and maintain two Claus Plants, the HCN Destruct Unit, Vacuum Carbonate Unit, Heat Exchangers and Pumps, and report the breakdown or unavailability of these pieces of equipment.
Second Consent Order and Agreement
This Order requires quenching emissions to be vented through a baffled quench tower (page 15 in paragraph V.G. of Order). Required reporting of quenching in violation of paragraph V.G. is referenced on page 38 in paragraph XIII.A.5.
3.2 Prevention of Significant Deterioration and Non-attainment New Source Review Applicability Analysis
This Section presents an analysis demonstrating NSR non-applicability for the proposed C Battery replacement project only. Project design for the D Battery project has not advanced to the point where a non-applicability analysis can be performed. United States Steel recognizes the possibility that splitting the non-applicability analysis could be interpreted as segmentation in order to avoid triggering NSR. Each project separately or as an aggregate will provide a net emission decrease and not trigger NSR.
3.2.1 Regulatory Background
Allegheny County is designated as attaining the National Ambient Air Quality Standards (NAAQS) for SO2, PM10, CO and NO2 and non-attaining for PM2.5 and ozone. The pollutant SO2 is considered a precursor of PM2.5 and is likely to be treated as a non-attaining pollutant under forthcoming PM2.5 regulations. Similarly VOC is a precursor for ozone. NOx is considered a precursor for both PM2.5 and ozone. Both VOC and NOx are likely to be treated as non-attainment pollutants for purposes of major new source review.
The Prevention of Significant Deterioration (PSD) regulations apply to new major sources and major modifications located in areas that are attaining the NAAQS. As a coke battery, the Clairton Works is one of the twenty-eight major source categories listed in the PSD regulations (40 CFR 52.21). Existing potential emissions exceed 100 tons per year for at least one pollutant. Therefore, the mill is a major source. For the C Battery Project to be a major modification, that is, for it to undergo PSD review, the net change in emissions due to the Project plus other contemporaneous increases and decreases in actual emissions would have to exceed PSD significance levels for at least one pollutant. US Steel expects there will be a net decrease in facility-wide emissions due to the project for attaining pollutants (SO2, NO2, PM10 and CO).
Final rules for implementing the PM2.5 regulations for New Source Review in nonattainment areas (NNSR) have not been promulgated. Interim policy is to use PM10 as a surrogate. ENSR expects that the final PM2.5 NNSR rules will be issued in January 2008 and that they will contain procedures for calculating net changes in direct PM2.5 emissions and for precursor emissions (SO2 and NOx). Therefore, we will calculate net changes in these emissions as well.
In this analysis, NNSR Nonapplicability for PM2.5 will be done in two ways: Alternative 1 will assume that PM10 is the surrogate for PM2.5 and Alternative 2 will assume that the plant’s direct emissions of PM2.5 and its precursors NOx and SO2 are accounted for in determining NNSR applicability.

3-6 January 2007 D:\final permit application 12-31-07\Permit Application
Technical Support Document Dec 31.doc
3.2.2 Overview of Emissions Netting Procedures
In assessing PSD and NNSR applicability, ENSR will use the following procedures described in PADEP’s Pennsylvania Code, Subchapter E, § 127.203a.:
1. Calculate the future allowable emissions for the new units; if the future emissions from the new units exceed PSD and/or NNSR significance levels (we expect they will), then
2. Calculate baseline actual emissions for existing units affected by the C Battery Project, that is, existing units that will be shut down and units whose emissions will increase or decrease, and
3. Calculate contemporaneous emission changes associated with minor source permits;
4. Subtract 2. and 3. from 1 to determine the net emissions change resulting from the Project. If the difference is less than PSD and NNSR significance limits, the project is considered a minor modification and PSD and NNSR will not apply.
3.2.2.1 Calculating Future Allowable Emissions from New Equipment
The Project will involve a complete replacement of Batteries 1, 2, and3. The following new emission sources will be installed:
• C Coke Oven Battery:
o Coal charging
o Coking
Doors
lids,
offtakes,
decarbonization,
o soaking
o pushing (PEC Baghouse, PEC fugitives, uncontrolled pushing)
o travel to the quench tower and,
o combustion stack
• C Battery Quench Tower
• Modifications to # 3 Screening Station
Some of the future allowable emissions have been provided by Uhde Corporation, the design and construction firm on this project. However, Uhde Corporation was not able to provide guaranteed emission rates for all segments of the process. Therefore, for some segments, USS is using engineering judgment.
3-7 January 2007 D:\final permit application 12-31-07\Permit Application
Technical Support Document Dec 31.doc
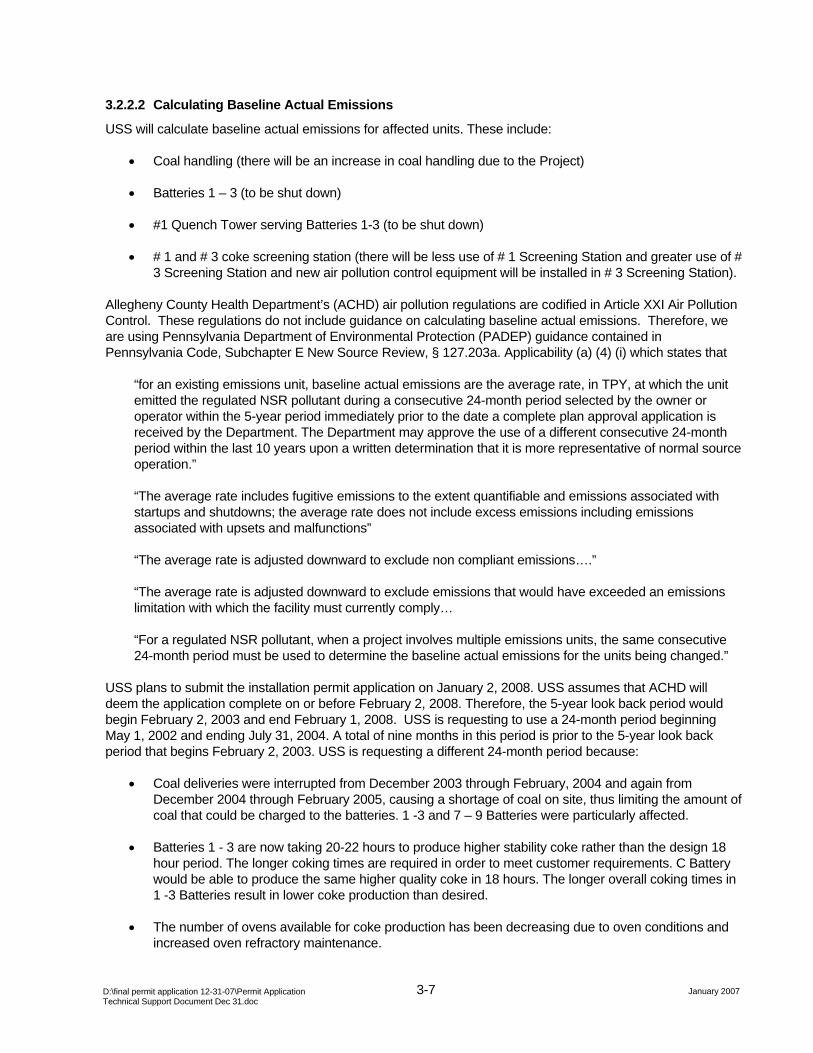
3.2.2.2 Calculating Baseline Actual Emissions
USS will calculate baseline actual emissions for affected units. These include:
• Coal handling (there will be an increase in coal handling due to the Project)
• Batteries 1 – 3 (to be shut down)
• #1 Quench Tower serving Batteries 1-3 (to be shut down)
• # 1 and # 3 coke screening station (there will be less use of # 1 Screening Station and greater use of # 3 Screening Station and new air pollution control equipment will be installed in # 3 Screening Station).
Allegheny County Health Department’s (ACHD) air pollution regulations are codified in Article XXI Air Pollution Control. These regulations do not include guidance on calculating baseline actual emissions. Therefore, we are using Pennsylvania Department of Environmental Protection (PADEP) guidance contained in Pennsylvania Code, Subchapter E New Source Review, § 127.203a. Applicability (a) (4) (i) which states that
“for an existing emissions unit, baseline actual emissions are the average rate, in TPY, at which the unit emitted the regulated NSR pollutant during a consecutive 24-month period selected by the owner or operator within the 5-year period immediately prior to the date a complete plan approval application is received by the Department. The Department may approve the use of a different consecutive 24-month period within the last 10 years upon a written determination that it is more representative of normal source operation.”
“The average rate includes fugitive emissions to the extent quantifiable and emissions associated with startups and shutdowns; the average rate does not include excess emissions including emissions associated with upsets and malfunctions”
“The average rate is adjusted downward to exclude non compliant emissions….”
“The average rate is adjusted downward to exclude emissions that would have exceeded an emissions limitation with which the facility must currently comply…
“For a regulated NSR pollutant, when a project involves multiple emissions units, the same consecutive 24-month period must be used to determine the baseline actual emissions for the units being changed.”
USS plans to submit the installation permit application on January 2, 2008. USS assumes that ACHD will deem the application complete on or before February 2, 2008. Therefore, the 5-year look back period would begin February 2, 2003 and end February 1, 2008. USS is requesting to use a 24-month period beginning May 1, 2002 and ending July 31, 2004. A total of nine months in this period is prior to the 5-year look back period that begins February 2, 2003. USS is requesting a different 24-month period because:
• Coal deliveries were interrupted from December 2003 through February, 2004 and again from December 2004 through February 2005, causing a shortage of coal on site, thus limiting the amount of coal that could be charged to the batteries. 1 -3 and 7 – 9 Batteries were particularly affected.
• Batteries 1 - 3 are now taking 20-22 hours to produce higher stability coke rather than the design 18 hour period. The longer coking times are required in order to meet customer requirements. C Battery would be able to produce the same higher quality coke in 18 hours. The longer overall coking times in 1 -3 Batteries result in lower coke production than desired.
• The number of ovens available for coke production has been decreasing due to oven conditions and increased oven refractory maintenance.

3-8 January 2007 D:\final permit application 12-31-07\Permit Application
Technical Support Document Dec 31.doc
3.2.2.3 Contemporaneous Emission Changes
Again, the ACHD regulations do not define contemporaneous emission changes. The PADEP regulations [§ 127.203a.(a)(ii)(B)(I)] define emissions changes to be contemporaneous as follows:
“An increase or decrease in actual emissions is contemporaneous with the increase from the particular change only if it occurs between the date 5 years before construction on the project commences and the date that construction on the project is completed. Construction is planned to start July 1, 2008 and end by June 1, 2011. Therefore, the contemporaneous period for this project begins June 1, 2003 and will end June 1, 2011
3.2.3 Future Allowable Emissions from New Equipment
New equipment associated with the proposed C Battery project will consist of the proposed C Battery and the C Battery quench tower. Modifications will also be made to the existing # 3 coke screening station to accommodate additional coke handling, although no change in the size of the proposed baghouse is expected. Descriptions of the new equipment and equipment modifications are presented in Section 2.2
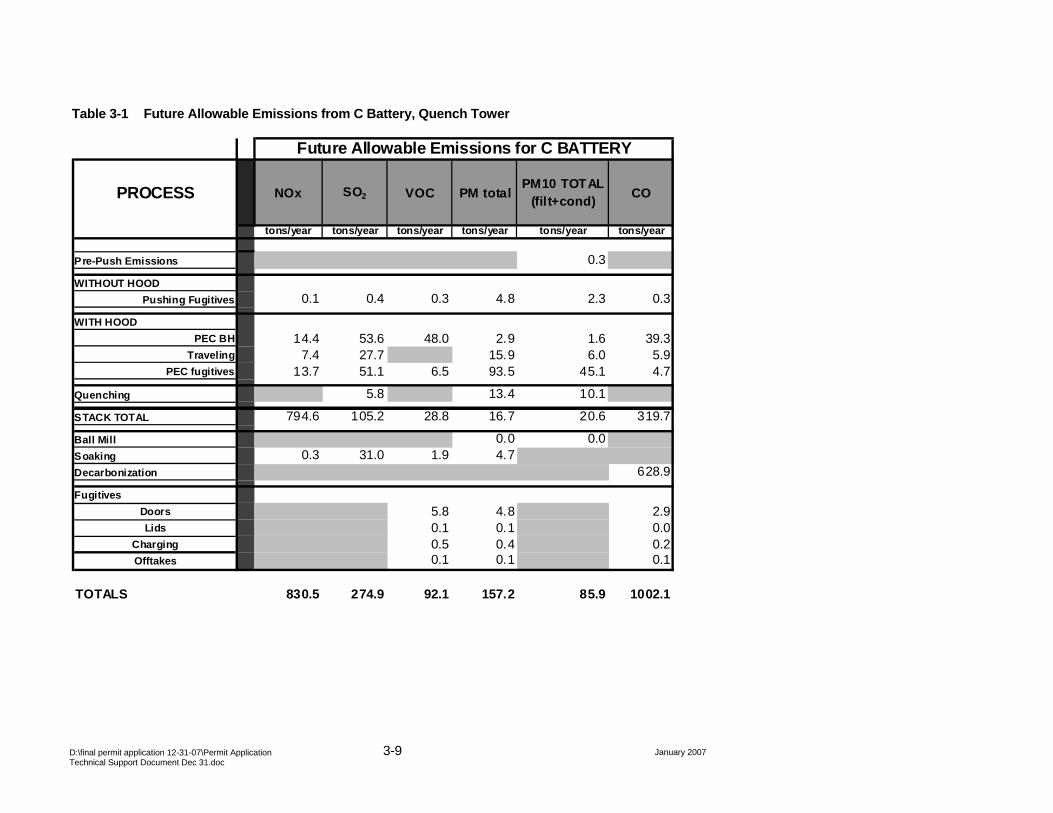
Future allowable emissions are presented in Table 3-1 for the proposed C Battery including quench tower.
3.2.4 Baseline Actual Emissions
Baseline actual emissions were calculated for the period May 1, 2002 through April 30, 2004 as mentioned in Section 1.2.2. Baseline actual emissions were calculated for the following affected processes: coal handling, Batteries 1-3, Batteries 1-3 quench tower and # 1 and # 3 coke screening stations.
Table 3-2 presents baseline actual emissions for Batteries 1 - 3 and quenching.
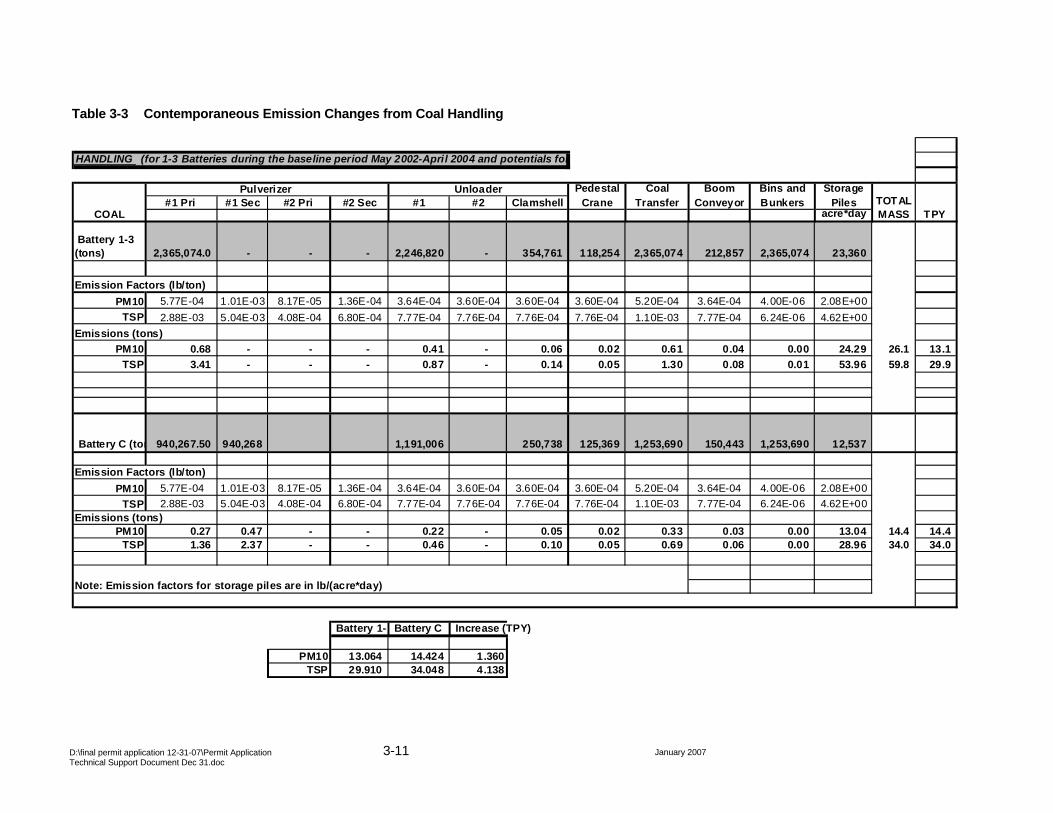
3.2.5 Contemporaneous Emission Changes
The only emission change during the contemporaneous period will be those associated with increased coal handling due to C Battery and emission changes associated with coke handling operations. Table 3-3 presents contemporaneous emission changes for coal and coke handling Coal handling at the Clairton Works associated with other processes that are not affected by the Project (e.g., coal charged in Batteries 7 – 9) are not included in Table 3-3.
Coal handling emissions will be affected by the Project because additional coal will be offloaded from the barges, pulverized, sent to a surge bin, conveyed to C Battery and charged in C Battery. Less coke will be processed in # 1 screening station because that station will not be used by C Battery. More coke will be processed in # 3 screening station because C Battery will use that station.
3-9 January 2007 D:\final permit application 12-31-07\Permit Application
Technical Support Document Dec 31.doc
Table 3-1 Future Allowable Emissions from C Battery, Quench Tower
PROCESS NOx SO2 VOC PM totalPM10 TOTAL
(filt+cond) CO
tons/year tons/year tons/year tons/year tons/year tons/year
Pre-Push Emissions 0.3
WITHOUT HOODPushing Fugitives 0.1 0.4 0.3 4.8 2.3 0.3
WITH HOODPEC BH 14.4 53.6 48.0 2.9 1.6 39.3
Traveling 7.4 27.7 15.9 6.0 5.9PEC fugitives 13.7 51.1 6.5 93.5 45.1 4.7
Quenching 5.8 13.4 10.1
STACK TOTAL 794.6 105.2 28.8 16.7 20.6 319.7
Ball Mill 0.0 0.0Soaking 0.3 31.0 1.9 4.7Decarbonization 628.9
FugitivesDoors 5.8 4.8 2.9Lids 0.1 0.1 0.0
Charging 0.5 0.4 0.2Offtakes 0.1 0.1 0.1
TOTALS 830.5 274.9 92.1 157.2 85.9 1002.1
Future Allowable Emissions for C BATTERY

3-10 January 2007 D:\final permit application 12-31-07\Permit Application
Technical Support Document Dec 31.doc
Table 3-2 Baseline Actual Emissions from Batteries 1 - 3, Quenching
PROCESS NOx SO2 VOC PM totalPM10
TOTAL (filt+cond)
CO
tons/year tons/year tons/year tons/year tons/year tons/year
Pre-Push Emissions 5.937
WITHOUT HOODPushing Fugitives 0.1 0.7 0.6 8.1 3.9 0.5
WITH HOODPEC BH 13.0 48.4 45.1 5.4 3.0 36.9
Traveling 12.5 46.7 26.8 10.1 10.0PEC fugitives 9.7 36.3 15.8 223.3 108.0 10.3
Quenching 25.7 0.3 695.6 521.7
STACK TOTAL 892.6 118.1 32.4 38.2 36.6 398.4
Ball Mill 0.0 0.0Soaking 0.6 58.5 3.5 8.9Decarbonization 688.2
FugitivesDoors 26.0 21.3 13.0Lids 9.6 0.2 0.1
Charging 0.9 0.9 0.6Offtakes 9.6 0.6 0.3
TOTALS 928.6 334.5 143.9 1029.2 689.2 1158.3
Actual Annual Emissions for BATTERIES 1-3
3-11 January 2007 D:\final permit application 12-31-07\Permit Application
Technical Support Document Dec 31.doc
Table 3-3 Contemporaneous Emission Changes from Coal Handling
#1 Pri #1 Sec #2 Pri #2 Sec #1 #2 Clamshellacre*day
Battery 1-3 (tons) 2,365,074.0 - - - 2,246,820 - 354,761 118,254 2,365,074 212,857 2,365,074 23,360
Emission Factors (lb/ton)PM10 5.77E-04 1.01E-03 8.17E-05 1.36E-04 3.64E-04 3.60E-04 3.60E-04 3.60E-04 5.20E-04 3.64E-04 4.00E-06 2.08E+00
TSP 2.88E-03 5.04E-03 4.08E-04 6.80E-04 7.77E-04 7.76E-04 7.76E-04 7.76E-04 1.10E-03 7.77E-04 6.24E-06 4.62E+00Emissions (tons)
PM10 0.68 - - - 0.41 - 0.06 0.02 0.61 0.04 0.00 24.29 26.1 13.1 TSP 3.41 - - - 0.87 - 0.14 0.05 1.30 0.08 0.01 53.96 59.8 29.9
Battery C (ton 940,267.50 940,268 1,191,006 250,738 125,369 1,253,690 150,443 1,253,690 12,537
Emission Factors (lb/ton)PM10 5.77E-04 1.01E-03 8.17E-05 1.36E-04 3.64E-04 3.60E-04 3.60E-04 3.60E-04 5.20E-04 3.64E-04 4.00E-06 2.08E+00
TSP 2.88E-03 5.04E-03 4.08E-04 6.80E-04 7.77E-04 7.76E-04 7.76E-04 7.76E-04 1.10E-03 7.77E-04 6.24E-06 4.62E+00Emissions (tons)
PM10 0.27 0.47 - - 0.22 - 0.05 0.02 0.33 0.03 0.00 13.04 14.4 14.4 TSP 1.36 2.37 - - 0.46 - 0.10 0.05 0.69 0.06 0.00 28.96 34.0 34.0
Battery 1-3 Battery C Increase (TPY)
PM10 13.064 14.424 1.360TSP 29.910 34.048 4.138
Note: Emission factors for storage piles are in lb/(acre*day)
Pedestal Crane
Coal Transfer
Boom Conveyor
COAL
Pulverizer Unloader Storage Piles TOTAL
MASS TPY
Bins and Bunkers
HANDLING (for 1-3 Batteries during the baseline period May 2002-April 2004 and potentials for

3-12 January 2007 D:\final permit application 12-31-07\Permit Application
Technical Support Document Dec 31.doc
Table 3-4 Contemporaneous Emission Changes from Coke Handling
TOTAL TOTALTPP TPY
Acre*day
Battery 1-3 (tons) 4,092 1,779,010 1,779,010 1,779,010 17,434
Emission Factors (lb/ton)PM10 7.10E-03 7.10E-03 8.40E-04 7.00E-04 5.20E-01
TSP 1.50E-02 1.50E-02 1.76E-03 1.00E-03 1.16E+00Emissions (tons)
PM10 0.01 6.32 0.75 0.62 4.53 12.2 6.1 TSP 0.03 13.34 1.57 0.89 10.11 25.9 13.0
Battery C (tons) 2,313 1,005,528 1,005,528 1,005,528 9,854
Emission Factors (lb/ton)PM10 7.10E-03 7.10E-03 8.40E-04 7.00E-04 5.20E-01
TSP 1.50E-02 1.50E-02 1.76E-03 1.00E-03 1.16E+00Emissions (tons)
PM10 0.01 3.57 0.42 0.35 2.56 6.9 6.9 TSP 0.02 7.54 0.89 0.50 5.72 14.7 14.7
Battery 1-3 C Increase(TPY)PM10 6.12 6.91 0.80
TSP 12.97 14.66 1.69
Coke Pile Erosion
Note: Emission factors for storage piles are in lb/(acre*day)
MATERIAL HANDLING (for the baseline period May 2002-April 2004 and future for C battery)
COKE
Coke Pile (Load & unload) Coke Transfer Screen Stn.
Screening Stn. Loadout
3-13 January 2007 D:\final permit application 12-31-07\Permit Application
Technical Support Document Dec 31.doc
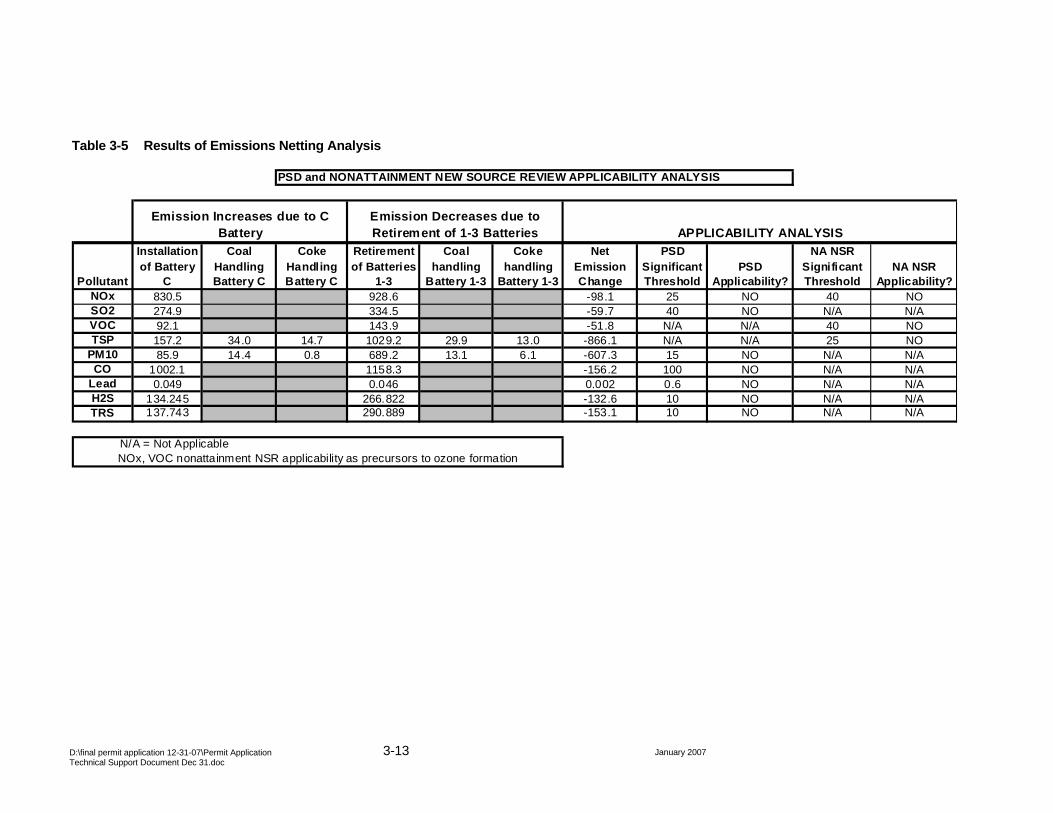
Table 3-5 Results of Emissions Netting Analysis
PSD and NONATTAINMENT NEW SOURCE REVIEW APPLICABILITY ANALYSIS
NOx 830.5 928.6 -98.1 25 NO 40 NOSO2 274.9 334.5 -59.7 40 NO N/A N/AVOC 92.1 143.9 -51.8 N/A N/A 40 NOTSP 157.2 34.0 14.7 1029.2 29.9 13.0 -866.1 N/A N/A 25 NO
PM10 85.9 14.4 0.8 689.2 13.1 6.1 -607.3 15 NO N/A N/ACO 1002.1 1158.3 -156.2 100 NO N/A N/A
Lead 0.049 0.046 0.002 0.6 NO N/A N/AH2S 134.245 266.822 -132.6 10 NO N/A N/ATRS 137.743 290.889 -153.1 10 NO N/A N/A
NA NSR Significant Threshold
Retirement of Batteries
1-3
Coal handling
Battery 1-3
N/A = Not ApplicableNOx, VOC nonattainment NSR applicability as precursors to ozone formation
PSD Applicability?
Net Emission Change
Coke Handling Battery C
Coke handling
Battery 1-3Pollutant
Emission Increases due to C Battery
Emission Decreases due to Retirement of 1-3 Batteries APPLICABILITY ANALYSIS
NA NSR Applicability?
Installation of Battery
C
Coal Handling Battery C
PSD Significant Threshold

3-14 January 2007 D:\final permit application 12-31-07\Permit Application
Technical Support Document Dec 31.doc
3.2.6 Results of Emissions Netting Analysis
Table 3-5 presents a summary of the emissions netting analysis. The table indicates that the C Battery Project will produce a net reduction in emissions of all PSD and Nonattainment New Source Review pollutants. The Project will thus net out of PSD and Nonattainment New Source review.
On a pollutant-by-pollutant basis, the largest decreases will occur for Total Particulate matter (PM = TSP) and PM10. Annual PM emissions will be reduced by 866.1 tons per year (tpy). Most of the PM reductions will be associated with better capture of PEC fugitives and more efficient PM capture in the quench tower. Associated PM10 emission reductions will be on the order of 607 tpy. CO emissions will be reduced by156.6 tpy. The CO reduction will be achieved through an approximate 10% reduction in COG burned in the underfire stack and reductions from decarbonization associated with the PROven®system.
NOx emissions will decrease by 98.1 tpy and SO2 emissions will decrease by 59.7 tpy. The NOx decreases are mostly due to lower amounts of COG burned and use of a low NOx combustion system. The SO2 decreases are due to lower COG combustion, lower travel emissions due to shorter travel distances and lower PEC fugitive emissions due to better capture with the integrated hood and lower soaking emissions due to the PROven® system.
VOC emissions will decrease by 51.8 tpy, mostly due to lower amounts of COG combusted and better control of PEC fugitives.

3-15 January 2007 D:\final permit application 12-31-07\Permit Application
Technical Support Document Dec 31.doc
This page intentionally left blank
3-16 January 2007 D:\final permit application 12-31-07\Permit Application
Technical Support Document Dec 31.doc
3.3 Federal Regulations
National Emission Standards for Hazardous Air Pollutants for Source Categories
40 CFR Part 63, Subpart L: National Emission Standards for Coke Oven Batteries
Subpart L sets standards for fugitive emissions from coke oven doors, topside port lids, offtake systems, charging and collecting mains. The standard requires the installation of a flare for each battery so that coke oven emissions are not vented to the atmosphere through by-pass bleeder stacks, except through the flare system. It also specifies work practice standards for the operation and maintenance of coke batteries.
40 CFR Part 63, Subpart CCCCC: National Emission Standards for Coke
Ovens: Pushing, Quenching, and Battery Stacks (Compliance required by
April 14, 2006)
This subpart sets emission standards and work practice standards for coke pushing, coke quenching and coke battery combustion (underfire) stacks. These standards were effective April 14, 2006.
3.4 Commonwealth of Pennsylvania Regulations
Article XXI of the Allegheny County Health Department Rules and Regulations incorporates the General Plan Approvals and Operating Permit requirements of the PA Department of Environmental Quality Board and Department of Environmental protection under the Pa. Air Pollution Control Act at 25 Pa. Code §§ 127.611 through 127.622.
3.5 Summary of Applicable Emission Limits and Work Practice Standards
The following table summarizes ACHD and Federal emission limits and work practice standards applicable to the Project.

3-17 January 2007 D:\final permit application 12-31-07\Permit Application
Technical Support Document Dec 31.doc
Federal and ACHD Article XXI Regulations
Regulatory Citation Regulated Pollutant Operation Applicable Standard/Requirement
40 CFR Part 63 - Subpart L
63.304(b)(2)(iv)
Visible Emissions Charging 12 seconds / charge log average for 5 charges/30-day rolling average
40 CFR Part 63 - Subpart L
63.304(b)(3)(i)
Visible Emissions Door Leaks 4.0% leaking doors per battery/30-day rolling average
40 CFR Part 63 - Subpart L
63.304(b)(2)(ii)
Visible Emissions Lid Leaks (charging ports)
0.4% leaking lids/30-day rolling average
40 CFR Part 63 - Subpart L
63.304(b)(2)(iii)
Visible Emissions Offtake Leaks 2.5% leaking offtakes/30-day rolling average
40 CFR Part 63 - Subpart L
63.308(a) through (d)
Visible Emissions Collector Mains Monitor Daily, Record the time & date leak is observed, time and date leak was temporarily sealed, Temporary seal within 4 hours,
Initiate permanent repair within 5 days, Complete repair within 15 days
40 CFR Part 63 - Subpart L
63.306
Visible Emissions Work Practices Implement after 2 exceedances in 6 mos.
& then for 90 days
40 CFR Part 63 - Subpart L
63.307
Visible Emissions ByPass / Bleeder Stacks
(Flare)
Install Flares/ Prohibition of venting, flare requirements

3-18 January 2007 D:\final permit application 12-31-07\Permit Application
Technical Support Document Dec 31.doc
40 CFR Part 63 - Subpart L
63.310
NA Startup, Shutdown, Malfunction
Startup, Shutdown, Malfunction: operate and maintain battery and equipment consistent with good air pollution control
practices to minimize emissions, develop and implement SSM Plan.
40 CFR Part 63 - Subpart L
63.311
NA Reporting & Recordkeeping
Perform specified reporting and recordkeeping requirements
40 CFR Part 63 – Subpart CCCCC 63.7290
Particulate Matter PEC BH 0.02 lb / ton of coke if moveable hood used (EPA Method 5 front half)
40 CFR Part 63 – Subpart CCCCC 63.7291
Opacity Ovens Perform specified observations, recording of fugitive pushing emission; corrective action if necessary
40 CFR Part 63 – Subpart CCCCC 63.7294
NA Soaking Work Practice Operate according to written work practice plan
40 CFR Part 63 – Subpart CCCCC 63.7295
Water Quality Quenching TDS <=1,100 mg/;
40 CFR Part 63 – Subpart CCCCC 63.7295
NA Quench Tower Design and Work Practice
<=5% of area open to sky; baffle washing & inspection & repair frequency
40 CFR Part 63 – Subpart CCCCC 63.7296
Opacity Battery Stacks Daily <=15% normal coking cycle; daily <=20% extended coking cycle
40 CFR Part 63 – Subpart CCCCC 63.7300
NA Work Practice Written operation & Maintenance plan; corrective action if bag leak detection system alarm triggered
40 CFR Part 63 – Subpart CCCCC 63.7320 – 63.7343
NA Compliance Procedures for initial performance testing and ongoing compliance, recordkeeping, reporting

3-19 January 2007 D:\final permit application 12-31-07\Permit Application
Technical Support Document Dec 31.doc
2105.21(g) NA Quenching Coke must be quenched through a baffled tower and water must be of the same quality as the nearest stream or from the nearest
stream
2105.21(h)(2) H2S COG Combustion H2S must be less than 10 gr/100 dcf
2108.02(b) SO2 & PM Underfire Stacks Conduct biennial testing
2105.21(a)(1) Visible Emissions Charging 55 seconds total for 5 charges
2105.21(b)(4) Visible Emissions Door Leaks 40% Visible Emissions, at any time 15 minutes after charge
2105.21(b)(1) Visible Emissions Door Leaks 5% leaking minus the two door areas of last oven charged and any oven door obstructed from view.
2105.21(c )(1) Visible Emissions Lid Leaks (charging ports)
1% leaking lids
2105.21(d)(2) Visible Emissions Offtake Leaks 4% leaking offtakes
2105.21(e) PM Pushing Install PEC to reduce emissions (use BACT)
2105.21(e)(4) Visible Emissions Pushing Pushing or PEC outlet - not to equal or exceed 20% at any time
2105.21(e)(5) Visible Emissions Pushing Coke transport - not to exceed 10% at any time
2105.21(e)(6) Visible Emissions Pushing PM-10 SIP Contingency Plan; implement 30 days after notification from ACHD
2105.21(e)(3)(E) PM Pushing - BH Stack 0.040 lbs/ton of coke
2104.05 Visible Emissions Baghouse Dust Handling
No emissions visible at or beyond the property line.
2105.21(f)(4) Visible Emissions Underfire stack 60% Visible Emissions at anytime

3-20 January 2007 D:\final permit application 12-31-07\Permit Application
Technical Support Document Dec 31.doc
2105.21(f)(3) Visible Emissions Underfire stack 20% Visible Emissions 3 mins/hr
2105.21(f)(1) Particulate Underfire stack 0.015 grains/ DSCF
2104.03(c ) SO2 Underfire stack 500 ppm (vol dry) in effluent gas
2108.03(b) NOx Underfire stack Install & operate continuous NOx emission monitor
2109.03 Visible Emissions Underfire stack Install & operate Continuous Opacity Monitor

4-1 January 2007 D:\final permit application 12-31-07\Permit Application
Technical Support Document Dec 31.doc
4.0 Best Available Control Technology Analysis
As noted in Section 3.1, among the requirements that must be met to comply with ACHD Installation Permit requirements is a demonstration that the Best Available Control Technology (BACT) will be applied to the emissions units that will be constructed or modified in conjunction with this project. The emissions-generating activities and pollutants for which BACT applies for this project are as follows:
• C Battery Coking Cycle COG Combustion .................NOx, VOCs, CO, SO2, TSP, PM10 and PM2.5
• C Battery Pushing.................NOx, VOCs, CO, SO2, TSP, PM10 and PM2.5
• C Battery Fugitives ...............NOx, VOCs, CO, SO2, TSP, PM10 and PM2.5
• C Battery Traveling ..............NOx, VOCs, CO, SO2, TSP, PM10 and PM2.5
• C Battery Quench Tower......VOC, SO2, TSP, PM10 and PM2.5
• C Battery Coke Handling......TSP, PM10 and PM2.5
It is noted here that in reference to control of PM2.5 emissions, PM10 emissions are regulated as a surrogate.
BACT does not apply to other process operations at the Clairton Plant that may be tangentially affected by the operation of the proposed new C Battery, including coal handling, wastewater treatment, methanol storage, and, most notably, the byproducts recovery process, because there will be no physical change or change to the method of operations of those operations as a result of this project. In addition, the emergency flare system that will be associated with the C Battery was not addressed in the BACT analysis, because it will be installed and operated to comply with the Maximum Achievable Control Technology (MACT) requirements for coke oven batteries set forth in 40 CFR Part 63, Subpart L, the National Emissions Standards for Hazardous Air Pollutants for Coke Oven Batteries (see §63.307). The flare will meet the New Source Performance Standards (NSPS) for flares set forth by USEPA in 40 CFR Part 60, Subpart A (§60.18). On this basis, and considering that the flare will only be employed to prevent venting of coke oven emissions to the atmosphere during emergency situations, it should be considered to satisfy BACT requirements, and therefore no analysis was conducted for that component of the C Battery operations.
To meet the BACT demonstration requirement, on behalf of U.S. Steel, ENSR Corporation (ENSR) performed an air quality engineering analysis to determine BACT for each of the emissions units and pollutants listed above. The approach taken and the findings and conclusions of this analysis are discussed below.
4.1 BACT Assessment Approach
In accordance with USEPA and ACHD guidance, BACT was determined through a “top-down” assessment that started with the Lowest Achievable Emission Rate (LAER) and proceeded through consideration of progressively lesser levels of control. As permitted by USEPA and ACHD, the determination of BACT took into account energy, environmental, and economic impacts associated with potentially applicable control options. Separate assessments were made for each emissions unit subject to BACT, and each pollutant subject to BACT was considered separately except for particulate matter (TSP, PM10, and PM2.5) for which the feasibility, costs, and other considerations pertaining to available control options are the same and which were therefore addressed collectively.
4-2 January 2007 D:\final permit application 12-31-07\Permit Application
Technical Support Document Dec 31.doc
4.1.1 Identification of Available Control Technology Options
The first step for these assessments was to identify the emissions control technology options and associated emissions levels to be evaluated. The identification of emissions control technology options included consideration of transferable and innovative control measures that may not have previously been applied to the types of emissions units that will be operated at the project.
In order to identify emissions control technology options for the project, a search of the USEPA’s RACT/BACT/LAER Clearinghouse (RBLC) was performed. The information obtained through the RBLC search was supplemented by information obtained from USEPA Region V, the California Air Resources Board Statewide BACT Clearinghouse, and permit databases provided to the public by a number of other state agencies. Information obtained regarding recent emissions control technology determinations for the emissions units associated with the project is summarized in information presented in each relevant subsection.
The primary source of information concerning the control of emissions for coke oven batteries was the USEPA’s “Background Information for Proposed Standards” for the development of the NESHAPs for Coke Ovens: Pushing, Quenching, and Battery Stacks (referred to here as USEPA’s BID). Additional information was obtained from a 1983 study conducted by GCA Corporation on behalf of USEPA. This information is summarized in Appendix E.
4.1.2 Ranking of Technically Feasible Control Options
The second step for these assessments was to compile, based on the findings of the research effort described above, a list of emissions control technology options for each of the emissions units associated with the project. For each option that was identified, an engineering analysis was then conducted to determine the technical feasibility of its application to the specific emissions units associated with the project. Those options that were found to be infeasible for this application were eliminated.
After elimination of technically infeasible control technologies, the remaining options were ranked in order of the level of control that could be achieved by applying them to the specific emissions units associated with the project, establishing the top-down order for the subsequent analyses. The level of control estimates for the options that were identified were based primarily on the information found in the USEPA’s BID, RBLC, Califormia BACT Clearinghouse, and in other literature obtained by U.S. Steel and ENSR in the research effort described above. In establishing the ranking, the minimum requirement for a BACT or LAER determination is that it meets applicable and relevant federal, state, and local emissions standards. In particular, review is made of applicable control requirements and emissions limits under the NSPS, NESHAPs, and state and local Reasonably Available Control Technology (RACT) or other emission standards. In establishing the control ranking, all such requirements were identified for the emissions units associated with the project. It is also noted here that the establishment of a ranking for this assessment took into account the following factors identified in USEPA’s BID as those which “most affect[ing] emissions and control costs for pushing, quenching, and battery stacks”:
• Overall battery condition
• Non-recovery versus byproduct recovery process
• Foundry versus furnace coke
• Short (less than 5 meters) versus tall (5 meters or more) oven height.
It is evident that the differences between non-recovery and byproduct recovery battery designs will translate to significant differences between the technical feasibility, costs, and other impacts applicable to a given
4-3 January 2007 D:\final permit application 12-31-07\Permit Application
Technical Support Document Dec 31.doc
emissions control technology option, and therefore controls that were found to be applied only to non-recovery batteries were not generally considered transferable to the proposed C Battery. As discussed in detail in Section 4.4, however, consideration was given to employing a non-recovery design as an emissions reduction alternative for battery fugitives. The differences between the proposed C Battery, which will employ tall ovens to produce furnace coke only, and batteries that produce foundry coke and batteries that employ short ovens, were also considered important in the evaluation of the transfer of technologies. For example, production of foundry coke generally involves a significantly longer coking cycle than is employed to produce furnace coke, and therefore the costs and cost-effectiveness of a control technique applied only to foundry coke batteries will be appreciably different from the economics of that type of control to the proposed C Battery.
Once the top-down order for the assessments was established, the options were assessed following that ranking. In cases where either there was only one feasible option or U.S. Steel determined that the most stringent level of control (i.e., LAER) was acceptable, no further analysis was required. In other cases, when associated environmental, economic, and/or economic impacts precludes the use of the LAER option, the top-down order for the analysis was followed until a technology without unacceptable associated impacts was identified.
4.1.3 Environmental Impact Analysis
Except as indicated below, an environmental impact analysis was performed for each technically feasible control technology option. The primary focus of the environmental impact analysis was the assessment of the reduction in ambient concentrations of the air contaminant being controlled. To account for this, the increases or decreases in emissions of other criteria or non-criteria air contaminants that may occur with some of the control technologies were estimated. In addition, estimates were made of non-air impacts, such as solid waste disposal and increased water consumption or treatment and solid waste by-products.
In cases where either there was only one feasible option or U.S. Steel determined that the most stringent level of control was acceptable, no environmental analysis was performed.
4.1.4 Energy Impact Analysis
Except as indicated below, an energy impact analysis was performed for each technically feasible emissions control technology option. For this assessment, energy impact was defined as the amount of energy that would be consumed by the option itself, i.e., energy consumption by equipment or operating activities that would only be consumed to support the operation of the control technology. The impact of a control option on the energy efficiency of the emissions units could also be considered an energy impact, but this type of quantity was not estimated in this assessment.
In cases where either there was only one feasible option or U.S. Steel determined that the most stringent level of control was acceptable, no energy analysis was performed.
4.1.5 Economic Impact Analysis
Except as indicated below, an economic impact analysis was performed for each technically feasible emissions control technology option. Economic impact is defined in terms of overall cost-effectiveness, i.e., the ratio of the potential dollar cost of the option to the number of tons of emissions reduction it will potentially achieve. The cost of option includes both the capital cost of equipment and annual operating costs. The total annualized cost of control is determined by amortizing the total capital cost based on the following parameters:
• 10 year economic life
• 8% interest rate

4-4 January 2007 D:\final permit application 12-31-07\Permit Application
Technical Support Document Dec 31.doc
These are values that ENSR has typically employed in estimating economic impact for BACT determinations.
In cases where either there was only one feasible option or U.S. Steel determined that the most stringent level of control was acceptable, no economic analysis was performed.
4.2 BACT for C Battery Coking Cycle COG Combustion
As discussed in Section 2.2.3, during the coking cycle, emissions that are generated include emissions from charging, soaking and decarbonization, fugitive COG that leaks from coke oven doors, lids, and offtakes, and products of the combustion of COG within the heating flues. The BACT assessment for the C Battery fugitives that occur during the coking cycle is discussed in Section 4.4. This section addresses BACT for the coking cycle COG combustion emissions.
As indicated in Table 2-1, COG combustion during the coking cycle is the largest source of emissions associated with coke oven battery operation. A diagram of the proposed combustion system is shown below in Figure 4-1:
Figure 4-1 Coking Cycle COG Combustion System
Source: Uhde Corporation of America, a company of ThyssenKrupp USA, Inc.
The proposed approach for the minimization of these emissions includes:
• Emissions of all pollutants will be minimized through the employment of the PROven® system, combined with effective operating and maintenance procedures that will comply with applicable NESHAPs requirements. The PROven® system will be especially effective in minimizing oven-to-flue leakage, thus reducing emissions of VOCs, CO, TSP, SO2, PM10, and PM2.5.

4-5 January 2007 D:\final permit application 12-31-07\Permit Application
Technical Support Document Dec 31.doc
• NOx emissions will be minimized through the employment of a staged combustion system. Similar to an overfire air (OFA) system employed for NOx emissions minimization in large-sized boilers, in the system to be employed for the C Battery, excess oxygen in the combustion zone will be minimized by feeding part of the combustion air to the bottom of the heating flues, resulting in a first stage of combustion in a fuel-rich environment. Combustion will be completed by adding additional combustion air through a series of additional airports at different elevations along the height of the flue. This will enable proper vertical wall temperature distribution together with reduced NOx levels in the waste gas. Another key component of the combustion system design will be the regenerators, which are heat exchangers situated beneath the ovens and heating flues that will recover heat from the exhaust gas exiting the heating flues and use it to preheat the combustion air. The staged combustion system that will be employed constitutes low-NOx burner (LNB) technology. In addition, the Clairton Plant byproduct recovery system includes a unique cryogenic process that is extremely efficient in removing nitrogen-bearing organic compounds such as pyridine, and a desulfurization process that includes an “HCN Destruct” unit to remove HCN, from the COG.
• VOC and CO emissions will be minimized through the employment of the most efficient coking system combined with the most efficient COG combustion system available.
• SO2 emissions will be minimized through removal of sulfur from COG in the byproduct plant. Because the byproduct plant is designed to recover sulfur to yield a saleable product, the Clairton process is designed to achieve the highest feasible levels of sulfur removal from the COG. The byproduct plant sulfur removal process yields an average hydrogen sulfide (H2S) concentration of approximately 10 grains per 100 dry cubic feet (gr/100 dcf) in COG used as fuel for the coke oven heating flues.
• TSP, PM10 and PM2.5 emissions, which are largely attributable to the presence of sulfur compounds in the COG being burned, will also be minimized through removal of sulfur from COG in the byproduct plant.
The Clairton byproduct plant has a record of both high reliability and high efficiency.
The minimum requirements for BACT are the applicable federal, state, and ACHD emissions control requirements for COG combustion during the coking cycle, which are as follows:
• There are no NSPS applicable to coking cycle COG combustion. In fact, there are no applicable NSPS for any elements of the operation of a coke oven battery.
• The NESHAPs for Coke Ovens: Pushing, Quenching, and Battery Stacks, set forth in 40 CFR Part 63, Subpart CCCCC, specifies only limits on visible emissions for coking cycle COG combustion, in §63.7296. It is noted here that since the battery stacks are included in the affected source category definition for Subpart CCCCC, coking cycle COG combustion is not subject to any other NESHAPs, in particular the NESHAPs for Industrial, Commercial, and Institutional Boilers and Process Heaters.
• For NOx, VOCs, and CO, there are no specific emissions control requirements or emissions limits specified under ACHD Article XXI. This includes the NOx RACT regulations found in ACHD §2105.06 or the specific source emissions and operating standards for coke ovens in ACHD §2105.21. A continuous emissions monitoring system (CEMS) for NOx is required under ACHD §2108.03(b) and 25 PA Code §§139.101 – 139.111.
• For SO2, ACHD §2104.03(c) specifies a limit of 500 parts per million on a dry volumetric basis (ppmvd). ACHD §2105.21(h)(2) specifies a H2S emissions limit of 10 gr/100 dcf for coke oven batteries installed, replaced, or reconstructed, or at which a major modification is made on or after January 1, 1978. Clairton PlantOf the two cited applicable sulfur compound emissions limits, the more restrictive is the H2S emissions limit of 10 gr/100 dcf, which at actual stack temperature of approximately 440oF translates to an SO2 emissions limit of approximately 276 ppmvd.
4-6 January 2007 D:\final permit application 12-31-07\Permit Application
Technical Support Document Dec 31.doc
• For TSP, PM10 and PM2.5, ACHD §2105.21(f) specifies a limit of 0.015 grains per dry standard cubic foot (gr/dscf) for coke oven batteries installed, replaced, or reconstructed, or at which a major modification is made on or after January 1, 1978.
The proposed controls for the C Battery will comply in full with all of these applicable requirements.
As presented in Appendix E-5, the key findings made based on the information found in the USEPA’s BID, RBLC, California BACT Clearinghouse, and other literature obtained by U.S. Steel and ENSR relative to coke oven battery coking cycle COG combustion emissions control are as follows:
• No emissions control technologies are employed for to reduce COG combustion emissions for any of the 45 byproduct recovery coke oven batteries that are either currently in operation or (for Chicago Coke) are expected to operate in the future in the United States.
• C Battery will achieve an emissions level equivalent to 0.015 gr/dscf for particulate matter, and will meet a visible emissions opacity limit of 20%. This will mean that for coking cycle COG combustion emissions, the C Battery will be the best-controlled tall byproduct recovery coke oven battery in the United States.
• For the 11 tall byproduct recovery coke oven batteries that were identified, the most stringent limits found are 0.012 gr/dscf for particulate matter minus sulfates and 20% opacity for visible emissions; these limits are specified for one of the other batteries. B Battery at the Clairton Plant is one of only two tall byproduct recovery batteries to be required to meet the next-most stringent particulate matter emissions limit of 0.015 gr/dscf, and unlike the other such tall byproduct recovery battery, B Battery is also subject to the most stringent opacity limit of 20%. Eight tall byproduct recovery batteries are subject to either a less stringent limit or no limit at all for particulate matter. Notably this includes the most recently permitted tall byproduct battery, at Chicago Coke, which has been permitted but has not yet built (and thus has not demonstrated compliance with its limits). Under §63.7296(a), all batteries in the United States are now required to meet a daily average opacity limit of 15%.
• For the 34 short byproduct recovery batteries, the most stringent limits found are 0.015 gr/dscf for particulate matter and 20% opacity for visible emissions. Batteries, 13, 14, 15, and 20 at the Clairton Plant meet this limit; there is only one other short byproduct recovery battery that does as well. All of those Clairton batteries meet the most stringent opacity limit of 20%. 29 short byproduct recovery batteries are subject to either a less stringent limit or no limit at all for particulate matter.
• No information was found that indicated that limits are imposed on any tall or short byproduct recovery battery for coking cycle COG combustion emissions of pollutants other than particulate matter and visible emissions. Limits such as the one identified above under ACHD §2105.21(h)(2) are specified, however on the sulfur content of COG burned in many, though not all, of the byproduct recovery batteries.
The following findings were made regarding the transfer of emissions control technologies used for other coke oven batteries or other types of emissions units to control the pollutants emitted by COG combustion during the coking cycle:
• For many types of combustion units, fuel switching can be employed to reduce emissions of all pollutants. This is not an option in this case, however, because in comparison to clean COG there are no other fuel types that can be burned in a coke oven battery combustion system that will yield lower emissions. This includes natural gas, which compares unfavorably to clean COG in terms of emissions generation; natural gas combustion generates more NOx and other emissions than COG combustion because while clean COG typically contains 50% to 65% hydrogen and 25% to 30% methane, natural gas typically contains 80% to 95% methane.

4-7 January 2007 D:\final permit application 12-31-07\Permit Application
Technical Support Document Dec 31.doc
• For NOx, the only transferable technologies that can be considered beyond the proposed staged combustion LNB technology are post-combustion controls. As discussed by MACTEC Engineering and Consulting, Inc. in the July 2006 “Re-Evaluation of Reasonably Available Control Technology,” flue gas recirculation (FGR) is not technically feasible for a coke oven battery combustion system. FGR cannot be employed due to the large volume of gas associated with the underfire system design coupled with the fuel heat input values that are required. No other combustion modification type technologies that are employed for other types of combustion units are applicable to a coke oven battery combustion system. This includes catalytic combustion systems such as XONONTM. The only NOx emissions reduction approach that is conceivable for this application, therefore, is a post-combustion technology. The only such technologies that have been demonstrated in commercial operation for an application similar to the C Battery combustion system are selective catalytic reduction (SCR) and selective non-catalytic reduction (SNCR). Other post-combustion NOx emissions control technologies that are reportedly under development for other types of combustion units, such as SCONOxTM, catalytic adsorption, NOx absorbers, and ozone injection, involve system designs that are very specific to those other types of units and which therefore are not considered to be applicable in this case. Neither SCR nor SNCR is technically feasible for this application, however. SCR is reportedly being studied, and was actually applied on a demonstration level basis between 1976 and 1992 at one facility in Japan, but is not known to have progressed beyond the demonstration level of development for a coke oven application. There are a number of issues concerning the technical feasibility of SCR for this type of application. First, and most significantly, the temperature of the exhaust gas exiting the heat exchanger section of the oven heating chamber will be approximately 450oF, which at best is at the low end of the temperature range in which the SCR functions (the “SCR temperature window”). Theoretically it is possible to either bypass the regenerator section of the coke oven battery combustion system, or to construct a reheat system to bring the exhaust gas temperature back to within the SCR temperature window, to allow this technology to be employed. However, the recovery of heat from the exhaust gas is a fundamental component of the overall NOx emissions minimization design of the coke oven. An alteration of this to ensure that the exhaust gas stays in the SCR temperature window may result in an overall reduction in the efficiency of the generation of heat needed for the coking process, which in turn would result in the generation of more emissions, possibly more than would reduced by the SCR. The same issues apply to an exhaust gas reheating system. A second issue concerning the technical feasibility of applying SCR to a coke oven combustion system is that the concentration of NOx in the exhaust gas undergoes significant step changes as the underfiring system reverses. The catalyst activation energy and ammonia feed-forward system will not be capable of handling significant and instantaneous changes in NOx concentration. The result will be periods in which the SCR will not reduce NOx emissions effectively (or at all) and corresponding increases in ammonia slip emissions. Considering that the underfiring system reverses will occur approximately every twenty minutes, this is a significant issue. A third technical feasibility issue for SCR for this application is that the COG burned in the coke oven contains an appreciable amount of sulfur. Although the byproduct plant is designed to maximize the recovery of sulfur from COG produced in the ovens, the sulfur level of the COG burned in the heating flues will still be high enough to present potential problems for an SCR catalyst and lead to the generation of higher particulate emissions due to the formation of ammonium sulfate and bisulfate. In contrast to the boilers, internal combustion engines, and combustion turbines for which SCR has reached relatively widespread application, the nature of the coke oven process does not lend itself well to the types of maintenance procedures and schedules that are used for those other types of sources when SCR is used. There are other technical feasibility issues for the application of SCR to a coke oven, and adverse environmental, energy, and economic impacts for SCR would also likely be significant. For these reasons, the use of an SCR was rejected as BACT for NOx for this application. In regard to SNCR, there are no known applications, even at a demonstration level, of the application of this technology to a coke oven battery combustion system, and there is no evidence indicating that this is or has ever been studied. SNCR requires both an exhaust temperature of at least 1,500oF and enough residence time at that temperature to allow the injected ammonia to mix with the exhaust gas and allow
4-8 January 2007 D:\final permit application 12-31-07\Permit Application
Technical Support Document Dec 31.doc
the NOx reduction reactions to come to completion. As discussed above relative to the feasibility of SCR, it is theoretically possible to construct a reheat system to bring the exhaust gas temperature back to within the SNCR temperature window, and provide sufficient residence time for the NOx reduction reactions, but doing so would result in an overall reduction in thermal efficiency and would likely result in the generation of more emissions than would be reduced by the SNCR, and since the application of this technology has not been demonstrated, it is quite possible that there are other technical feasibility issues that render this technology unworkable for this application. For these reasons, an SNCR is not technically feasible and therefore was rejected as BACT for NOx for or this application.
• For VOCs and CO, the only transferable technology that can be considered beyond the proposed combustion design is an oxidation catalyst. This is not technically feasible for this application, however. As with SCR, this technology is not commercially available for a coke oven application; unlike with SCR, it is unknown whether the feasibility of oxidation catalysts for a coke oven application is even being studied. It is in fact unlikely that this technology will be studied for this type of application because, as discussed by MACTEC Engineering and Consulting, Inc. in the July 2006 “Re-Evaluation of Reasonably Available Control Technology,” the concentration of VOCs and CO in the combustion exhaust stream (estimated by MACTEC on the order of 30 parts per billion, by volume, for VOCs) will likely be three orders of magnitude lower than the minimum level for which an oxidation catalyst is feasible. In addition, the same concerns discussed above for the application of SCR to a coke oven, including catalyst poisoning and resultant maintenance and scheduling issues, and temperature window limitations, would apply as well for an oxidation catalyst. For these reasons, the use of an oxidation catalyst was rejected as BACT for VOCs and CO for this application.
• For SO2, the only transferable technology that can be considered beyond the proposed system design would be a scrubber, installed in the duct system just upstream from the combustion stack. Although they do not mention, much less identify, any specific examples of the use of a scrubber for control of coking cycle COG combustion emissions, on page 12.2-9 of USEPA’s draft update to the AP-42 section on coke production, they state that “conventional gas cleaning equipment, including ESPs and fabric filters, have been installed on some battery combustion stacks.” However, according to page 3-17 of USEPA’s BID, “[A]lthough some coke oven batteries had add-on devices (such as baghouses and electrostatic precipitators) on their stacks in the late 1970’s to 1980’s, they are no longer in use today” (see EPA-453/R-01-006, p. 3-17) The Clairton Plant was one of the few mills at which a coke oven battery employing an ESP to control combustion stack emissions was located. The experience with this device, installed on 21 Battery, is likely indicative of the other batteries where this was tried. The 21 Battery combustion stack ESP was removed from service many years ago due to high maintenance and energy requirements and costs - the downtime for that unit was approximately 50% (after operating for some time after the removal of the ESP, 21 Battery was itself also removed from service). Additionally it is noted here that in a February 7, 2006 report prepared for USEPA by RTI International, entitled “Evaluation of PM2.5 Emissions and Controls at Two Michigan Steel Mills and a Coke Oven Battery,” it is stated that “[N]o U.S. coke batteries use an add-on control device to control emissions from a combustion stack” (se page 15). Based on USEPA’s findings, and more notably the fact that in the establishment of the Maximum Achievable Control Technology (MACT) requirements for new batteries (which by definition must represent the most stringent level of control that is technically feasible for the subject source category), USEPA determined that neither an ESP, fabric filter, nor a scrubber should be required, the use of an SO2 scrubber was rejected as BACT for SO2 for this application.
• For indicated above, according to USEPA electrostatic precipitators (ESPs) and fabric filters were installed on some coke oven battery combustion stacks in the late 1970’s and early 1980’s but were later removed from service, likely due to the poor performance issues experienced for the ESP application to 21 Battery at the Clairton Plant. Those technologies were not required by USEPA even for new batteries to meet the MACT requirements under NESHAPs Subpart CCCCC, and therefore should not be considered to represent BACT. It is noted here as well that the 21 Battery combustion stack ESP was found to be
4-9 January 2007 D:\final permit application 12-31-07\Permit Application
Technical Support Document Dec 31.doc
relatively ineffective in controlling PM10 emissions. Accordingly, the use of an ESP, fabric filter, or scrubber was rejected as BACT for TSP, PM10 and PM2.5 for this application.
Based on the findings discussed above, the proposed control technology and associated emissions limits for C Battery coking represent the most stringent control requirements imposed for this emissions-generating activity. Accordingly, these control requirements represent both LAER and BACT for the C Battery, for NOx, VOCs, CO, SO2, TSP, PM10 and PM2.5.
4.3 BACT for C Battery Pushing
Pushing emissions will include those that are captured and controlled by the PEC BH and fugitive emissions including emissions that escape capture by the PEC. This section addresses BACT for all pushing emissions.
As indicated in Table 2-1, pushing emissions consist primarily of particulate matter, but do contain other regulated air pollutants as well.
The proposed approach for the minimization of these emissions includes:
• There are no specific controls proposed for emissions of NOx, VOCs, CO, or SO2 from pushing. These pollutants are controlled and minimized through proper heating, operating and work practices.
• TSP, PM10 and PM2.5 emissions will be minimized primarily through the PEC capture system and the PEC BH. The PEC capture system will achieve a capture efficiency of 90%, which is the maximum efficiency that technically feasible for this type of system. The control efficiency of the PEC BH will be more than 99%, equivalent to the highest efficiency level required for a coke oven battery pushing emissions control baghouse. As indicated in Section 2.2.4, one of the key attributes of the proposed C Battery system will be the Coke Transfer Machine, which will be the first of its kind to be installed in the United States, which will reduce fugitive emissions during pushing by combining the functions of the coke-side door machine, coke guide, and pushing emissions capture hood. This makes it feasible to control the coke-side emissions from the time the oven door is removed until the push is complete and the quench car begins the traveling step. In addition the Coke Transfer Machine represents an improvement in safety controls for workers versus a coke-side bench.
The minimum requirements for BACT are the applicable federal, state, and ACHD emissions control requirements for pushing are as follows:
• There are no NSPS applicable to coke oven pushing. In fact, there are no applicable NSPS for any elements of the operation of a coke oven battery.
• The NESHAPs for Coke Ovens: Pushing, Quenching, and Battery Stacks, set forth in 40 CFR Part 63, Subpart CCCCC, sets standards for pushing emissions, effective on April 14, 2006. §63.7290(a)(2) specifies a particulate matter emissions limit of 0.02 pounds per ton of coke (lb/ton coke) from a control device applied to pushing emissions from a new or existing coke oven battery that employs a moveable hood vented to a stationary control device. §63.7290(b)(3) specifies that the either the daily average fan motor amperes or the daily average volumetric flow rate at the inlet of the control device be maintained at or above the minimum level established during the initial performance test. Work practice standards are established to minimize visible emissions from pushing under §63.7291 (for byproduct coke oven batteries with vertical flues) and §63.7292 (for byproduct coke oven batteries with horizontal flues). §63.7300(b) and (c) require that written operating and maintenance plans for the coke oven as a whole and the pushing emissions capture and control system, respectively, be developed and followed to ensure the minimization of emissions. General, initial, and continuous compliance requirements (monitoring, testing, recordkeeping, and reporting procedures) are set forth in §63.7310 through §63.7351.

4-10 January 2007 D:\final permit application 12-31-07\Permit Application
Technical Support Document Dec 31.doc
• For NOx, VOCs, and CO, there are no specific emissions control requirements or emissions limits specified under ACHD Article XXI. This includes the NOx RACT regulations found in ACHD §2105.06 or the specific source emissions and operating standards for coke ovens in ACHD §2105.21.
• For SO2, ACHD §2104.03(c) specifies a limit of 500 parts per million on a dry volumetric basis (ppmvd).
• For TSP, PM10 and PM2.5, ACHD §2105.21(e) requires the installation of a pushing emissions control device. This section does not specify limits for new coke oven batteries. ACHD §2105.21(e)(1) specifies a limit of the higher of either 0.020 gr/dscf or as calculated through a formula presented in that subsection. However, ACHD §2105.21(e)(2) specifies a limit of 0.010 gr/dscf for Batteries 1 - 3, 7 - 9, and 19 at the Clairton Plant. ACHD §2105.21(e)(4) specifies limits on visible emissions for pushing and ACHD §2105.21(e)(6) specifies requirements specific to the Clairton Plant for ensuring that the PEC capture and control system is in place while pushing is done. ACHD §2105.49 specifies that “all reasonable actions to prevent fugitive emissions from becoming airborne” must be taken. The limit of 0.010 gr/dscf for particulate matter emissions is the appropriate reference point for the BACT determination.
The proposed controls for the C Battery will comply in full with all of these applicable requirements.
As presented in Appendix E-3, the key findings made based on the information found in the USEPA’s BID, RBLC, California BACT Clearinghouse, and other literature obtained by U.S. Steel and ENSR relative to pushing emissions control are as follows:
• For all of the 45 byproduct recovery coke oven batteries and also for the 12 non-recovery coke oven batteries that are either currently in operation or (for Chicago Coke and the FDS Coke Plant) are expected to operate in the future in the United States, pushing emissions are captured by either (1) a shed enclosure vented to a control device, (2) a mobile capture and control unit, or (3) a traveling capture hood attached to a fixed duct venting to a control device. For all of these batteries, either a baghouse or a wet scrubber is employed to control captured pushing emissions.
• The only emissions control technologies identified for pushing emissions for any coke oven battery are for particulate matter emissions.
• C Battery will employ a moveable hood coupled with a baghouse to achieve an emissions level equivalent to or lower than 0.02 lb/ton coke for particulate matter, and will meet an instantaneous visible emissions opacity limit of 20%. This will mean that for pushing emissions, the C Battery will also be the best-controlled coke oven battery in the United States.
• For the 11 tall byproduct recovery coke oven batteries that were identified, the most stringent limits found are 0.02 lb/ton coke for particulate matter and 20% opacity for visible emissions. This is imposed on two of the batteries, and there is one other than is subject to limits of 0.03 lb/ton coke and 20% opacity. All three of those batteries employ the same a moveable hood coupled with a baghouse emissions control system as will be employed by C Battery. B Battery at the Clairton Plant, which is the only tall byproduct recovery battery that employs a coke-side shed, is one of six tall byproduct recovery batteries to be required to meet the next-most stringent limit of 0.04 lb/ton coke, and unlike two of the other such tall byproduct recovery batteries, B Battery is also subject to the most stringent instantaneous opacity limit of 20%. It is noted here that the two tall byproduct recovery batteries that employ mobile scrubber cars are also subject to the limits of 0.04 lb/ton coke and 20% opacity; thus the available information indicates that similar control levels are achievable for any of the combinations of capture and control technologies that are employed. The Chicago Coke battery is one of the two that is subject to the 0.02 lb/ton coke limits, but as indicated previously, this unit has not yet been built and thus has not yet demonstrated compliance with its limits.
4-11 January 2007 D:\final permit application 12-31-07\Permit Application
Technical Support Document Dec 31.doc
• For the 34 short byproduct recovery batteries, only one is required to meet limits of 0.03 lb/ton coke and 20% opacity. This battery employs a moveable hood coupled with a baghouse emissions control system. Batteries, 13, 14, 15, and 20 at the Clairton Plant are among 13 short byproduct recovery batteries required to meet the next-most stringent limits of 0.04 lb/ton coke and 20% opacity. 17 short byproduct recovery batteries are subject to either a less stringent limit or no limit at all for particulate matter; five of those are subject to less stringent opacity limits; no information was found about the particulate matter limits for three of the other short byproduct recovery batteries. For the short byproduct recovery batteries, the information also indicates that similar control levels are achievable for any of the combinations of capture and control technologies that are employed.
• For the 11 non-recovery batteries, two are required to meet limits of 0.03 lb/ton coke and 20% opacity, and another four are required to meet limits of 0.04 lb/ton coke and 20% opacity. The two better-controlled batteries employ a moveable hood coupled with a baghouse emissions control system. Not surprisingly, the six non-recovery batteries that are not subject to a particulate matter emissions limit are also the six that employ coke-side sheds but no control devices.
• No information was found that indicated that limits are imposed on any coke oven batteries for pushing emissions of pollutants other than particulate matter and visible emissions.
The following findings were made regarding the transfer of emissions control technologies used for other coke oven batteries or other types of emissions units to control the pollutants emitted during pushing:
• For NOx, VOCs, and CO, there are no transferable technologies that can be considered.
• For SO2, TSP, PM10 and PM2.5, as noted on page 12.2-9 of USEPA’s draft update to the AP-42 section on coke production, and as seen in the results discussed above, there are three general approaches employed for capturing emissions from pushing operations, including (1) shed enclosures vented to a control device, (2) mobile capture and control units, and (3) traveling capture hoods attached to a fixed duct venting to a control device. All have their own advantages and disadvantages. A coke-side shed offers the advantage of capturing not only pushing emissions but all of the coke-side fugitives, notably door leaks, which are not captured by conventional PEC capture hoods. However, a shed requires a significantly larger air handling system and control device (approximately twice that of the proposed system with twice the emissions). A shed is also not capable of as high a level of capture efficiency as are either of the other two pushing emissions capture system options, and therefore a shed is both much more costly and less cost-effective overall than either of the other two options. The achievable capture efficiency for a shed is limited. A major factor that limits the achievable capture efficiency for a shed is that the shed must have at least one open end to allow the quench car to travel to and from the quench tower. In addition to lower emissions capture and much higher costs, the experience with the shed installed on the Clairton Plant B Battery indicates several other significant drawbacks for this option. The maintenance requirements associated with a shed are more extensive than with either of the other two options Second, the higher maintenance requirements for the shed result in much higher operating costs for B Battery than are experienced for the other batteries at the Clairton Plant that employ a traveling hood/fixed duct system. Third, although the B Battery baghouse is significantly larger than the control devices employed on the other batteries, it is the only device that has experienced failures in compliance demonstrations. For all of these reasons, the use of a coke-side shed to capture pushing emissions was rejected for this application. In regard to emissions capture, a mobile capture and control unit offers the advantage of being able to capture and control traveling emissions, but this advantage will be outweighed by the superior overall capture and control efficiency and cost-effectiveness of the Coke Transfer Machine that is proposed for this project." . In fact, since it will capture emissions that escape when the oven doors are opened for pushing, the Coke Transfer Machine will greatly reduce the fugitive emissions capture advantage of a
4-12 January 2007 D:\final permit application 12-31-07\Permit Application
Technical Support Document Dec 31.doc
coke-side shed. The mobile capture and control unit technology, equipped with scrubbers (referred to commonly as mobile scrubber cars), has been employed at other coke oven batteries owned and operated by U.S. Steel, and (as indicated above) at other batteries as well. According to pages 3-9 of the USEPA’s BID, “mobile scrubber cars were popular in the 1970’s but have for the most part been replaced by stationary systems.” The reasons for this, as explained on pages 3-10 and 3-11 of USEPA’s BID, included the high cost of operation and maintenance, the requirement of a heavy track to support the combined weight of the quench car and scrubber car, the creation of scrubber effluents that require treatment (in contrast to alternatives such as a baghouse where such is not created), limitation on accessibility for maintenance due to the need to mount equipment on mobile scrubber cars close together, and maintenance requirements associated with the diesel engine that is required to propel the gas cleaning car. Not included by USEPA in this regard are the emissions from and fuel costs associated with the diesel engine. The experiences at U.S. Steel with this type of technology were that they availability of the mobile scrubbing cars was below expectations, and because as a mobile system the technology required the recycling of scrubbing water, the particulate level of that water was higher than would be used for a fixed-location scrubber, which resulted in lower overall control efficiency. It is considered unlikely that a mobile capture and control unit employing a scrubber can meet the applicable ACHD emissions standards. For those reasons, neither a mobile scrubber car nor a mobile capture and control unit coupled with an ESP or baghouse was considered the best available technology for the C Battery. Finally in regard to the emissions capture system, for a fixed duct system, either a belt-sealed duct or a dampered port mechanism is employed to focus the vacuum to the moveable hood. No information was found that indicated any particular advantage of either option. However, according to page 3-4 of the USEPA’s BID, the belt-sealed duct system “has emerged as the most functional and widely accepted method of controlling pushing emissions worldwide.” Experience has also shown that the dampered hood systems are more adversely affected by distortion from the heat of the pushes (especially green pushes). That causes more spotting & sealing problems (and/or more maintenance and downtime) than with the belt-sealed systems. A belt-sealed duct mechanism will be employed in the C Battery pushing emissions control system. In regard to the control of the captured emissions, the options that can be considered are a scrubber, ESP, or second baghouse in series with the PEC BH. Although a scrubber would offer the advantage of combined SO2 and particulate matter emissions control, this option was rejected because, considering the amount of SO2 emitted during pushing, it would not be cost-effective and would have associated environmental and energy impacts that would not be merited considering the relatively small reductions it would achieve in emissions. Similarly the option of employing a second particulate matter control device in series would not be cost-effective, as the proposed PEC BH will be sized to achieve the optimal level of control for particulates. For these reasons, using a coke-side shed to capture emissions, and using a scrubber or other second control device in series with the PEC BH was rejected as BACT for SO2, TSP, PM10 and PM2.5 for this application.
Based on the findings discussed above, the proposed control technology and associated emissions limits for C Battery pushing represent the most stringent control requirements imposed for this emissions-generating activity. Accordingly, these control requirements represent both LAER and BACT for the C Battery, for NOx, VOCs, CO, SO2, TSP, PM10 and PM2.5.
4.4 BACT for C Battery Fugitives
As discussed in Section 2.2, fugitive emissions are generated during charging, soaking, decarbonization, and during the coking cycle due to leaks from coke oven doors, charging port lids, offtakes (at the connections to the ovens and at the standpipe caps), and the coke oven gas collection main. Emissions generated during soaking, traveling, and coke handling are also fugitives, but the BACT assessment for those emissions are addressed in separate sections below.

4-13 January 2007 D:\final permit application 12-31-07\Permit Application
Technical Support Document Dec 31.doc
As indicated in Table 2-1, the cited coke oven fugitive emissions consist primarily of particulate matter, but do contain other regulated air pollutants as well.
The proposed approach for the minimization of these emissions centers on the employment of the PROven® system, which represents the current state-of-the-art for minimizing coke oven fugitive emissions. Detailed information about the PROven® system is found in Appendix D. Beyond that, there are no other specific controls proposed to limit fugitive emissions of NOx, VOCs, CO, or SO2.
In addition to the PROven® system, controls that will be employed to minimize fugitive TSP, PM10 and PM2.5 emissions will include the following:
• Charging emissions will be also minimized by the set of measures described in Section 2.2.2, which includes stage charging, which ensures that the oven is not overfed and that the feed rate of the coal permits capture by the exhaust system. The mechanisms that will be used to accomplish this include equipping the larry car with screw feeders and specially designed drop sleeves. Differences are also that steam aspiration will not be required with the PROven® system (suction is provided by the negative pressure in the collector main) and C Battery will utilize a single collector main design.
• Leaks from oven doors, charging port lids, offtakes, and the gas collection main, which with the PROven® system will be lower than at other byproduct recovery coke oven batteries due to suction in the main, will be minimized through diligent operating and maintenance practices, including prompt luting of lids and offtakes, and effective cleaning of door jambs and seals after pushing. Door leaks will also be controlled by employing Flexed design flexible seals, which provide improved gas tightness relative to conventional types of metal door seals. In addition, fugitive emissions minimization will be enhanced by employing Uhde’s CONTROLPRESS battery bracing system, which enables the required pre-stressing and gas tightness of the refractory walls of the ovens under varying operating conditions, and the Flexed design flexible seals that provide gas tightness for oven doors.
The minimum requirements for BACT are the applicable federal, state, and ACHD emissions control requirements for the cited coke oven fugitive sources, which are as follows:
• There are no NSPS applicable to coke oven fugitive emissions. In fact, there are no applicable NSPS for any elements of the operation of a coke oven battery.
• The NESHAPs for Coke Ovens Batteries, set forth in 40 CFR Part 63, Subpart L, sets standards for charging, top side, and door leaks, effective on December 31, 1995. §63.302 and §63.304 specify limits on the percentage of coke oven doors, offtakes, and lids that are leaking, and §63.304 specifies limits on the amount of time visible emissions occur during charging. C Battery fits the definition of a brownfield battery, therefore the following limits apply: §63.302(d) limits For coke oven batteries qualifying for the exemption under §63.302(c), 4.0% leaking doors 0.4% leaking top side lids 2.5% leaking offtakes 12 seconds of visible emissions per charge §63.304(b)(3) limits Effective after January 1, 2010, for a tall byproduct coke oven battery, 4.0% leaking doors 0.4% leaking top side lids 2.5% leaking offtakes 12 seconds of visible emissions per charge These requirements apply to visible emissions. The NESHAPs does not, however, specify numerical limits for any regulated air pollutants.

4-14 January 2007 D:\final permit application 12-31-07\Permit Application
Technical Support Document Dec 31.doc
§63.306 specifies that a written work practice plan be developed and followed to ensure the minimization of emissions. The regulation also specifies requirements for flaring bypass streams, for maintaining collection mains to ensure that leaks from those are minimized, and general, initial, and continuous compliance requirements (monitoring, testing, recordkeeping, and reporting procedures).
• The NESHAPs for Coke Ovens: Pushing, Quenching, and Battery Stacks, set forth in 40 CFR Part 63, Subpart CCCCC, sets standards for soaking emissions, effective on April 14, 2006. §63.7294 specifies work practice standards which require that a written plan be developed, and personnel trained to follow, a set of procedures to ensure the minimization of emissions, including certain specific procedures spelled out in this section. General, initial, and continuous compliance requirements (monitoring, testing, recordkeeping, and reporting procedures) are set forth in §63.7310 through §63.7351.
• For NOx, VOCs, CO, TSP, PM10 and PM2.5, there are no specific emissions control requirements or emissions limits specified under ACHD Article XXI. This includes the NOx RACT regulations found in §2105.06 or the specific source emissions and operating standards for coke ovens in ACHD §2105.21.
• For SO2, ACHD §2104.03(c) specifies a limit of 500 parts per million on a dry volumetric basis (ppmvd).
• While no ACHD standards are set for fugitive emissions of TSP, PM10 and PM2.5, ACHD §2105.21(a) through (d) specifies limits for visible emissions from charging, door leaks, charging ports (top side lids), and offtakes, respectively. The specific requirements that apply to a new byproduct coke oven battery are as follows: ACHD §2105.21(a) limits 5% leaking doors, excluding the two door areas of the last oven charged and any doors that are obstructed from view; the opacity of the visible emissions from door leaks may not exceed 40% at any time starting 15 minutes after charging has taken place 1% leaking top side lids 4% leaking offtakes 55 seconds of visible emissions per any consecutive 5 charges ACHD §2105.21(b)(5) also specifies that any doors on specified batteries at the Clairton Plant that are replaced after January 1, 2000, must be replaced with big plug doors meeting specified dimension requirements. ACHD §2105.49 specifies that “all reasonable actions to prevent fugitive emissions from becoming airborne” must be taken.
The proposed controls for the C Battery will comply in full with all of these applicable requirements.
As presented in Appendix E-2, relatively little information concerning the controls applied to coke oven battery fugitive emissions were found in the USEPA’s BID, RBLC, California BACT Clearinghouse, and other literature obtained by U.S. Steel and ENSR. The most notable findings were as follows:
• For the 45 byproduct recovery coke oven batteries, the only fugitive emissions addressed are visible emissions.
• The only emissions control measures identified for fugitive emissions for any byproduct recovery coke oven battery are work practice requirements.
• To minimize charging fugitive emissions, many of the byproduct recovery coke ovens employ stage charging, a screw feed discharge mechanism, and automatic lid lifting. Several of the batteries are subject to limits on visible emissions for each charge and for consecutive charges.
4-15 January 2007 D:\final permit application 12-31-07\Permit Application
Technical Support Document Dec 31.doc
• For leaks from doors, topside port lids, and offtakes, the most common emissions limit approach is to set a limit on the percentage of overall doors and lids that are generating visible emissions at a given point in time.
The following findings were made regarding the transfer of emissions control technologies used for other coke oven batteries or other types of emissions units to control the fugitive emissions:
• For byproduct recovery coking operations such as the proposed C Battery and the other coke oven batteries at the Clairton Plant, control of fugitive emissions by preventing them from occurring has been a focal point of the air quality engineering for more than three decades. The advent of the PROven® system, which was developed specifically to address by-product coke oven battery fugitive emissions, is a significant advancement in this regard. In regard to the capture and control of fugitive emissions, as discussed by MACTEC Engineering and Consulting, Inc. in the July 2006 “Re-Evaluation of Reasonably Available Control Technology,” this is not considered a feasible approach based on the substantial volume of air that would have to be collected to adequately capture the emissions, which in turn would yield a stream with such low pollutant concentration that control would not be either technically or economically feasible.
• Consideration may be given to a non-recovery coke oven battery design as an alternative for reducing fugitive emissions. Theoretically, much but not all of the fugitive emissions generated during charging, soaking, and during the coking cycle can be eliminated by employing a non-recovery design because those types of ovens operate under negative, rather than positive pressure. Pushing, traveling, and quenching emissions, and fugitive emissions during decarbonization, would be the same for a non-recovery battery as they would be for a byproduct recovery battery. The potential advantage of lower fugitive emissions associated with a non-recovery coke oven battery design are more than outweighed, however, by the disadvantages for this application. In particular, because the Clairton Plant has a state of the art by-products recovery plant produces clean COG, the overall amount of air emissions associated with a non-recovery design will be higher, perhaps significantly higher, than the emissions from the proposed C Battery. In a non-recovery coke oven battery, the raw COG is burned directly, resulting in higher emissions of NOx, SO2, and particulate matter than will be generated by the combustion of clean COG in the proposed C Battery. While the SO2 can be controlled through flue gas desulfurization, based on the findings made in the permitting of each of the two non-recovery design plants in the United States (Indiana Harbor Coke in Indiana and Jewell Coal and Coke in Virginia) it will not be technically feasible to control the higher NOx or particulate matter emissions. In addition, since clean COG produced by the byproduct plant is used in place of natural gas throughout the Clairton Plant and at the Ivin and Edgar Thomson facilities, and since (as discussed previously) overall emissions are lower for clean COG combustion than for natural gas, employing a non-recovery design rather than a byproduct design for the C Battery will result in higher indirect emissions. Finally, since the byproduct plant produces materials such as tar, light oil, sulfur, and ammonia that are used at the facility and by outside customers, using a non-recovery design rather than a byproduct design will also result in higher indirect emissions attributable to manufacturing such materials rather than recovering them from the COG. For these reasons, employing a non-recovery coke oven battery design as a means to reduce fugitive emissions was rejected as BACT for this application.
Based on the findings discussed above, the proposed control technology and associated emissions limits for the cited sources of fugitive emissions from C Battery represents the most stringent control requirements imposed for this emissions-generating activity. Accordingly, these control requirements represent both LAER and BACT for the C Battery, for NOx, VOCs, CO, SO2, TSP, PM10 and PM2.5.
4.5 BACT for C Battery Traveling
As indicated in Table 2-1, traveling emissions consist primarily of particulate matter, but do contain other regulated air pollutants as well.
4-16 January 2007 D:\final permit application 12-31-07\Permit Application
Technical Support Document Dec 31.doc
There are no specific controls proposed for emissions from traveling. The quench car will be uncovered. However, as indicated in Section 2.2.5, the car will be larger than the one that is used for Batteries 1 - 3, and so even though more surface area will be exposed, the new car will emit less then the current car because it will have a lower surface area to volume ratio. Also as discussed, since there C Battery will have substantially fewer ovens, and since the quench tower will be closer to those ovens than the current tower, shared by the three batteries, will be to those ovens, there will be far fewer trip-miles associated with the quenching operation for C Batter in comparison to the current operation.
The minimum requirements for BACT are the applicable federal, state, and ACHD emissions control requirements for traveling are as follows:
• There are no NSPS applicable to coke oven traveling. In fact, there are no applicable NSPS for any elements of the operation of a coke oven battery.
• The NESHAPs for Coke Ovens: Pushing, Quenching, and Battery Stacks, set forth in 40 CFR Part 63, Subpart CCCCC, does not set standards for traveling emissions because travel emissions are regulated as part of the push.
• For NOx, VOCs, and CO, there are no specific emissions control requirements or emissions limits specified under ACHD Article XXI. This includes the NOx RACT regulations found in ACHD §2105.06 or the specific source emissions and operating standards for coke ovens in ACHD §2105.21.
• For SO2, ACHD §2104.03(c) specifies a limit of 500 parts per million on a dry volumetric basis (ppmvd).
• While no ACHD standards are set for TSP, PM10 and PM2.5 emissions from traveling, ACHD §2105.21(e)(5) specifies a visible emissions limit of 10%, applicable at all times, for pushing. This standard could be considered applicable to traveling emissions. ACHD §2105.49 specifies that “all reasonable actions to prevent fugitive emissions from becoming airborne” must be taken.
The proposed controls for the C Battery will comply in full with all of these applicable requirements.
As presented in Appendix E-3, relatively little information concerning the controls applied to coke oven battery traveling emissions were found in the USEPA’s BID, RBLC, California BACT Clearinghouse, and other literature obtained by U.S. Steel and ENSR. The most notable findings were as follows:
• For the 45 byproduct recovery coke oven batteries and also for the 11 non-recovery coke oven batteries, only visible emissions from traveling are addressed.
• No emissions control measures are identified for traveling emissions.
• In most cases, traveling emissions are limited in combination with pushing emissions, not separately. The Clairton Plant batteries are a notable exception to this. These are the most stringent limits that were found, 10% opacity. This same limit will be applied to the C Battery.
The following findings were made regarding the transfer of emissions control technologies used for other coke oven batteries or other types of emissions units to control the pollutants emitted during traveling:
• For NOx, VOCs, and CO, there are no transferable technologies that can be considered.
• For SO2, TSP, PM10 and PM2.5, as discussed in as discussed in Section 4.3, in regard to the emissions capture system, although both a coke-side shed and a mobile capture and control unit offer the advantage of being able to capture and control traveling emissions, this advantage will be outweighed by the superior overall capture and control efficiency and cost-effectiveness of the Coke Transfer Machine for pushing
4-17 January 2007 D:\final permit application 12-31-07\Permit Application
Technical Support Document Dec 31.doc
emissions that is proposed for this project. The proposed traveling hood system featuring the Coke Transfer Machine mechanism is preferred in comparison to a coke-side shed system for a number of reasons, including that it will be more cost-effective, especially in light of the fact that the Coke Transfer Machine will greatly reduce the fugitive emissions capture advantage of the coke-side shed. Also as discussed in reference to pushing emissions control, installing a scrubber, ESP, or second baghouse in series with the PEC BH was rejected because they would not be cost-effective and, in regard to an SO2 scrubber, there would be associated environmental and energy impacts that would not be merited considering the relatively small reductions it would achieve in emissions. For these reasons, using a coke-side shed to capture emissions, and using a scrubber or other second control device in series with the PEC BH was rejected as BACT for SO2, TSP, PM10 and PM2.5 for this application.
Based on the findings discussed above, the proposed control technology and associated emissions limits for C Battery traveling represent the most stringent control requirements imposed for this emissions-generating activity. Accordingly, these control requirements represent both LAER and BACT for the C Battery, for NOx, VOCs, CO, SO2, TSP, PM10 and PM2.5.
4.6 BACT for C Battery Quench Tower
As indicated in Table 2-1, quenching emissions consist of particulate matter only, but some of the particulate is benzene-soluble organics, which are also considered VOCs.
The C Battery quench tower and settling basin will be designed with a state-of-the-art baffle system which will be the first of its kind to be installed in the United States. The system consists of louver-like baffles arranged in a chevron pattern. These will contain the particulate/VOC emissions by mechanical deflection and electrostatic adsorption. This technology is not new, but it has been substantially improved by adding a second set of baffles. In addition, a second mist suppression spray, located just below the baffles, will help the dust particles suspended in the stream act as condensation cores around which droplets will form that will either precipitate on the louvers above, or descend downward. The quench tower will also be taller than the existing Battery 1 - 3 quench tower. One other emissions reduction benefit of the new quench tower will be that it will replace the current auxiliary quench tower for B Battery, and thus to the extent it is used for that battery will represent a substantial improvement for emissions control.
The minimum requirements for BACT are the applicable federal, state, and ACHD emissions control requirements for quenching are as follows:
• There are no NSPS applicable to coke oven quenching. In fact, there are no applicable NSPS for any elements of the operation of a coke oven battery.
• The NESHAPs for Coke Ovens: Pushing, Quenching, and Battery Stacks, set forth in 40 CFR Part 63, Subpart CCCCC, sets standards for quenching emissions, effective on April 14, 2006. §63.7295(a)(1) specifies that either the concentration of total dissolved solids (TDS) concentration in the water used for quenching must not exceed 1,100 milligrams per liter (mg/L); or the sum of the concentrations of benzene, benzo(a)pyrene, and naphthalene in the water used for quenching must not exceed the applicable site-specific limit approved by the permitting authority. §63.7295(a)(2) specifies that makeup water must be acceptable (this term is not defined further in the regulation; it may be inferred that the makeup water should at least meet the same concentration requirements as specified above). §63.7295(b) specifies that the quench tower must be equipped with baffles, such that no more than 5 percent of the cross sectional area of the tower may be uncovered or open to the sky, and requires that the baffles must be washed daily when the tower is in use, except when ambient temperature remains less than 30oF throughout that day (if the measured ambient temperature rises to 30 oF or more during the day, daily washing must be resumed). This also requires monthly inspection and the initiation of a repair or replacement effort within 30 days of discovery of damaged or missing baffles, to be completed as soon as practicable. §63.7300(b) requires that written operating and maintenance plans for the coke oven as a whole, including quenching,
4-18 January 2007 D:\final permit application 12-31-07\Permit Application
Technical Support Document Dec 31.doc
be developed and followed to ensure the minimization of emissions. General, initial, and continuous compliance requirements (monitoring, testing, recordkeeping, and reporting procedures) are set forth in §63.7310 through §63.7351.
• ACHD §2105.21(g) specifies the employment of a baffled quench tower using water that “is equivalent to, or better than, the water quality standards established for the nearest stream or river by regulations promulgated by the DEP under Pennsylvania Clean Streams Law, Act of June 22, 1937.
The proposed controls for the C Battery will comply in full with all of these applicable requirements.
As presented in Appendix E-4, the key findings made based on the information found in the USEPA’s BID, RBLC, California BACT Clearinghouse, and other literature obtained by U.S. Steel and ENSR relative to quenching emissions control are as follows:
• For the 33 quench towers serving byproduct recovery and non-recovery coke oven batteries that are either currently in operation or (for Chicago Coke and the FDS Coke Plant) are expected to operate in the future in the United States, as required under NESHAPs, all control quenching emissions by equipping the towers with baffles, limiting the total dissolved solids (TDS) level of the quench water, and adhering to a specified schedule for baffle inspections and cleaning.
• The only emissions control technologies identified for pushing emissions for any coke oven battery are for particulate matter emissions. No information was found that indicated that limits are imposed on any coke oven batteries for quenching emissions of pollutants other than particulate matter and visible emissions.
• The proposed C Battery quench tower design and associated operating and maintenance procedures will be equivalent or superior to those employed at the best-controlled quench towers in the United States.
The following findings were made regarding the transfer of emissions control technologies used for other coke oven batteries or other types of emissions units to control the quenching emissions:
• For wet quenching (i.e., quenching with water), the proposed approach involving a state-of-the art tall tower and chevron baffle design is the best available control technology. The nature of the quenching operation, involving periodic bursts of a large volume of water-saturated air containing relative low levels of entrained particulate matter, precludes the consideration of the ESPs, scrubbers, and baghouses that are used for other (even large-scale) sources of particulate emissions. The approach employed for coke oven batteries, i.e., using clean water for the quench and baffles to impede the flow of particles to the atmosphere, is the only one that could be considered technically feasible for wet quenching.
• Consideration may be given to a dry quenching system design as an alternative to a wet quenching design. A dry quenching system involves substituting an inert gas such as nitrogen for water for cooling the coke. According Chapter 10 of to STAPPA/ALACO’s March 2006 report “Controlling Fine Particulate Matter Under the Clean Air Act: A Menu of Options,” “some plants in Europe have switched from water quenching to dry quenching to limit emissions of PM and VOCs,” but “[T]his does require major construction activities and associated costs.” More specifically the “European Commission (EC) estimates that a dry quenching plant may cost between 10 and 15 time more than a wet quenching station.” As stated on pages 137 to 139 of the EC’s December 2001 report entitled “Integrated Pollution Prevention and Control (IPPC) Best Available Techniques Reference Document on the Production of Iron and Steel,” dry quenching processes were generally “intended for application in coke oven plants located in regions which suffer from long periods of severe cold, such as for example: Siberia, Finland, Poland, where wet quenching of coke is difficult or even impossible.” However, in reference to the CDQ type dry quenching system, USEPA’s BID notes that “[T]here are no visible emissions” and that “heat from the hot coke is recovered with minimum operating costs. The USEPA’s BID also discusses the Kress Indirect Dry Cooling system that was demonstrated at the Bethlehem Steel Corporation Sparrows Point mill in 1991,

4-19 January 2007 D:\final permit application 12-31-07\Permit Application
Technical Support Document Dec 31.doc
which reportedly “looks promising for the reduction of pushing and quenching emissions” (while not stated by USEPA, this would also be a means of controlling traveling emissions), but that the demonstration identified some problems with the technology that were not resolved while it was being tested. A search of the open literature did not identify a single case in which the Kress technology has been applied other than the cited demonstration at Sparrows Point, and therefore it cannot be considered as an available option for this application. A concern regarding dry quenching is that while this will obviously reduce water consumption for a coke oven battery by a significant amount, this advantage may be outweighed by the associated raw material consumption and other system demands, and the attendant indirect emissions. Considering the level of emissions that will be associated with the C Battery quenching operation, the significantly higher costs that would be associated with employing a dry quenching system make this an unacceptable choice in this case. For these reasons, employing a dry system design as a means to reduce quenching emissions was rejected as BACT for this application.
Based on the findings discussed above, the proposed control technology and associated emissions limits for C Battery quenching represent the most stringent control requirements imposed for this emissions-generating activity. Accordingly, these control requirements represent both LAER and BACT for the C Battery, for VOCs, TSP, PM10 and PM2.5.
4.7 BACT for C Battery Coke Handling
As indicated in Table 2-1, coke handling emissions consist of particulate matter only, but some of the particulate is benzene-soluble organics which are also considered VOCs.
As indicated in Section 2.2.7, emissions from coke handling will be minimized by applying a surfactant to suppress dust formation, and the employment of a new baghouse to be installed on No. 3 Screening Station. A separate BACT analysis for the No. 3 Screening Station was prepared by MACTEC Engineering and Consulting, Inc., and was submitted in May 2007.
The minimum requirements for BACT are the applicable federal, state, and ACHD emissions control requirements for traveling are as follows:
• There are no NSPS applicable to coke handling. In fact, there are no applicable NSPS for any elements of the operation of a coke oven battery.
• The NESHAPs for Coke Ovens: Pushing, Quenching, and Battery Stacks, set forth in 40 CFR Part 63, Subpart CCCCC, does not set standards for coke handling.
• For VOCs, there are no specific emissions control requirements or emissions limits specified under ACHD Article XXI.
• For TSP, PM10 and PM2.5 emissions, ACHD §2104.02(b) specifies limits on general process source particulate emissions of “seven (7) pounds in any 60 minute period or 100 pounds in any 24-hour period, except that no person subject to the requirements of this Subsection b shall be required to reduce emissions to a greater degree than 99 percent.” ACHD §2104.02(f) specifies a source-specific PM10 emissions limit of 2.8 gr/ton coke for No. 3 Screening Station. This limit has recently been found to be in error and a revision has been proposed by ACHD, gone through the required public comment period and is currently in front of Allegheny County Council for approval. ACHD §2104.05 specifies that emissions from materials handling operations must not be visible beyond the property line. ACHD §2105.21 does not specify emissions control requirements or emissions limits for coke handling. ACHD §2105.40 specifies that visible emissions from material transportation within permitted source facilities cannot be visible at or beyond the property line of such source, have an opacity of 20% or more for a period or periods aggregating more than three (3) minutes in any 60 minute period, or have an opacity of 60% or
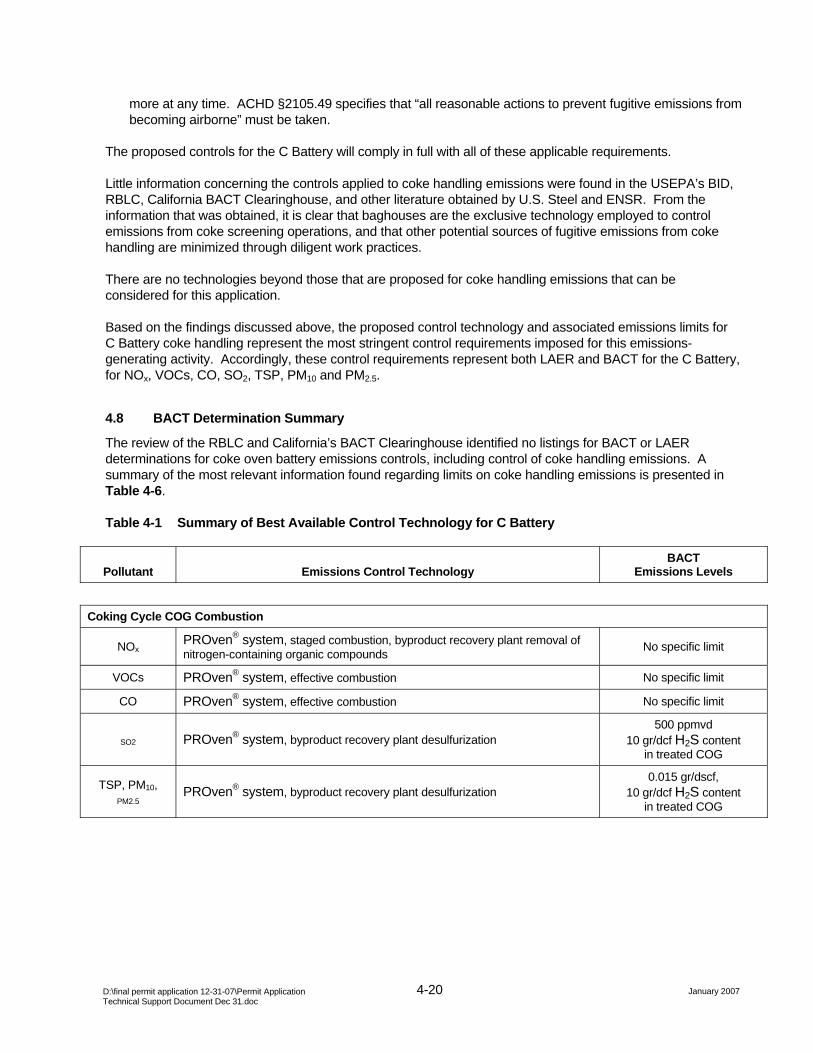
4-20 January 2007 D:\final permit application 12-31-07\Permit Application
Technical Support Document Dec 31.doc
more at any time. ACHD §2105.49 specifies that “all reasonable actions to prevent fugitive emissions from becoming airborne” must be taken.
The proposed controls for the C Battery will comply in full with all of these applicable requirements.
Little information concerning the controls applied to coke handling emissions were found in the USEPA’s BID, RBLC, California BACT Clearinghouse, and other literature obtained by U.S. Steel and ENSR. From the information that was obtained, it is clear that baghouses are the exclusive technology employed to control emissions from coke screening operations, and that other potential sources of fugitive emissions from coke handling are minimized through diligent work practices.
There are no technologies beyond those that are proposed for coke handling emissions that can be considered for this application.
Based on the findings discussed above, the proposed control technology and associated emissions limits for C Battery coke handling represent the most stringent control requirements imposed for this emissions-generating activity. Accordingly, these control requirements represent both LAER and BACT for the C Battery, for NOx, VOCs, CO, SO2, TSP, PM10 and PM2.5.
4.8 BACT Determination Summary
The review of the RBLC and California’s BACT Clearinghouse identified no listings for BACT or LAER determinations for coke oven battery emissions controls, including control of coke handling emissions. A summary of the most relevant information found regarding limits on coke handling emissions is presented in Table 4-6.
Table 4-1 Summary of Best Available Control Technology for C Battery
Pollutant Emissions Control Technology BACT
Emissions Levels
Coking Cycle COG Combustion
NOx PROven® system, staged combustion, byproduct recovery plant removal of nitrogen-containing organic compounds No specific limit
VOCs PROven® system, effective combustion No specific limit
CO PROven® system, effective combustion No specific limit
SO2 PROven® system, byproduct recovery plant desulfurization 500 ppmvd
10 gr/dcf H2S content in treated COG
TSP, PM10, PM2.5 PROven® system, byproduct recovery plant desulfurization
0.015 gr/dscf, 10 gr/dcf H2S content
in treated COG
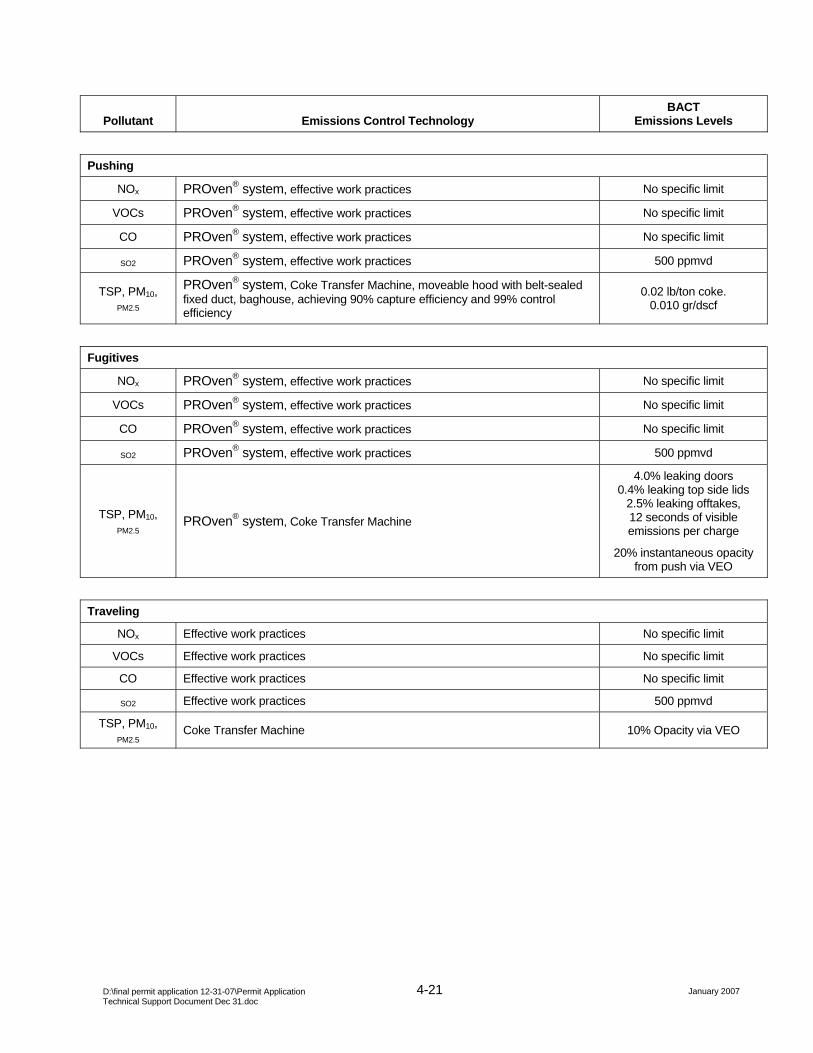
4-21 January 2007 D:\final permit application 12-31-07\Permit Application
Technical Support Document Dec 31.doc
Pollutant Emissions Control Technology BACT
Emissions Levels
Pushing
NOx PROven® system, effective work practices No specific limit
VOCs PROven® system, effective work practices No specific limit
CO PROven® system, effective work practices No specific limit
SO2 PROven® system, effective work practices 500 ppmvd
TSP, PM10, PM2.5
PROven® system, Coke Transfer Machine, moveable hood with belt-sealed fixed duct, baghouse, achieving 90% capture efficiency and 99% control efficiency
0.02 lb/ton coke. 0.010 gr/dscf
Fugitives
NOx PROven® system, effective work practices No specific limit
VOCs PROven® system, effective work practices No specific limit
CO PROven® system, effective work practices No specific limit
SO2 PROven® system, effective work practices 500 ppmvd
TSP, PM10, PM2.5 PROven® system, Coke Transfer Machine
4.0% leaking doors 0.4% leaking top side lids
2.5% leaking offtakes, 12 seconds of visible emissions per charge
20% instantaneous opacity from push via VEO
Traveling
NOx Effective work practices No specific limit
VOCs Effective work practices No specific limit
CO Effective work practices No specific limit
SO2 Effective work practices 500 ppmvd
TSP, PM10, PM2.5
Coke Transfer Machine 10% Opacity via VEO
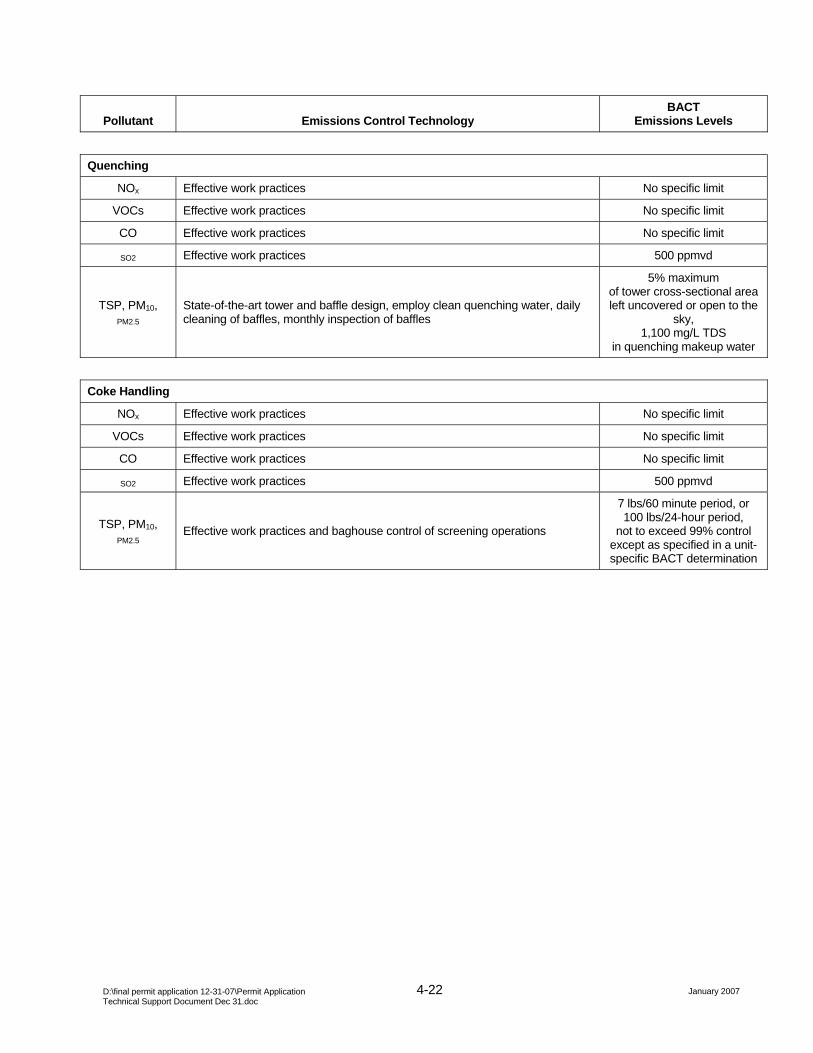
4-22 January 2007 D:\final permit application 12-31-07\Permit Application
Technical Support Document Dec 31.doc
Pollutant Emissions Control Technology BACT
Emissions Levels
Quenching
NOx Effective work practices No specific limit
VOCs Effective work practices No specific limit
CO Effective work practices No specific limit
SO2 Effective work practices 500 ppmvd
TSP, PM10, PM2.5
State-of-the-art tower and baffle design, employ clean quenching water, daily cleaning of baffles, monthly inspection of baffles
5% maximum of tower cross-sectional arealeft uncovered or open to the
sky, 1,100 mg/L TDS
in quenching makeup water
Coke Handling
NOx Effective work practices No specific limit
VOCs Effective work practices No specific limit
CO Effective work practices No specific limit
SO2 Effective work practices 500 ppmvd
TSP, PM10, PM2.5
Effective work practices and baghouse control of screening operations
7 lbs/60 minute period, or 100 lbs/24-hour period,
not to exceed 99% control except as specified in a unit-specific BACT determination
January 2008 D:\final permit application 12-31-07\Permit Application
Technical Support Document Dec 31.doc
Appendix A Allegheny County Health Department Installation Permit Application Forms


Company: USS Mon Valley Works Page: Application – 2 Submit Original and Two Copies
SECTION 3. (cont.) MAP LOCATION: Please provide the Universal Transverse Mercator (UTM) coordinates or the exact latitude and longitude of the plant. UTM coordinates are preferable to latitude and longitude and can be determined from US Geological Survey 7.5 Minute 1:24,000 scale maps. Attach a drawing of your source showing all emission points. Number each stack S001, S002, S003, etc., and number each fugitive emission location F001, F002, etc. Identify roads as paved or unpaved, marking all parking lots (see Form E). Identify the plant boundary on the map. Include local roads and other necessary identifiers that will allow the Department to locate your source on County-wide maps. UTM North 4461.9 Or Latitude NA Degrees NA Minutes NA Seconds NORTH UTM East 595.5 Or Longitude NA Degrees NA Minutes NA Seconds WEST PLANT PROPERTY 400 Acres or NA Square feet BUILDING AREA Unknow
n Acres or NA Square feet
GIVE TRAVEL DIRECTIONS FROM DOWNTOWN PITTSBURGH: Travel Route 837 South to Clairton, Pennsylvania. The General Office Building is located at 400 State Street in Clairton on the left.
DESCRIPTION OF BUSINESS
GIVE A BRIEF DESCRIPTION OF BUSINESS OR ACTIVITY CARRIED OUT AT THIS LOCATION: This facility manufactures metallurgical coke for use in the steelmaking process at various other steel mills. PRINCIPAL PRODUCT(S): Metallurgical Coke and Coke By-Products APPROXIMATE NUMBER OF EMPLOYEES: 1100 If employment is seasonal, give the typical peak employment and indicate what season.
STANDARD INDUSTRIAL CLASSIFICATION (SIC) CODE FOR THIS LOCATION: If there is more than one activity at this location, provide the Standard Industrial Code (SIC) for the principal activity, and other SIC codes in descending order of importance. Primary SIC Code: 3312 Primary activity: By-product coke manufacturing Secondary SIC Code: Secondary activity: Tertiary SIC Code: Tertiary activity:
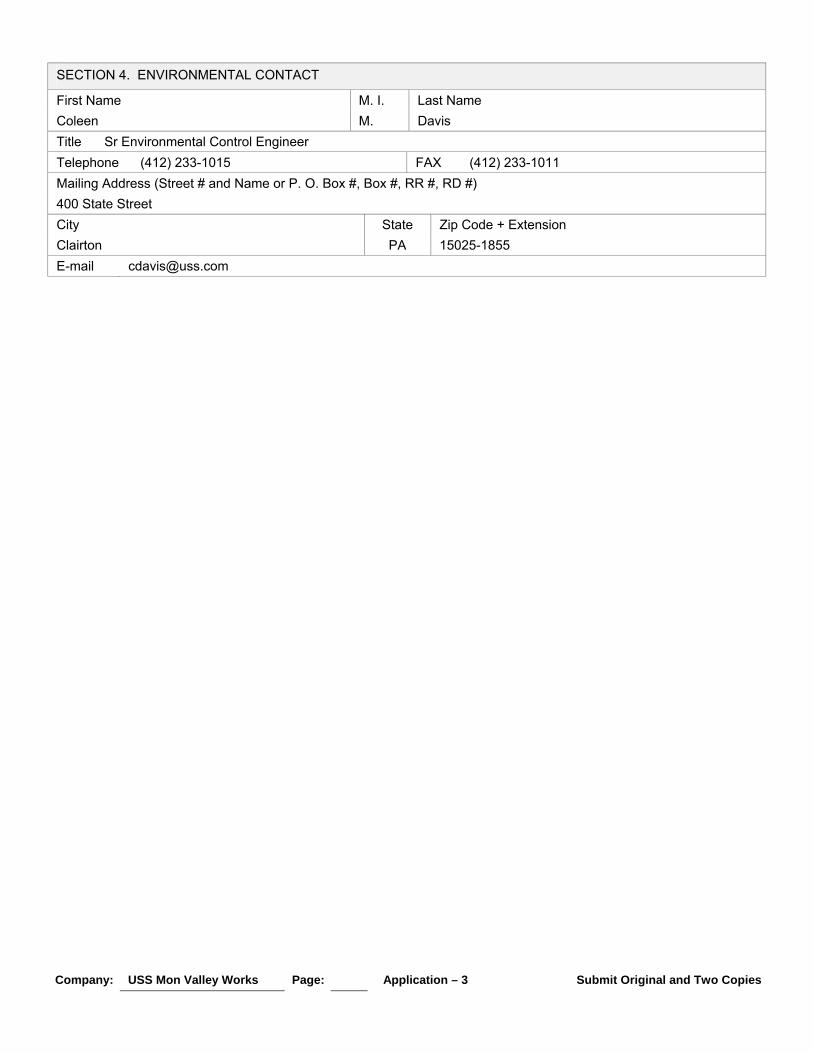
Company: USS Mon Valley Works Page: Application – 3 Submit Original and Two Copies
SECTION 4. ENVIRONMENTAL CONTACT
First Name M. I. Last Name Coleen M. Davis Title Sr Environmental Control Engineer Telephone (412) 233-1015 FAX (412) 233-1011 Mailing Address (Street # and Name or P. O. Box #, Box #, RR #, RD #) 400 State Street City State Zip Code + Extension Clairton PA 15025-1855 E-mail [email protected]

Company: USS Mon Valley Works Page: Application – 4 Submit Original and Two Copies
SECTION 5: APPLICABLE REQUIREMENTS In this section, briefly describe all applicable federal, state, or local air rules or requirements pertaining to the facility or any part of the facility. "Applicable requirements" can come from any of the following:
(i.) Regulations that have been promulgated or approved by the EPA under the Clean Air Act or the regulations adopted under the Clean Air Act through rulemaking at the time of issuance but have future-effective compliance dates.
(ii.) A regulation under Allegheny County Article XXI (Air Pollution Control), including those incorporated by reference. (iii.) A term or condition of any installation or operating permits issued pursuant to the County air quality regulations. (iv.) A standard or other requirement under Section 111 of the Clean Air Act, including subsection (d). (v.) A standard or other requirement under Section 112 of the Clean Air Act (42 U.S.C.A. 7412), including any
requirement concerning accident prevention under subsection (r) (7). (vi.) A standard or other requirement of the acid rain program under Title IV of the Clean Air Act (42 U.S.C.A. 7641 -
7651o) or the regulations promulgated under the Clean Air Act. (vii.) Requirements established under Section 504(b) or Section 114(a)(3) of the Clean Air Act (42 U.S.C.A. 7414(a)(3).(viii.) A standard or other requirement governing solid waste incineration, under Section 129 of the Clean Air Act (42
U.S.C.A. 7429). (ix.) A standard or other requirement for consumer and commercial products, under Section 183(e) of the Clean Air Act
(42 U.S.C.A. 7511b(e)). (x.) A standard or other requirement for tank vessels, under Section 183(f) of the Clean Air Act (42 U.S.C.A. 7511b). (xi.) A standard or other requirement of the program to control air pollution from outer continental shelf sources, under
Section 328 of the Clean Air Act (42 U.S.C.A. 7627). (xii.) A standard or other requirement of the regulations promulgated to protect stratospheric ozone under Title VI of the
Clean Air Act (42 U.S.C.A. 7671-7671q), unless the Administrator of the EPA has determined that such requirements need not be contained in a Title V permit.
(xiii.) A national ambient air quality standard or increment or visibility requirement under Title I, Part C of the Clean Air Act (42 U.S.C.A. 7470-77491), but only as it would apply to temporary sources permitted pursuant to Section 504(e) of the CAA (42 U.S.C.A. 7661d).
Include any regulations that are final, but may require controls to be put on, or lower emission rates to come into effect in the future. Be as specific as necessary. For example, if you have boilers rated at 10, 70, and 100 MMBtu, then for sulfur dioxide emissions list Article XXI 2104.03 a.1, 2, and 3. When you complete the Forms for specific operations, you will be requested to repeat those requirements unique to that unit. Include general emission requirements, such as 2104.04, odor emissions, if they apply.
If there are any limitations on source operation affecting emissions or any work practice standards, provide details in this section. Include supporting documents, if necessary. If the facility is claiming any exemptions to a part of an applicable requirements stated above or any other requirements, clearly identify what section. Copy this page as needed, and attach these additional pages to this section. An example of how Section 5.A might be completed: Emission Regulation Description Art. XXI 2104.02.a.2 PM 0.40 #/106 BTU Art. XXI 2104.03.a.1 SO2 1.0 #/106 BTU Art. XXI 2104.01.a Opacity 20% for <3 min./hr. or 60% at no time Art. XXI 2105.06.d.1 Low NOx Burners w/overfire air List and summarize all applicable federal, state, or local air rules or requirements pertaining to the facility or any part of the facility. Also describe any regulated work practice standards that affect air emissions. Include any regulations that are in place, but have delayed deadlines for compliance. (COPY THIS PAGE AS NEEDED) REGULATION DESCRIPTION ACHD Article XXI Regulations PART A – GENERAL 2101.11 Prohibition of air pollution 2101.12.a Interstate air pollution: General 2101.12.b Interstate air pollution: Findings by EPA 2101.17 Circumvention

Company: USS Mon Valley Works Page: Application – 5 Submit Original and Two Copies
PART B – PERMITS GENERALLY 2102.01 Certification 2102.04.a Installation permits: General Requirements 2102.05 Installation permits for new and modified major sources 2102.10 Installation permit application and administration fees
PART C – OPERATING PERMITS 2103 Operating permits
PART D – POLLUTANT EMISSION STANDARDS 2104.01.a Visible emissions: General Limits 2104.01.b Visible emissions: Exclusions 2104.01.c Visible emissions: Measurements 2104.02.b Particulate mass emissions: Processes - General 2104.02 c Crushing, grinding, or screening 2104.02 e Specific controlled process sources *(1) 2104.02 f #3 Coke Screening 2104.03.a Sulfur oxide emissions: Fuel Burning or Combustion Equipment 2104.03.c Sulfur oxide emissions: Processes 2104.03.e Sulfur oxide emissions: Measurements 2104.04.a Odor emissions: General (LOCAL ONLY) 2104.04.c Odor emissions: Measurements (LOCAL ONLY) 2104.05 Materials handling emissions 2104.06 Violations 2104.07 Stack heights 2104.08 National emission standards for Hazardous Air Pollutants
PART E – SOURCE EMISSION AND OPERATING STANDARDS 2105.03 Operation and maintenance (of air pollution control equipment) 2105.05 New source performance standards 2105.06 Major sources of nitrogen oxides and volatile organic compounds (RACT) 2105.12 Volatile organic compound storage tanks 2105.15 Degreasing Operations 2105.21 Coke ovens and coke oven gas *(3) 2105.40 Permit source premises 2105.41 Non-permit premises 2105.42 Parking lots and roadways 2105.43 Permit source transport 2105.44 Non-permit source transport 2105.45 Construction and land clearing 2105.47 Demolition 2105.48 Areas subject to sections 2105.40 through 2105.47 2105.49 Fugitive emissions 2105.50 Open Burning 2105.51 Abrasive blasting 2105.60 Asbestos Abatement Contractor Licenses Asbestos Abatement Accreditation Requirements
* (1), (2), (3) – see clarification on page 1-28.
PART F – AIR POLLUTANT EPISODES 2105.61 Asbestos Abatement Applicability, Federal Requirements, Notices and Permits 2105.62 Asbestos Abatement Procedures 2106.01.a Air Pollution Episode System: General 2106.02 Air Pollution Source Curtailment Plans 2106.04 Episode Actions 2106.05 USX Clairton Works PM-10 Self Audit Emergency Action Plan PART G – METHODS 2107.01 General methods of measurement 2107.02 Particulate matter measurements 2107.03 Sulfur oxide measurements 2107.05 Nitrogen oxide measurements 2107.07 Coke oven emissions 2107.08 Coke oven gas 2107.09 Hydrogen sulfide 2107.10 Sulfur content of coke 2107.11 Visible emissions measurement 2107.13 Odor emissions measurements 2107.20 Ambient measurements

Company: USS Mon Valley Works Page: Application – 6 Submit Original and Two Copies
PART H – REPORTING, TESTING, & MONITORING 2108.01 Reports required 2108.02.a New and modifies sources 2108.02.b Emissions testing: Existing sources 2108.02.c Emissions testing: Existing sources orders 2108.02.e Emissions testing: Existing sources testing requirements 2108.03 Continuous emissions monitoring 2108.04 Ambient monitoring
PART I – ENFORCEMENT 2109.01.a Inspections: General 2109.03 Enforcement Orders 2109.04 Orders Establishing an Additional or More Restrictive Standards Pennsylvania State Requirements 25 PA. Code 145 Interstate Pollution Transport Reduction Federal Requirements 40 CFR Part 63 Subpart L National Emission Standards for Coke Oven Batteries 40 CFR Part 63 Subpart CCCCC National Emission Standards for Pushing, Quenching, and
Battery Stacks

Company: USS Mon Valley Works Page: Application – 7 Submit Original and Two Copies
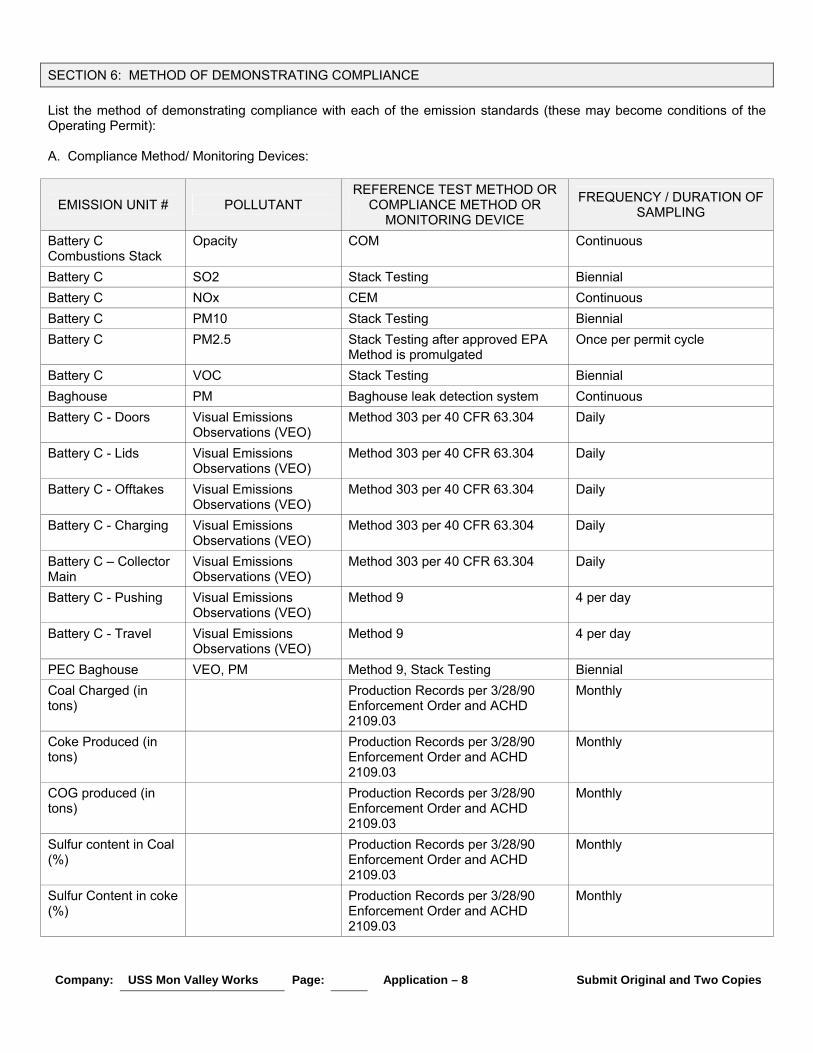
Company: USS Mon Valley Works Page: Application – 8 Submit Original and Two Copies
SECTION 6: METHOD OF DEMONSTRATING COMPLIANCE List the method of demonstrating compliance with each of the emission standards (these may become conditions of the Operating Permit): A. Compliance Method/ Monitoring Devices:
EMISSION UNIT # POLLUTANT REFERENCE TEST METHOD OR
COMPLIANCE METHOD OR MONITORING DEVICE
FREQUENCY / DURATION OF SAMPLING
Battery C Combustions Stack
Opacity COM Continuous
Battery C SO2 Stack Testing Biennial Battery C NOx CEM Continuous Battery C PM10 Stack Testing Biennial Battery C PM2.5 Stack Testing after approved EPA
Method is promulgated Once per permit cycle
Battery C VOC Stack Testing Biennial Baghouse PM Baghouse leak detection system Continuous Battery C - Doors Visual Emissions
Observations (VEO) Method 303 per 40 CFR 63.304 Daily
Battery C - Lids Visual Emissions Observations (VEO)
Method 303 per 40 CFR 63.304 Daily
Battery C - Offtakes Visual Emissions Observations (VEO)
Method 303 per 40 CFR 63.304 Daily
Battery C - Charging Visual Emissions Observations (VEO)
Method 303 per 40 CFR 63.304 Daily
Battery C – Collector Main
Visual Emissions Observations (VEO)
Method 303 per 40 CFR 63.304 Daily
Battery C - Pushing Visual Emissions Observations (VEO)
Method 9 4 per day
Battery C - Travel Visual Emissions Observations (VEO)
Method 9 4 per day
PEC Baghouse VEO, PM Method 9, Stack Testing Biennial Coal Charged (in tons)
Production Records per 3/28/90 Enforcement Order and ACHD 2109.03
Monthly
Coke Produced (in tons)
Production Records per 3/28/90 Enforcement Order and ACHD 2109.03
Monthly
COG produced (in tons)
Production Records per 3/28/90 Enforcement Order and ACHD 2109.03
Monthly
Sulfur content in Coal (%)
Production Records per 3/28/90 Enforcement Order and ACHD 2109.03
Monthly
Sulfur Content in coke (%)
Production Records per 3/28/90 Enforcement Order and ACHD 2109.03
Monthly

Company: USS Mon Valley Works Page: Application – 9 Submit Original and Two Copies
Total Number of Pushes
Production Records per 3/28/90 Enforcement Order and ACHD 2109.03
Monthly
Number of Controlled Pushes
Production Records per 3/28/90 Enforcement Order and ACHD 2109.03
Monthly
Pushing Outages Production Records per 3/28/90 Enforcement Order and ACHD 2109.03
Monthly
Flaring Incidents Production Records per 3/28/90 Enforcement Order and ACHD 2109.03
Monthly
Attach any details that would further explain the method of compliance. B. Record keeping and Reporting: 1. List what parameter will be recorded and the frequency of recording:
PARAMETER FREQUENCY NOx Continuous NOx monitoring measurements will record: - daily fuel consumption and average fuel Btu content; - average monthly fuel input; - average monthly NOx emission rate; and calculate 30 day rolling average NOx emissions in lb/MMbtu.
Continuous
Opacity Continuous opacity monitoring measurements will record: - monthly percentage of availability; - daily percentage availability; - number of days less than 100 percent availability; - hours of opacity exceedance by day and month as recorded by COM; and number and nature of all tests and calibrations of the COM.
Continuous
Monitoring parameters will be recorded in accordance with Article XXI.
Biennial source test of underfire stack for PM will be conducted and recorded per method, biennially.
Biennially
Biennial source test of underfire stack for PM will be conducted and recorded per method, biennially.
Biennially
Visual emissions observations by Method 303 will be conducted and recorded. Daily Pushing Observations Daily Travel Observations Daily 2. Describe what is to be reported and the frequency of reporting? (Reports must be submitted at least every six (6) months)
DESCRIPTION FREQUENCY Production reports Semi-Annual Visual emission observations by Method 303 Monthly by ACHD Contractor Opacity monitoring reports on the underfire stack Monthly NOx continuous monitoring reports will be submitted Quarterly

Company: USS Mon Valley Works Page: Application – 10 Submit Original and Two Copies
Biennial source testing results Biennially Pushing Observations Semi-annually 3. Beginning reporting date: __ /__ /__ COPY THIS PAGE AS NEEDED

Company: USS Mon Valley Works Page: Application – 11 Submit Original and Two Copies
SECTION 7: COMPLIANCE PLAN A source may apply for and receive an Operating Permit if one or more emission units are out of compliance with a regulation, provided that an adequate plan is in place to bring the unit(s) into compliance. A. 1. At the time of this permit application is your source in compliance with all applicable requirements, and do
you expect your source to remain in compliance with these requirements during the permit duration (with the exception noted in item C)?
__ Yes _X_ No
2. Will your source be in compliance with all applicable requirements scheduled to take effect during the term of the permit, and will they be met by the applicable deadline?
_X_ Yes __ No
B. If you checked "No" for any question in Part A, please attach information identifying the requirement(s) and
emission units for which compliance is not achieved, briefly describe how compliance will be achieved with the applicable requirement(s), and provide a detailed Schedule of Compliance (i.e., a schedule of remedial measures, including an enforceable sequence of actions with milestones and projected compliance dates). Title this portion of the document "Schedule M: Compliance Information". Indicate the frequency for submittal of progress reports (at least every six (6) months) and the starting date for submittal of progress reports.
C. Do you have scheduled shutdown of control equipment for maintenance while the emission units are still
operating? _X_ Yes __ No If yes, attach a description of the equipment that will be taken out of service, what pollutants and emission sources are
affected, the schedule and duration of the shutdown, and what actions will be taken to minimize emissions. In the event of a Coke Transfer Car outage a back-up traveling hood will be utilized. Outages or breakdowns of the
PEC system will be reported as required. SECTION 8: OTHER PERMITS
Do you own or are you related to any other permitted company in Pennsylvania? __ Yes _X_ No If so, please list the company names:
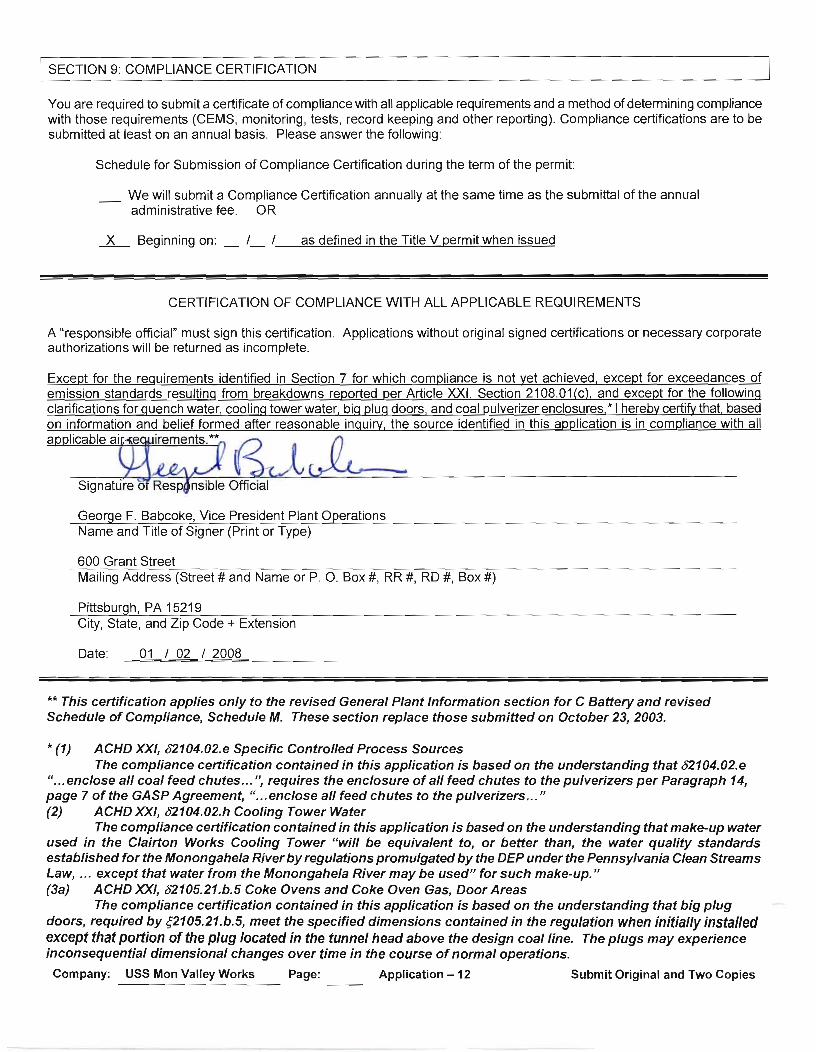
Company: USS Mon Valley Works Page: Application – 13 Submit Original and Two Copies
(3b) ACHD XXI, δ2105.21.g Quenching The compliance certification contained in this application is based on the understanding that make-up water used for the quenching of coke “will be equivalent to, or better than, the water quality standards established for the Monongahela River by regulations promulgated by the DEP under the Pennsylvania Clean Streams Law, … except that water from the Monongahela River may be used” for such quenching make-up.

Company: USS Mon Valley Works Page: Application – 14 Submit Original and Two Copies
SECTION 10: SYNTHETIC MINOR A Major source may, at its option, choose to place limits on its operation or emissions in order to become a "Synthetic Minor" source, and not be subject to the additional requirements of a Major source. These limits will become permit restrictions and will be federally enforceable. Does this application include any requested restrictions? __ Yes _X_ No If so, have these restrictions caused this site to go below Major source thresholds and become a Synthetic Minor? __ Yes __ No Is this facility requesting to become a Synthetic Minor source? __ Yes _X_ No (Please check the box on the top of page 1 as well.) Be sure to include on each source information sheets, Forms A, B, and C, a complete description of the limitations that make this source a Synthetic Minor. Attach extra pages, if needed. SECTION 11: INFORMATION FOR INSTALLATION PERMITS Is this a new Major source or Major Modification for any criteria pollutant which is in or impacting a non-attainment area? __ Yes _X_ No If yes, list below for which pollutant(s). Attach all required documents required under Article XXI, sections 2102.05 and 2102.06. Is this a new Major source or Major Modification for any criteria pollutant which is in or impacting an attainment area or unclassified area? __ Yes _X_ No If yes, list below for which pollutant(s). Attach all required documents required under Article XXI, sections 2102.05 and 2102.07. A source applying for a Minor Installation Permit may request public review at this time. Are you requesting public review for a Minor Installation Permit? __ Yes _X_ No
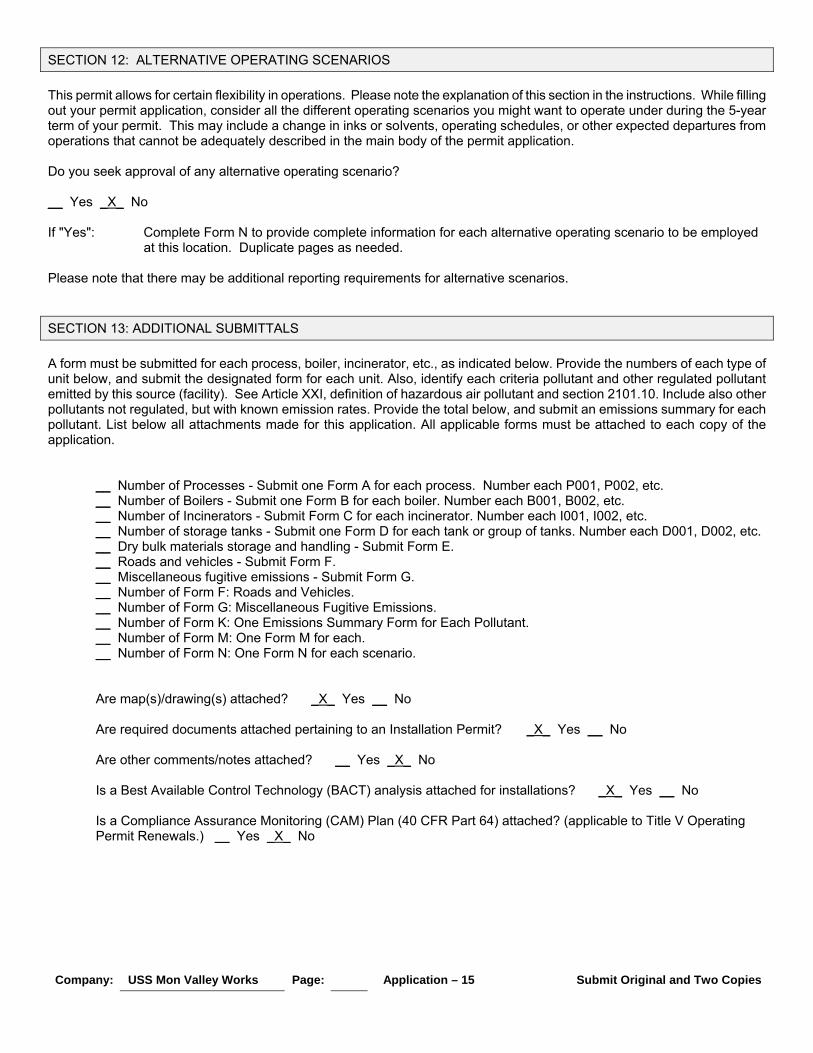
Company: USS Mon Valley Works Page: Application – 15 Submit Original and Two Copies
SECTION 12: ALTERNATIVE OPERATING SCENARIOS This permit allows for certain flexibility in operations. Please note the explanation of this section in the instructions. While filling out your permit application, consider all the different operating scenarios you might want to operate under during the 5-year term of your permit. This may include a change in inks or solvents, operating schedules, or other expected departures from operations that cannot be adequately described in the main body of the permit application. Do you seek approval of any alternative operating scenario? __ Yes _X_ No If "Yes": Complete Form N to provide complete information for each alternative operating scenario to be employed
at this location. Duplicate pages as needed. Please note that there may be additional reporting requirements for alternative scenarios. SECTION 13: ADDITIONAL SUBMITTALS A form must be submitted for each process, boiler, incinerator, etc., as indicated below. Provide the numbers of each type of unit below, and submit the designated form for each unit. Also, identify each criteria pollutant and other regulated pollutant emitted by this source (facility). See Article XXI, definition of hazardous air pollutant and section 2101.10. Include also other pollutants not regulated, but with known emission rates. Provide the total below, and submit an emissions summary for each pollutant. List below all attachments made for this application. All applicable forms must be attached to each copy of the application.
__ Number of Processes - Submit one Form A for each process. Number each P001, P002, etc. __ Number of Boilers - Submit one Form B for each boiler. Number each B001, B002, etc. __ Number of Incinerators - Submit Form C for each incinerator. Number each I001, I002, etc. __ Number of storage tanks - Submit one Form D for each tank or group of tanks. Number each D001, D002, etc. __ Dry bulk materials storage and handling - Submit Form E. __ Roads and vehicles - Submit Form F. __ Miscellaneous fugitive emissions - Submit Form G. __ Number of Form F: Roads and Vehicles. __ Number of Form G: Miscellaneous Fugitive Emissions. __ Number of Form K: One Emissions Summary Form for Each Pollutant. __ Number of Form M: One Form M for each. __ Number of Form N: One Form N for each scenario.
Are map(s)/drawing(s) attached? _X_ Yes __ No Are required documents attached pertaining to an Installation Permit? _X_ Yes __ No Are other comments/notes attached? __ Yes _X_ No Is a Best Available Control Technology (BACT) analysis attached for installations? _X_ Yes __ No Is a Compliance Assurance Monitoring (CAM) Plan (40 CFR Part 64) attached? (applicable to Title V Operating Permit Renewals.) __ Yes _X_ No
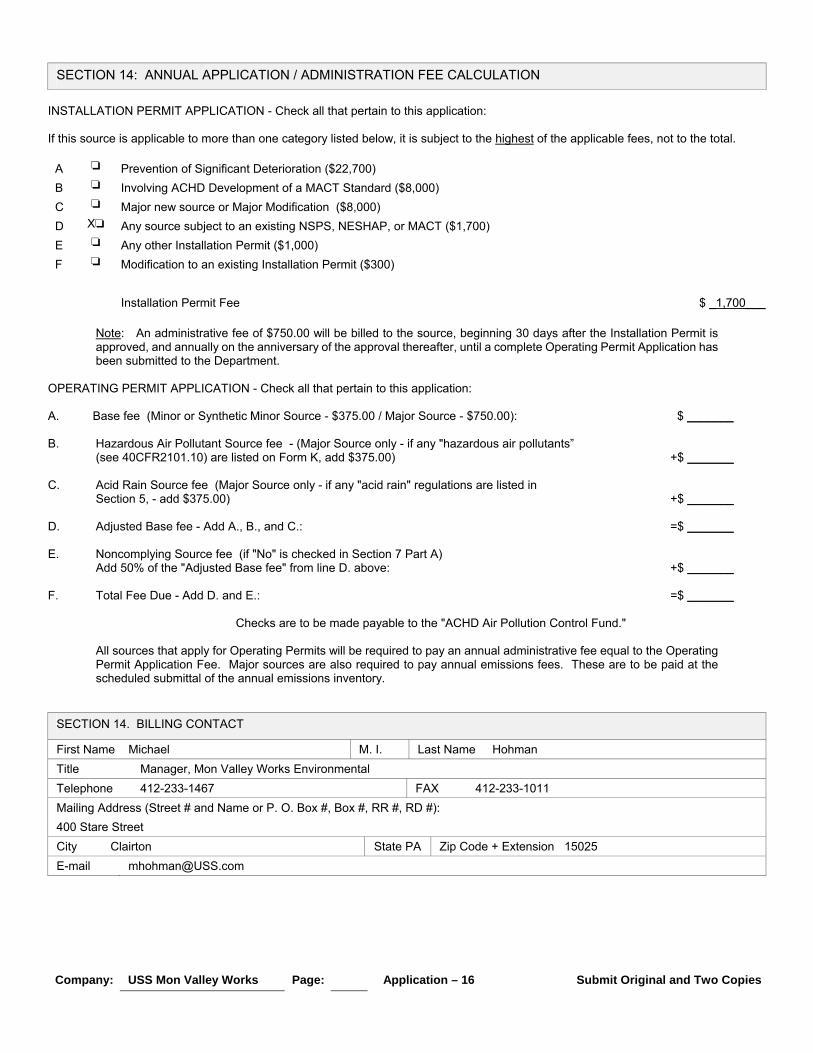
Company: USS Mon Valley Works Page: Application – 16 Submit Original and Two Copies
SECTION 14: ANNUAL APPLICATION / ADMINISTRATION FEE CALCULATION
INSTALLATION PERMIT APPLICATION - Check all that pertain to this application: If this source is applicable to more than one category listed below, it is subject to the highest of the applicable fees, not to the total.
A ‘ Prevention of Significant Deterioration ($22,700) B ‘ Involving ACHD Development of a MACT Standard ($8,000) C ‘ Major new source or Major Modification ($8,000) D X‘ Any source subject to an existing NSPS, NESHAP, or MACT ($1,700) E ‘ Any other Installation Permit ($1,000) F ‘ Modification to an existing Installation Permit ($300) Installation Permit Fee $ _1,700___
Note: An administrative fee of $750.00 will be billed to the source, beginning 30 days after the Installation Permit is approved, and annually on the anniversary of the approval thereafter, until a complete Operating Permit Application has been submitted to the Department.
OPERATING PERMIT APPLICATION - Check all that pertain to this application: A. Base fee (Minor or Synthetic Minor Source - $375.00 / Major Source - $750.00): $ _______ B. Hazardous Air Pollutant Source fee - (Major Source only - if any "hazardous air pollutants”
(see 40CFR2101.10) are listed on Form K, add $375.00) +$ _______ C. Acid Rain Source fee (Major Source only - if any "acid rain" regulations are listed in
Section 5, - add $375.00) +$ _______ D. Adjusted Base fee - Add A., B., and C.: =$ _______ E. Noncomplying Source fee (if "No" is checked in Section 7 Part A)
Add 50% of the "Adjusted Base fee" from line D. above: +$ _______ F. Total Fee Due - Add D. and E.: =$ _______
Checks are to be made payable to the "ACHD Air Pollution Control Fund."
All sources that apply for Operating Permits will be required to pay an annual administrative fee equal to the Operating Permit Application Fee. Major sources are also required to pay annual emissions fees. These are to be paid at the scheduled submittal of the annual emissions inventory.
SECTION 14. BILLING CONTACT
First Name Michael M. I. Last Name Hohman Title Manager, Mon Valley Works Environmental Telephone 412-233-1467 FAX 412-233-1011 Mailing Address (Street # and Name or P. O. Box #, Box #, RR #, RD #): 400 Stare Street City Clairton State PA Zip Code + Extension 15025 E-mail [email protected]
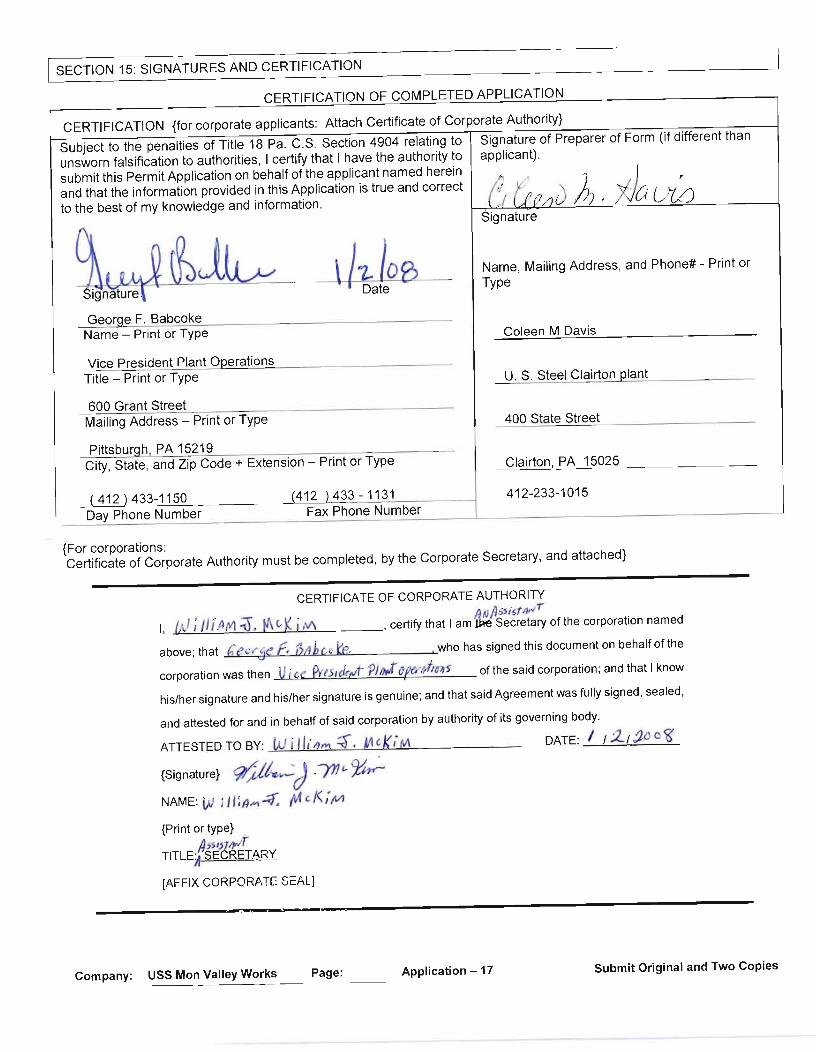
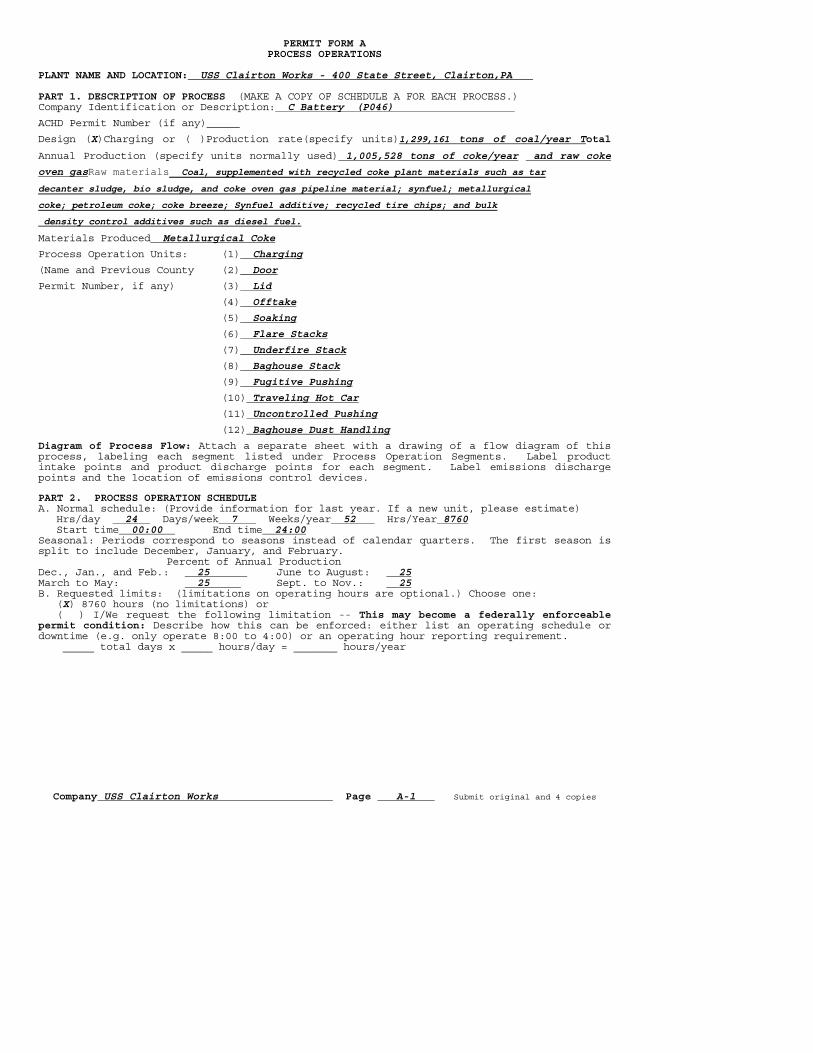
Company USS Clairton Works Page A-1 Submit original and 4 copies
PERMIT FORM A PROCESS OPERATIONS
PLANT NAME AND LOCATION: USS Clairton Works - 400 State Street, Clairton,PA PART 1. DESCRIPTION OF PROCESS (MAKE A COPY OF SCHEDULE A FOR EACH PROCESS.) Company Identification or Description: C Battery (P046)
ACHD Permit Number (if any)
Design (X)Charging or ( )Production rate(specify units)1,299,161 tons of coal/year Total
Annual Production (specify units normally used) 1,005,528 tons of coke/year and raw coke
oven gasRaw materials Coal, supplemented with recycled coke plant materials such as tar
decanter sludge, bio sludge, and coke oven gas pipeline material; synfuel; metallurgical
coke; petroleum coke; coke breeze; Synfuel additive; recycled tire chips; and bulk
density control additives such as diesel fuel.
Materials Produced Metallurgical Coke
Process Operation Units: (1) Charging
(Name and Previous County (2) Door
Permit Number, if any) (3) Lid
(4) Offtake
(5) Soaking
(6) Flare Stacks
(7) Underfire Stack
(8) Baghouse Stack
(9) Fugitive Pushing
(10) Traveling Hot Car
(11) Uncontrolled Pushing
(12) Baghouse Dust Handling
Diagram of Process Flow: Attach a separate sheet with a drawing of a flow diagram of this process, labeling each segment listed under Process Operation Segments. Label product intake points and product discharge points for each segment. Label emissions discharge points and the location of emissions control devices. PART 2. PROCESS OPERATION SCHEDULE A. Normal schedule: (Provide information for last year. If a new unit, please estimate) Hrs/day 24 Days/week 7 Weeks/year 52 Hrs/Year 8760 Start time 00:00 End time 24:00 Seasonal: Periods correspond to seasons instead of calendar quarters. The first season is split to include December, January, and February. Percent of Annual Production Dec., Jan., and Feb.: 25 June to August: 25 March to May: 25 Sept. to Nov.: 25 B. Requested limits: (limitations on operating hours are optional.) Choose one: (X) 8760 hours (no limitations) or ( ) I/We request the following limitation -- This may become a federally enforceable permit condition: Describe how this can be enforced: either list an operating schedule or downtime (e.g. only operate 8:00 to 4:00) or an operating hour reporting requirement. _____ total days x _____ hours/day = _______ hours/year
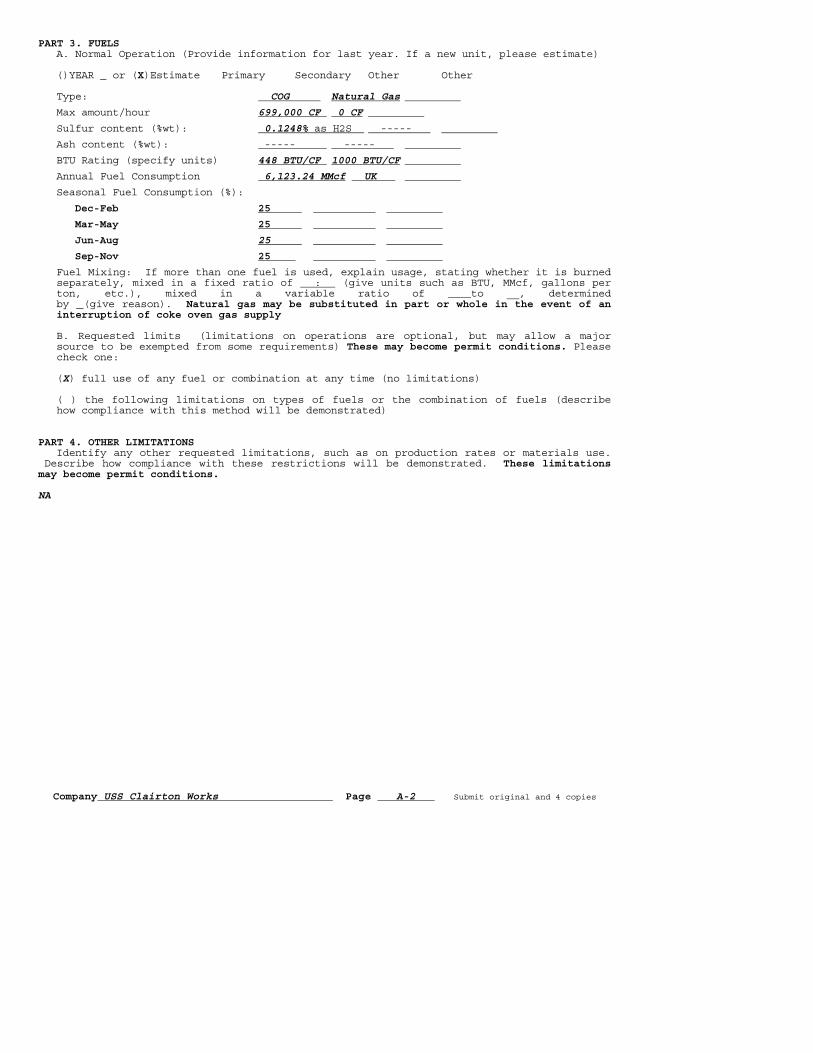
Company USS Clairton Works Page A-2 Submit original and 4 copies
PART 3. FUELS A. Normal Operation (Provide information for last year. If a new unit, please estimate) ()YEAR or (X)Estimate Primary Secondary Other Other Type: COG Natural Gas
Max amount/hour 699,000 CF 0 CF
Sulfur content (%wt): 0.1248% as H2S -----
Ash content (%wt): ----- -----
BTU Rating (specify units) 448 BTU/CF 1000 BTU/CF
Annual Fuel Consumption 6,123.24 MMcf UK
Seasonal Fuel Consumption (%):
Dec-Feb 25
Mar-May 25
Jun-Aug 25
Sep-Nov 25
Fuel Mixing: If more than one fuel is used, explain usage, stating whether it is burned separately, mixed in a fixed ratio of : (give units such as BTU, MMcf, gallons per ton, etc.), mixed in a variable ratio of to __, determined by (give reason). Natural gas may be substituted in part or whole in the event of an interruption of coke oven gas supply
B. Requested limits (limitations on operations are optional, but may allow a major
source to be exempted from some requirements) These may become permit conditions. Please check one:
(X) full use of any fuel or combination at any time (no limitations) ( ) the following limitations on types of fuels or the combination of fuels (describe
how compliance with this method will be demonstrated) PART 4. OTHER LIMITATIONS Identify any other requested limitations, such as on production rates or materials use. Describe how compliance with these restrictions will be demonstrated. These limitations may become permit conditions. NA
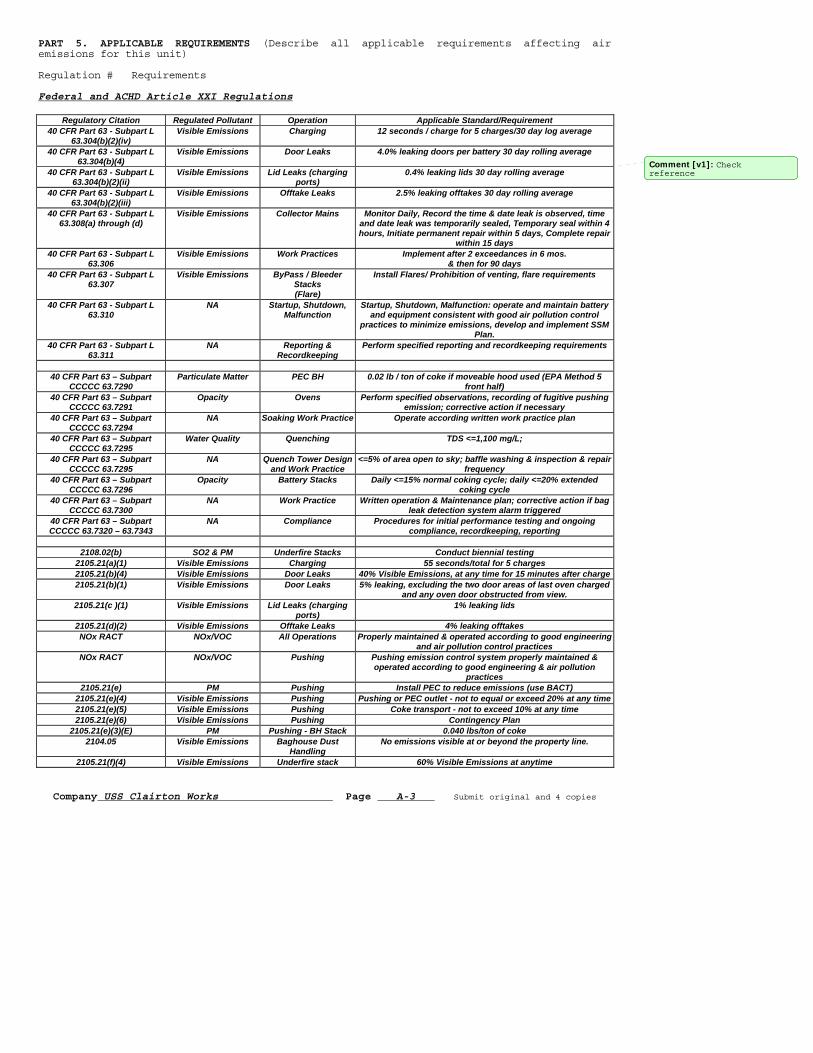
Company USS Clairton Works Page A-3 Submit original and 4 copies
PART 5. APPLICABLE REQUIREMENTS (Describe all applicable requirements affecting air emissions for this unit) Regulation # Requirements Federal and ACHD Article XXI Regulations
Regulatory Citation Regulated Pollutant Operation Applicable Standard/Requirement 40 CFR Part 63 - Subpart L
63.304(b)(2)(iv) Visible Emissions Charging 12 seconds / charge for 5 charges/30 day log average
40 CFR Part 63 - Subpart L 63.304(b)(4)
Visible Emissions Door Leaks 4.0% leaking doors per battery 30 day rolling average
40 CFR Part 63 - Subpart L 63.304(b)(2)(ii)
Visible Emissions Lid Leaks (charging ports)
0.4% leaking lids 30 day rolling average
40 CFR Part 63 - Subpart L 63.304(b)(2)(iii)
Visible Emissions Offtake Leaks 2.5% leaking offtakes 30 day rolling average
40 CFR Part 63 - Subpart L 63.308(a) through (d)
Visible Emissions Collector Mains Monitor Daily, Record the time & date leak is observed, time and date leak was temporarily sealed, Temporary seal within 4 hours, Initiate permanent repair within 5 days, Complete repair
within 15 days 40 CFR Part 63 - Subpart L
63.306 Visible Emissions Work Practices Implement after 2 exceedances in 6 mos.
& then for 90 days 40 CFR Part 63 - Subpart L
63.307 Visible Emissions ByPass / Bleeder
Stacks (Flare)
Install Flares/ Prohibition of venting, flare requirements
40 CFR Part 63 - Subpart L 63.310
NA Startup, Shutdown, Malfunction
Startup, Shutdown, Malfunction: operate and maintain battery and equipment consistent with good air pollution control
practices to minimize emissions, develop and implement SSM Plan.
40 CFR Part 63 - Subpart L 63.311
NA Reporting & Recordkeeping
Perform specified reporting and recordkeeping requirements
40 CFR Part 63 – Subpart
CCCCC 63.7290 Particulate Matter PEC BH 0.02 lb / ton of coke if moveable hood used (EPA Method 5
front half) 40 CFR Part 63 – Subpart
CCCCC 63.7291 Opacity Ovens Perform specified observations, recording of fugitive pushing
emission; corrective action if necessary 40 CFR Part 63 – Subpart
CCCCC 63.7294 NA Soaking Work Practice Operate according written work practice plan
40 CFR Part 63 – Subpart CCCCC 63.7295
Water Quality Quenching TDS <=1,100 mg/L;
40 CFR Part 63 – Subpart CCCCC 63.7295
NA Quench Tower Design and Work Practice
<=5% of area open to sky; baffle washing & inspection & repair frequency
40 CFR Part 63 – Subpart CCCCC 63.7296
Opacity Battery Stacks Daily <=15% normal coking cycle; daily <=20% extended coking cycle
40 CFR Part 63 – Subpart CCCCC 63.7300
NA Work Practice Written operation & Maintenance plan; corrective action if bag leak detection system alarm triggered
40 CFR Part 63 – Subpart CCCCC 63.7320 – 63.7343
NA Compliance Procedures for initial performance testing and ongoing compliance, recordkeeping, reporting
2108.02(b) SO2 & PM Underfire Stacks Conduct biennial testing
2105.21(a)(1) Visible Emissions Charging 55 seconds/total for 5 charges 2105.21(b)(4) Visible Emissions Door Leaks 40% Visible Emissions, at any time for 15 minutes after charge 2105.21(b)(1) Visible Emissions Door Leaks 5% leaking, excluding the two door areas of last oven charged
and any oven door obstructed from view. 2105.21(c )(1) Visible Emissions Lid Leaks (charging
ports) 1% leaking lids
2105.21(d)(2) Visible Emissions Offtake Leaks 4% leaking offtakes NOx RACT NOx/VOC All Operations Properly maintained & operated according to good engineering
and air pollution control practices NOx RACT NOx/VOC Pushing Pushing emission control system properly maintained &
operated according to good engineering & air pollution practices
2105.21(e) PM Pushing Install PEC to reduce emissions (use BACT) 2105.21(e)(4) Visible Emissions Pushing Pushing or PEC outlet - not to equal or exceed 20% at any time 2105.21(e)(5) Visible Emissions Pushing Coke transport - not to exceed 10% at any time 2105.21(e)(6) Visible Emissions Pushing Contingency Plan
2105.21(e)(3)(E) PM Pushing - BH Stack 0.040 lbs/ton of coke 2104.05 Visible Emissions Baghouse Dust
Handling No emissions visible at or beyond the property line.
2105.21(f)(4) Visible Emissions Underfire stack 60% Visible Emissions at anytime
Comment [v1]: Check reference

Company USS Clairton Works Page A-4 Submit original and 4 copies
2105.21(f)(3) Visible Emissions Underfire stack 20% Visible Emissions 3 mins/hr 2105.21(f)(1) Particulate Underfire stack 0.015 grains/ DSCF 2105.21(g) NA Quenching Coke must be quenched through a baffled tower and water
must be of the same quality as the nearest stream or from the nearest stream
2104.03(c ) SO2 Underfire stack 500 ppm (vol dry) in effluent gas 2108.03(b) NOx Underfire stack Install & operate continuous NOx emission monitor
2109.03 Visible Emissions Underfire stack Install & operate Continuous Opacity Monitor 2105.21(h)(2) H2S COG Combustion H2S must be less than 10 gr/100 dcf
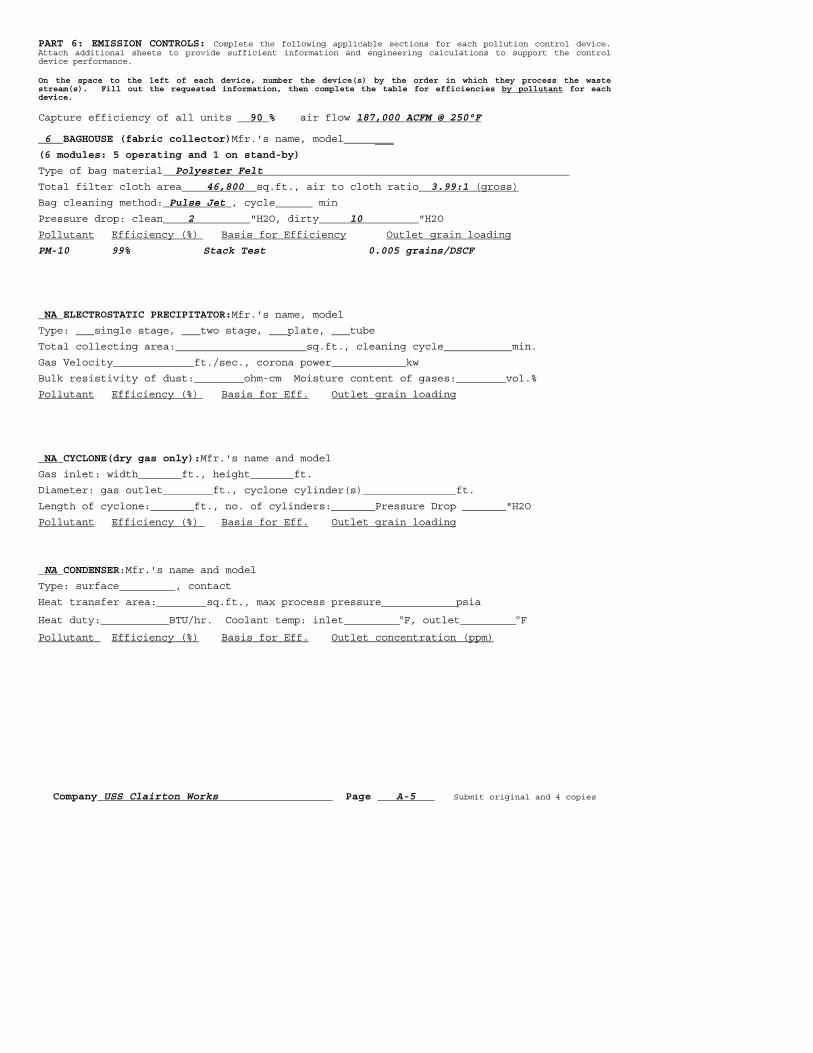
Company USS Clairton Works Page A-5 Submit original and 4 copies
PART 6: EMISSION CONTROLS: Complete the following applicable sections for each pollution control device. Attach additional sheets to provide sufficient information and engineering calculations to support the control device performance. On the space to the left of each device, number the device(s) by the order in which they process the waste stream(s). Fill out the requested information, then complete the table for efficiencies by pollutant for each device. Capture efficiency of all units 90 % air flow 187,000 ACFM @ 250°F 6 BAGHOUSE (fabric collector)Mfr.'s name, model ___
(6 modules: 5 operating and 1 on stand-by)
Type of bag material Polyester Felt
Total filter cloth area 46,800 sq.ft., air to cloth ratio 3.99:1 (gross)
Bag cleaning method: Pulse Jet , cycle min
Pressure drop: clean 2 "H2O, dirty 10 "H2O
Pollutant Efficiency (%) Basis for Efficiency Outlet grain loading
PM-10 99% Stack Test 0.005 grains/DSCF
NA ELECTROSTATIC PRECIPITATOR:Mfr.'s name, model
Type: single stage, two stage, plate, tube
Total collecting area: sq.ft., cleaning cycle min.
Gas Velocity ft./sec., corona power kw
Bulk resistivity of dust: ohm-cm Moisture content of gases: vol.%
Pollutant Efficiency (%) Basis for Eff. Outlet grain loading
NA CYCLONE(dry gas only):Mfr.'s name and model
Gas inlet: width ft., height ft.
Diameter: gas outlet ft., cyclone cylinder(s) ft.
Length of cyclone: ft., no. of cylinders: Pressure Drop "H2O
Pollutant Efficiency (%) Basis for Eff. Outlet grain loading
NA CONDENSER:Mfr.'s name and model
Type: surface , contact
Heat transfer area: sq.ft., max process pressure psia
Heat duty: BTU/hr. Coolant temp: inlet °F, outlet °F
Pollutant Efficiency (%) Basis for Eff. Outlet concentration (ppm)
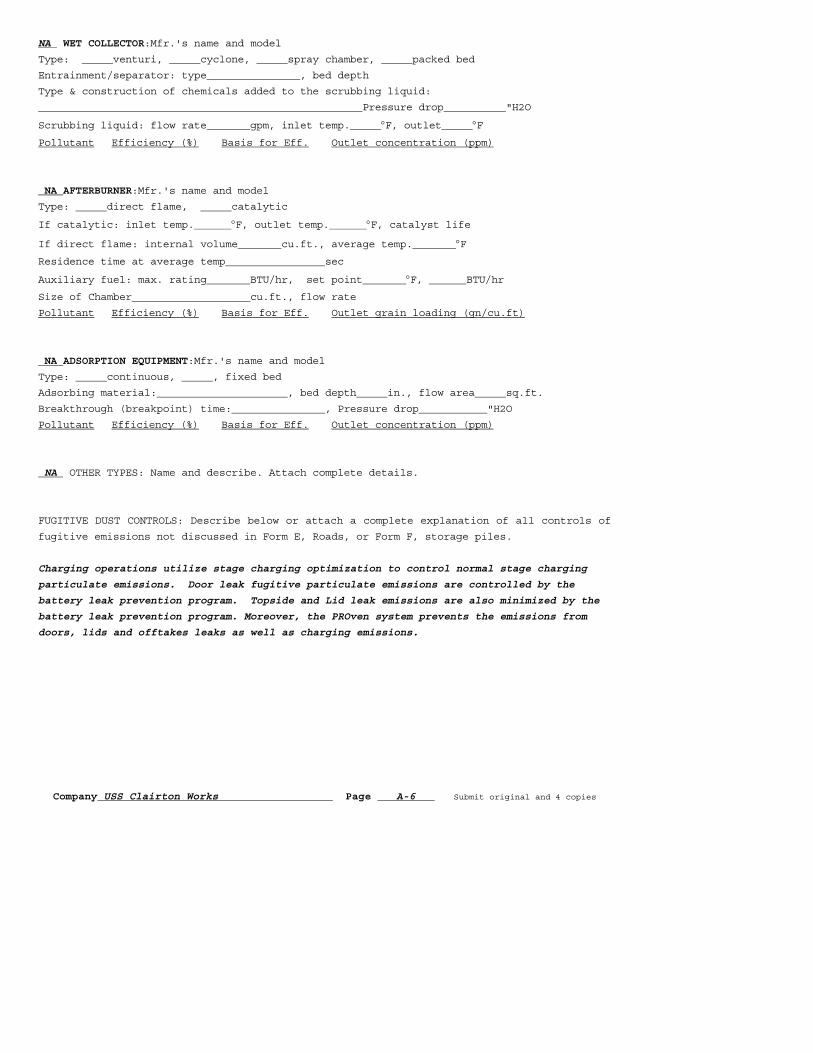
Company USS Clairton Works Page A-6 Submit original and 4 copies
NA WET COLLECTOR:Mfr.'s name and model
Type: venturi, cyclone, spray chamber, packed bed
Entrainment/separator: type , bed depth
Type & construction of chemicals added to the scrubbing liquid:
Pressure drop "H2O
Scrubbing liquid: flow rate gpm, inlet temp. °F, outlet °F
Pollutant Efficiency (%) Basis for Eff. Outlet concentration (ppm)
NA AFTERBURNER:Mfr.'s name and model
Type: direct flame, catalytic
If catalytic: inlet temp. °F, outlet temp. °F, catalyst life
If direct flame: internal volume cu.ft., average temp. °F
Residence time at average temp sec
Auxiliary fuel: max. rating BTU/hr, set point °F, BTU/hr
Size of Chamber cu.ft., flow rate
Pollutant Efficiency (%) Basis for Eff. Outlet grain loading (gn/cu.ft)
NA ADSORPTION EQUIPMENT:Mfr.'s name and model
Type: continuous, , fixed bed
Adsorbing material: , bed depth in., flow area sq.ft.
Breakthrough (breakpoint) time: , Pressure drop "H2O
Pollutant Efficiency (%) Basis for Eff. Outlet concentration (ppm)
NA OTHER TYPES: Name and describe. Attach complete details.
FUGITIVE DUST CONTROLS: Describe below or attach a complete explanation of all controls of
fugitive emissions not discussed in Form E, Roads, or Form F, storage piles.
Charging operations utilize stage charging optimization to control normal stage charging
particulate emissions. Door leak fugitive particulate emissions are controlled by the
battery leak prevention program. Topside and Lid leak emissions are also minimized by the
battery leak prevention program. Moreover, the PROven system prevents the emissions from
doors, lids and offtakes leaks as well as charging emissions.

Company USS Clairton Works Page A-7 Submit original and 4 copies
PART 7. STACK DATA: Stack data must be provided for each flue, duct, pipe, stack, chimney or conduit (stacks) at which collected emissions are vented to open air through a restricted opening.
Stack Identification: C Battery Combustion Stack (S046) UTM East UTM North or Longitude 79°52’23.62” Latitude 40°18’15.16” Most important stacks have been located on topographic or air navigation charts. If you
know the UTM coordinates or latitude and longitude, provide this information. If there is a number of stacks close together, a common location may be used.
Stack Height: 322.0 ft Ground level elevation: 760 ft Diameter 12 ft. inner at top Material Outer: concrete Lining: Exit Temperature (F): 446 Exit Velocity: 19.06 (f/s) Exhaust Rate: 124,202 (ACFM) % Moisture 19.93 Nearest building to stack: (C battery)distance 365 ft height 50’8” at larry car rails ft top of coal bunker is 201’ above grade length 490 ft width 57 ft Processes Sharing Stack: If more than one process shares a stack, list them and
estimate relative contribution of each. Description NA Contribution to emissions from stack: % Description NA Contribution to emissions from stack: % Description NA Contribution to emissions from stack: %

Company USS Clairton Works Page A-8 Submit original and 4 copies
PART 7. STACK DATA: Stack data must be provided for each flue, duct, pipe, stack, chimney or conduit (stacks) at which collected emissions are vented to open air through a restricted opening.
Stack Identification: Battery C PEC System Baghouse Stacks (S047) (6 modules; 5 running; 1 standby) UTM East UTM North or Longitude 79°52’26.12” Latitude40°18’11.91” Most important stacks have been located on topographic or air navigation charts. If you
know the UTM coordinates or latitude and longitude, provide this information. If there is a number of stacks close together, a common location may be used.
Stack Height: Unknown ft Ground level elevation: 760 ft Diameter Unknown ft. (each) Material Outer: Unknown Lining: Unknown Exit Temperature (F): 250 Exit Velocity: (f/s) Exhaust Rate: 187,000 (ACFM) % Moisture __________ Nearest building to stack: distance 495 ft height ft length UK ft width UK ft Processes Sharing Stack: If more than one process shares a stack, list them and
estimate relative contribution of each. Description NA Contribution to emissions from stack: % Description NA Contribution to emissions from stack: % Description NA Contribution to emissions from stack: % PART 8. Remarks Attach calculations and reference all emission factors for Allowable, Potential to Emit, and Actual emissions to this sheet. Reference all emission factors and efficiencies of control equipment. SEE ANNUAL AIR EMISSION INVENTORY REPORT Note: It is possible that there are additional Title V regulated air pollutants in the
emission relating to this source; however, an applicable requirement for such pollutant(s) does not exist.
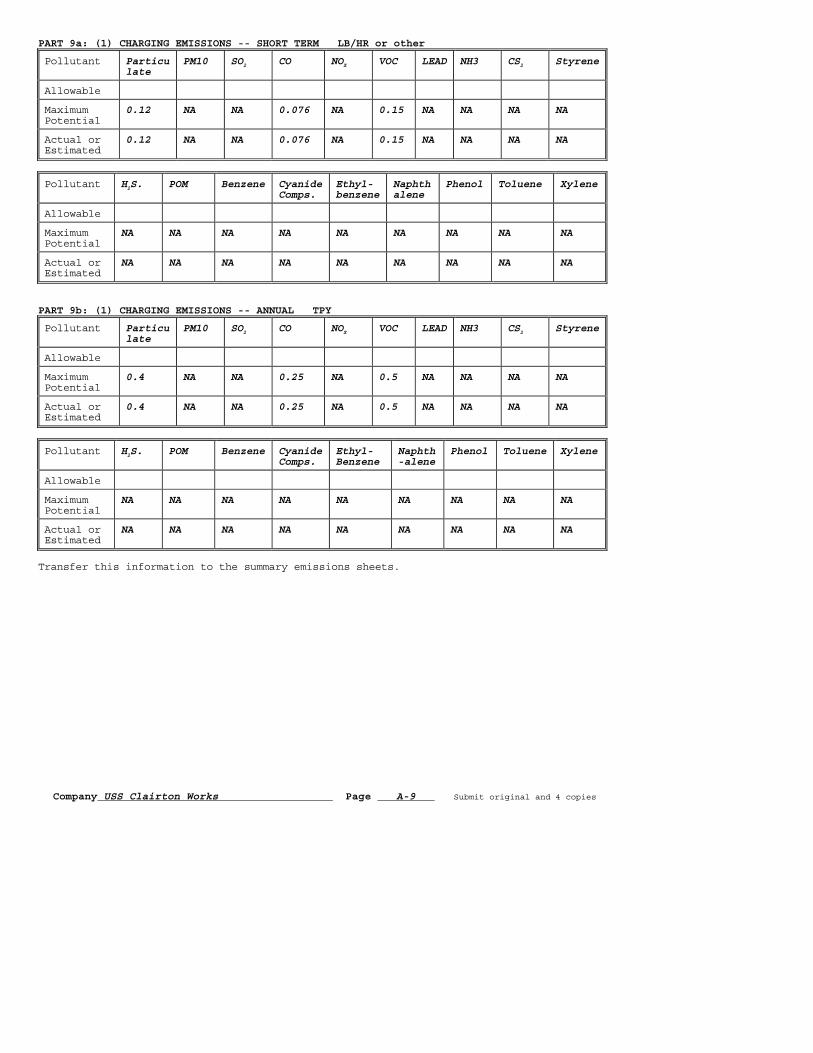
Company USS Clairton Works Page A-9 Submit original and 4 copies
PART 9a: (1) CHARGING EMISSIONS -- SHORT TERM LB/HR or other
Pollutant Particulate
PM10
SO2 CO NOX VOC LEAD NH3 CS2 Styrene
Allowable
Maximum Potential
0.12 NA NA 0.076 NA 0.15 NA NA NA NA
Actual or Estimated
0.12 NA NA 0.076 NA 0.15 NA NA NA NA
Pollutant H2S. POM Benzene Cyanide Comps.
Ethyl-benzene
Naphthalene
Phenol Toluene Xylene
Allowable
Maximum Potential
NA NA NA NA NA NA NA NA NA
Actual or Estimated
NA NA NA NA NA NA NA NA NA
PART 9b: (1) CHARGING EMISSIONS -- ANNUAL TPY
Pollutant Particulate
PM10
SO2 CO NOX VOC LEAD NH3 CS2 Styrene
Allowable
Maximum Potential
0.4 NA NA 0.25 NA 0.5 NA NA NA NA
Actual or Estimated
0.4 NA NA 0.25 NA 0.5 NA NA NA NA
Pollutant H2S. POM Benzene Cyanide Comps.
Ethyl-Benzene
Naphth-alene
Phenol Toluene Xylene
Allowable
Maximum Potential
NA NA NA NA NA NA NA NA NA
Actual or Estimated
NA NA NA NA NA NA NA NA NA
Transfer this information to the summary emissions sheets.

Company USS Clairton Works Page A-10 Submit original and 4 copies
PART 9a: (2) DOOR LEAKS EMISSIONS -- SHORT TERM LB/HR or other
Pollutant Particulate
PM10
SO2 CO NOX VOC LEAD NH3 CS2 Styrene
Allowable
Maximum Potential
1.46 NA NA 0.88 NA 1.76 NA NA NA NA
Actual or Estimated
1.46 NA NA 0.88 NA 1.76 NA NA NA NA
Pollutant H2S. POM Benzene Cyanide Comps.
Ethyl-Benzene
Naphth-alene
Phenol Toluene Xylene
Allowable
Maximum Potential
NA NA NA NA NA NA NA NA NA
Actual or Estimated
NA NA NA NA NA NA NA NA NA
PART 9b: (2) DOOR LEAKS EMISSIONS -- ANNUAL TPY
Pollutant Particulate
PM10
SO2 CO NOX VOC LEAD NH3 CS2 Styrene
Allowable
Maximum Potential
4.8 NA NA 2.9 NA 5.8 NA NA NA NA
Actual or Estimated
4.8 NA NA 2.9 NA 5.8 NA NA NA NA
Pollutant H2S. POM Benzene Cyanide Comps.
Ethyl-Benzene
Naphth-alene
Phenol Toluene Xylene
Allowable
Maximum Potential
NA NA NA NA NA NA NA NA NA
Actual or Estimated
NA NA NA NA NA NA NA NA NA
Transfer this information to the summary emissions sheets.

Company USS Clairton Works Page A-11 Submit original and 4 copies
PART 9a: (3) LID LEAKS EMISSIONS -- SHORT TERM LB/HR or other
Pollutant Particulate
PM10
SO2 CO NOX VOC LEAD
NH3 CS2 Styrene
Allowable
Maximum Potential
0.018 NA NA 0.012 NA 0.027 NA NA NA NA
Actual or Estimated
0.018 NA NA 0.012 NA 0.027 NA NA NA NA
Pollutant H2S. POM Benzene Cyanide Comps.
Ethyl-Benzene
Naphth-alene
Phenol Toluene Xylene
Allowable
Maximum Potential
NA NA NA NA NA NA NA NA NA
Actual or Estimated
NA NA NA NA NA NA NA NA NA
PART 9b: (3) LID LEAKS EMISSIONS -- ANNUAL TPY
Pollutant Particulate
PM10
SO2 CO NOX VOC LEAD NH3 CS2 Styrene
Allowable
Maximum Potential
0.06 NA NA 0.04 NA 0.09 NA NA NA NA
Actual or Estimated
0.06 NA NA 0.04 NA 0.09 NA NA NA NA
Pollutant H2S. POM Benzene Cyanide Comps.
Ethyl-Benzene
Naphth-alene
Phenol Toluene Xylene
Allowable
Maximum Potential
NA NA NA NA NA NA NA NA NA
Actual or Estimated
NA NA NA NA NA NA NA NA NA
Transfer this information to the summary emissions sheets.

Company USS Clairton Works Page A-12 Submit original and 4 copies
PART 9a: (4) OFFTAKE LEAKS EMISSIONS -- SHORT TERM LB/HR or other
Pollutant Particulate
PM10
SO2 CO NOX VOC LEAD NH3 CS2 Styrene
Allowable
Maximum Potential
0.03 NA NA 0.03 NA 0.04 NA NA NA NA
Actual or Estimated
0.03 NA NA 0.03 NA 0.04 NA NA NA NA
Pollutant H2S. POM Benzene Cyanide Comps.
Ethyl-Benzene
Naphth-alene
Phenol Toluene Xylene
Allowable
Maximum Potential
NA NA NA NA NA NA NA NA NA
Actual or Estimated
NA NA NA NA NA NA NA NA NA
PART 9b: (4) OFFTAKE LEAKS EMISSIONS -- ANNUAL TPY
Pollutant Particulate
PM10
SO2 CO NOX VOC LEAD NH3 CS2 Styrene
Allowable
Maximum Potential
0.1 NA NA 0.1 NA 0.13 NA NA NA NA
Actual or Estimated
0.1 NA NA 0.1 NA 0.13 NA NA NA NA
Pollutant H2S. POM Benzene Cyanide Comps.
Ethyl-Benzene
Naphth-alene
Phenol Toluene Xylene
Allowable
Maximum Potential
NA NA NA NA NA NA NA NA NA
Actual or Estimated
NA NA NA NA NA NA NA NA NA
Transfer this information to the summary emissions sheets.

Company USS Clairton Works Page A-13 Submit original and 4 copies
PART 9a: (5) SOAKING EMISSIONS -- SHORT TERM LB/HR or other
Pollutant Particulate
PM10
SO2 CO NOX VOC LEAD H2S
Allowable
Maximum Potential
1.43 NA 9.44 NA 0.09 0.55 NA NA NA NA
Actual or Estimated
1.43 NA 9.44 NA 0.09 0.55 NA NA NA NA
Pollutant
Allowable
Maximum Potential
NA NA NA NA NA NA NA NA NA
Actual or Estimated
NA NA NA NA NA NA NA NA NA
PART 9b: (5) SOAKING EMISSIONS -- ANNUAL TPY
Pollutant Particulate
PM10
SO2 CO NOX VOC LEAD H2S
Allowable
Maximum Potential
4.7 NA 31.029
NA 0.313 1.8 NA NA NA NA
Actual or Estimated
4.7 NA 31.029
NA 0.313 1.8 NA NA NA NA
Pollutant
Allowable
Maximum Potential
NA NA NA NA NA NA NA NA NA
Actual or Estimated
NA NA NA NA NA NA NA NA NA
List all known pollutants, including, but not limited to those found under Article XXI section 2103.10 and the definition of Hazardous Air Pollutants. Transfer this information to the summary emissions sheets.
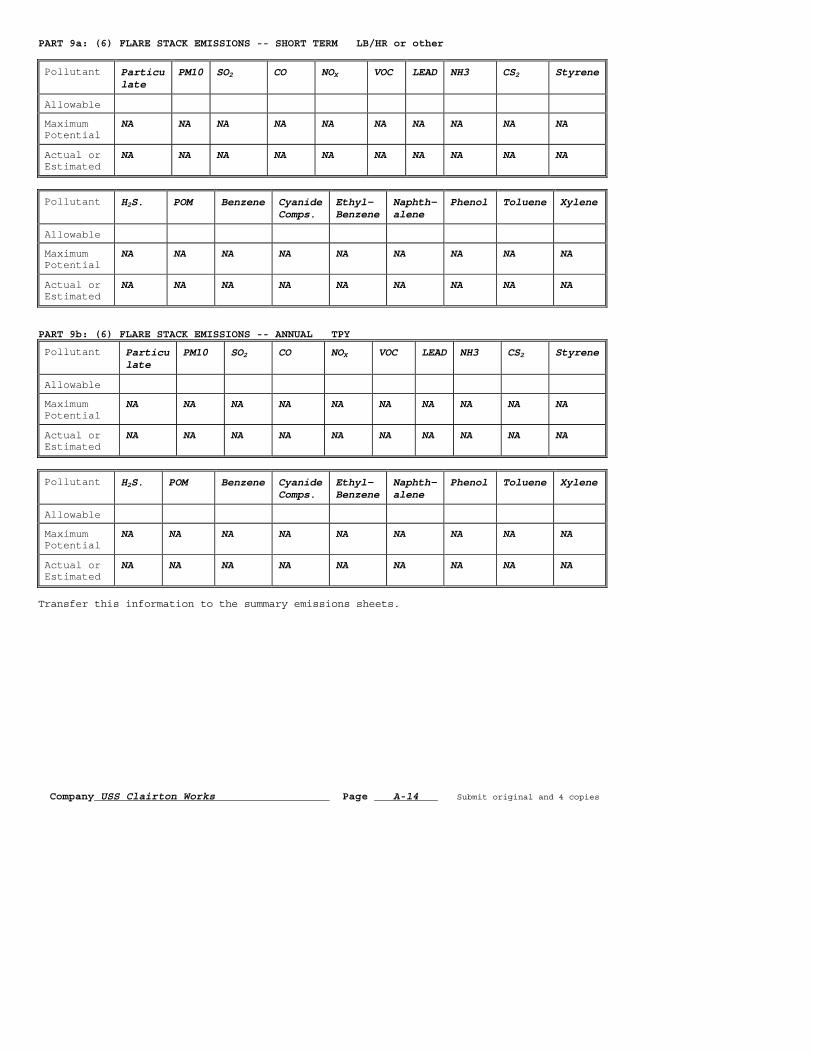
Company USS Clairton Works Page A-14 Submit original and 4 copies
PART 9a: (6) FLARE STACK EMISSIONS -- SHORT TERM LB/HR or other
Pollutant Particulate
PM10
SO2 CO NOX VOC LEAD NH3 CS2 Styrene
Allowable
Maximum Potential
NA NA NA NA NA NA NA NA NA NA
Actual or Estimated
NA NA NA NA NA NA NA NA NA NA
Pollutant H2S. POM Benzene Cyanide Comps.
Ethyl-Benzene
Naphth-alene
Phenol Toluene Xylene
Allowable
Maximum Potential
NA NA NA NA NA NA NA NA NA
Actual or Estimated
NA NA NA NA NA NA NA NA NA
PART 9b: (6) FLARE STACK EMISSIONS -- ANNUAL TPY
Pollutant Particulate
PM10
SO2 CO NOX VOC LEAD NH3 CS2 Styrene
Allowable
Maximum Potential
NA NA NA NA NA NA NA NA NA NA
Actual or Estimated
NA NA NA NA NA NA NA NA NA NA
Pollutant H2S. POM Benzene Cyanide Comps.
Ethyl-Benzene
Naphth-alene
Phenol Toluene Xylene
Allowable
Maximum Potential
NA NA NA NA NA NA NA NA NA
Actual or Estimated
NA NA NA NA NA NA NA NA NA
Transfer this information to the summary emissions sheets.

Company USS Clairton Works Page A-15 Submit original and 4 copies
PART 9a: (7) UNDERFIRE STACK EMISSIONS -- SHORT TERM LB/HR or other
Pollutant Particulate
PM10
SO2 CO NOX VOC LEAD NH3 CS2 Styrene
Allowable
Maximum Potential
5.08 4.8 32.02 97.32 241.9 8.76 NA NA NA NA
Actual or Estimated
5.08 4.8 32.02 97.32 241.9 8.76 NA NA NA NA
Pollutant H2S. POM Benzene Cyanide Comps.
Ethyl-Benzene
Naphth-alene
Phenol Toluene Xylene
Allowable
Maximum Potential
NA NA NA NA NA NA NA NA NA
Actual or Estimated
NA NA NA NA NA NA NA NA NA
PART 9b: (7) UNDERFIRE STACK EMISSIONS -- ANNUAL TPY
Pollutant Particulate
PM10
SO2 CO NOX VOC LEAD NH3 CS2 Styrene
Allowable
Maximum Potential
16.7 15.9 105.2 319.7 794.6 28.8 NA NA NA NA
Actual or Estimated
16.7 15.9 105.2 319.7 794.6 28.8 NA NA NA NA
Pollutant H2S POM Benzene Cyanide Comp.
Ethyl-Benzene
Naphth-alene
Phenol Toluene Xylene
Allowable
Maximum Potential
NA NA NA NA NA NA NA NA NA
Actual or Estimated
NA NA NA NA NA NA NA NA NA
Transfer this information to the summary emissions sheets.
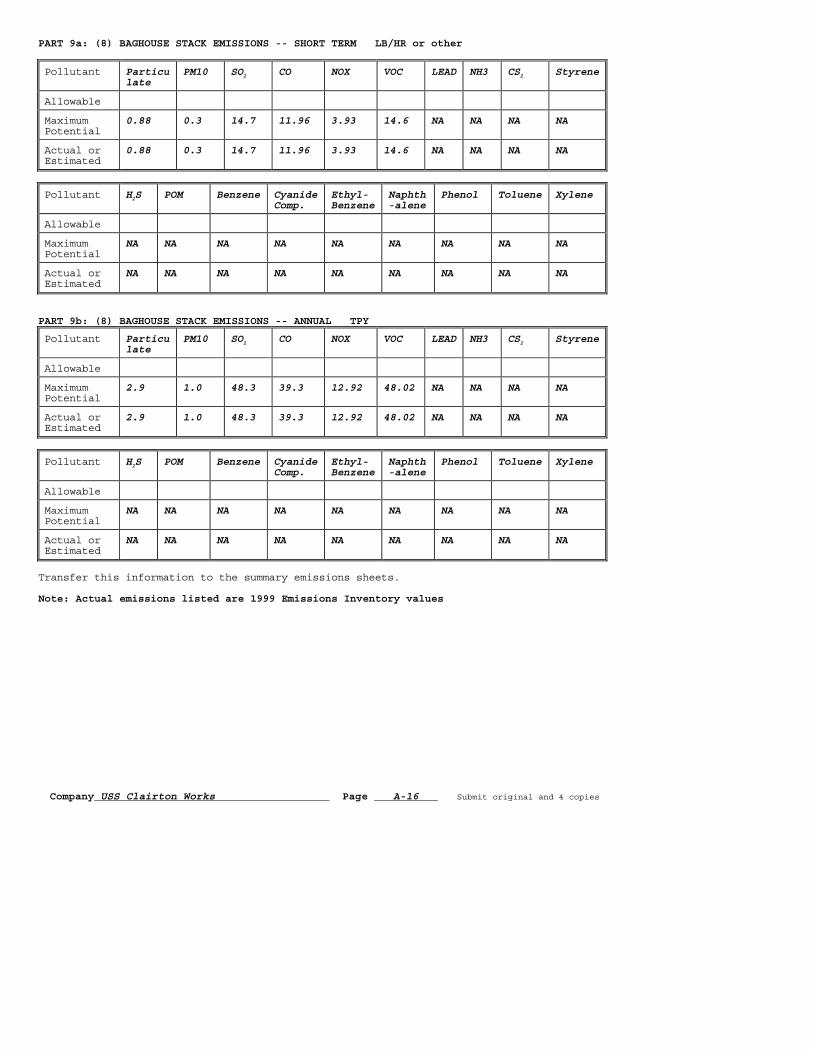
Company USS Clairton Works Page A-16 Submit original and 4 copies
PART 9a: (8) BAGHOUSE STACK EMISSIONS -- SHORT TERM LB/HR or other
Pollutant Particulate
PM10
SO2 CO NOX VOC LEAD NH3 CS2 Styrene
Allowable
Maximum Potential
0.88 0.3 14.7 11.96 3.93 14.6 NA NA NA NA
Actual or Estimated
0.88 0.3 14.7 11.96 3.93 14.6 NA NA NA NA
Pollutant H2S POM Benzene Cyanide Comp.
Ethyl-Benzene
Naphth-alene
Phenol Toluene Xylene
Allowable
Maximum Potential
NA NA NA NA NA NA NA NA NA
Actual or Estimated
NA NA NA NA NA NA NA NA NA
PART 9b: (8) BAGHOUSE STACK EMISSIONS -- ANNUAL TPY
Pollutant Particulate
PM10
SO2 CO NOX VOC LEAD NH3 CS2 Styrene
Allowable
Maximum Potential
2.9 1.0 48.3 39.3 12.92 48.02 NA NA NA NA
Actual or Estimated
2.9 1.0 48.3 39.3 12.92 48.02 NA NA NA NA
Pollutant H2S POM Benzene Cyanide Comp.
Ethyl-Benzene
Naphth-alene
Phenol Toluene Xylene
Allowable
Maximum Potential
NA NA NA NA NA NA NA NA NA
Actual or Estimated
NA NA NA NA NA NA NA NA NA
Transfer this information to the summary emissions sheets. Note: Actual emissions listed are 1999 Emissions Inventory values

Company USS Clairton Works Page A-17 Submit original and 4 copies
PART 9a: (9) FUGITIVE PUSHING EMISSIONS -- SHORT TERM LB/HR or other
Pollutant Particulate
PM10
SO2 CO NOX VOC LEAD NH3 CS2 Styrene
Allowable
Maximum Potential
28.5 11.3 0.79 1.43 0.21 1.98 NA NA NA NA
Actual or Estimated
28.5 11.3 0.79 1.43 0.21 1.98 NA NA NA NA
Pollutant H2S POM Benzene Cyanide Comp.
Ethyl-Benzene
Naphth-alene
Phenol Toluene Xylene
Allowable
Maximum Potential
NA NA NA NA NA NA NA NA NA
Actual or Estimated
NA NA NA NA NA NA NA NA NA
PART 9b: (9) FUGITIVE PUSHING EMISSIONS -- ANNUAL TPY
Pollutant Particulate
PM10
SO2 CO NOX VOC LEAD NH3 CS2 Styrene
Allowable
Maximum Potential
93.5 37.1 2.6 4.7 0.7 6.5 NA NA NA NA
Actual or Estimated
93.5 37.1 2.6 4.7 0.7 6.5 NA NA NA NA
Pollutant H2S POM Benzene Cyanide Comp.
Ethyl-Benzene
Naphth-alene
Phenol Toluene Xylene
Allowable
Maximum Potential
NA NA NA NA NA NA NA NA NA
Actual or Estimated
NA NA NA NA NA NA NA NA NA
Transfer this information to the summary emissions sheets.

Company USS Clairton Works Page A-18 Submit original and 4 copies
PART 9a: (10) TRAVELING HOT CAR EMISSIONS -- SHORT TERM LB/HR or other
Pollutant Particulate
PM10
SO2 CO NOX VOC LEAD NH3 CS2 Styrene
Allowable
Maximum Potential
4.84 1.79 8.43 1.79 2.26 NA NA NA NA NA
Actual or Estimated
4.84 1.79 8.43 1.79 2.26 NA NA NA NA NA
Pollutant H2S POM Benzene Cyanide Comp.
Ethyl-Benzene
Naphth-alene
Phenol Toluene Xylene
Allowable
Maximum Potential
NA NA NA NA NA NA NA NA NA
Actual or Estimated
NA NA NA NA NA NA NA NA NA
PART 9b: (10) TRAVELING HOT CAR EMISSIONS -- ANNUAL TPY
Pollutant Particulate
PM10
SO2 CO NOX VOC LEAD NH3 CS2 Styrene
Allowable
Maximum Potential
15.9 5.9 27.7 5.9 7.429 NA NA NA NA NA
Actual or Estimated
15.9 5.9 27.7 5.9 7.429 NA NA NA NA NA
Pollutant H2S POM Benzene Cyanide Comp.
Ethyl-Benzene
Naphth-alene
Phenol Toluene Xylene
Allowable
Maximum Potential
NA NA NA NA NA NA NA NA NA
Actual or Estimated
NA NA NA NA NA NA NA NA NA
Transfer this information to the summary emissions sheets.
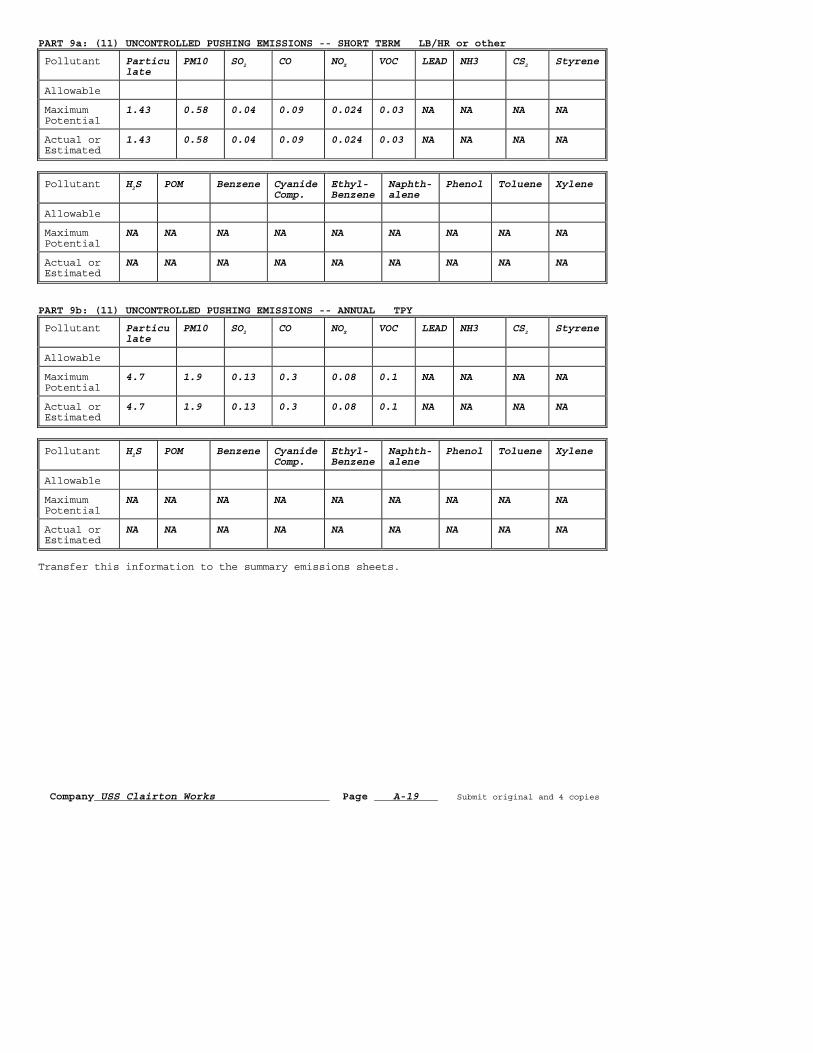
Company USS Clairton Works Page A-19 Submit original and 4 copies
PART 9a: (11) UNCONTROLLED PUSHING EMISSIONS -- SHORT TERM LB/HR or other
Pollutant Particulate
PM10
SO2 CO NOX VOC LEAD NH3 CS2 Styrene
Allowable
Maximum Potential
1.43 0.58 0.04 0.09 0.024 0.03 NA NA NA NA
Actual or Estimated
1.43 0.58 0.04 0.09 0.024 0.03 NA NA NA NA
Pollutant H2S POM Benzene Cyanide Comp.
Ethyl-Benzene
Naphth-alene
Phenol Toluene Xylene
Allowable
Maximum Potential
NA NA NA NA NA NA NA NA NA
Actual or Estimated
NA NA NA NA NA NA NA NA NA
PART 9b: (11) UNCONTROLLED PUSHING EMISSIONS -- ANNUAL TPY
Pollutant Particulate
PM10
SO2 CO NOX VOC LEAD NH3 CS2 Styrene
Allowable
Maximum Potential
4.7 1.9 0.13 0.3 0.08 0.1 NA NA NA NA
Actual or Estimated
4.7 1.9 0.13 0.3 0.08 0.1 NA NA NA NA
Pollutant H2S POM Benzene Cyanide Comp.
Ethyl-Benzene
Naphth-alene
Phenol Toluene Xylene
Allowable
Maximum Potential
NA NA NA NA NA NA NA NA NA
Actual or Estimated
NA NA NA NA NA NA NA NA NA
Transfer this information to the summary emissions sheets.
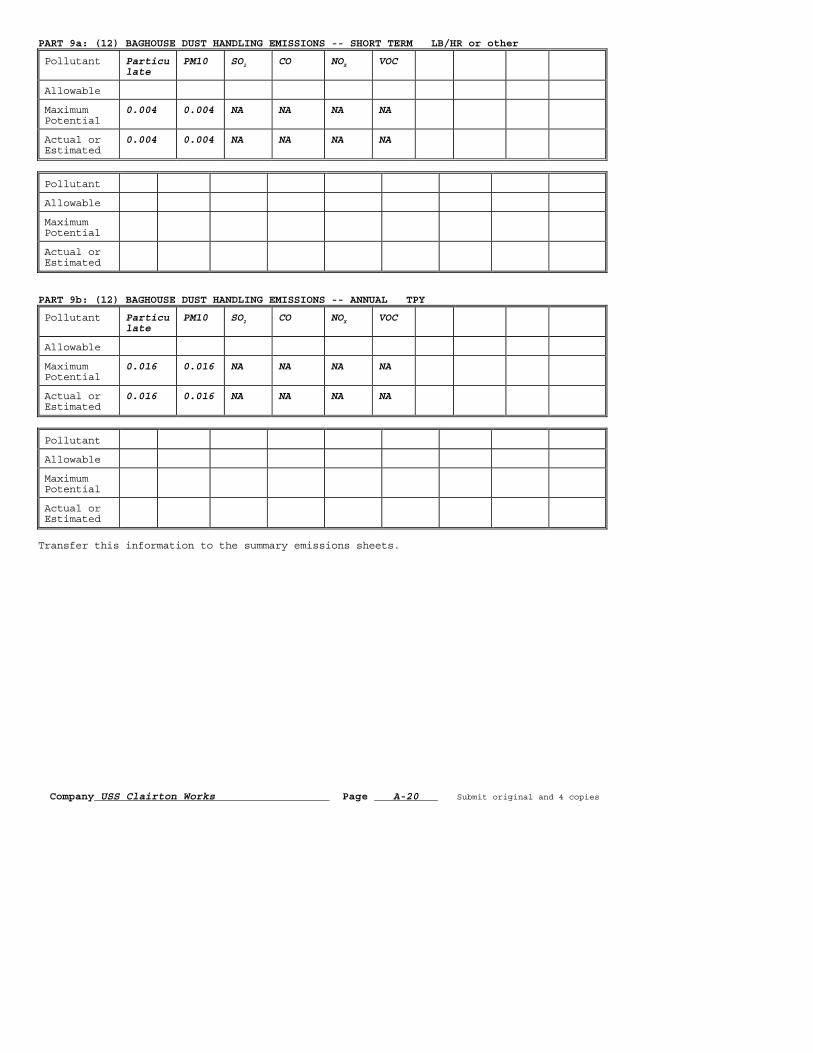
Company USS Clairton Works Page A-20 Submit original and 4 copies
PART 9a: (12) BAGHOUSE DUST HANDLING EMISSIONS -- SHORT TERM LB/HR or other
Pollutant Particulate
PM10
SO2 CO NOX VOC
Allowable
Maximum Potential
0.004 0.004 NA NA NA NA
Actual or Estimated
0.004 0.004 NA NA NA NA
Pollutant
Allowable
Maximum Potential
Actual or Estimated
PART 9b: (12) BAGHOUSE DUST HANDLING EMISSIONS -- ANNUAL TPY
Pollutant Particulate
PM10
SO2 CO NOX VOC
Allowable
Maximum Potential
0.016 0.016 NA NA NA NA
Actual or Estimated
0.016 0.016 NA NA NA NA
Pollutant
Allowable
Maximum Potential
Actual or Estimated
Transfer this information to the summary emissions sheets.
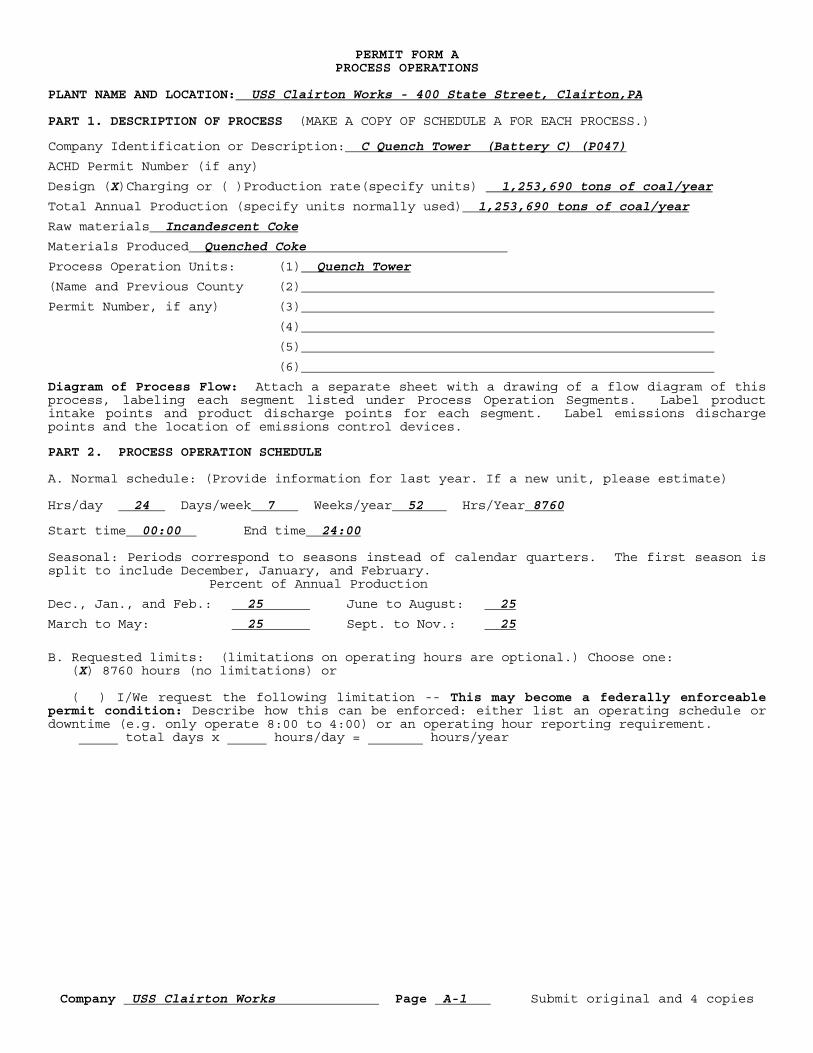
Company USS Clairton Works Page A-1 Submit original and 4 copies
PERMIT FORM A PROCESS OPERATIONS
PLANT NAME AND LOCATION: USS Clairton Works - 400 State Street, Clairton,PA PART 1. DESCRIPTION OF PROCESS (MAKE A COPY OF SCHEDULE A FOR EACH PROCESS.) Company Identification or Description: C Quench Tower (Battery C) (P047)
ACHD Permit Number (if any)
Design (X)Charging or ( )Production rate(specify units) 1,253,690 tons of coal/year
Total Annual Production (specify units normally used) 1,253,690 tons of coal/year
Raw materials Incandescent Coke
Materials Produced Quenched Coke
Process Operation Units: (1) Quench Tower
(Name and Previous County (2)
Permit Number, if any) (3)
(4)
(5)
(6)
Diagram of Process Flow: Attach a separate sheet with a drawing of a flow diagram of this process, labeling each segment listed under Process Operation Segments. Label product intake points and product discharge points for each segment. Label emissions discharge points and the location of emissions control devices. PART 2. PROCESS OPERATION SCHEDULE A. Normal schedule: (Provide information for last year. If a new unit, please estimate) Hrs/day 24 Days/week 7 Weeks/year 52 Hrs/Year 8760 Start time 00:00 End time 24:00 Seasonal: Periods correspond to seasons instead of calendar quarters. The first season is split to include December, January, and February. Percent of Annual Production
Dec., Jan., and Feb.: 25 June to August: 25
March to May: 25 Sept. to Nov.: 25
B. Requested limits: (limitations on operating hours are optional.) Choose one: (X) 8760 hours (no limitations) or ( ) I/We request the following limitation -- This may become a federally enforceable permit condition: Describe how this can be enforced: either list an operating schedule or downtime (e.g. only operate 8:00 to 4:00) or an operating hour reporting requirement. _____ total days x _____ hours/day = _______ hours/year

Company USS Clairton Works Page A-2 Submit original and 4 copies
PART 3. FUELS A. Normal Operation (Provide information for last year. If a new unit, please estimate)
NA ( )YEAR or ( )Estimate Primary Secondary Other Other Type:
Max amount/hour
Sulfur content (%wt):
Ash content (%wt):
BTU Rating (specify units)
Annual Fuel Consumption
Seasonal Fuel Consumption (%):
Dec-Feb
Mar-May
Jun-Aug
Sep-Nov
Fuel Mixing: If more than one fuel is used, explain usage, stating whether it is burned separately, mixed in a fixed ratio of : (give units such as BTU, mmcf, gallons per ton, etc.), mixed in a variable ratio of to , determined by (give reason). B. Requested limits (limitations on operations are optional, but may allow a major
source to be exempted from some requirements) These may become permit conditions. Please check one:
( ) full use of any fuel or combination at any time (no limitations) ( ) the following limitations on types of fuels or the combination of fuels (describe
how compliance with this method will be demonstrated) PART 4. OTHER LIMITATIONS Identify any other requested limitations, such as on production rates or materials use. Describe how compliance with these restrictions will be demonstrated. These limitations may become permit conditions. NA

Company USS Clairton Works Page A-3 Submit original and 4 copies
PART 5. APPLICABLE REQUIREMENTS (Describe all applicable requirements affecting air emissions for this unit) Regulation # Requirements ACHD Article XXI Regulations 2105.21(g) Coke Ovens and Coke Oven Gas (quenching emissions are vented through a
baffled quench tower; the water used for quenching is equivalent or better than the water quality standards established for the nearest stream or river…except that the river from the nearest stream or river may be used for quenching of coke. The nearest stream or river to the USX Corporation facility in Clairton, PA, shall be the Monongahela River.) The compliance certification contained in this application is based on the understanding that make-up water used for the quenching of coke “will be equivalent to, or better than, the water quality standards established for the Monongahela River by regulations promulgated by the DEP under the Pennsylvania Clean Streams Law, … except that water from the Monongahela River may be used” for such quenching make-up.
2109.03 Enforcement Orders (facility is required to comply with Enforcement Orders) NESHAPS 40CFR63.7295 63.7295(a)(1)(i) The concentration of total dissolved solids (TDS) in the water used for
quenching must not exceed 1,100 milligrams per liter (mg/L); or 63.7295(a)(1)(ii) The sum of the concentrations of benzene, benzo(a)pyrene, and naphthalene
in the water used for quenching must not exceed the applicable site-specific limit approved by the permitting authority.
63.7295(a)(2) You must use acceptable makeup water, as defined in §63.7352, as makeup water for quenching.
63.7295 (b) For each quench tower at a new or existing coke oven battery and each backup quench station at a new coke oven battery, you must meet each of the requirements in paragraphs (b)(1) through (4) of this section.
63.7295 (b) (1) You must equip each quench tower with baffles such that no more than 5 percent of the cross sectional area of the tower may be uncovered or open to the sky.
63.7295 (b) (2) You must wash the baffles in each quench tower once each day that the tower is used to quench coke, except as specified in paragraphs (b)(2)(i) and (ii) of this section.
63.7295 (b) (2) (i) You are not required to wash the baffles in a quench tower if the highest measured ambient temperature remains less than 30 degrees Fahrenheit throughout that day (24-hour period). If the measured ambient temperature rises to 30 degrees Fahrenheit or more during the day, you must resume daily washing according to the schedule in your operation and maintenance plan.
63.7295 (b) (2) (ii) You must continuously record the ambient temperature on days that the baffles were not washed.
63.7295 (b) (3) You must inspect each quench tower monthly for damaged or missing baffles and blockage.
63.7295 (b) (4) You must initiate repair or replacement of damaged or missing baffles within 30 days and complete as soon as practicable.
63.7295 (c) As provided in §63.6(g), you may request to use an alternative to the work practice standards in paragraph (b) of this section.
ACHD Permits Permit 78-I-0083-P (not yet issued) Enforcement Orders Enforcement Order dated 3/28/90, Item 1.d. Reporting requirements for quenching with
contaminated water. Second Consent Decree: Compliance requirement as referenced on page 15 in paragraph
V.G.(vent quenching emissions through a baffled quench tower). Reporting requirements as referenced on page 38 in paragraph XIII.A.5.(reporting of quenching in violation of paragraph V.G.).
PART 6: EMISSION CONTROLS: Complete the following applicable sections for each pollution control device. Attach additional sheets to provide sufficient information and engineering calculations to support the control device performance.
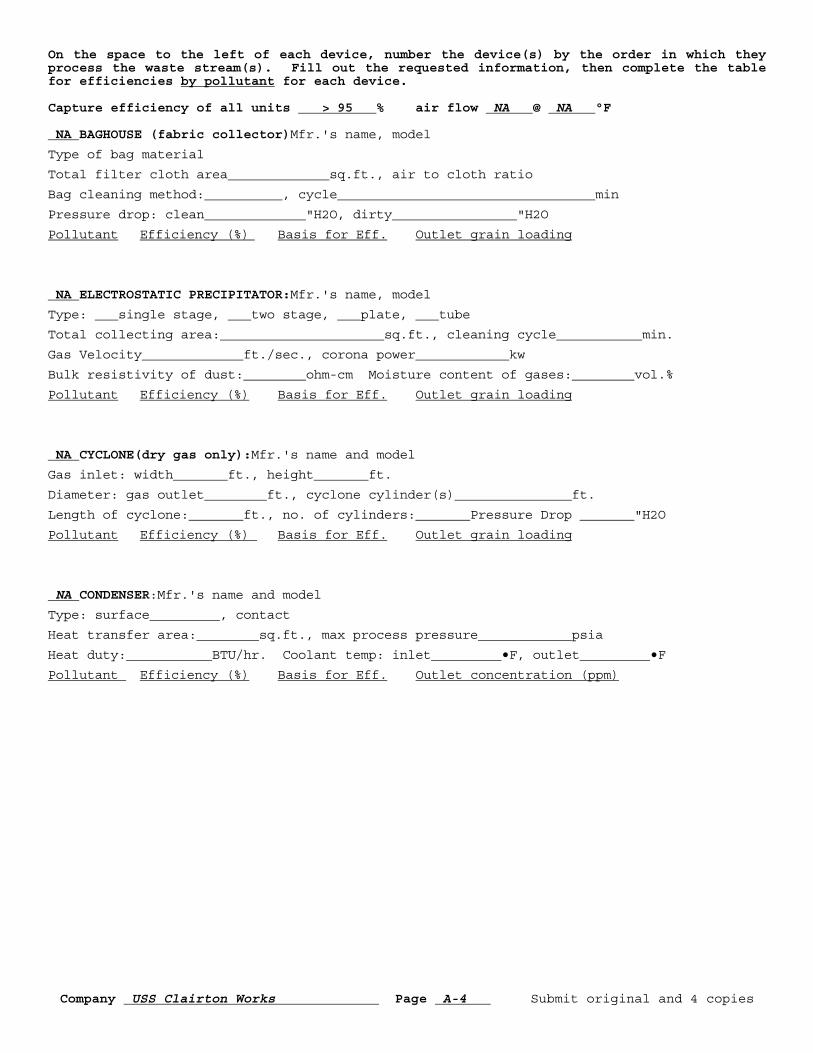
Company USS Clairton Works Page A-4 Submit original and 4 copies
On the space to the left of each device, number the device(s) by the order in which they process the waste stream(s). Fill out the requested information, then complete the table for efficiencies by pollutant for each device. Capture efficiency of all units > 95 % air flow NA @ NA °F NA BAGHOUSE (fabric collector)Mfr.'s name, model
Type of bag material
Total filter cloth area sq.ft., air to cloth ratio
Bag cleaning method: , cycle min
Pressure drop: clean "H2O, dirty "H2O
Pollutant Efficiency (%) Basis for Eff. Outlet grain loading
NA ELECTROSTATIC PRECIPITATOR:Mfr.'s name, model
Type: single stage, two stage, plate, tube
Total collecting area: sq.ft., cleaning cycle min.
Gas Velocity ft./sec., corona power kw
Bulk resistivity of dust: ohm-cm Moisture content of gases: vol.%
Pollutant Efficiency (%) Basis for Eff. Outlet grain loading
NA CYCLONE(dry gas only):Mfr.'s name and model
Gas inlet: width ft., height ft.
Diameter: gas outlet ft., cyclone cylinder(s) ft.
Length of cyclone: ft., no. of cylinders: Pressure Drop "H2O
Pollutant Efficiency (%) Basis for Eff. Outlet grain loading
NA CONDENSER:Mfr.'s name and model
Type: surface , contact
Heat transfer area: sq.ft., max process pressure psia
Heat duty: BTU/hr. Coolant temp: inlet •F, outlet •F
Pollutant Efficiency (%) Basis for Eff. Outlet concentration (ppm)
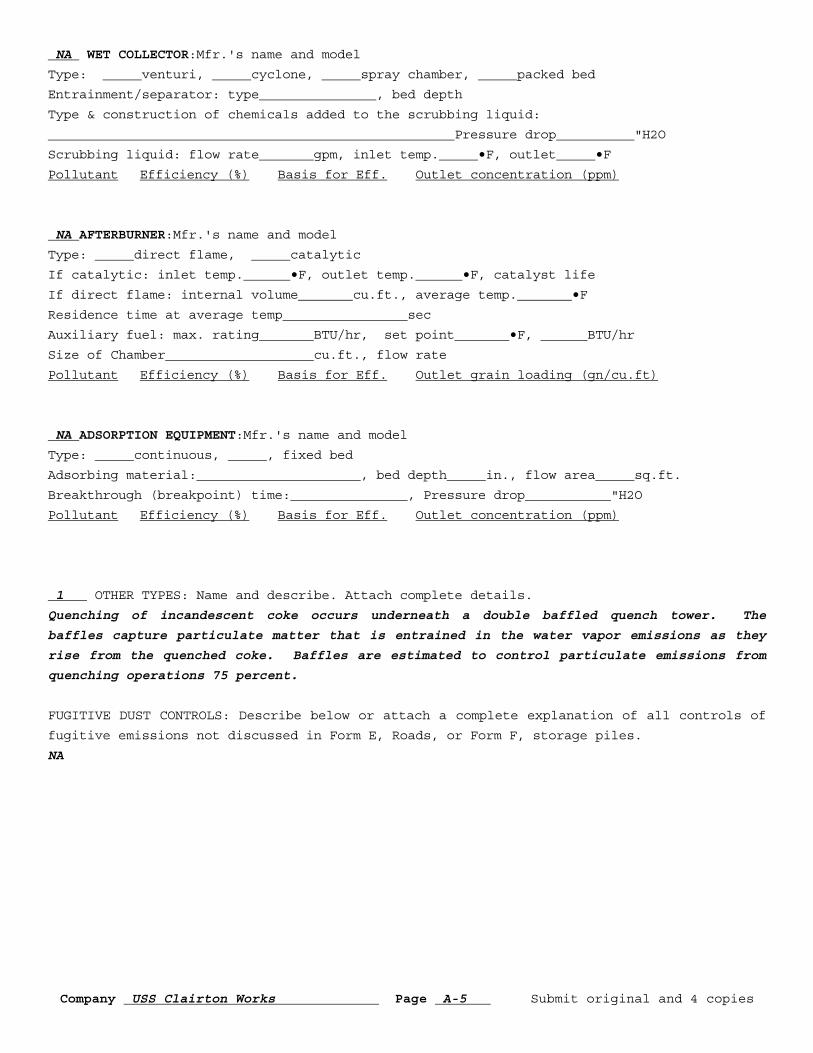
Company USS Clairton Works Page A-5 Submit original and 4 copies
NA WET COLLECTOR:Mfr.'s name and model
Type: venturi, cyclone, spray chamber, packed bed
Entrainment/separator: type , bed depth
Type & construction of chemicals added to the scrubbing liquid:
Pressure drop "H2O
Scrubbing liquid: flow rate gpm, inlet temp. •F, outlet •F
Pollutant Efficiency (%) Basis for Eff. Outlet concentration (ppm)
NA AFTERBURNER:Mfr.'s name and model
Type: direct flame, catalytic
If catalytic: inlet temp. •F, outlet temp. •F, catalyst life
If direct flame: internal volume cu.ft., average temp. •F
Residence time at average temp sec
Auxiliary fuel: max. rating BTU/hr, set point •F, BTU/hr
Size of Chamber cu.ft., flow rate
Pollutant Efficiency (%) Basis for Eff. Outlet grain loading (gn/cu.ft)
NA ADSORPTION EQUIPMENT:Mfr.'s name and model
Type: continuous, , fixed bed
Adsorbing material: , bed depth in., flow area sq.ft.
Breakthrough (breakpoint) time: , Pressure drop "H2O
Pollutant Efficiency (%) Basis for Eff. Outlet concentration (ppm)
1 OTHER TYPES: Name and describe. Attach complete details.
Quenching of incandescent coke occurs underneath a double baffled quench tower. The
baffles capture particulate matter that is entrained in the water vapor emissions as they
rise from the quenched coke. Baffles are estimated to control particulate emissions from
quenching operations 75 percent.
FUGITIVE DUST CONTROLS: Describe below or attach a complete explanation of all controls of
fugitive emissions not discussed in Form E, Roads, or Form F, storage piles.
NA

Company USS Clairton Works Page A-6 Submit original and 4 copies
PART 7. STACK DATA: Stack data must be provided for each flue, duct, pipe, stack, chimney or conduit (stacks) at which collected emissions are vented to open air through a restricted opening. Stack Identification C Battery Quench Tower (S047) UTM East UTM North or Longitude 40°18’13.75” Latitude 79°52’25.7” Most important stacks have been located on topographic or air navigation charts. If you
know the UTM coordinates or latitude and longitude, provide this information. If there is a number of stacks close together, a common location may be used.
Stack Height: 164 ft Ground level elevation: 760 ft Diameter 46 ft by 29.5 ft. Material Outer: Wood baffles: Polypropylene (upper) and stainless steel (lower) Exit Temperature (F): 221 Exit Velocity: 11.5 - 13 (f/s) Exhaust Rate: Unknown (ACFM) % Moisture Unknown Nearest building to stack: (C Battery) distance 337 ft height 50’8” (top of larry car) ft length 490 ft width 57 ft Processes Sharing Stack: If more than one process shares a stack, list them and
estimate relative contribution of each. Description NA Contribution to emissions from stack: % Description NA Contribution to emissions from stack: % Description NA Contribution to emissions from stack: % PART 8. Remarks Attach calculations and reference all emission factors for Allowable, Potential to Emit, and Actual emissions to this sheet. Reference all emission factors and efficiencies of control equipment. SEE ANNUAL AIR EMISSION INVENTORY REPORT Note: It is possible that there are additional Title V regulated air pollutants in the
emission relating to this source; however, an applicable requirement for such pollutant(s) does not exist.
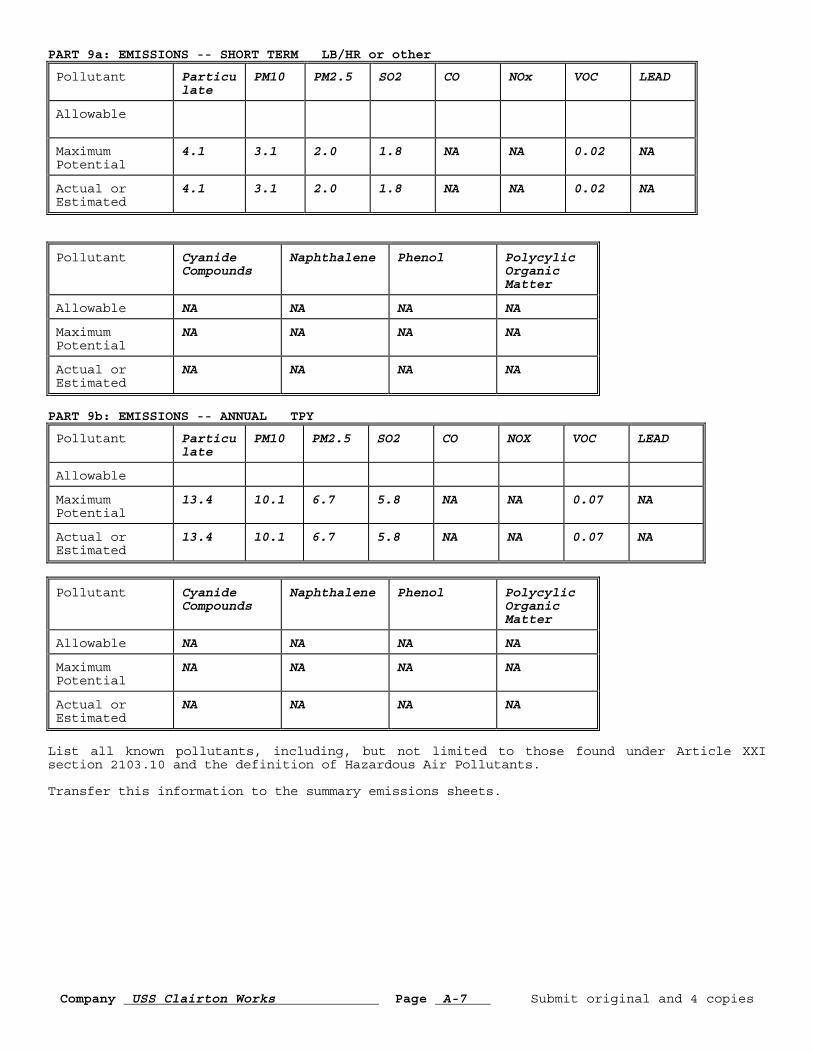
Company USS Clairton Works Page A-7 Submit original and 4 copies
PART 9a: EMISSIONS -- SHORT TERM LB/HR or other
Pollutant Particulate
PM10
PM2.5 SO2 CO NOx VOC LEAD
Allowable
Maximum Potential
4.1 3.1 2.0 1.8 NA NA 0.02 NA
Actual or Estimated
4.1 3.1 2.0 1.8 NA NA 0.02 NA
Pollutant Cyanide Compounds
Naphthalene Phenol Polycylic Organic Matter
Allowable NA NA NA NA
Maximum Potential
NA NA NA NA
Actual or Estimated
NA NA NA NA
PART 9b: EMISSIONS -- ANNUAL TPY
Pollutant Particulate
PM10
PM2.5 SO2 CO NOX VOC LEAD
Allowable
Maximum Potential
13.4 10.1 6.7 5.8 NA NA 0.07 NA
Actual or Estimated
13.4 10.1 6.7 5.8 NA NA 0.07 NA
Pollutant Cyanide Compounds
Naphthalene Phenol Polycylic Organic Matter
Allowable NA NA NA NA
Maximum Potential
NA NA NA NA
Actual or Estimated
NA NA NA NA
List all known pollutants, including, but not limited to those found under Article XXI section 2103.10 and the definition of Hazardous Air Pollutants. Transfer this information to the summary emissions sheets.

Company USS Clairton Works Page A-1 Submit original and 4 copies
PERMIT FORM A PROCESS OPERATIONS
PLANT NAME AND LOCATION: USS Clairton Works - 400 State Street, Clairton,PA PART 1. DESCRIPTION OF PROCESS (MAKE A COPY OF SCHEDULE A FOR EACH PROCESS.) Company Identification or Description: #3 Coke Screening Station (B & C Battery) (P036)
Installer Install Date
Contractor (if operated by another)
Design ( )Charging or (X)Production rate(specify units) B = 1,157,050 tons of coke/yr; C
= 1,005,528 tons of coke/yr
Total Annual Production (specify units normally used) B = 939,875 tons of coke/yr; C =
1,005,528 tons of coke/yr
Raw materials Metallurgical Coke
Materials Produced Screened Coke
Process Operation Units: (1) Coke Screening Operations (B & C Battery)
(2) Screening Loadout (B & C Battery)
(3)
(4)
(5)
(6)
Diagram of Process Flow: Attach a separate sheet with a drawing of a flow diagram of this process, labeling each segment listed under Process Operation Segments. Label product intake points and product discharge points for each segment. Label emissions discharge points and the location of emissions control devices. PART 2. PROCESS OPERATION SCHEDULE A. Normal schedule: (Provide information for last year. If a new unit, please estimate) Hrs/day 24 Days/week 7 Weeks/year 52 Hrs/Year 8760 Start time 00:00 End time 24:00 Seasonal: Periods correspond to seasons instead of calendar quarters. The first season is split to include December, January, and February. Percent of Annual Production
Dec., Jan., and Feb.: 25.0 June to August: 25.0
March to May: 25.0 Sept. to Nov.: 25.0
B. Requested limits: (limitations on operating hours are optional.) Choose one: (X) 8760 hours (no limitations) or ( ) I/We request the following limitation -- This may become a federally enforceable permit condition: Describe how this can be enforced: either list an operating schedule or downtime (e.g. only operate 8:00 to 4:00) or an operating hour reporting requirement. _____ total days x _____ hours/day = _______ hours/year
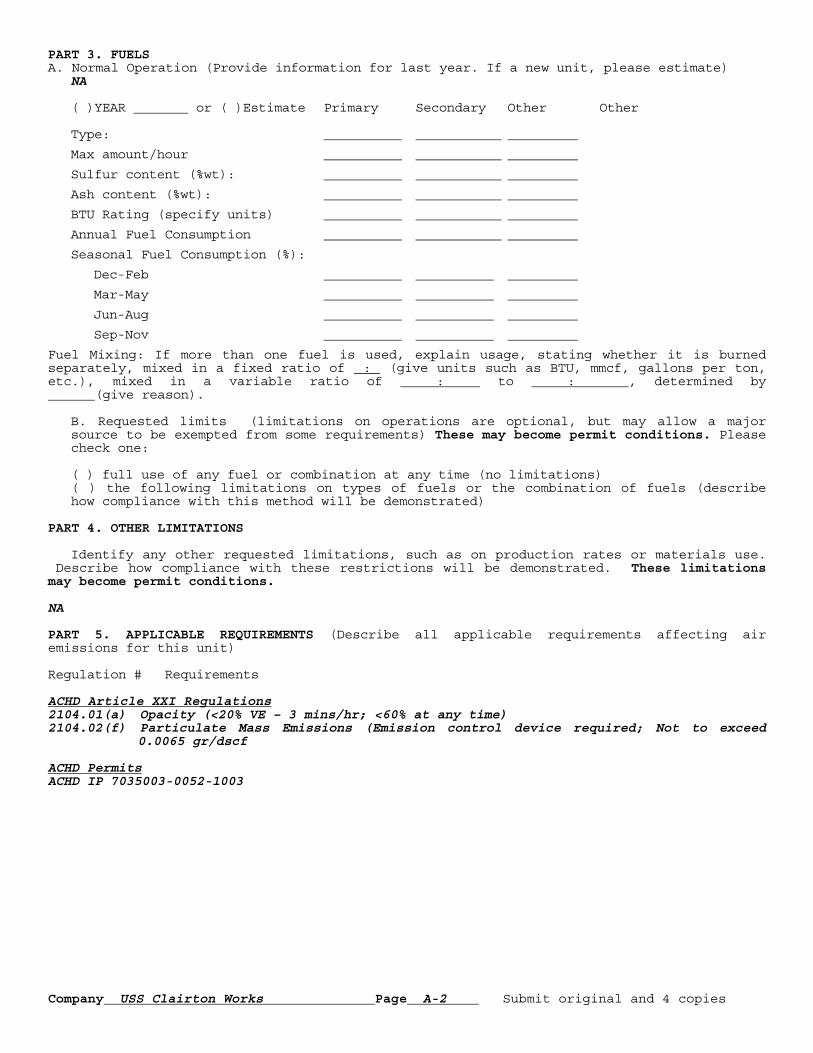
Company USS Clairton Works Page A-2 Submit original and 4 copies
PART 3. FUELS A. Normal Operation (Provide information for last year. If a new unit, please estimate) NA ( )YEAR or ( )Estimate Primary Secondary Other Other Type:
Max amount/hour
Sulfur content (%wt):
Ash content (%wt):
BTU Rating (specify units)
Annual Fuel Consumption
Seasonal Fuel Consumption (%):
Dec-Feb
Mar-May
Jun-Aug
Sep-Nov
Fuel Mixing: If more than one fuel is used, explain usage, stating whether it is burned separately, mixed in a fixed ratio of : (give units such as BTU, mmcf, gallons per ton, etc.), mixed in a variable ratio of : to : , determined by (give reason). B. Requested limits (limitations on operations are optional, but may allow a major
source to be exempted from some requirements) These may become permit conditions. Please check one:
( ) full use of any fuel or combination at any time (no limitations) ( ) the following limitations on types of fuels or the combination of fuels (describe
how compliance with this method will be demonstrated) PART 4. OTHER LIMITATIONS Identify any other requested limitations, such as on production rates or materials use. Describe how compliance with these restrictions will be demonstrated. These limitations may become permit conditions. NA PART 5. APPLICABLE REQUIREMENTS (Describe all applicable requirements affecting air emissions for this unit) Regulation # Requirements ACHD Article XXI Regulations 2104.01(a) Opacity (<20% VE – 3 mins/hr; <60% at any time) 2104.02(f) Particulate Mass Emissions (Emission control device required; Not to exceed
0.0065 gr/dscf ACHD Permits ACHD IP 7035003-0052-1003

Company USS Clairton Works Page A-3 Submit original and 4 copies
PART 6: EMISSION CONTROLS: Complete the following applicable sections for each pollution control device. Attach additional sheets to provide sufficient information and engineering calculations to support the control device performance. On the space to the left of each device, number the device(s) by the order in which they process the waste stream(s). Fill out the requested information, then complete the table for efficiencies by pollutant for each device. Capture efficiency of all units > 95 % air flow @ °F 1 BAGHOUSE (fabric collector) Mfr.'s name, model Unknown
Type of bag material
Total filter cloth area Unknown sq.ft., air to cloth ratio
Bag cleaning method high pressure air pulse, cycle based on overall pressure differential
min
Pressure drop: clean "H2O, dirty "H2O*
Pollutant Efficiency (%) Basis for Eff. Outlet grain loading
Coke Dust 99.9% @90%>10u 0.0065 grains/dscf
* following a bag change the pressure drop may be lower that 2” for a start-up period NA ELECTROSTATIC PRECIPITATOR:Mfr.'s name, model
Type: single stage, two stage, plate, tube
Total collecting area: sq.ft., cleaning cycle min.
Gas Velocity ft./sec., corona power kw
Bulk resistivity of dust: ohm-cm Moisture content of gases: vol.%
Pollutant Efficiency (%) Basis for Eff. Outlet grain loading
NA CYCLONE(dry gas only):Mfr.'s name and model
Gas inlet: width ft., height ft.
Diameter: gas outlet ft., cyclone cylinder(s) ft.
Length of cyclone: ft., no. of cylinders: Pressure Drop "H2O
Pollutant Efficiency (%) Basis for Eff. Outlet grain loading
NA CONDENSER:Mfr.'s name and model
Type: surface , contact
Heat transfer area: sq.ft., max process pressure psia
Heat duty: BTU/hr. Coolant temp: inlet •F, outlet •F
Pollutant Efficiency (%) Basis for Eff. Outlet concentration (ppm)

Company USS Clairton Works Page A-4 Submit original and 4 copies
NA WET COLLECTOR:Mfr.'s name and model
Type: venturi, cyclone, spray chamber, packed bed
Entrainment/separator: type , bed depth
Type & construction of chemicals added to the scrubbing liquid:
Pressure drop "H2O
Scrubbing liquid: flow rate gpm, inlet temp. •F, outlet •F
Pollutant Efficiency (%) Basis for Eff. Outlet concentration (ppm)
NA AFTERBURNER:Mfr.'s name and model
Type: direct flame, catalytic
If catalytic: inlet temp. •F, outlet temp. •F, catalyst life
If direct flame: internal volume cu.ft., average temp. •F
Residence time at average temp sec
Auxiliary fuel: max. rating BTU/hr, set point •F, BTU/hr
Size of Chamber cu.ft., flow rate
Pollutant Efficiency (%) Basis for Eff. Outlet grain loading (gn/cu.ft)
NA ADSORPTION EQUIPMENT:Mfr.'s name and model
Type: continuous, , fixed bed
Adsorbing material: , bed depth in., flow area sq.ft.
Breakthrough (breakpoint) time: , Pressure drop "H2O
Pollutant Efficiency (%) Basis for Eff. Outlet concentration (ppm)
X OTHER TYPES: Name and describe. Attach complete details.
Addition of 3.5 gal/ton coke (100 to 1 ratio) dust suppressant in Gyrex as needed.
FUGITIVE DUST CONTROLS: Describe below or attach a complete explanation of all controls of
fugitive emissions not discussed in Form E, Roads, or Form F, storage piles.
Hoods on 2-coke loading stations (loadout)and
on 1-coke breeze loading station (loadout)

Company USS Clairton Works Page A-5 Submit original and 4 copies
PART 7. STACK DATA: Stack data must be provided for each flue, duct, pipe, stack, chimney or conduit (stacks) at which collected emissions are vented to open air through a restricted opening.
Stack Identification: #3 Screening Station Baghouse Stack (S036) UTM East 595675 UTM North 4462002 or Longitude 79 deg, 52’ 27” west Latitude 40 deg 18’ 11” north Most important stacks have been located on topographic or air navigation charts. If you
know the UTM coordinates or latitude and longitude, provide this information. If there is a number of stacks close together, a common location may be used.
Stack Height: 112.5 ft Ground level elevation: 764 ft Diameter ft. Material Outer: Steel Lining: None Exit Temperature (F): Exit Velocity: Unknown (f/s) Exhaust Rate: Unknown (ACFM) % Moisture Ambient Nearest building to stack: (C battery)distance 442.9 ft height 50’8” ft length 490 ft width 57 ft Processes Sharing Stack: If more than one process shares a stack, list them and
estimate relative contribution of each. Description Contribution to emissions from stack: % Description Contribution to emissions from stack: % Description Contribution to emissions from stack: % PART 8. Remarks Attach calculations and reference all emission factors for Allowable, Potential to Emit, and Actual emissions to this sheet. Reference all emission factors and efficiencies of control equipment. SEE ANNUAL AIR EMISSION INVENTORY REPORT Note: It is possible that there are additional Title V regulated air pollutants in the
emission relating to this source; however, an applicable requirement for such pollutant(s) does not exist.
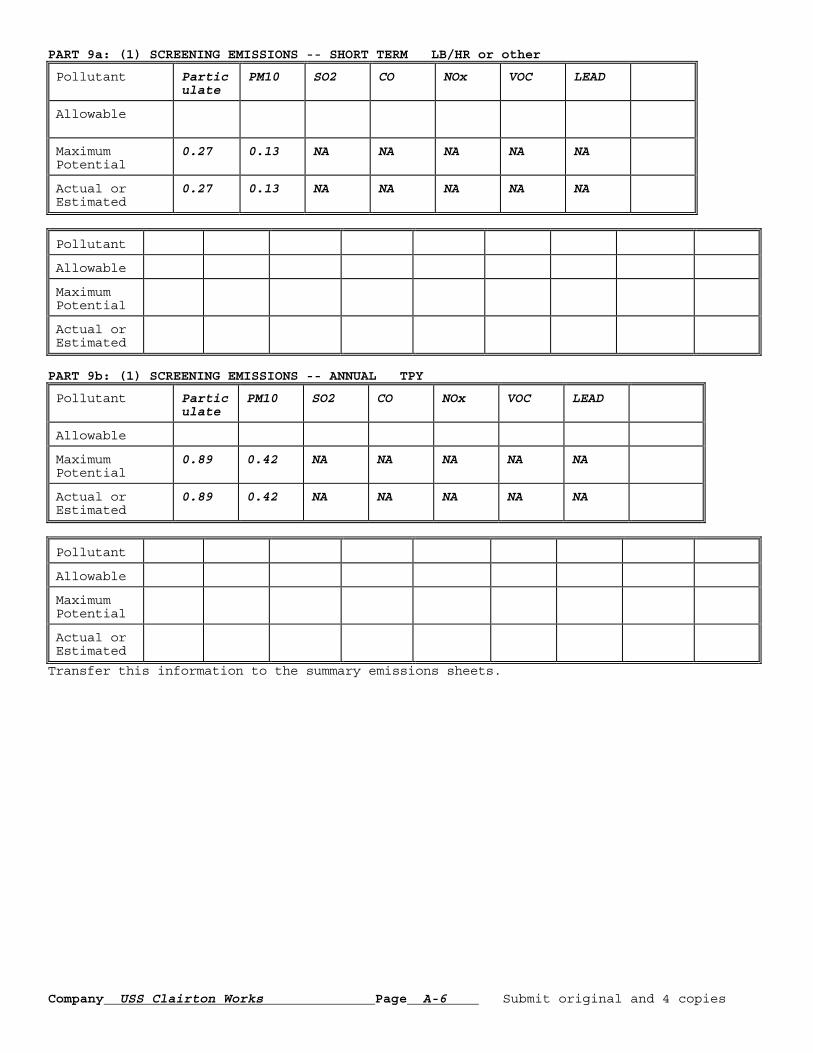
Company USS Clairton Works Page A-6 Submit original and 4 copies
PART 9a: (1) SCREENING EMISSIONS -- SHORT TERM LB/HR or other
Pollutant Particulate
PM10
SO2 CO NOx VOC LEAD
Allowable
Maximum Potential
0.27 0.13 NA NA NA NA NA
Actual or Estimated
0.27 0.13 NA NA NA NA NA
Pollutant
Allowable
Maximum Potential
Actual or Estimated
PART 9b: (1) SCREENING EMISSIONS -- ANNUAL TPY
Pollutant Particulate
PM10
SO2 CO NOx VOC LEAD
Allowable
Maximum Potential
0.89 0.42 NA NA NA NA NA
Actual or Estimated
0.89 0.42 NA NA NA NA NA
Pollutant
Allowable
Maximum Potential
Actual or Estimated
Transfer this information to the summary emissions sheets.

Company USS Clairton Works Page A-7 Submit original and 4 copies
PART 9a: (1) SCREENING LOADOUT FUGITIVES EMISSIONS -- SHORT TERM LB/HR or other
Pollutant Particulate
PM10
SO2 CO NOx VOC LEAD
Allowable
Maximum Potential
0.15 0.11 NA NA NA NA NA
Actual or Estimated
0.15 0.11 NA NA NA NA NA
Pollutant
Allowable
Maximum Potential
Actual or Estimated
PART 9b: (1) SCREENING LOADOUT EMISSIONS -- ANNUAL TPY
Pollutant Particulate
PM10
SO2 CO NOX VOC LEAD
Allowable
Maximum Potential
0.5 0.35 NA NA NA NA NA
Actual or Estimated
0.5 0.35 NA NA NA NA NA
Pollutant
Allowable
Maximum Potential
Actual or Estimated
Transfer this information to the summary emissions sheets.

Evaluation of Best Available Control Technology (BACT) For Coke Screening Operation
Prepared for
United States Steel Corporation Clairton, PA
Project Number 3410070529
By:
Hafeez Ajenifuja Project Scientist
And
Robert Romansik Senior Principal Engineer
May 30, 2007
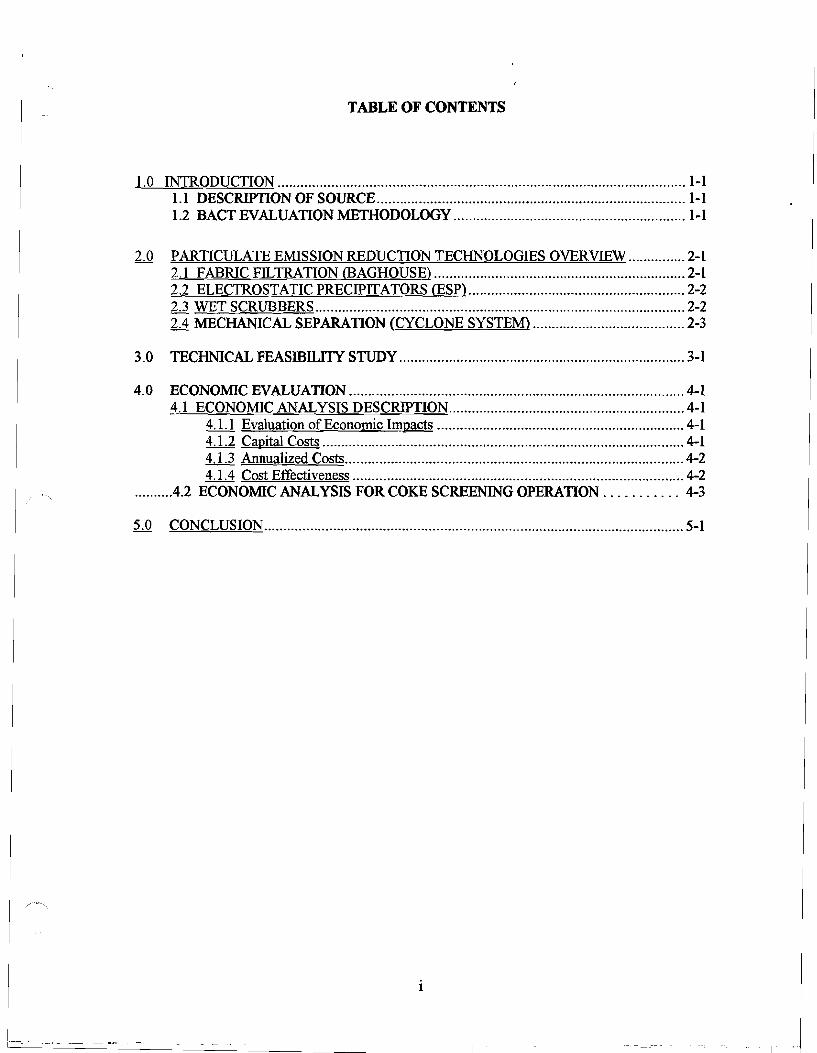
TABLE OF CONTENTS
1.0 INTRODUCTION 1-1 1.1 DESCRIP110N OF SOURCE 1-1 1.2 BACT EVALUATION METHODOLOGY 1-1
2.0 PARTICULATE EMISSION REDUCTION TECHNOLOGIES OVERVIEW 2-1 2.1 FABRIC FILTRATION <BAGHOUSE) 2-1 2.2 ELECTROSTATIC PRECIPITATORS (ESP) 2-2 2.3 WET SCRUBBERS 2-2 2.4 MECHANICAL SEPARATION (CYCLONE SYSTEM) 2-3
3.0 TEClINICAL FEASmILTIY STUDY 3-1
4.0 ECONOMIC EVALUATION 4-1 4.1 ECONOMIC ANALYSIS DESCRIPTION 4-1
4.1.1 Evaluation of Economic Impacts 4-1 4.1.2 Capital Costs 4-1 4.1.3 Annualized Costs 4-2 4.1.4 Cost Effectiveness 4-2
..........4.2 ECONOMIC ANALYSIS FOR COKE SCREENING OPERATION 4-3
5.0 CONCLUSION 5-1
i
- I

Evaluation ofBACT for US Steel MACTEC Engineering and Consulting, Inc.
~. 1.0 INTRODUCTION
MACTEC Engineering and Consulting, Inc. (MACTEC) has prepared this Best Available Control
Technology (BACT) evaluation on behalf of the United States Steel Corporation (US Steel)
Clairton, Pennsylvania coke production :fucility. The evaluation was performed to identify the
BACT for an existing coke screening operation. It is being submitted as part of a construction
permit application for a newly proposed replacement baghouse system.
1.1 DESCRIPTION OF SOURCE
US Steel manufactures metallurgical coke for use in the steel making process. As part of this
process the :fucility utilizes coke screening operations. Coke is transported into an elevator which
is then discharged into an enclosed screener system. The coke is graded in the screeners into
different sizes by a mechanical shaking mechanism. The screening operation is enclosed with an
exhaust discharge from the enclosure to an existing baghouse. US Steel is proposing to replace the
existing baghouse system, which is near its life expectancy, with a new unit. The new unit would
consist of a negative pressure pulse jet type baghouse to control the particulate matter emission
generated by this screening operation. This proposed change will likely result in a decrease in the
outlet emissions of particulate matter, due to advances in technology since the original baghouse
system was installed and the :filet that it is new equipment.
1.2 BACT EVALUATION METHODOLOGY
The proposed changes identified in the construction permit application do not trigger Prevention of
Significant Deterioration (PSD) or New Source Review (NSR) requirements because the analysis is
not being use to support any new operation or modification to an existing source. However, this
BACT evaluation was performed in accordance with the same methodology that is used to
demonstrate compliance with the technology analysis demonstration required by PSD. Therefore,
it is based upon U.S. EPA's recommended Best Available Control Technology (BACT) "top
down" approach, detailed in Table B-1 of the U.S. EPA's Draft New Source Review Workshop
Manual (October 1990). Utilizing the ''top-down'' approach, progressively less stringent control
technologies are analyzed until a level of control constituting BACT is reached, considering
environmental, energy and economic impacts. The following evaluation is consistent with BACT
''Top-Down'' requirements.
1-1
I . - -~I
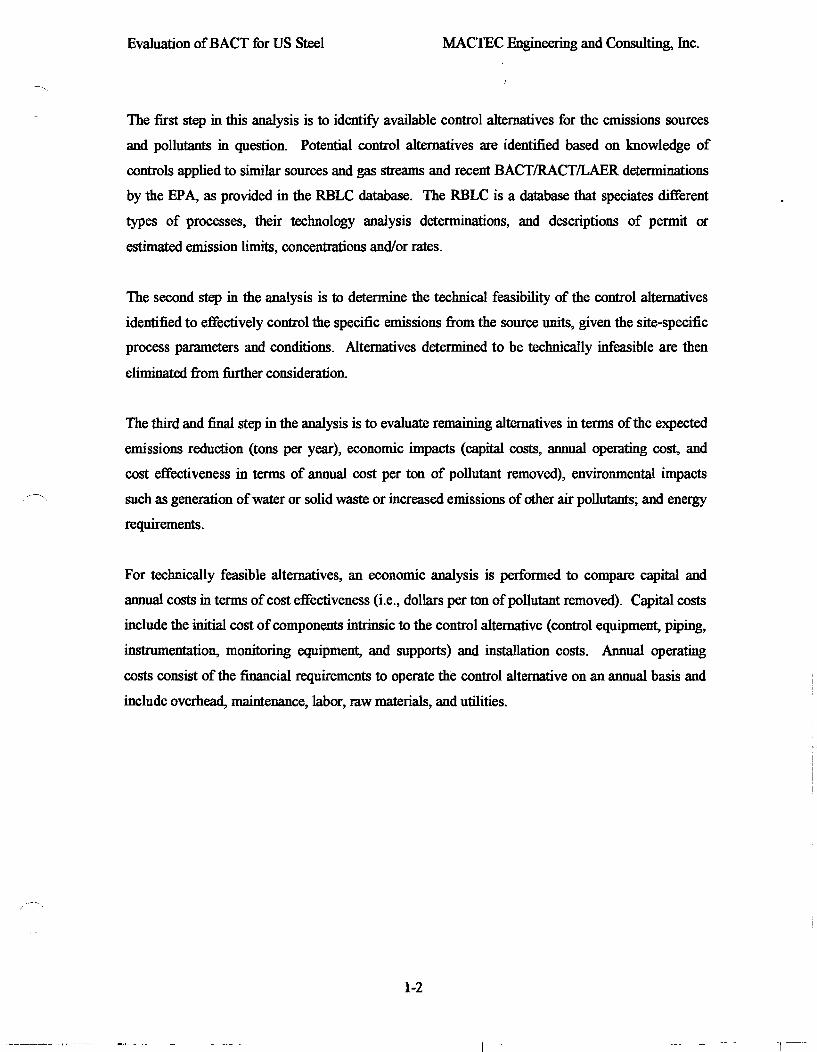
Evaluation ofBACT for US Steel MACTEC Engineering and Consulting, Inc.
The first step in this analysis is to identify available control alternatives for the emissions sources
and pollutants in question. Potential control alternatives are identified based on knowledge of
controls applied to similar sources and gas streams and recent BACTIRACTILAER determinations
by the EPA, as provided in the RBLC database. The RBLC is a database that speciates different
types of processes, their technology analysis determinations, and descriptions of permit or
estimated emission limits, concentrations and/or rates.
The second step in the analysis is to determine the technical feasibility of the control alternatives
identified to effectively control the specific emissions from the source units, given the site-specific
process parameters and conditions. Alternatives determined to be technically infeasible are then
eliminated from further consideration.
The third and final step in the analysis is to evaluate remaining alternatives in terms ofthe expected
emissions reduction (tons per year), economic impacts (capital costs, annual operating cost, and
cost effectiveness in terms of annual cost per ton of pollutant removed), environmental impacts
such as generation ofwater or solid waste or increased emissions of other air pollutants; and energy
requirements.
For technically feasible alternatives, an economic analysis is performed to compare capital and
annual costs in terms ofcost effectiveness (i.e., dollars per ton of pollutant removed). Capital costs
include the initial cost ofcomponents intrinsic to the control alternative (control equipment, piping,
instrumentation, monitoring equipment, and supports) and installation costs. Annual operating
costs consist of the financial requirements to operate the control alternative on an annual basis and
include overhead, maintenance, labor, raw materials, and utilities.
1-2
--~-I
Evaluation ofBACT for US Steel MACTEC Engineering and Consulting, Inc.
I
2.0 PARTICULATE EMISSION REDUCTION TECHNOLOGIES OVERVIEW
The review of emission control technologies for evaluation as BACT should be broad enough to
take into account all potential control technologies. Sources of information on control technology
alternatives which may be consulted during the preparation and successful completion of a BACT
demonstration include, but are not necessarily limited to:
• U.S. EPA RACTIBACTILAER Clearinghouse; • U.S. EPA Alternative Control Technique Documents; • U.S. EPA/State/Local Air Quality Permits; • FederallStatelLocal Permit Engineers; • Control Technology Vendors; and • Inspection/Performance Test Reports.
Currently, there are several options available for the control of PMlPMIO emissions from coke
screening operations. This type of operation does not present significant technological barriers
such as acid formation/attack, explosive atmospheres, or saturated exhaust air streams with respect
to potential emission controls. Therefore, in general commonly applied PM reductions
technologies would be technically feasible. The applied technologies that were identified from a
review ofthe previously described literature are presented below in a top down order approach: the
technology with the theoretically highest potential PMlPMIO reduction being first and the
remaining technologies in descending order by reduction effectiveness:
• Fabric Filtration (Baghouse) System • Electrostatic Precipitation (ESP) • Wet Scrubbing • Mechanical Separation (cyclone system)
The following discussion provides an overview and technical description of the PM control
technologies listed above. The technical feasibility of each control technique will be discussed in
section 3.0.
2.1 FABRIC FILTRATION (BAGHOUSE)
A baghouse is commonly applied to control particulate emissions from coke crushing and
screening operation due to their high control efficiencies, toleration ofhigh and varied temperature,
particulate and temperature loads. The baghouse design employs long cylindrical bags that contain
2-1
I - 1
Evaluation ofBACT for US Steel MACTEC Engineering and Consulting, Inc.
felted fabric cloth as the filtering medium. The cloth can be supported at the top and bottom of the
bag by metal rings or clasps; or by an internal cage that completely supports the entire bag. Dust is
collected on either the inside or outside of the fabric material depending on the baghouse design.
The baghouse is constructed of compartmental units and are used in continuous operating processes
with large exhaust volume. The units can have a compartment off-line for bag cleaning and
maintenance while the remaining compartments continue to filter. The particulate matter passes
through the filter bags before leaving the unit through the collection hoppers which is used to store
the collected dust before is disposed in a landfill or reused in the process. The baghouse can
consistently achieve removal efficiencies of 98% and greater on a wide range of particulate sizes
and dust types.
2.2 ELECTROSTATIC PRECIPITATORS (ESP)
An ESP uses a generated electrical field to charge incoming particulates that are subsequently
collected on plates of opposite charge. ESPs are commonly applied to and very effective for the
control of fly ash from many industrial and utility boilers, with removal efficiencies up to 99%+.
However, they are more effective in higher particulate concentrated applications, as a whole, due to
the activity the inter-related activity of the charged particles. This is why coal based utility and
boiler systems normally employ them, since there PM concentrations are usually rather large. For
smaller concentration streams, an ESP is not as effective, and efficiency of control can drop off
dramatically, down to reduction efficiencies in the 70-90% range.
2.3 WET SCRUBBERS
Scrubbers are also very effective in removing particulates from a wide variety of industrial sources,
depending on a few important design features such as pressure drop, throat versus packing set-up,
and liquor type and recirculation rate.. For PM control that is not influenced by acids, sulfates, and
some other contaminants, packed or venturi units can be used, and the liquor is typically water. In
these applications a wet scrubber can be designed to achieve 90%+ removal efficiency for
particulate matter greater than 10 microns. FQr particulates less than 10 microns in size, significant
energy (pressure drop) and water saturation may be needed to achieve high efficiency removal.
This control technology also requires the handling process waters, which may lend to precipitated
solids, pH changes, ect. and possibly require wastewater treatment operations.
2-2

Evaluation ofBACT for US Steel MACTEC Engineering and Consulting, Inc.
2.4 MECHANICAL SEPARATION (CYCLONE SYSTEM)
Cyclones or multi-elones use centrifugal (mechanical) force generated by a spinning gas stream to
separate the particulate matter (solid or liquid) from the carrier gas. Centrifugal force acts on the
particles in the gas forcing them towards the wall. Cyclones are not typically efficient for removal
of fine particles, and are usually employed for removing particles greater than 10-50 microns in
diameter, with a capacity to achieve up to 85% efficiency. Multi-eyclones on the other hand are
better for removal of smaller particles, but still significantly lower in efficiency than the other
technologies described above.
/',
2-3
-- I

Evaluation ofBACT for US Steel MACTEC Engineering and Consulting, Inc.
I
3.0 TECHNICAL FEASIBILY ANALYSIS
Following the "top-down" BACT approach, the highest ranked control option is evaluated first.
Based on review of the technologies identified from the literature searches, and the description of
technologies and their associated potential removal efficiencies, it was identified that the top
control candidate for the screening application is a fabric filtration system (baghouse).
A review of the RBLC technology database listings for comparable types of applications indicates
that BACT for these types ofapplications is the use ofa baghouse as well, as identified in Table 1.
Based on the analysis above for configurations of coke crushing and screening operations, it has
been concluded that the use of a baghouse will provide the best control of particulate matter
emissions. Therefore, US Steel is proposing to use a baghouse system as it is considered the most
effective control device for the proposed project. The proposed baghouse system will consist of a
negative pressure pulse jet cleaning arrangement. The baghouse is predicted to handle the flow
requirements from the coke screening operation with an estimated 23,000 actual cubic feet per
minute (acfin). The estimated control efficiency is greater than 99% for total particulates and
greater than 90% for particulates that are less than 10 um in size, which equates to a maximum
outlet concentration ofapproximately 0.0065 gr/dscf
In regards to particulate (pMlPMIO) emissions, the RBLC revealed emission limits ranging from
0.89 to 2.0 Ibslhr. Only one listing provided for concentration limit, which was 0.008 gr/dscf.
Based on information from U.S. Steel's study on the proposed pulse jet baghouse, the predicted
emissions for this application will be 0.0065 gr/dscf (the equivalent of approximately 1.28 Ibslhr).
This estimated emissions rate is within the RBLC identified range for PMlPMIO reduction (mass
rates) and below the one noted concentration of0.008 gr/dscf.
3-1
Evaluation ofBACT for US Steel MACTEC Engineering and Consulting, Inc.
:
4.0 ECONOMIC EVALUATION
4.1 ECONOMIC ANALYSIS DESCRIPTION
An important aspect of the BACT review is the economic impact. The economic impact of a
control option is assessed in terms of cost effectiveness and ultimately, whether the option is
economically reasonable. The economic impacts were reviewed on a cost per ton basis, as directed
by the EPA's Cost Control Manual.
4.1.1 Evaluation of Economic Impacts
For technically feasible alternatives, an economic analysis was perfonned based on a "Top Down"
Approach to compare capital and annual costs in terms of cost-effectiveness (i.e., dollars per ton of
pollutant removed). Direct annual costs include operating and supervisory labor, operating
materials, replacement bags, maintenance (labor and materials), utilities, and dust disposal.
4.1.2 Capital Costs
A number of methods with varying degrees of accuracy are available for estimating capital costs.
The total capital cost is the sum of three costs, purchased equipment cost, direct installation costs,
and indirect installation costs. Capital cost factors were given in Table 1.9 of the U.S. EPA's Air
Pollution Control Cost Manual (January 2002).
Purchased equipment costs represent the delivered cost of the control equipment, auxiliary
equipment, and instrumentation. Auxiliary equipment consists of all structural, mechanical, and
electrical components required for efficient operation of the device. These include such items as
fuel storage and supply piping, and exhaust gas ductwork. In this evaluation, basic equipment
costs were obtained directly from vendors. Instrumentation, usually not included in the basic
equipment cost, is typically 10 to 15 percent of the basic equipment cost depending on the specific
application.
Direct installation costs consist of the direct expenditures for materials and labor for site
preparation, foundations, structural steel, erection, piping, electrical, painting, and facilities.
Indirect installation costs include engineering and supervision of contractors, construction and field
expenses, contractor fees, startup, perfonnance testing, and contingencies. Direct installation costs
4-1

Evaluation ofBACT for US Steel MACTEC Engineering and Consulting, Inc.
t
are expressed as a function of the purchased equipment cost, based on average installation
requirements of typical systems. Indirect installation costs are estimated as a percentage of the
purchased equipment cost of the system. The factors are based on the assumption that the
installation is performed by an outside contractor and not by plant personnel.
4.1.3 Annualized Costs
Annualized costs are comprised of direct and indirect operating costs. Direct costs include labor,
maintenance, replacement parts, raw materials, utilities, and waste disposal. Indirect operating
costs include plant overhead, taxes, insurance, general administration and capital charges.
Direct operating labor costs vary according to the system operating mode and operating time.
Labor supervision is estimated as 15 percent of operating labor. Replacement part costs, such as
the labor cost (CL) to replace filter bags, depends on the number, size, and type of bags; their
accessibility; how they are connected to the baghouse tube-sheet; and other site-specific factors that
increase or decrease the quantity of labor required. This corresponds to a 2 to 4 years life. The bag
replacement cost (CL), defined as:
Where: CRCB = bag capital recovery cost ($/year) CB = initial bag cost including taxes and freight ($) CL = bag replacement labor ($) CRFB = capital recovery factor (defined in Chapter 2) whose value is a function ofthe annual
interest rate and the useful life ofthe bags (For instance, for a 7% interest rate and a 2-year life, CRFB = 0.5531.) - U.S. EPA's Air Pollution Control Cost Manual (January 20(2).
4.1.4 Cost Effectiveness
The cost effectiveness of an avaiIable control technology was based on the estimated annualized
cost of the available control technology and its expected annual pollutant emission reduction.
Cost-effectiveness is calculated by dividing the annualized cost of the avaiIable control technology
by the tons of pollutant removed by that control technology each year. Cost effectiveness values
($/ton) provide a means to assess and compare the economic feasibility ofcontrol alternatives.
4-2
Evaluation ofBACT for US Steel MACTEC Engineering and Consulting, Inc.
I
4.2 ECONOMIC ANALYSIS FOR COKE SCREENING OPERATION
US Steel has selected a control technology that is considered to be BACT. Since this technology
has the potential to achieve the greatest reduction of particulates, no other technologies were
reviewed. In accordance with BACT guidances, if the ''top'' technology is being employed, then
the BACT determination is considered complete and no economic analysis is required. Therefore,
an economic analysis of technologies is not necessary to further evaluate BACT for this
application.
4-3
I

Evaluation ofBACT for US Steel MACTEC Engineering and Consulting, Inc.
,.
5.0 CONCLUSION
A top-down BACT review was perfonned for the proposed replacement of the coke screening
operation baghouse at US Steel Clairton facility. The analysis indicated that the use of a new
baghouse that is estimated to achieve an outlet particulate concentration of 0.0065 gr/dscf or less
provides the best control ofparticulate matter (PMlPMIO) emission. Based upon baghouse design
and expected emissions rate, the proposed baghouse is considered to be BACT for this
application.
5-1
I

TABLEt
BACT DETERMINATION FROM RBLC DATABASE
FACILITY NAME
FACILITY STATE
DATE PROCESS NAME BACT LIMIT CONTROL DEVICE
Haverhill North Coke Co.
OH 02/2712001 Coal Crushinw'Screenin~
0.008 grs/dscf Baghouse
HHaverhill North Coke Co.
OH 06/2712006 Coal Handling, Conveying and Screening
3.77 TPY <lOJlID
7.95 TPYPM
Baghollse
Holnam Florence CO NP Transporting Coal to Coal Screen
0.19TPY <101JlD.
Baghouse
Carmeuse Lime OH NP Coal & Coke Handling
0.31 TPY <lO~
0.89 lbs/hr PM
Baghollse
Monticello Mill MS NP Grinding Mill, Petroleum Coke
2lbs/hr <lOJ.lIl1 Baghollse
NP - Not Provided.
5-1

Discussion ofLeak Rates from Battery Stacks with PROven Technology as Compared to Conventional Oven Pressure Control- Replacement ofThree Short Conventional
Batteries with One Tall PROven-Equipped Battery
DRAFT
November 16, 2007
I. Executive Summary
There are three significant factors affecting coke oven stacks emissions when three
old, short (3.6M) batteries are replaced by one modem, tall (6M) battery. The three
factors are: (1) the overall condition ofthe refractory, (2) the higher fuel efficiency
that will be achieved with the larger battery equipped with an advanced heating
system design including modem heating controls and (3) the PROven oven pressure
control system. The assumption is made here that three short batteries at USS
Clairton would be replaced with one modem tall battery.
For purposes ofcalculating the emissions benefit associated with the aforementioned
battery replacement, no credit is taken for the emissions reduction that will certainly
result from replacing old batteries with a new battery that has not experienced the
wear and tear of 50+ years of operation.
A fuel savings (Btu / pound ofcoal charged) of [10%??] has been projected by
battery designers. A conservative (low side) estimate ofthe emissions reduction that
will result from this factor assumes that stack emissions will fall in proportion to the
change in fuel consumption - assuming a starting point ofgood combustion, e.g. a
well-operated COG- fired source.
PROven oven pressure control technology controls gas pressure at the gooseneck of
each oven. The pressure set point for each oven is varied according to a program
that maintains the proper gas pressure within the oven as the coking cycle proceeds.
By controlling pressure in this manner, PROven is able to minimize high gas
pressures that occur early in the coking cycle and thereby minimize leakage from the
oven into the combustion flues. In a separate calculation, the emissions impact of
PROven technology on door emissions was estimated. The estimated decrease in
door emissions from PROven's improved oven pressure control was 39".10.
1

II. Description ofProcess
In batteries with conventional oven pressure control systems, the pressure is
controlled by maintaining the collector main at a regulated, constant pressure. The
regulated collector main pressure must be kept as low as possible to avoid coke oven
gas (COG) leaking from doors, lids and offiakes and to avoid COG leaking into the
combustion flues where it causes localized overheating and stack emissions. The
minimum required pressure in the main is dictated by the need to avoid allowing the
gauge pressure at the base ofthe oven to become negative. A negative gauge
pressure is possible because ofthe difference in the density ofhot coke oven gas in
the interior ofthe oven and the density ofair at ambient temperature outside of the
oven. That difference in densities causes a difference in static head of the fluids
inside and outside ofthe oven ofabout 1.2 mmWG per meter ofelevation [difference
between the oven floor and collector main] at the end ofthe coking cycle. Ifthe
gauge pressure at the oven floor were allowed to become negative, air would
infiltrate the oven at the bottom ofthe doors causing combustion ofthe COG and
coke in the oven - overheating and damaging refractory, doors and door jambs. This
phenomenon requires taller batteries to operate with a higher collector main pressure
to maintain a positive pressure at the foot ofthe door.
The PROven system is an innovation that allows control ofthe pressure in individual
ovens by means ofa regulated opening between the collector main and the
gooseneck. PROven is operated with a negative pressure in the collector main.
During the early stages ofthe coking cycle, the pressure in the gooseneck is
controlled to just slightly above atmospheric to minimize pressure at the oven floor
and consequently reduces door leaks and leaks ofCOG from the oven into the
combustion flues. As the coking cycle proceeds pressure drop from the oven floor to
the oven top decreases because coke has a higher porosity that coal, the COG
produced has a lower density and the gas production rate decreases. As the coking
cycle progresses, PROven gradually increases the set point for pressure at the
gooseneck. At the end ofthe cycle the gooseneck pressure is just high enough to
avoid a negative pressure at the foot ofthe door.
2
-- I
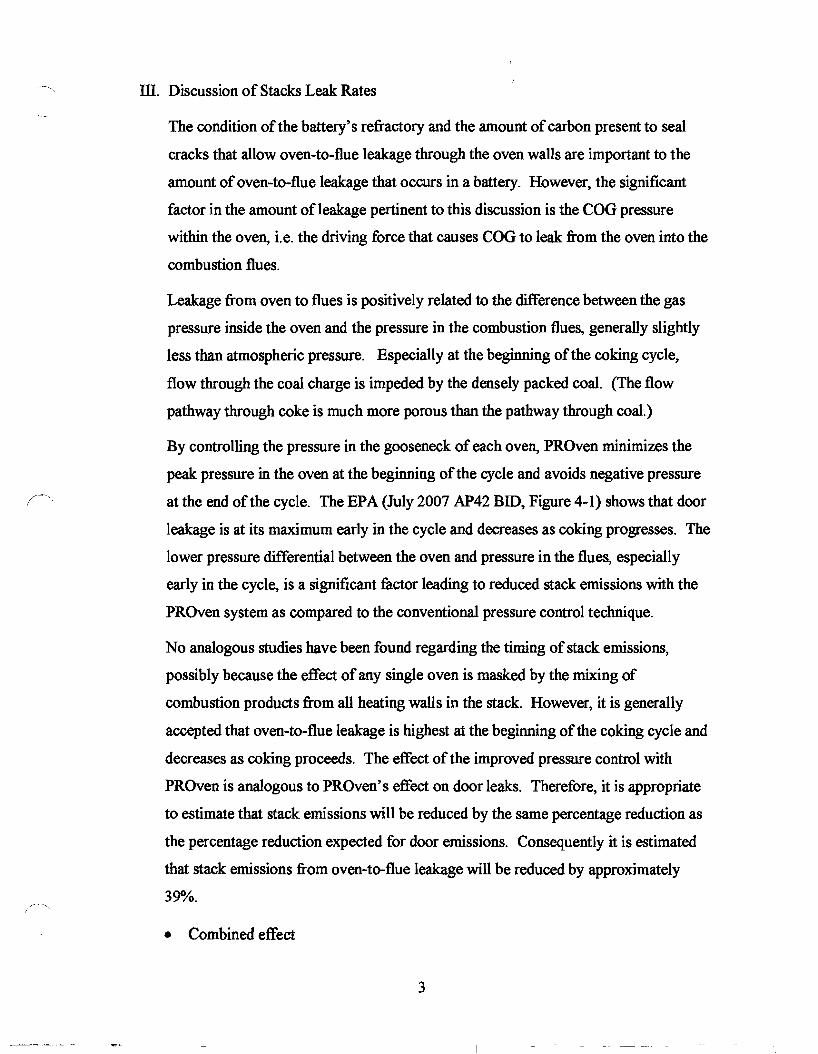
ID. Discussion of Stacks Leak Rates
The condition ofthe battery's refractory and the amount ofcarbon present to seal
cracks that allow oven-to-flue leakage through the oven walls are important to the
amount of oven-to-flue leakage that occurs in a battery. However, the significant
factor in the amount ofleakage pertinent to this discussion is the COG pressure
within the oven, Le. the driving force that causes COG to leak from the oven into the
combustion flues.
Leakage from oven to flues is positively related to the difference between the gas
pressure inside the oven and the pressure in the combustion flues, generally slightly
less than atmospheric pressure. Especially at the beginning ofthe coking cycle,
flow through the coal charge is impeded by the densely packed coal. (The flow
pathway through coke is much more porous than the pathway through coal.)
By controlling the pressure in the gooseneck of each oven, PROven minimizes the
peak pressure in the oven at the beginning ofthe cycle and avoids negative pressure
at the end ofthe cycle. The EPA (July 2007 AP42 BID, Figure 4-1) shows that door
leakage is at its maximum early in the cycle and decreases as coking progresses. The
lower pressure differential between the oven and pressure in the flues, especially
early in the cycle, is a significant factor leading to reduced stack emissions with the
PROven system as compared to the conventional pressure control technique.
No analogous studies have been found regarding the timing ofstack emissions,
possibly because the effect ofany single oven is masked by the mixing of
combustion products from all heating walls in the stack. However, it is generally
accepted that oven-to-flue leakage is highest at the beginning of the coking cycle and
decreases as coking proceeds. The effect ofthe improved pressure control with
PROven is analogous to PROven's effect on door leaks. Therefore, it is appropriate
to estimate that stack emissions will be reduced by the same percentage reduction as
the percentage reduction expected for door emissions. Consequently it is estimated
that stack emissions from oven-to-flue leakage will be reduced by approximately
390./0.
• Combined effect
3

There is no way to differentiate between emissions thRt result from oven-to-flue
leakage and emissions that occur during normal, well-controlled COG combustion.
However it is generally accepted that the large majority ofcoke battery stack
emissions result from leaks. Therefore as a reasonable approximation, a 90/10 split
between leaks and normal combustion emissions is assumed.
Combined:
Cause ofEmissions
Fraction of Original
Emissions
Fraction Reduced
Fraction of Original Emission
Remaining
Fraction of Original
Emissions with New Battery & PROven
A B C= 1-B AxC Normal, Well-Controlled
Combustion 0.10 0.10 0.90 0.090
Oven-to Flue Leaks 0.90 0.39 0.61 0.549
Fraction of Original Emissions Remaining after New Battery & PROven
0.639
Percent Emissions Reduction 35%
N. Conclusions
Replacing three small batteries at USS Clairton Works with one tall battery equipped
with PROven technology would reduce stack emissions per ton ofcoal charged by
about 35%, without taking any credit for the pristine refractory condition that would
be present in a new battery.
It is certain that initially, a new battery could achieve a better stack emissions
performance than batteries that are 50+ years old. Although normal wear and tear on
the new battery is unavoidable, PROven technology will have long term performance
benefits. By minimizing COG leaks into the combustion flues, damage from
localized overheating is avoided, and by maintaining a positive pressure at the foot
ofthe doors, PROven can avoid temperature-related refractory damage that might
result from combustion ofCOG and coke that results from air infiltration.
4
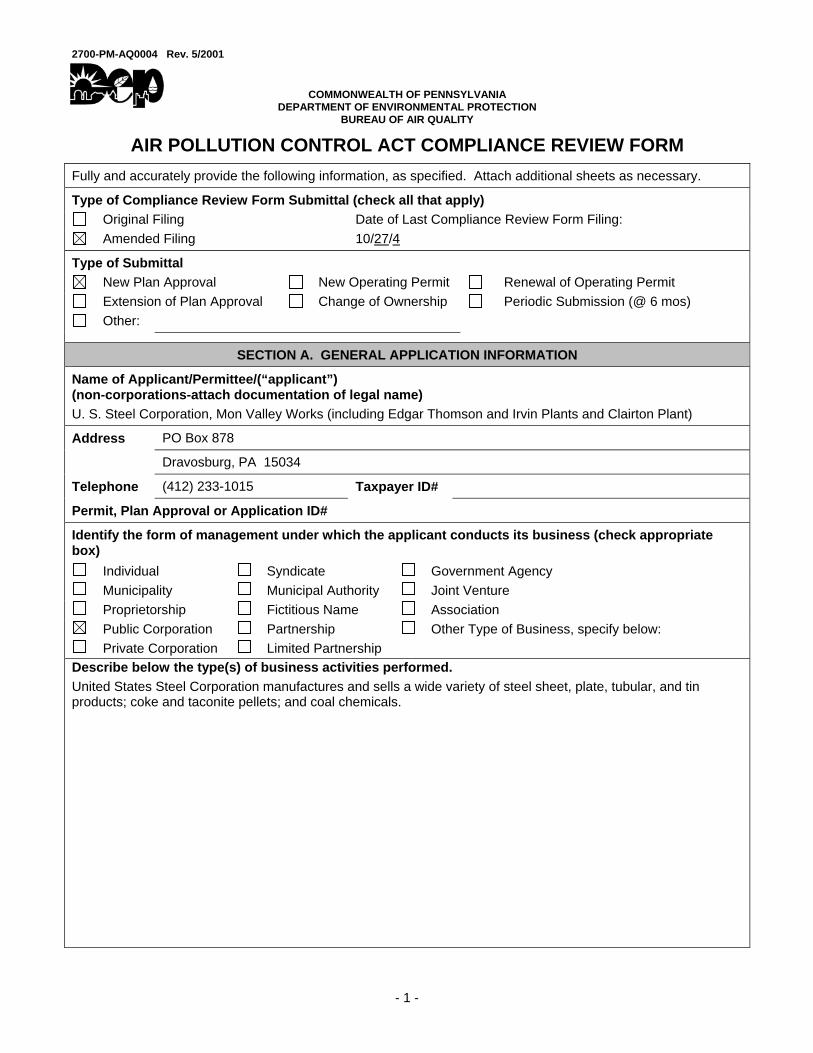
2700-PM-AQ0004 Rev. 5/2001
- 1 -
COMMONWEALTH OF PENNSYLVANIA
DEPARTMENT OF ENVIRONMENTAL PROTECTION BUREAU OF AIR QUALITY
AIR POLLUTION CONTROL ACT COMPLIANCE REVIEW FORM Fully and accurately provide the following information, as specified. Attach additional sheets as necessary.
Type of Compliance Review Form Submittal (check all that apply) Original Filing Date of Last Compliance Review Form Filing: Amended Filing 10/27/4
Type of Submittal New Plan Approval New Operating Permit Renewal of Operating Permit Extension of Plan Approval Change of Ownership Periodic Submission (@ 6 mos) Other:
SECTION A. GENERAL APPLICATION INFORMATION
Name of Applicant/Permittee/(“applicant”) (non-corporations-attach documentation of legal name) U. S. Steel Corporation, Mon Valley Works (including Edgar Thomson and Irvin Plants and Clairton Plant)
Address PO Box 878
Dravosburg, PA 15034
Telephone (412) 233-1015 Taxpayer ID#
Permit, Plan Approval or Application ID#
Identify the form of management under which the applicant conducts its business (check appropriate box)
Individual Syndicate Government Agency Municipality Municipal Authority Joint Venture Proprietorship Fictitious Name Association Public Corporation Partnership Other Type of Business, specify below: Private Corporation Limited Partnership
Describe below the type(s) of business activities performed. United States Steel Corporation manufactures and sells a wide variety of steel sheet, plate, tubular, and tin products; coke and taconite pellets; and coal chemicals.

2700-PM-AQ0004 Rev. 5/2001
- 2 -
SECTION B. GENERAL INFORMATION REGARDING “APPLICANT”
If applicant is a corporation or a division or other unit of a corporation, provide the names, principal places of business, state of incorporation, and taxpayer ID numbers of all domestic and foreign parent corporations (including the ultimate parent corporation), and all domestic and foreign subsidiary corporations of the ultimate parent corporation with operations in Pennsylvania. Please include all corporate divisions or units, (whether incorporated or unincorporated) and privately held corporations. (A diagram of corporate relationships may be provided to illustrate corporate relationships.) Attach additional sheets as necessary.
Unit Name Principal Places
of Business State of
Incorporation Taxpayer ID Relationship to Applicant
United States Steel USA Delaware 25-1897152 Parent Europe Pa Direct Pay # 00401 Canada
SECTION C. SPECIFIC INFORMATION REGARDING APPLICANT AND ITS “RELATED PARTIES” Pennsylvania Facilities. List the name and location (mailing address, municipality, county), telephone number, and relationship to applicant (parent, subsidiary or general partner) of applicant and all Related Parties' places of business, and facilities in Pennsylvania. Attach additional sheets as necessary.
Unit Name Street Address County and Municipality
Telephone No.
Relationship to Applicant
Clairton Plant 400 State Street Allegheny/Clairton (412) 233-1015
Self
Edgar Thomson Plant
13th Street and Braddock Avenue
Allegheny/Braddock (412) 273-4730
Self
Irvin Plant PO Box 878 Allegheny/Dravosburg (412) 675-7381
Self
Fairless Plant Pennsylvania Avenue Bucks/Fairless Hills (215) 736-4000
Sister Plant
Provide the names and business addresses of all general partners of the applicant and parent and subsidiary corporations, if any.
Name Business Address N/A
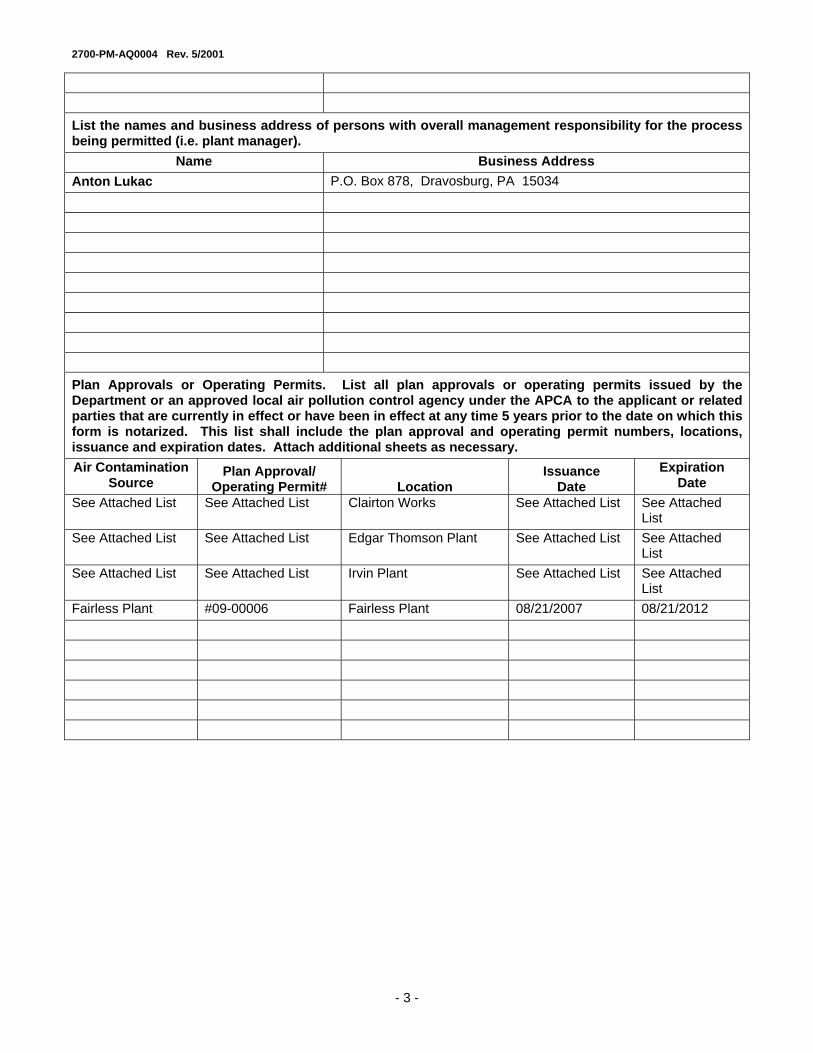
2700-PM-AQ0004 Rev. 5/2001
- 3 -
List the names and business address of persons with overall management responsibility for the process being permitted (i.e. plant manager).
Name Business Address Anton Lukac P.O. Box 878, Dravosburg, PA 15034
Plan Approvals or Operating Permits. List all plan approvals or operating permits issued by the Department or an approved local air pollution control agency under the APCA to the applicant or related parties that are currently in effect or have been in effect at any time 5 years prior to the date on which this form is notarized. This list shall include the plan approval and operating permit numbers, locations, issuance and expiration dates. Attach additional sheets as necessary. Air Contamination
Source Plan Approval/
Operating Permit# Location Issuance
Date Expiration
Date See Attached List See Attached List Clairton Works See Attached List See Attached
List See Attached List See Attached List Edgar Thomson Plant See Attached List See Attached
List See Attached List See Attached List Irvin Plant See Attached List See Attached
List Fairless Plant #09-00006 Fairless Plant 08/21/2007 08/21/2012

2700-PM-AQ0004 Rev. 5/2001
- 4 -
Compliance Background. (Note: Copies of specific documents, if applicable, must be made available to the Department upon its request.) List all documented conduct of violations or enforcement actions identified by the Department pursuant to the APCA, regulations, terms and conditions of an operating permit or plan approval or order by applicant or any related party, using the following format grouped by source and location in reverse chronological order. Attach additional sheets as necessary. See the definition of "documented conduct" for further clarification. Unless specifically directed by the Department, deviations which have been previously reported to the Department in writing, relating to monitoring and reporting, need not be reported.
Date Location
Plan Approval/ Operating Permit#
Nature of Documented
Conduct
Type of Departmen
t Action
Status: Litigation
Existing/Continuing or
Corrected/Date
Dollar Amount Penalty
02/28/05 Clairton Article XXI Battery Emissions SOV Final $11,150 05/10/05 Clairton Article XXI Battery Emissions SOV Final $4125 01/06/06 Clairton Article XXI Battery Emissions SOV Final $16,200 03/24/06 Clairton Article XXI Battery Emissions SOV Final $11,950 05/08/06 Clairton Article XXI Battery Emissions SOV Final $3,800 08/16/06 Clairton Article XXI Battery Emissions SOV Final $29,300 02/20/07 Clairton Article XXI Battery Emissions SOV Final $4,050 05/25/07 Clairton Article XXI Battery Emissions SOV Final $1,725 06/01/07 Clairton Article XXI Battery & PEC
Emissions NOV Final $395,900
08/30/07 Clairton Article XXI Battery Emissions SOV Final $2,700 11/29/07 Clairton Article XXI Battery Emissions SOV Final $3,050 06/10/05 Edgar
Thomson Article XXI BOP SOV Final $3425
List all incidents of deviations of the APCA, regulations, terms and conditions of an operating permit or plan approval or order by applicant or any related party, using the following format grouped by source and location in reverse chronological order. This list must include items both currently known and unknown to the Department. Attach additional sheets as necessary. See the definition of "deviations" for further clarification.
Date Location Plan Approval/
Operating Permit# Nature of Deviation
Incident Status: Litigation
Existing/Continuing Or
Corrected/Date 10/04 - 12/07 Edgar Thompson Article XXI BOP roof VE see compliance plan 10/04 - 12/07 Edgar Thompson Article XXI LMF see compliance plan 10/04 – 12/07 Edgar Thompson Article XXI BOP Stack See compliance plan 10/04 – 12-07 Edgar Thompson Article XXI Mixer See compliance plan 10/04 - 12/07 Clairton Article XXI Pushing & travel VE see compliance plan 10/04 - 12/07 Clairton Article XXI Stacks VE see compliance plan 10/04 - 12/07 Clairton Article XXI & Permit
#0052-I003 #3 Screening Station see compliance plan
10/04 - 12/07 Clairton Article XXI B PEC Baghouse see compliance plan 02/07 – 12/07 Irvin Article XXI & Permit #
0050 See attached See attached
CONTINUING OBLIGATION. Applicant is under a continuing obligation to update this form using the Compliance Review Supplemental Form if any additional deviations occur between the date of submission and Department action on the application.


1 of 11
U.S. Steel Clairton Works Pushing / Travel and Stack Schedule of Compliance For Batteries 1, 2, and 3
Schedule M January 2, 2008
Compliance Plan Element Milestone Date
1. Conduct comprehensive 3rd party battery inspection.
Complete Complete
2. Complete automation of reversing rooms.
July 31, 2008
3. Develop and implement advanced patching program.
Ongoing Ongoing
4. Develop and implement end flue nozzle repair and replacement plan.
Ongoing Ongoing
5. Submit permit application for C Battery.
January 2, 2008
6. Begin construction of C Battery.
When final permit issued without appeal.
7. Begin operations on C Battery.
December 31, 2011*
8. Shut down 1-3 Batteries.
December 31, 2012*/**
9. Compliance on C Battery.
December 31, 2012*/**
* Date contingent on obtaining permit by June 30, 2008. ** An interim milestone date, which is missed, is not a permit violation provided
the final compliance date(s) are met
Schedule M Supplement
Issue: A review of current monitoring data indicates that these batteries do not achieve continuous compliance with applicable opacity requirements for pushing, travel, and stack fugitive visible emissions.
Citation: ACHD Article XXI, §2105.21(e)(4) and §2105.21(e)(5) and §2105.21(f)(3) and §2105.21(f)(4)
Compliance Plan Description: After an extensive inspection and review of available compliance data, U. S. Steel has determined that environmental compliance can not be sustained on Batteries 1, 2, or 3. U. S. Steel is preparing a permit application and engineering design of a new battery (C Battery). C Battery is proposed to be a 6-meter battery and will replace the production capacity of Batteries 1, 2, and 3.
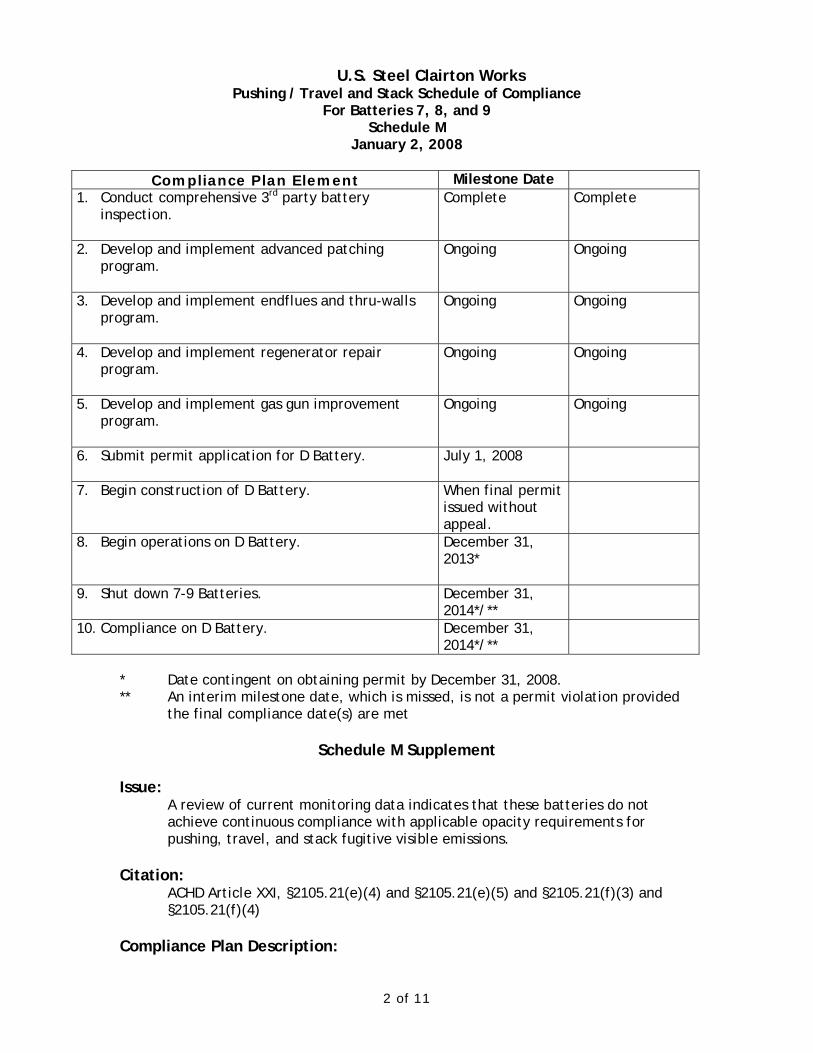
2 of 11
U.S. Steel Clairton Works Pushing / Travel and Stack Schedule of Compliance
For Batteries 7, 8, and 9 Schedule M
January 2, 2008
Compliance Plan Element Milestone Date 1. Conduct comprehensive 3rd party battery
inspection.
Complete Complete
2. Develop and implement advanced patching program.
Ongoing Ongoing
3. Develop and implement endflues and thru-walls program.
Ongoing Ongoing
4. Develop and implement regenerator repair program.
Ongoing Ongoing
5. Develop and implement gas gun improvement program.
Ongoing Ongoing
6. Submit permit application for D Battery.
July 1, 2008
7. Begin construction of D Battery.
When final permit issued without appeal.
8. Begin operations on D Battery.
December 31, 2013*
9. Shut down 7-9 Batteries.
December 31, 2014*/**
10. Compliance on D Battery.
December 31, 2014*/**
* Date contingent on obtaining permit by December 31, 2008. ** An interim milestone date, which is missed, is not a permit violation provided
the final compliance date(s) are met
Schedule M Supplement
Issue: A review of current monitoring data indicates that these batteries do not achieve continuous compliance with applicable opacity requirements for pushing, travel, and stack fugitive visible emissions.
Citation: ACHD Article XXI, §2105.21(e)(4) and §2105.21(e)(5) and §2105.21(f)(3) and §2105.21(f)(4)
Compliance Plan Description:

3 of 11
After an extensive inspection and review of available compliance data, U. S. Steel has determined that environmental compliance can not be sustained on Batteries 7, 8, or 9. U. S. Steel is preparing a permit application and engineering design of a new battery (D Battery). D Battery is proposed to be a 6-meter battery and will replace the production capacity of Batteries 7, 8, and 9.

4 of 11
U.S. Steel Clairton Works Underfire Combustion Stack Schedule of Compliance
For Battery 15 Schedule M
January 2, 2008
Compliance Plan Element Milestone Date 1. Evaluation
a. Conduct a comprehensive study and develop a plan to achieve compliance with the 20% opacity and 60% opacity standards for 15 Battery.
Complete Complete
2. The following items of the plan are complete: a. Clean regenerators b. Clean flues c. Survey goosenecks and standpipes and
prioritize for repair d. Replace leaking aspirating steam valves e. Modify and install sliding brick f. Battery setting coarse adjustment g. Adjust tie rods h. Order additional dry gunning equipment i. Increase patching and flue clean-out
resources
Complete Complete
3. Battery setting final adjustment 10/31/07 Complete 4. Replace end flue casting inspection blocks
as identified by survey. 11/30/07 Complete
5. Begin implementation of an enhanced preventive maintenance refractory repair program* to include:
a. Dry gunning all oven ends b. Dry gunning all standpipe interiors c. Dry gunning all charging holes d. Perform ceramic welding and replace
standpipes where dry gunning is not sufficient.
This preventive maintenance will be performed on each oven semi-annually. The first round of preventive maintenance will be complete on all ovens by 12/31/07.
12/31/07 Complete
6. Complete the second round of the enhanced preventive maintenance refractory repair program.
6/30/08
7. Complete the third round of the enhanced preventive maintenance refractory repair program.
12/31/08
8. Achieve Compliance with Article XXI 20% and 60% opacity standards.
12/31/08 **
* The program will be updated as required to maintain compliance.

5 of 11
** An interim milestone date, which is missed, is not a permit violation
provided the final compliance date(s) are met

6 of 11
U. S. Steel Clairton Works Schedule M Supplement
Underfire Combustion Stack Opacity for Battery 15 January 2, 2008
Issue:
A review of current monitoring data indicates that this battery does not achieve continuous compliance with applicable opacity requirements for combustion stack visible emissions.
Citation: ACHD Article XXI, §2105.21(f)(3) and §2105.21(f)(4)
Compliance Plan Description: Combustion stack visible emissions occur when process gases leak into the battery heating flues. The compliance plan utilizes pollution prevention elements to achieve continuous compliance. The compliance plan elements are briefly described as follows: • Conduct a comprehensive study and develop and implement a plan to
achieve compliance with the 20% opacity and 60% opacity standards for 15 Battery.

7 of 11
U.S. Steel Clairton Works
Pushing / Travel and Stacks Schedule of Compliance For Battery 19
Schedule M January 2, 2008
Compliance Plan Element Milestone Date
1. Conduct comprehensive 3rd party battery inspection.
Complete Complete
2. Replace 12 walls on 19 Battery.
Complete Complete
3. Develop and implement advanced patching program.
Ongoing Ongoing
4. Replace 25 walls on 19 Battery.
October 31, 2012
5. Compliance on 19 Battery
December 31, 2012**
** An interim milestone date, which is missed, is not a permit violation
provided the final compliance date(s) are met
Schedule M Supplement
Issue: A review of current monitoring data indicates that this battery does not achieve continuous compliance with applicable opacity requirements for pushing and travel fugitive visible emissions.
Citation: ACHD Article XXI, §2105.21(e)(4), §2105.21(e)(5), and §2105.21(f)(3) and §2105.21(f)(4)
Compliance Plan Description: Oven wall damage and deterioration can result in raw coke oven gas leakage to the battery heating flues. The oven inspection program referred to in the compliance plan will identify deteriorated or damaged refractory that may contribute to pushing and travel emissions. It has been identified that all of the remaining walls on the Battery.
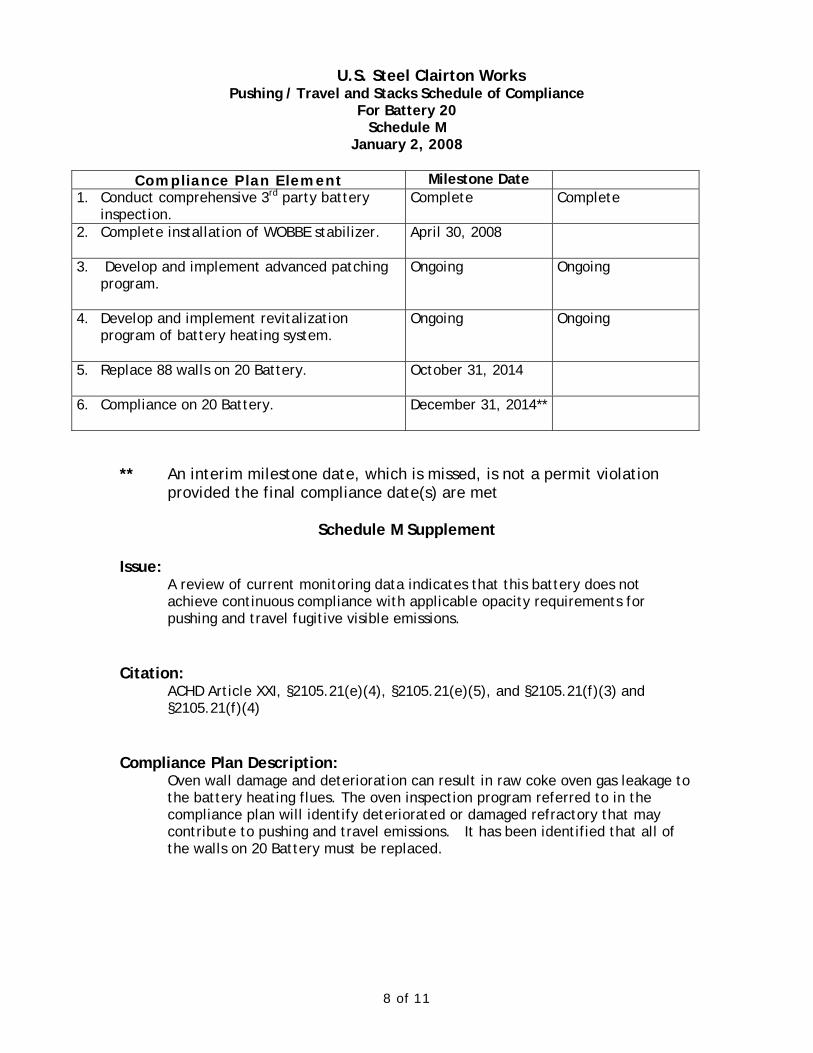
8 of 11
U.S. Steel Clairton Works Pushing / Travel and Stacks Schedule of Compliance
For Battery 20 Schedule M
January 2, 2008
Compliance Plan Element Milestone Date 1. Conduct comprehensive 3rd party battery
inspection. Complete Complete
2. Complete installation of WOBBE stabilizer.
April 30, 2008
3. Develop and implement advanced patching program.
Ongoing Ongoing
4. Develop and implement revitalization program of battery heating system.
Ongoing Ongoing
5. Replace 88 walls on 20 Battery.
October 31, 2014
6. Compliance on 20 Battery.
December 31, 2014**
** An interim milestone date, which is missed, is not a permit violation
provided the final compliance date(s) are met
Schedule M Supplement
Issue: A review of current monitoring data indicates that this battery does not achieve continuous compliance with applicable opacity requirements for pushing and travel fugitive visible emissions.
Citation: ACHD Article XXI, §2105.21(e)(4), §2105.21(e)(5), and §2105.21(f)(3) and §2105.21(f)(4)
Compliance Plan Description: Oven wall damage and deterioration can result in raw coke oven gas leakage to the battery heating flues. The oven inspection program referred to in the compliance plan will identify deteriorated or damaged refractory that may contribute to pushing and travel emissions. It has been identified that all of the walls on 20 Battery must be replaced.

9 of 11
U.S. Steel Clairton Works PEC Baghouse and Underfire Stack Schedule of Compliance for
B Battery Schedule M
January 2, 2008
Compliance Plan Element Milestone Date 1. Data Collection Complete installation and implementation of automated data collection system on B Battery
Complete
2. Wall Inspection Perform an oven-by-oven wall inspection
Complete
3. Wall Replacement Replace 24 heating walls.
Complete
4. Wall Replacement Replace the remaining 52 heating walls.
June 30, 2010
5. Compliance Conduct a PEC emissions test to demonstrate compliance on B Battery
December 31, 2010 **
** An interim milestone date, which is missed, is not a permit violation provided
the final compliance date(s) are met
Schedule M Supplement
Issue: A review of current monitoring data indicates that this battery does not achieve continuous compliance with applicable opacity requirements for combustion stack visible emissions and particulate emissions from the PEC Baghouse.
Citation: ACHD Article XXI, §2105.21(f)(3), §2105.21(f)(4), and 2105.21.e.3
Compliance Plan Description: Combustion stack visible emissions occur when process gasses leak into the battery heating flues. PEC Baghouse particulate emissions result from non-uniform heat distribution. The compliance plan utilizes pollution prevention elements to achieve continuous compliance. The compliance plan elements are briefly described as follows:
Oven Inspections and Repairs - Oven wall damage and deterioration can result in non-uniform heat distribution. The oven inspection program referred to in the compliance plan has identified deteriorated or damaged refractory that may lead to combustion stack and PEC Baghouse stack emissions. All 76 heating walls will be replaced.
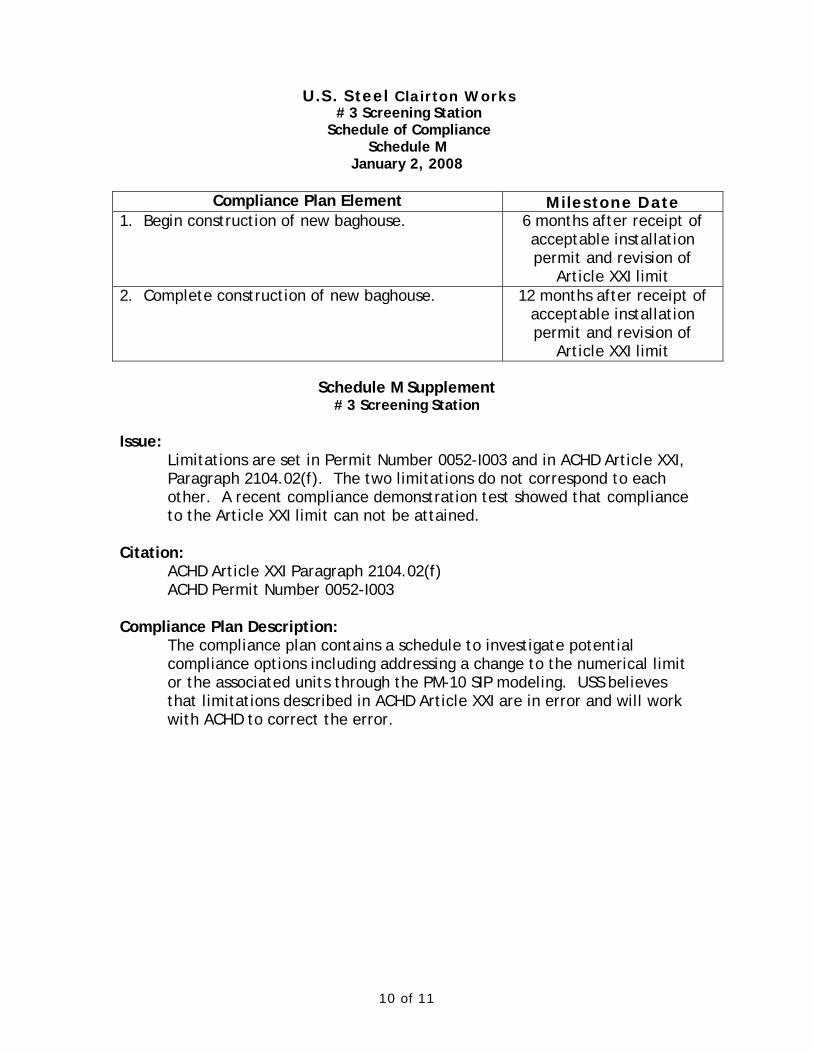
10 of 11
U.S. Steel Clairton Works
# 3 Screening Station Schedule of Compliance
Schedule M January 2, 2008
Compliance Plan Element Milestone Date
1. Begin construction of new baghouse. 6 months after receipt of acceptable installation permit and revision of
Article XXI limit 2. Complete construction of new baghouse. 12 months after receipt of
acceptable installation permit and revision of
Article XXI limit
Schedule M Supplement # 3 Screening Station
Issue:
Limitations are set in Permit Number 0052-I003 and in ACHD Article XXI, Paragraph 2104.02(f). The two limitations do not correspond to each other. A recent compliance demonstration test showed that compliance to the Article XXI limit can not be attained.
Citation: ACHD Article XXI Paragraph 2104.02(f) ACHD Permit Number 0052-I003
Compliance Plan Description: The compliance plan contains a schedule to investigate potential compliance options including addressing a change to the numerical limit or the associated units through the PM-10 SIP modeling. USS believes that limitations described in ACHD Article XXI are in error and will work with ACHD to correct the error.

11 of 11
U.S. Steel Clairton Works Pushing Schedule of Compliance – B Battery
Schedule of Compliance Schedule M
January 2, 2008
Compliance Plan Element Milestone Date 1. Conduct initial compliance evaluation Complete
2. Complete repairs to the B Battery shed Complete
3. Compliance on B Battery Complete
* USS has completed this compliance and therefore withdraws the Schedule of Compliance. USS Clairton Works is currently in compliance with ACHD Article XXI, §2105.21(e)(4) and §2105.21(e)(5) for B Battery.
Schedule M Supplement
Pushing for Batteries - B Battery
Issue: A review of current monitoring data indicates that B Battery does not achieve continuous compliance with applicable opacity requirements for pushing fugitive visible emissions.
Citation: ACHD Article XXI, §2105.21(e)(4) and §2105.21(e)(5)
Compliance Plan Description: The main element of the compliance plan is repair to the B Battery shed to improve the capture efficiency during the pushing operation. Several areas of the shed are in need of repair due to wear and tear. As part of the repair process, new techniques to improve the reliability and efficiency of the shed will be used and new materials to prolong the life of the shed will be tested. The new materials will be tested after all repairs are completed on a smaller section of the shed and if successful, will be expanded to other sections. Major repairs are necessary for any large piece of equipment in order to continue reliable, efficient day to day operations and maintain compliance with environmental regulations.
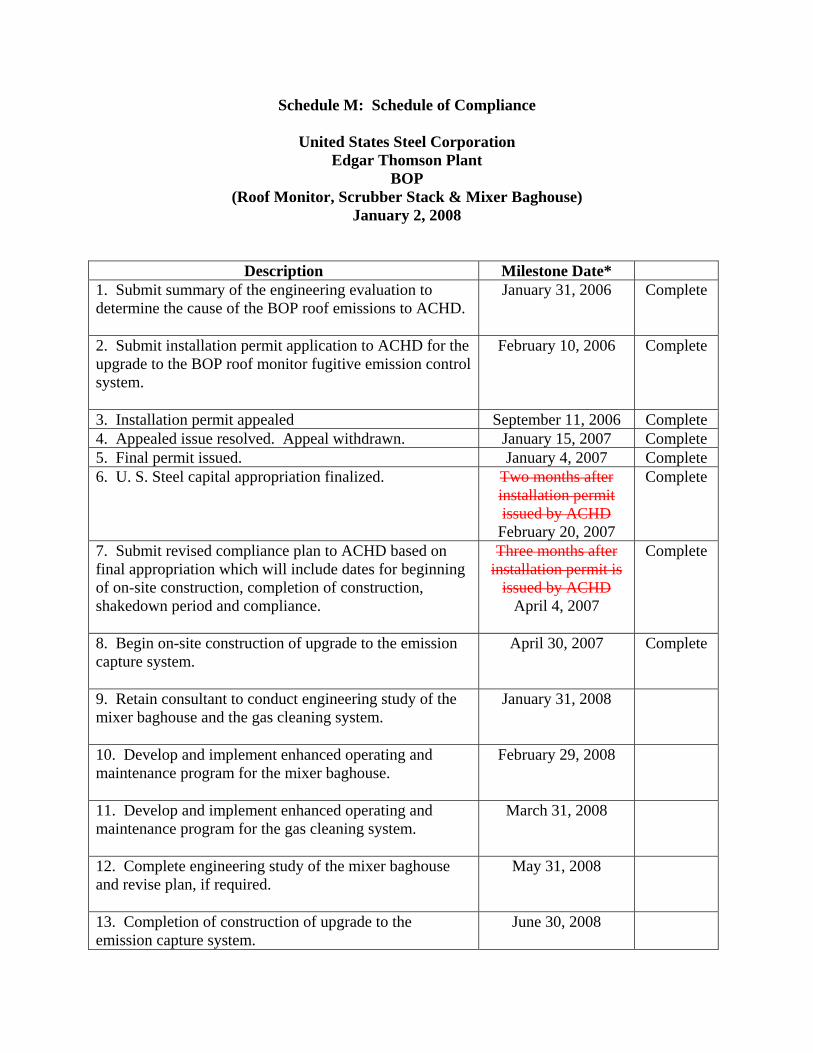
Schedule M: Schedule of Compliance
United States Steel Corporation Edgar Thomson Plant
BOP (Roof Monitor, Scrubber Stack & Mixer Baghouse)
January 2, 2008
Description Milestone Date* 1. Submit summary of the engineering evaluation to determine the cause of the BOP roof emissions to ACHD.
January 31, 2006 Complete
2. Submit installation permit application to ACHD for the upgrade to the BOP roof monitor fugitive emission control system.
February 10, 2006 Complete
3. Installation permit appealed September 11, 2006 Complete 4. Appealed issue resolved. Appeal withdrawn. January 15, 2007 Complete 5. Final permit issued. January 4, 2007 Complete 6. U. S. Steel capital appropriation finalized.
Two months after installation permit issued by ACHD
February 20, 2007
Complete
7. Submit revised compliance plan to ACHD based on final appropriation which will include dates for beginning of on-site construction, completion of construction, shakedown period and compliance.
Three months after installation permit is
issued by ACHD April 4, 2007
Complete
8. Begin on-site construction of upgrade to the emission capture system.
April 30, 2007 Complete
9. Retain consultant to conduct engineering study of the mixer baghouse and the gas cleaning system.
January 31, 2008
10. Develop and implement enhanced operating and maintenance program for the mixer baghouse.
February 29, 2008
11. Develop and implement enhanced operating and maintenance program for the gas cleaning system.
March 31, 2008
12. Complete engineering study of the mixer baghouse and revise plan, if required.
May 31, 2008
13. Completion of construction of upgrade to the emission capture system.
June 30, 2008

14. Complete engineering study of the gas cleaning system and revise plan, if required.
August 31, 2008
15. End of shakedown period of upgrade to the emission capture system.
November 30 2008
16. Complete upgrade to the emission capture system and demonstrate compliance at the BOP.
December 31, 2008
*An interim milestone date, which is missed, is not a violation provided that the final compliance date(s) are met.
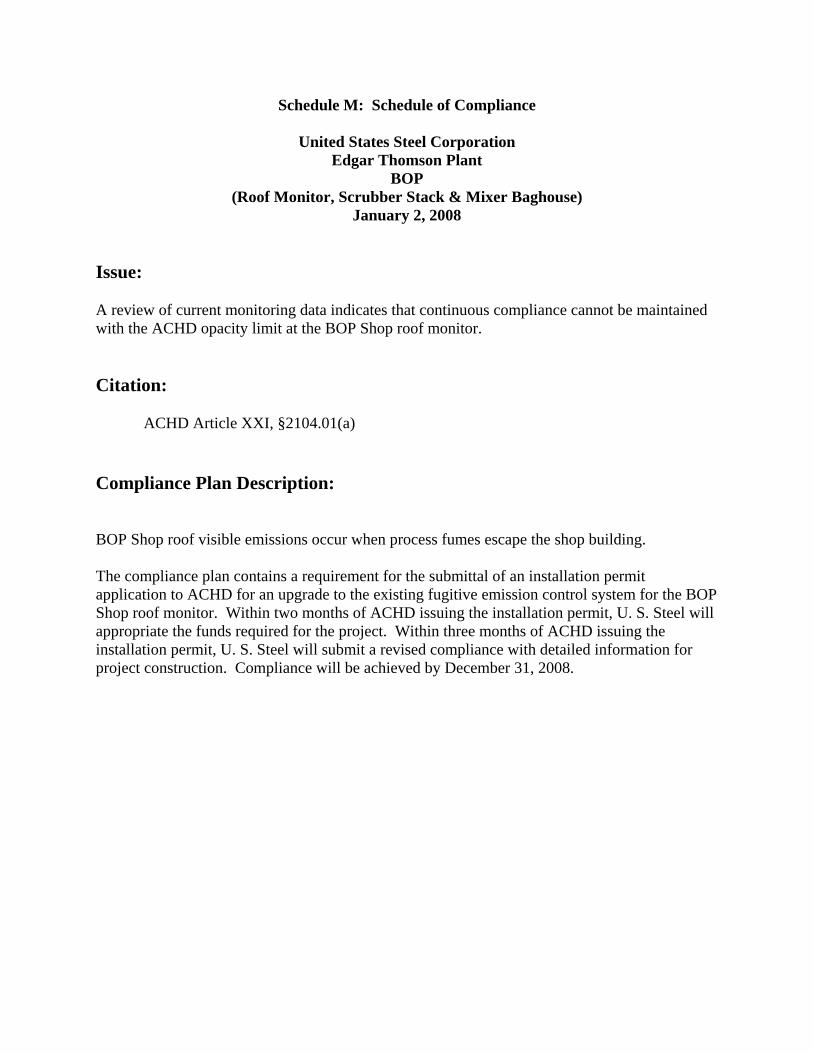
Schedule M: Schedule of Compliance
United States Steel Corporation Edgar Thomson Plant
BOP (Roof Monitor, Scrubber Stack & Mixer Baghouse)
January 2, 2008 Issue: A review of current monitoring data indicates that continuous compliance cannot be maintained with the ACHD opacity limit at the BOP Shop roof monitor. Citation: ACHD Article XXI, §2104.01(a) Compliance Plan Description: BOP Shop roof visible emissions occur when process fumes escape the shop building. The compliance plan contains a requirement for the submittal of an installation permit application to ACHD for an upgrade to the existing fugitive emission control system for the BOP Shop roof monitor. Within two months of ACHD issuing the installation permit, U. S. Steel will appropriate the funds required for the project. Within three months of ACHD issuing the installation permit, U. S. Steel will submit a revised compliance with detailed information for project construction. Compliance will be achieved by December 31, 2008.

Schedule M: Schedule of Compliance
United States Steel Corporation Edgar Thomson Plant
Caster Louvers (LMF Emissions) January 2, 2008
Description Milestone Date* 1. Retain engineering consultant(s) to evaluate the cause(s) of LMF emissions and identify options for compliance.
Complete
2. Submit summary of the engineering evaluation to evaluate options for the LMF to ACHD.
January 31, 2008
3. Develop and implement an enhanced operating and maintenance program for the LMF baghouse.
March 31, 2008
3. Complete engineering for the upgrade to the LMF baghouse.
June 30, 2008
4. Submit installation permit application to ACHD for the upgrade to the LMF baghouse.
August 31, 2008
5. U. S. Steel capital appropriation finalized. One month after installation permit issued by ACHD
6. Submit revised compliance plan to ACHD based on final appropriation which will include dates for beginning of construction, completion of construction, shakedown period and completion of project.
Two months after installation permit issued by ACHD
7. Completion of project.
December 31, 2009**
*An interim milestone date, which is missed, is not a violation provided that the final compliance date(s) are met. This final date is also contingent on receiving a timely installation permit. ** Date contingent upon issuance of installation permit and will be in step 6.

Schedule M: Schedule of Compliance
United States Steel Corporation Edgar Thomson Plant
Caster Louvers (LMF Emissions) January 2, 2008
Issue: A review of current monitoring data indicates that intermittent non-compliance exist with the ACHD opacity limit at the Caster Louvers located on the south wall of the Caster facility. Citation: ACHD Article XXI, §2104.01(a) Permit No. 90-I-003-P Compliance Plan Description: Caster Louver emissions occur when emissions from the LMF operations draft up to the Cast floor and escape the building. The compliance plan contains a requirement for performing an engineering evaluation to determine the causes of the emission and options for reduction, submitting a summary or the causes, and submittal of an updated compliance plan to correct the intermittent non-compliance.


January 2008 D:\final permit application 12-31-07\Permit Application
Technical Support Document Dec 31.doc
Appendix B Process Flow Diagrams, Site Layouts and Project Specification Sheets
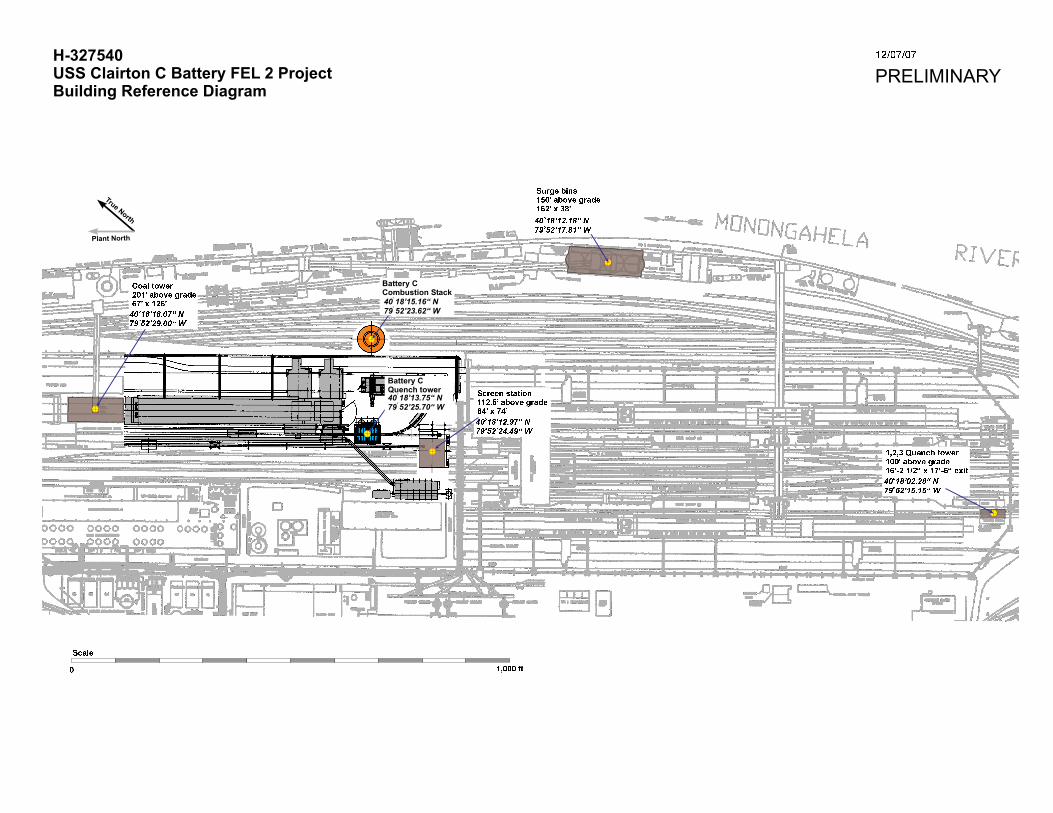
H-327540
USS Clairton C Battery FEL 2 Project
Building Reference Diagram
12/07/07PRELIMINARY
Scale0 1,000 ft
Surge bins150� above grade162� x 38�40 18�12.18� N79
oo52�17.81� W
Screen station112.5� above grade64� x 74�40 18�12.97� N79
oo52�24.49� W
1,2,3 Quench tower100� above grade16�-2 1/2� x 17�-6� exit40 18�02.28� N79
oo52�15.15� W
Coal tower201� above grade67� x 126�40 18�18.07� N79
oo52�29.00� W
Plant N
orth
T
r
u
e
N
o
r
t
h

1A conveyor and beyond feednot part of B battery feed stream
batteries 1,2,3 and 7,8,9and
Existingcoal bunkers
Existingcoal bunkers
Barge unloader3 strand 47 buckets ea.
Apron feeder
H-327540
USS Clairton C Battery FEL 2 Project
Coal Material Handling Diagram
12C conveyor
12D conveyor
12R1 conveyor
12R2 conveyor
IT2 conveyor
2C1 shuttleconveyor
2B1 conveyor
IT3A conveyor
12RT1 conveyor
12S conveyor
12K conveyor
12U reversingconveyor
West weigh belt feeders East wnot part of B battery feed stream
eigh belt feeders
Primary pulverizer forbatteries 1, 2,3 and 7,8,9
Secondary pulverizer forB battery feed stream 12P conveyor
12E shuttleconveyor12F shuttle
conveyor
New Battery C
All coal handling conveyors, transfer points,silos and crushers are enclosed inside buildings�and enclosed gallery style trusses representingcontrolled emission points
No mechanical revisions or modifications will bemade to the existing coal handling systemto facilitate the addition of Battery C installation
Existing Battery B
(4) Coal surge bins
(4) Existing coal bunkers
12A conveyor
12B conveyor
1B conveyor
1A conveyor
1E shuttleconveyor
1C shuttleconveyor
1D conveyor
Existing Batteries 7,8 9
Existing Batteries 1,2,3
1234
12/04/07PRELIMINARY

New Battery C84 ovens
Ascension pipeson pusher side onlywith PRO-ven system
H-327540
USS Clairton C Battery FEL 2 Project
Coke Oven Process Reference Diagram
Existingcombustion stack
Newcombustionstack
Existingcokesideshed
ExistingPEC baghouse
NewPEC baghouse
New Coke Transport CarPEC system that enclosesall open door events
New quench car
Existing Battery B
Existing larry car withgravity flow discharge
New larry car with improvedscrew feeder discharge
Battery C replacingexisting Batteries 1, 2, and 3with 192 ovens
12/07/07PRELIMINARY
Existingcoke wharf

H-327540
USS Clairton C Battery FEL 2 Project
Byproduct Area Diagram
Coal
bunker
Battery B coke ovens
Battery C coke ovens
Unit 2
Primary coolers and
tar decanters
Waste water treatment plant
Tar storage
Unit 1 and 2
Byproduct plant
Unit 1
Primary coolers
Unit 1
Tar decanters
Koppers Plant
Unit 1 coal handling
and preparation
12/04/07PRELIMINARY
Plant N
orth
T
r
u
e
N
o
r
t
h
Scale0 1,000 ft

H-327540
USS Clairton C Battery FEL 2 Project
Site Reference Diagram
Unit 1 coal handlingand preparation
Coke wharf Coke conveyor
Battery CCombustion Stack
Battery 1,2,3Combustion Stacks
Battery CQuench tower
Battery C coke ovens
Battery B coke ovens
Coke loadout
Coalbunker
Pushing emissioncontrol baghouse
Pushing emissioncontrol baghouses
Battery BCombustion Stack
Pushing emissioncontrol shed
Batteries 1,2 3 coke ovens
Coke loadout
Pushing emissioncontrol baghouses40 18�11.91� N79
oo52�26.12� W
40 18�11.45� N79
oo52�24.34� W
Battery CQuench tower40 18�13.75� N79
oo52�25.70� W
Battery CCombustion Stack40 18�15.16� N79
oo52�23.62� W
Battery C coke ovens40 18�16.62� N79
oo52�28.11� W
12/04/07PRELIMINARY
Plant N
orth
T
r
u
e
N
o
r
t
h
Scale0 1,000 ft

January 2008 D:\final permit application 12-31-07\Permit Application
Technical Support Document Dec 31.doc
Appendix C Emission Calculations

PSD and NONATTAINMENT NEW SOURCE REVIEW APPLICABILITY ANALYSIS
NOx 816.1 918.9 -102.8 25 NO 40 NOSO2 215.2 272.9 -57.7 40 NO N/A N/AVOC 92.1 144.3 -52.2 N/A N/A 40 NOTSP 157.2 34.0 14.7 1029.2 29.9 13.0 -866.2 N/A N/A 25 NO
PM10 85.9 14.4 0.8 689.2 13.1 6.1 -607.3 15 NO N/A N/ACO 1002.1 1158.7 -156.6 100 NO N/A N/A
Lead 0.0 0.0 0.0 0.6 NO N/A N/AH2S 134.245 266.822 -132.6 10 NO N/A N/ATRS 137.743 290.889 -153.1 10 NO N/A N/A
Table C1 - 1
Coke handling
Battery 1-3Pollutant
Emission Increases due to C Battery
Emission Decreases due to Retirement of 1-3 Batteries APPLICABILITY ANALYSIS
NA NSR Applicability?
Installation of Battery C
Coal Handling Battery C
PSD Significant Threshold
NOx, VOC nonattainment NSR applicability as precursors to ozone formation
PSD Applicability?
Net Emission Change
Coke Handling Battery C
NA NSR Significant Threshold
Retirement of Batteries
1-3
Coal handling
Battery 1-3
N/A = Not Applicable
1

PROCESS NOx SO2 VOC PM total PM filterable
PM condensib
le
PM10 TOTAL
(filt+cond)CO
tons/year tons/year tons/year tons/year tons/year tons/year tons/year tons/year
Pre-Push Emissions 11.492 5.937
WITHOUT HOODPushing Fugitives 0.1 0.7 0.6 8.1 7.4 0.7 3.9 0.5
WITH HOODPEC BH 10.5 39.1 45.5 5.5 4.4 1.1 3.0 37.2
Traveling 12.5 46.7 26.8 26.7 0.1 10.1 10.0PEC fugitives 2.6 9.7 15.8 223.3 204.0 19.2 108.0 10.3
Quenching 0.3 695.6 521.7
STACK TOTAL 892.6 118.1 32.4 38.2 27.5 10.6 36.6 398.4
Ball Mill 0.0 0.0 0.0Soaking 0.6 58.5 3.5 8.9Decarbonization 688.2
FugitivesDoors 26.0 21.3 10.6 10.6 13.0Lids 9.6 0.2 0.1 0.1 0.1
Charging 0.9 0.9 0.5 0.5 0.6Offtakes 9.6 0.6 0.3 0.3 0.3
TOTALS 918.9 272.9 144.3 1029.2 292.9 43.2 689.2 1158.7
Actual Annual Emissions for BATTERIES 1-3
Table C1 - 2 Summary of Emissio
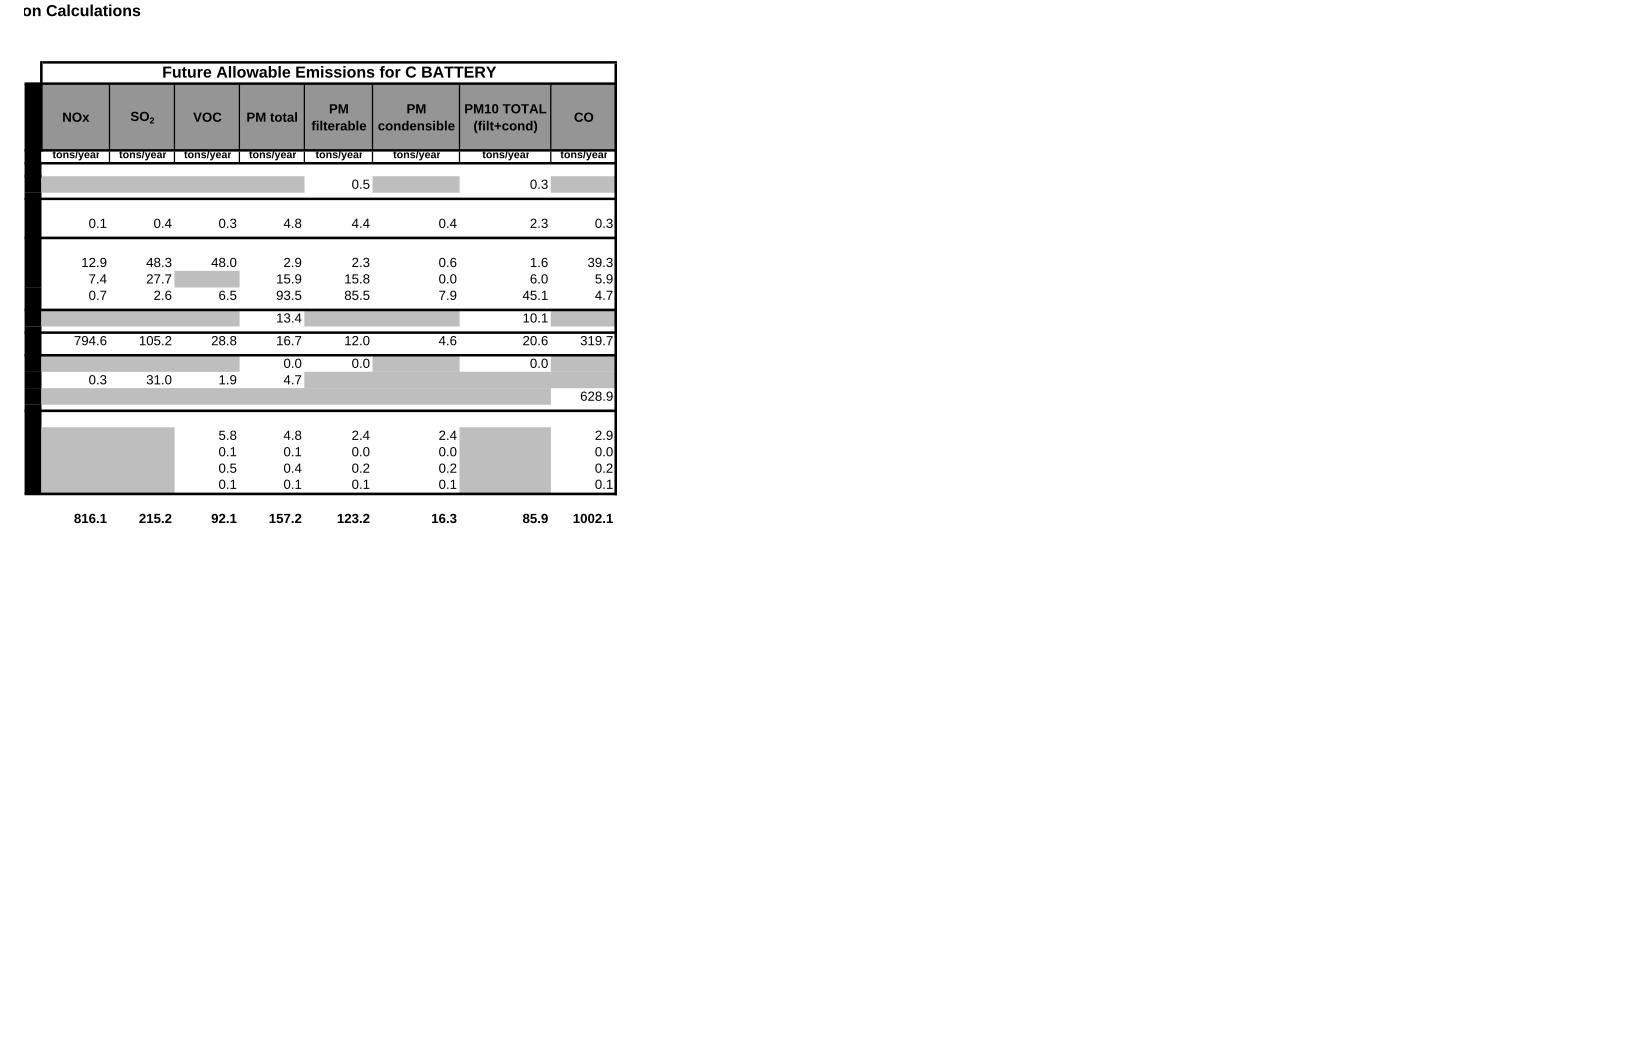
NOx SO2 VOC PM total PM filterable
PM condensible
PM10 TOTAL (filt+cond) CO
tons/year tons/year tons/year tons/year tons/year tons/year tons/year tons/year
0.5 0.3
0.1 0.4 0.3 4.8 4.4 0.4 2.3 0.3
12.9 48.3 48.0 2.9 2.3 0.6 1.6 39.37.4 27.7 15.9 15.8 0.0 6.0 5.90.7 2.6 6.5 93.5 85.5 7.9 45.1 4.7
13.4 10.1
794.6 105.2 28.8 16.7 12.0 4.6 20.6 319.7
0.0 0.0 0.00.3 31.0 1.9 4.7
628.9
5.8 4.8 2.4 2.4 2.90.1 0.1 0.0 0.0 0.00.5 0.4 0.2 0.2 0.20.1 0.1 0.1 0.1 0.1
816.1 215.2 92.1 157.2 123.2 16.3 85.9 1002.1
Future Allowable Emissions for C BATTERY
on Calculations
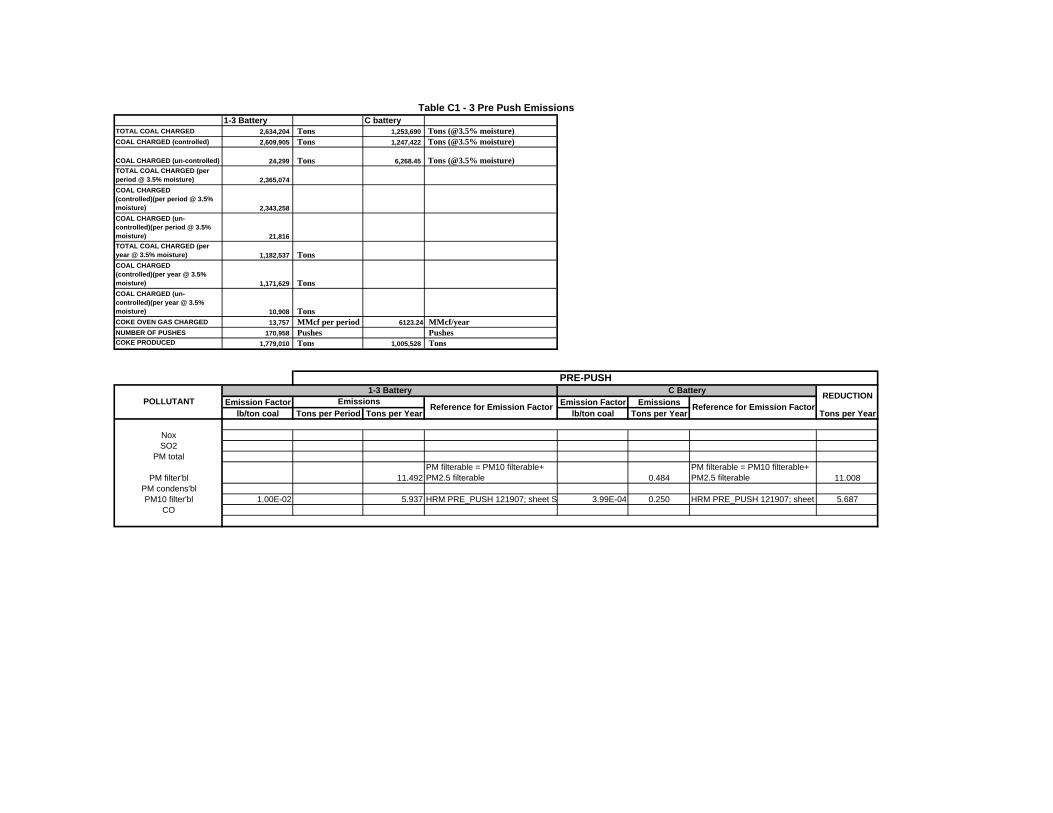
1-3 Battery C batteryTOTAL COAL CHARGED 2,634,204 Tons 1,253,690 Tons (@3.5% moisture) COAL CHARGED (controlled) 2,609,905 Tons 1,247,422 Tons (@3.5% moisture)
COAL CHARGED (un-controlled) 24,299 Tons 6,268.45 Tons (@3.5% moisture) TOTAL COAL CHARGED (per period @ 3.5% moisture) 2,365,074 COAL CHARGED (controlled)(per period @ 3.5% moisture) 2,343,258 COAL CHARGED (un-controlled)(per period @ 3.5% moisture) 21,816 TOTAL COAL CHARGED (per year @ 3.5% moisture) 1,182,537 TonsCOAL CHARGED (controlled)(per year @ 3.5% moisture) 1,171,629 TonsCOAL CHARGED (un-controlled)(per year @ 3.5% moisture) 10,908 TonsCOKE OVEN GAS CHARGED 13,757 MMcf per period 6123.24 MMcf/yearNUMBER OF PUSHES 170,958 Pushes PushesCOKE PRODUCED 1,779,010 Tons 1,005,528 Tons
Emission Factor Emission Factor Emissionslb/ton coal Tons per Period Tons per Year lb/ton coal Tons per Year Tons per Year
NoxSO2
PM total
PM filter'bl 11.492PM filterable = PM10 filterable+ PM2.5 filterable 0.484
PM filterable = PM10 filterable+ PM2.5 filterable 11.008
PM condens'blPM10 filter'bl 1.00E-02 5.937 HRM PRE_PUSH 121907; sheet S 3.99E-04 0.250 HRM PRE_PUSH 121907; sheet 5.687
CO
Table C1 - 3 Pre Push Emissions
PRE-PUSH
POLLUTANT1-3 Battery C Battery REDUCTIONEmissions Reference for Emission Factor Reference for Emission Factor

1-3 Battery C battery% uncontrolled coal 0.009 0.005TOTAL COAL CHARGED (per period @ 3.5% moisture) 2,365,074 Tons
COAL CHARGED (controlled)(per period @ 3.5% moisture) 2,343,788 TonsCOAL CHARGED (un-controlled)(per period @ 3.5% moisture) 21,286 TonsTOTAL COAL CHARGED (per year @ 3.5% moisture) 1,182,537 Tons 1,253,690 Tons (@3.5% moisture)
COAL CHARGED (controlled)(per year @ 3.5% moisture) 1,171,894 Tons 1,247,422 Tons (@3.5% moisture)COAL CHARGED (un-controlled)(per year @ 3.5% moisture) 10,643 Tons 6,268.45 Tons (@3.5% moisture)COKE OVEN GAS CHARGED 13,757 MMcf per period 6123.24 MMcf/year
NUMBER OF PUSHES 170,958 Pushes PushesCOKE PRODUCED 1,779,010 Tons 1,005,528 TonsCapture efficiency of hood 74.1% % 90 %
Emission Factor Emission Factor Emissionslb/ton coal Tons per Period Tons per Year lb/ton coal Tons per Year Tons per Year
Nox 2.56E-02 0.27 0.136AP-42, 2007; Table 12.2-9; Nox uncontrolled =0.019/74.1% capture efficiency 0.026 0.080
AP-42, 2007; Table 12.2-9; Nox uncontrolled =0.019/74.1% capture efficiency 0.056
SO2 0.132253711 1.41 0.704AP-42, 2007; Table 12.2-9; SO2 uncontrolled =0.098/74.1% capture efficiency 0.132 0.415
AP-42, 2007; Table 12.2-9; SO2 uncontrolled =0.098/74.1% capture efficiency 0.289
PM total - 8.07 TPM = PM filterable + PM condensible - 4.754 TPM = PM filterable + PM condensiblePM filter'bl 1.39E+00 14.79 7.397 AP-42, 2007; Table 12.2-6 1.390 4.357 AP-42, 2007; Table 12.2-6 3.040
PM condens'bl 1.27E-01 1.35 0.675 AP-42, 2007; Table 12.2-7 0.127 0.398 AP-42, 2007; Table 12.2-7 0.277PM10 filter'bl 6.02E-01 6.41 3.203 AP-42, 2007; Table 12.2-19; PM10 = 43.3% FPM 0.602 1.886 AP-42, 2007; Table 12.2-19; PM10 = 43.3% FPM 1.316
CO 8.50E-02 0.90 0.452AP-42, 2007; Table 12.2-9; CO uncontrolled =0.063/capture efficiency (74.1%) 0.085 0.266
AP-42, 2007; Table 12.2-9; CO uncontrolled =0.063/capture efficiency (74.1%) 0.186
VOC 1.04E-01 1.11 0.553AP-42, 2007; Table 12.2-9; VOC uncontrolled =0.077/capture efficiency (74.1%) 0.104 0.326
AP-42, 2007; Table 12.2-9; CO uncontrolled =0.063/capture efficiency (74.1%) 0.227
1-3 Battery C batteryTOTAL COAL CHARGED 2,634,204 Tons 1,193,139 TonsCOAL CHARGED (controlled) 2,609,905 Tons 1,187,173 TonsCOAL CHARGED (un-controlled) 24,299 Tons 5,965.70 TonsCOKE OVEN GAS CHARGED 13,757 MMcf 6123.24 MMcfNUMBER OF PUSHES 170,958 Pushes PushesCOKE PRODUCED 1,757,215 Tons Tons
Emission Factor Emission Factor Emissionslb/ton coal Tons per Period Tons per Year lb/ton coal Tons per Year Tons per Year
NoxSO2
PM totalPM filter'bl
PM condens'blPM10 filter'bl 1.00E-02 #REF! 7.155 HRM PRE_PUSH 121907; sheet SUMMARY 3.99E-04 0.250 HRM PRE_PUSH 121907; sheet SUMMARY 6.905
CO
Table C1 - 4 Pushing Fugitives (without Hood)
UNCONTROLLED PUSHING
POLLUTANT1-3 Battery C Battery REDUCTIONEmissions Reference for Emission Factor Reference for Emission Factor
PRE-PUSH
POLLUTANT1-3 Battery C Battery REDUCTIONEmissions Reference for Emission Factor Reference for Emission Factor

1-3 Battery C battery% uncontrolled coal 0.009 0.005TOTAL COAL CHARGED (per period @ 3.5% moisture) 2,365,074
COAL CHARGED (controlled)(perperiod @ 3.5% moisture) 2,343,788 COAL CHARGED (un-controlled)(per period @ 3.5% moisture) 21,286 TOTAL COAL CHARGED (per year @ 3.5% moisture) 1,182,537 Tons 1,253,690 Tons (@3.5% moisture)
COAL CHARGED (controlled)(peryear @ 3.5% moisture) 1,171,894 Tons 1,247,422 Tons (@3.5% moisture)COAL CHARGED (un-controlled)(per year @ 3.5% moisture) 10,643 Tons 6,268.45 Tons (@3.5% moisture)COKE OVEN GAS CHARGED 13,757 MMcf per period 6123.24 MMcf/year COKE PRODUCED 1,779,010 Tons 1,005,528 Tons BH stack flowrate 187,000 acfmBH collection efficiency 0.98 0.99 BH stack flowrate 172,040 dscfm
Emission Factor Emission Factor Emissionslb/ton coal Tons per Period Tons per Year lb/ton coal Tons per Year Tons per Year
Nox 1.77E-02 20.94 10.472From "HRM PUSH Nox & SO2 122607.xls" 2.07E-02 12.924
From "HRM PUSH Nox & SO2 122607.xls" -2.452
SO2 6.61E-02 78.19 39.095From "HRM PUSH Nox & SO2 122607.xls" 7.74E-02 48.251
From "HRM PUSH Nox & SO2 122607.xls" -9.156
PM total - 5.487TPM = PM filterable + PM condensible 2.894 TPM = PM filterable + PM condensible 2.593
PM filter'bl 3.70E-01 8.75 4.375 AP-42, 2007; Table 12.2-6 3.70E-01 2.308 AP-42, 2007; Table 12.2-6 2.068PM condens'bl 9.40E-02 2.22 1.112 AP-42, 2007; Table 12.2-7 9.40E-02 0.586 AP-42, 2007; Table 12.2-7 0.525
PM10 filter'bl 1.60E-01 3.79 1.895AP-42, 2007; Table 12.2-19; PM10 = 43.3% FPM 1.60E-01 0.999
AP-42, 2007; Table 12.2-19; PM10 = 43.3% FPM 0.895
CO 6.30E-02 74.50 37.250 AP-42, 2007; Table 12.2-9 6.30E-02 39.294 AP-42, 2007; Table 12.2-9 -2.044VOC 7.70E-02 91.06 45.528 AP-42, 2007; Table 12.2-9 7.70E-02 48.026 AP-42, 2007; Table 12.2-9 -2.498
Table C1 - 5 Pushing Emission Control (PEC) Baghouse Emissions
PEC BH
POLLUTANT1-3 Battery C Battery REDUCTIONEmissions Reference for Emission Factor Reference for Emission Factor

1-3 Battery C battery% uncontrolled coal 0.009 0.005TOTAL COAL CHARGED (per period @ 3.5% moisture) 2,365,074
COAL CHARGED (controlled)(per period @ 3.5% moisture) 2,343,788 COAL CHARGED (un-controlled)(per period @ 3.5% moisture) 21,286 TOTAL COAL CHARGED (per year @ 3.5% moisture) 1,182,537 Tons 1,253,690 Tons (@3.5% moisture)
COAL CHARGED (controlled)(per year @ 3.5% moisture) 1,171,894 Tons 1,247,422 Tons (@3.5% moisture)COAL CHARGED (un-controlled)(per year @ 3.5% moisture) 10,643 Tons 6,268.45 Tons (@3.5% moisture)COKE OVEN GAS CHARGED 13,757 MMcf per period 6123.24 MMcf/year NUMBER OF PUSHES 170,958 Pushes PushesCOKE PRODUCED 1,779,010 Tons 1,005,528 Tons
Emission Factor Emission Factor Emissionslb/ton coke/sec Tons per Period Tons per Year lb/ton coke/sec Tons per Year Tons per Year
Nox 4.541E-04 NA 12.512HRM TRAVEL 121907.xls; Travel Efs 4.541E-04 7.429
HRM TRAVEL 121907.xls; Travel Efs 5.083
SO2 1.695E-03 NA 46.712HRM TRAVEL 121907.xls; Travel Efs 1.695E-03 27.736
HRM TRAVEL 121907.xls; Travel Efs 18.976
PM total 9.712E-04 NA 26.759HRM TRAVEL 121907.xls; Travel Efs 9.712E-04 15.889
HRM TRAVEL 121907.xls; Travel Efs 10.871
PM filter'bl 9.688E-04 NA 26.693HRM TRAVEL 121907.xls; Travel Efs 9.688E-04 15.849
HRM TRAVEL 121907.xls; Travel Efs 10.844
PM condens'bl 2.422E-06 NA 0.067HRM TRAVEL 121907.xls; Travel Efs 2.422E-06 0.040
HRM TRAVEL 121907.xls; Travel Efs 0.027
PM10 filter'bl 3.633E-04 NA 10.010HRM TRAVEL 121907.xls; Travel Efs 3.633E-04 5.943
HRM TRAVEL 121907.xls; Travel Efs 4.066
CO 3.633E-04 NA 10.010HRM TRAVEL 121907.xls; Travel Efs 3.633E-04 5.943
HRM TRAVEL 121907.xls; Travel Efs 4.066
Table C1 - 6 Travel Emissions
POLLUTANT
TRAVEL1-3 Battery C Battery
Emissions Reference for Emission Factor
Reference for Emission Factor
REDUCTION

1-3 Battery C battery% uncontrolled Coal 0.009 0.005
TOTAL COAL CHARGED (per period @ 3.5% moisture) 2,365,074 COAL CHARGED (controlled)(per period @ 3.5% moisture) 2,343,788 COAL CHARGED (un-controlled)(per period @ 3.5% moisture) 21,286
TOTAL COAL CHARGED (per year @ 3.5% moisture) 1,182,537 Tons 1,253,690 Tons (@3.5% moisture)COAL CHARGED (controlled)(per year @ 3.5% moisture) 1,171,894 Tons 1,247,422 Tons (@3.5% moisture)COAL CHARGED (un-controlled)(per year @ 3.5% moisture) 10,643 Tons 6,268.45 Tons (@3.5% moisture)COKE OVEN GAS CHARGED 13,757 MMcf per period 6123.24 MMcf per yearNUMBER OF PUSHES 170,958 Pushes PushesCOKE PRODUCED 1,779,010 Tons 1,005,528 TonsHOOD Capture efficiency 74.1 % 90 %
Emission Factor Emission Factor Emissionslb/ton coal Tons per Period Tons per Year lb/ton coal Tons per Year Tons per Year
Nox 0.004 5.189 2.594 From "HRM PUSH Nox & SO2 122607.xls" 2.30E-03 0.700From "HRM PUSH Nox & SO2 122607.xls" 1.894
SO2 0.017 19.372 9.686 From "HRM PUSH Nox & SO2 122607.xls" 8.60E-03 2.615From "HRM PUSH Nox & SO2 122607.xls" 7.071
PM total 460.397 223.268 TPM = PM filterable + PM condensible 93.494 AP-42, 2007 EF / 0.741 X 0.1 129.773PM filter'bl 0.360 421.894 204.033 AP-42, 2007; Table 12.2-6 1.39E-01 85.547 AP-42, 2007 EF / 0.741 X 0.1 118.487
PM condens'bl 0.033 38.503 19.234 AP-42, 2007; Table 12.2-7 1.27E-02 7.948 AP-42, 2007 EF / 0.741 X 0.1 11.286
PM10 filter'bl 0.156 182.680 88.747AP-42, 2007; Table 12.2-19; PM10 = 43.3% FPM 6.02E-02 37.134 AP-42, 2007 EF / 0.741 X 0.1 51.614
CO 0.022 25.805 10.310AP-42, 2007; Table 12.2-9; CO uncontrolled =0.063 (capture efficiency = 74.1%) 8.50E-03 4.735 AP-42, 2007 EF / 0.741 X 0.1 5.575
VOC 0.027 31.540 15.770AP-42, 2007; Table 12.2-9; VOC uncontrolled =0.077 (capture efficiency = 74.1%) 1.04E-02 6.514 AP-42, 2007 EF / 0.741 X 0.1 9.256
Table C1 - 7 PEC Fugitives (with hood)
For 1-3 batteries, the tons per year Pushing emissions (with the hood in place and working) were calculated as (uncontrolled emissions - travelling emissions) * 0.741
PUSHING FUGITIVES
POLLUTANTC Battery REDUCTION
Reference for Emission Factor
1-3 BatteryEmissions Reference for Emission Factor

TOTAL COAL CHARGED (per year @ 3.5% moisture) 1,182,537 Tons 1,253,690 Tons (@3.5% moisture)COAL CHARGED (controlled)(per year @ 3.5% moisture) 1,171,894 Tons 1,247,422 Tons (@3.5% moisture)COAL CHARGED (un-controlled)(per year @ 3.5% moisture) 10,643 Tons 6,268.45 Tons (@3.5% moisture)COKE OVEN GAS CHARGED 13,757 MMcf per perio 6123.24 MMcf/year NUMBER OF PUSHES 170,958 Pushes PushesCOKE PRODUCED per period 1,779,010 Tons 1,005,528 Tons per yearCoke per quech 10 Tons 25 Tons
Corresponding Coal per Quench 13 Tons 35 TonsQuenches per year 88,950.50 20,110.56
Emission Factor Emission Factor Emissionslb/quench Tons per Period Tons per Year lb/ton coke Tons per Year Tons per Year
PM total 1.56E+01 1,391.19 695.593
Table 12.2-19. The TPM has been scaled up from PM2.5 by dividing the PM2.5 EF by 0.5. 2.67E-02 13.407
Scaled up from PM10 by dividing the PM10 EF by 0.75 682.186
PM10 1.17E+01 1,043.39 521.695
PM10 EF has been scaled down by multiplying the TPM EF by 0.75. 2.00E-02 10.055
Manufacturer's (UHDE) guarantee 511.639
lb/quench Tons per Period Tons per Year lb/quench Tons per Year
VOC 6.97E-03 0.62 0.310
Quench tower test conducted on B battery Quench tower on
Oct. 3-5, 2007. 6.97E-03 0.070
Quench tower test conducted on B battery
Quench tower on Oct. 3-5, 2007. 0.240
SO2 5.78E-01 51.41 25.707
Quench tower test conducted on B battery Quench tower on
Oct. 3-5, 2007. 5.78E-01 5.812
Quench tower test conducted on B battery
Quench tower on Oct. 3-5, 2007. 19.895
Table C1 - 8 Quenching Emissions
QUENCH TOWERREDUCTIONPOLLUTANT
1-3 Battery C BatteryEmissions Reference for Emission
FactorReference for Emission
Factor
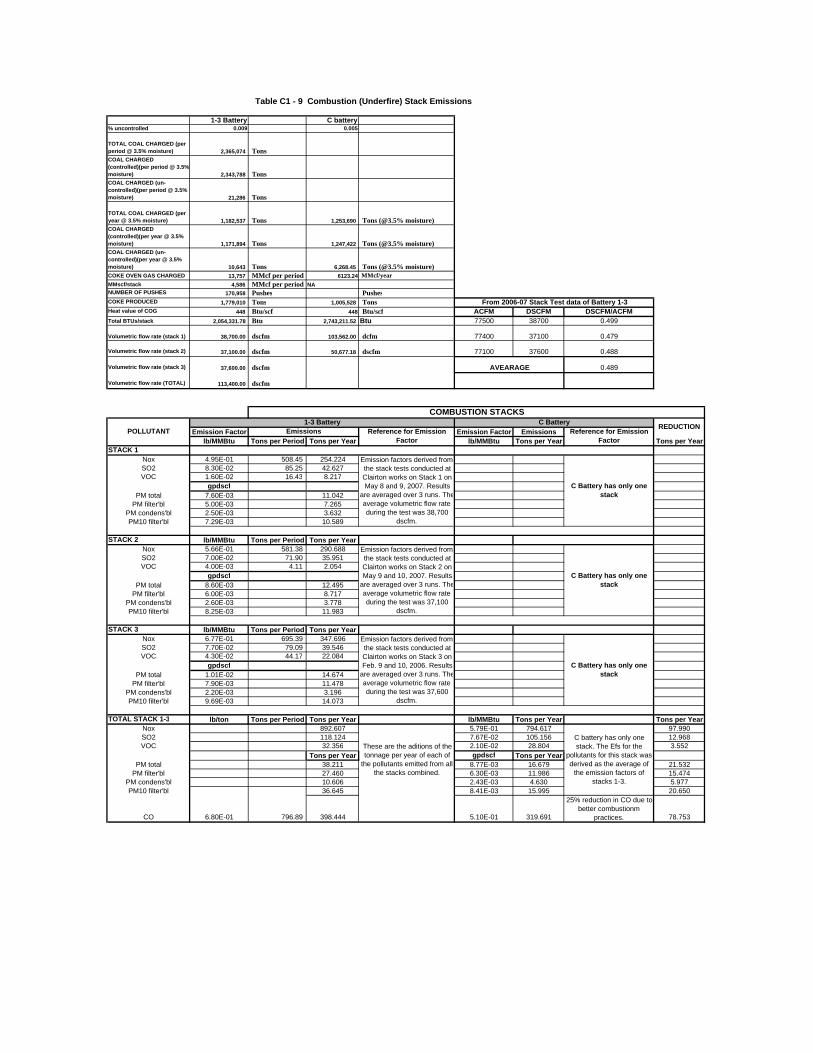
1-3 Battery C battery% uncontrolled 0.009 0.005
TOTAL COAL CHARGED (per period @ 3.5% moisture) 2,365,074 TonsCOAL CHARGED (controlled)(per period @ 3.5% moisture) 2,343,788 TonsCOAL CHARGED (un-controlled)(per period @ 3.5% moisture) 21,286 Tons
TOTAL COAL CHARGED (per year @ 3.5% moisture) 1,182,537 Tons 1,253,690 Tons (@3.5% moisture)COAL CHARGED (controlled)(per year @ 3.5% moisture) 1,171,894 Tons 1,247,422 Tons (@3.5% moisture)COAL CHARGED (un-controlled)(per year @ 3.5% moisture) 10,643 Tons 6,268.45 Tons (@3.5% moisture)COKE OVEN GAS CHARGED 13,757 MMcf per period 6123.24 MMcf/year MMscf/stack 4,586 MMcf per period NANUMBER OF PUSHES 170,958 Pushes PushesCOKE PRODUCED 1,779,010 Tons 1,005,528 TonsHeat value of COG 448 Btu/scf 448 Btu/scf ACFM DSCFM DSCFM/ACFMTotal BTUs/stack 2,054,331.78 Btu 2,743,211.52 Btu 77500 38700 0.499
Volumetric flow rate (stack 1) 38,700.00 dscfm 103,562.00 dcfm 77400 37100 0.479
Volumetric flow rate (stack 2) 37,100.00 dscfm 50,677.18 dscfm 77100 37600 0.488
Volumetric flow rate (stack 3) 37,600.00 dscfm 0.489
Volumetric flow rate (TOTAL) 113,400.00 dscfm
Emission Factor Emission Factor Emissionslb/MMBtu Tons per Period Tons per Year lb/MMBtu Tons per Year Tons per Year
STACK 1Nox 4.95E-01 508.45 254.224SO2 8.30E-02 85.25 42.627VOC 1.60E-02 16.43 8.217
gpdscfPM total 7.60E-03 11.042
PM filter'bl 5.00E-03 7.265PM condens'bl 2.50E-03 3.632PM10 filter'bl 7.29E-03 10.589
STACK 2 lb/MMBtu Tons per Period Tons per YearNox 5.66E-01 581.38 290.688SO2 7.00E-02 71.90 35.951VOC 4.00E-03 4.11 2.054
gpdscfPM total 8.60E-03 12.495
PM filter'bl 6.00E-03 8.717PM condens'bl 2.60E-03 3.778PM10 filter'bl 8.25E-03 11.983
STACK 3 lb/MMBtu Tons per Period Tons per YearNox 6.77E-01 695.39 347.696SO2 7.70E-02 79.09 39.546VOC 4.30E-02 44.17 22.084
gpdscfPM total 1.01E-02 14.674
PM filter'bl 7.90E-03 11.478PM condens'bl 2.20E-03 3.196PM10 filter'bl 9.69E-03 14.073
TOTAL STACK 1-3 lb/ton Tons per Period Tons per Year lb/MMBtu Tons per Year Tons per YearNox 892.607 5.79E-01 794.617 97.990SO2 118.124 7.67E-02 105.156 12.968VOC 32.356 2.10E-02 28.804 3.552
Tons per Year gpdscf Tons per YearPM total 38.211 8.77E-03 16.679 21.532
PM filter'bl 27.460 6.30E-03 11.986 15.474PM condens'bl 10.606 2.43E-03 4.630 5.977PM10 filter'bl 36.645 8.41E-03 15.995 20.650
CO 6.80E-01 796.89 398.444 5.10E-01 319.691
25% reduction in CO due to better combustionm
practices. 78.753
Table C1 - 9 Combustion (Underfire) Stack Emissions
AVEARAGE
These are the aditions of the tonnage per year of each of
the pollutants emitted from all the stacks combined.
POLLUTANTC Battery
Reference for Emission Factor
1-3 BatteryEmissions Reference for Emission
Factor
From 2006-07 Stack Test data of Battery 1-3
C battery has only one stack. The Efs for the
pollutants for this stack was derived as the average of
the emission factors of stacks 1-3.
C Battery has only one stack
C Battery has only one stack
C Battery has only one stack
COMBUSTION STACKS
Emission factors derived from the stack tests conducted at Clairton works on Stack 1 on May 8 and 9, 2007. Results
are averaged over 3 runs. Theaverage volumetric flow rate during the test was 38,700
dscfm.
Emission factors derived from the stack tests conducted at Clairton works on Stack 2 on May 9 and 10, 2007. Results
are averaged over 3 runs. Theaverage volumetric flow rate during the test was 37,100
dscfm.
Emission factors derived from the stack tests conducted at Clairton works on Stack 3 on Feb. 9 and 10, 2006. Results
are averaged over 3 runs. Theaverage volumetric flow rate during the test was 37,600
dscfm.
REDUCTION

1-3 Battery C battery% uncontrolled coal 0.009 0.005TOTAL COAL CHARGED (per year @ 3.5% moisture) 1,182,537 Tons 1,253,690 Tons (@3.5% moisture)COAL CHARGED (controlled)(per year @ 3.5% moisture) 1,171,894 Tons 1,247,422 Tons (@3.5% moisture)COAL CHARGED (un-controlled)(per year @ 3.5% moisture) 10,643 Tons 6,268.45 Tons (@3.5% moisture)COKE OVEN GAS CHARGED 13,757 MMcf 6123.24 MMcfNUMBER OF PUSHES 170,958 Pushes PushesCOKE PRODUCED 1,779,010 Tons 1,005,528 TonsDUST COMING OUT OF THE BH is approximately 0.063% of the coal charged 745 Tons 789.82 Tons
Emission Factor Emission Factor Emissionslb/ton BH dust Tons per Period Tons per Year lb/ton BH dust Tons per Year Tons per Year
PM filter'bl 4.00E-02 0.0149 1994 Title V Application, Appendix A 4.00E-02 0.016
1994 Title V Application, Appendix A -0.001
PM10 filter'bl 4.00E-02 0.0149 1994 Title V Application, Appendix A 4.00E-02 0.016
1994 Title V Application, Appendix A -0.001
Table C1 - 10 Ball Mill Emissions
BALL MILL
POLLUTANT1-3 Battery C Battery REDUCTIONEmissions Reference for Emission Factor Reference for Emission Factor

1-3 Battery C battery% uncontrolled coal 0.009 0.005TOTAL COAL CHARGED (per year @ 3.5% moisture) 1,182,537 Tons 1,253,690 Tons (@3.5% moisture)COAL CHARGED (controlled)(per year @ 3.5% moisture) 1,171,894 Tons 1,247,422 Tons (@3.5% moisture)COAL CHARGED (un-controlled)(per year @ 3.5% moistur 10,643 Tons 6,268.45 Tons (@3.5% moisture)COKE OVEN GAS CHARGED 13,757 MMcf per period 6123.24 MMcf/year NUMBER OF PUSHES 170,958 Pushes PushesCOKE PRODUCED 1,779,010 Tons 1,005,528 Tons
Emission Factor Emission Factor Emissionslb/ton coal Tons per Period Tons per Year lb/ton coal Tons per Year Tons per Year
Nox 1.00E-03 0.591 5.00E-04 0.313 0.278
SO2 9.90E-02 58.536 4.95E-02 31.029 27.507
VOC 6.00E-03 3.548 3.00E-03 1.881 1.667
PM total 1.50E-02 8.869 7.50E-03 4.701 4.168PM filter'bl
PM condens'blPM10 filter'bl
Reference for Emission Factor
Table C1 - 11 Soaking Emissions
AP-42, 2007; Table 12.2-18
Emission factors provided in AP-42, 2007; Table 12.2-18 were
halved because soaking emissions are expected to be
reduced by 50% by the PROven system
SOAKING
POLLUTANT1-3 Battery C Battery REDUCTIONEmissions Reference for Emission Facto

1-3 Battery C battery% uncontrolled coal 0.009 0.005TOTAL COAL CHARGED (per year @ 3.5% moisture) 1,182,537 Tons 1,253,690 Tons (@3.5% moisture)COAL CHARGED (controlled)(per year @ 3.5% moisture) 1,171,894 Tons 1,247,422 Tons (@3.5% moisture)COAL CHARGED (un-controlled)(per year @ 3.5% moisture) 10,643 Tons 6,268.45 Tons (@3.5% moisture)COKE OVEN GAS CHARGED 13,757 MMcf per period 6123.24 MMcf/year NUMBER OF PUSHES 170,958 Pushes PushesCOKE PRODUCED 1,779,010 Tons 1,005,528 Tons
Emission Factor Emission Factor Emissionslb/ton coal Tons per Period Tons per Year lb/ton coal Tons per Year Tons per Year
CO 1.16E+00 688.196From HRM DECARB 121907.xls;
CO EF's sheet 1.00E+00 628.891From HRM DECARB 121907.xls;
CO EF's sheet 59.305
Table C1 - 12 Decarbonization Emissions
DECARBONIZATION
95% of total carbon is CO2 and only 5% is emitted as CO and the EF will therefore be = EF*0.05 =1.16
POLLUTANT1-3 Battery C Battery REDUCTIONEmissions Reference for Emission Factor Reference for Emission Factor
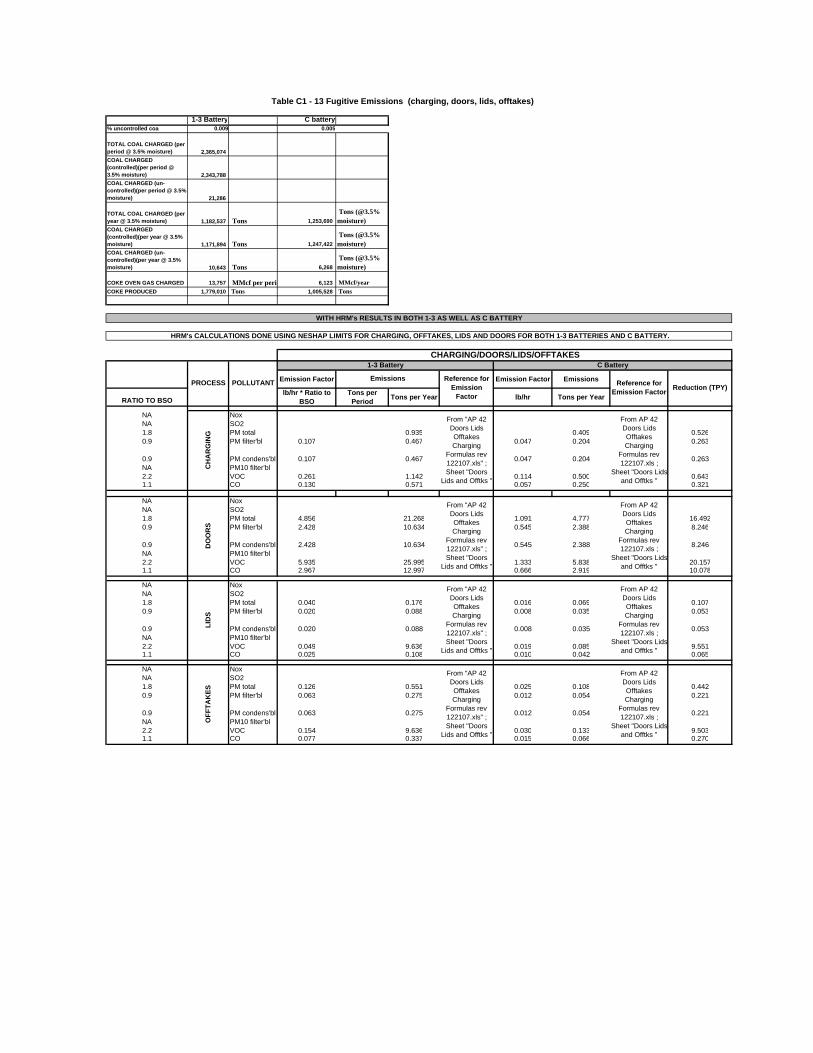
1-3 Battery C battery% uncontrolled coa 0.009 0.005
TOTAL COAL CHARGED (per period @ 3.5% moisture) 2,365,074 COAL CHARGED (controlled)(per period @ 3.5% moisture) 2,343,788 COAL CHARGED (un-controlled)(per period @ 3.5% moisture) 21,286
TOTAL COAL CHARGED (per year @ 3.5% moisture) 1,182,537 Tons 1,253,690
Tons (@3.5% moisture)
COAL CHARGED (controlled)(per year @ 3.5% moisture) 1,171,894 Tons 1,247,422
Tons (@3.5% moisture)
COAL CHARGED (un-controlled)(per year @ 3.5% moisture) 10,643 Tons 6,268
Tons (@3.5% moisture)
COKE OVEN GAS CHARGED 13,757 MMcf per peri 6,123 MMcf/year COKE PRODUCED 1,779,010 Tons 1,005,528 Tons
Emission Factor Emission Factor Emissions
RATIO TO BSOlb/hr * Ratio to
BSOTons per
Period Tons per Year lb/hr Tons per Year
NA NoxNA SO21.8 PM total 0.935 0.409 0.5260.9 PM filter'bl 0.107 0.467 0.047 0.204 0.263
0.9 PM condens'bl 0.107 0.467 0.047 0.204 0.263NA PM10 filter'bl2.2 VOC 0.261 1.142 0.114 0.500 0.6431.1 CO 0.130 0.571 0.057 0.250 0.321
NA NoxNA SO21.8 PM total 4.856 21.268 1.091 4.777 16.4920.9 PM filter'bl 2.428 10.634 0.545 2.388 8.246
0.9 PM condens'bl 2.428 10.634 0.545 2.388 8.246NA PM10 filter'bl2.2 VOC 5.935 25.995 1.333 5.838 20.1571.1 CO 2.967 12.997 0.666 2.919 10.078
NA NoxNA SO21.8 PM total 0.040 0.176 0.016 0.069 0.1070.9 PM filter'bl 0.020 0.088 0.008 0.035 0.053
0.9 PM condens'bl 0.020 0.088 0.008 0.035 0.053NA PM10 filter'bl2.2 VOC 0.049 9.636 0.019 0.085 9.5511.1 CO 0.025 0.108 0.010 0.042 0.065
NA NoxNA SO21.8 PM total 0.126 0.551 0.025 0.108 0.4420.9 PM filter'bl 0.063 0.275 0.012 0.054 0.221
0.9 PM condens'bl 0.063 0.275 0.012 0.054 0.221NA PM10 filter'bl2.2 VOC 0.154 9.636 0.030 0.133 9.5031.1 CO 0.077 0.337 0.015 0.066 0.270
Table C1 - 13 Fugitive Emissions (charging, doors, lids, offtakes)
C Battery
CH
AR
GIN
G
CHARGING/DOORS/LIDS/OFFTAKES
PROCESS POLLUTANT
DO
OR
S
From "AP 42 Doors Lids Offtakes Charging
Formulas rev 122107.xls" ; Sheet "Doors
Lids and Offtks "
LID
S
From "AP 42 Doors Lids Offtakes Charging
Formulas rev 122107.xls" ; Sheet "Doors
Lids and Offtks "
Emissions Reference for Emission
Factor
1-3 Battery
HRM's CALCULATIONS DONE USING NESHAP LIMITS FOR CHARGING, OFFTAKES, LIDS AND DOORS FOR BOTH 1-3 BATTERIES AND C BATTERY.
Reduction (TPY)
OFF
TAK
ES
From "AP 42 Doors Lids Offtakes Charging
Formulas rev 122107.xls" ; Sheet "Doors
Lids and Offtks "
WITH HRM's RESULTS IN BOTH 1-3 AS WELL AS C BATTERY
Reference for Emission Factor
From AP 42 Doors Lids Offtakes Charging
Formulas rev 122107.xls ;
Sheet "Doors Lidsand Offtks "
From AP 42 Doors Lids Offtakes Charging
Formulas rev 122107.xls ;
Sheet "Doors Lidsand Offtks "
From AP 42 Doors Lids Offtakes Charging
Formulas rev 122107.xls ;
Sheet "Doors Lidsand Offtks "
From AP 42 Doors Lids Offtakes Charging
Formulas rev 122107.xls ;
Sheet "Doors Lidsand Offtks "
From "AP 42 Doors Lids Offtakes Charging
Formulas rev 122107.xls" ; Sheet "Doors
Lids and Offtks "
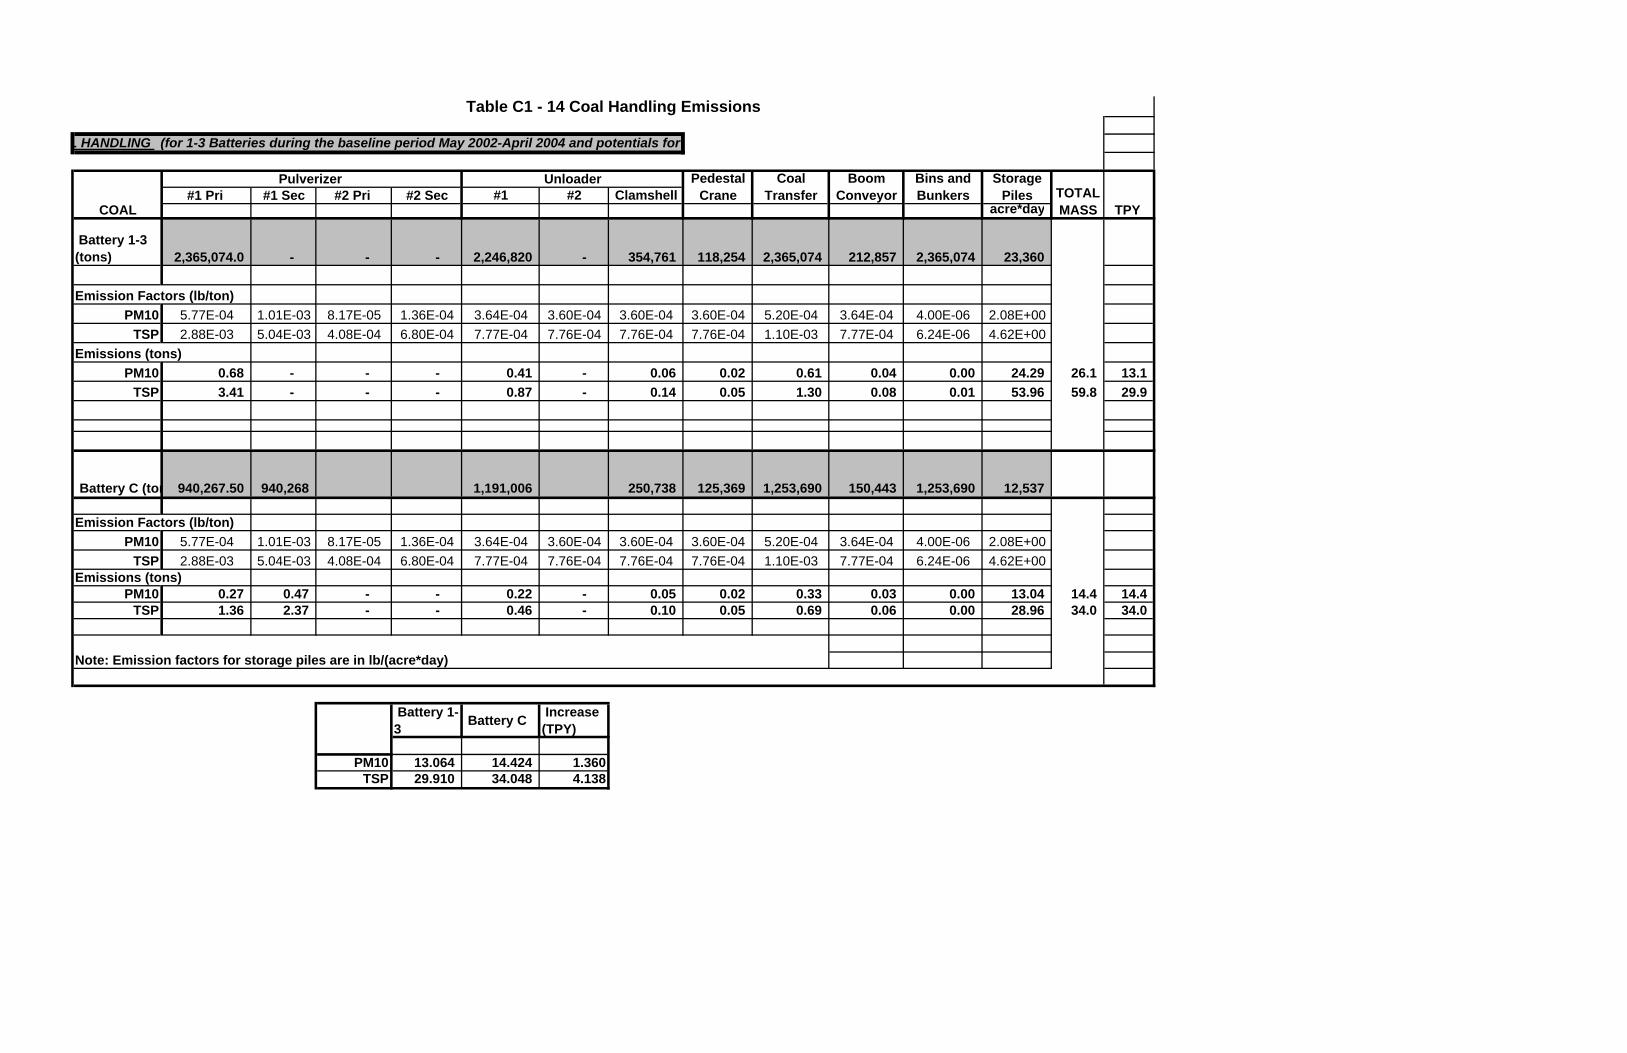
#1 Pri #1 Sec #2 Pri #2 Sec #1 #2 Clamshellacre*day
Battery 1-3 (tons) 2,365,074.0 - - - 2,246,820 - 354,761 118,254 2,365,074 212,857 2,365,074 23,360
Emission Factors (lb/ton)PM10 5.77E-04 1.01E-03 8.17E-05 1.36E-04 3.64E-04 3.60E-04 3.60E-04 3.60E-04 5.20E-04 3.64E-04 4.00E-06 2.08E+00
TSP 2.88E-03 5.04E-03 4.08E-04 6.80E-04 7.77E-04 7.76E-04 7.76E-04 7.76E-04 1.10E-03 7.77E-04 6.24E-06 4.62E+00Emissions (tons)
PM10 0.68 - - - 0.41 - 0.06 0.02 0.61 0.04 0.00 24.29 26.1 13.1 TSP 3.41 - - - 0.87 - 0.14 0.05 1.30 0.08 0.01 53.96 59.8 29.9
Battery C (ton 940,267.50 940,268 1,191,006 250,738 125,369 1,253,690 150,443 1,253,690 12,537
Emission Factors (lb/ton)PM10 5.77E-04 1.01E-03 8.17E-05 1.36E-04 3.64E-04 3.60E-04 3.60E-04 3.60E-04 5.20E-04 3.64E-04 4.00E-06 2.08E+00
TSP 2.88E-03 5.04E-03 4.08E-04 6.80E-04 7.77E-04 7.76E-04 7.76E-04 7.76E-04 1.10E-03 7.77E-04 6.24E-06 4.62E+00Emissions (tons)
PM10 0.27 0.47 - - 0.22 - 0.05 0.02 0.33 0.03 0.00 13.04 14.4 14.4 TSP 1.36 2.37 - - 0.46 - 0.10 0.05 0.69 0.06 0.00 28.96 34.0 34.0
Battery 1-3 Battery C Increase
(TPY)
PM10 13.064 14.424 1.360TSP 29.910 34.048 4.138
Table C1 - 14 Coal Handling Emissions
Storage Piles TOTAL
MASS TPY
Bins and Bunkers
L HANDLING (for 1-3 Batteries during the baseline period May 2002-April 2004 and potentials for
Note: Emission factors for storage piles are in lb/(acre*day)
Pedestal Crane
Coal Transfer
Boom Conveyor
COAL
Pulverizer Unloader

TOTAL TOTALTPP TPY
Acre*day
Battery 1-3 (tons) 4,092 1,779,010 1,779,010 1,779,010 17,434
Emission Factors (lb/ton)PM10 7.10E-03 7.10E-03 8.40E-04 7.00E-04 5.20E-01
TSP 1.50E-02 1.50E-02 1.76E-03 1.00E-03 1.16E+00Emissions (tons)
PM10 0.01 6.32 0.75 0.62 4.53 12.2 6.1 TSP 0.03 13.34 1.57 0.89 10.11 25.9 13.0
Battery C (tons) 2,313 1,005,528 1,005,528 1,005,528 9,854
Emission Factors (lb/ton)PM10 7.10E-03 7.10E-03 8.40E-04 7.00E-04 5.20E-01
TSP 1.50E-02 1.50E-02 1.76E-03 1.00E-03 1.16E+00Emissions (tons)
PM10 0.01 3.57 0.42 0.35 2.56 6.9 6.9 TSP 0.02 7.54 0.89 0.50 5.72 14.7 14.7
Battery 1-3 C Increase(TPY)PM10 6.12 6.91 0.80
TSP 12.97 14.66 1.69
Table C1 - 15 Coke Handling Emissions
Coke Pile Erosion
Note: Emission factors for storage piles are in lb/(acre*day)
MATERIAL HANDLING (for the baseline period May 2002-April 2004 and future for C battery)
COKE
Coke Pile (Load & unload) Coke Transfer Screen Stn. Screening Stn.
Loadout
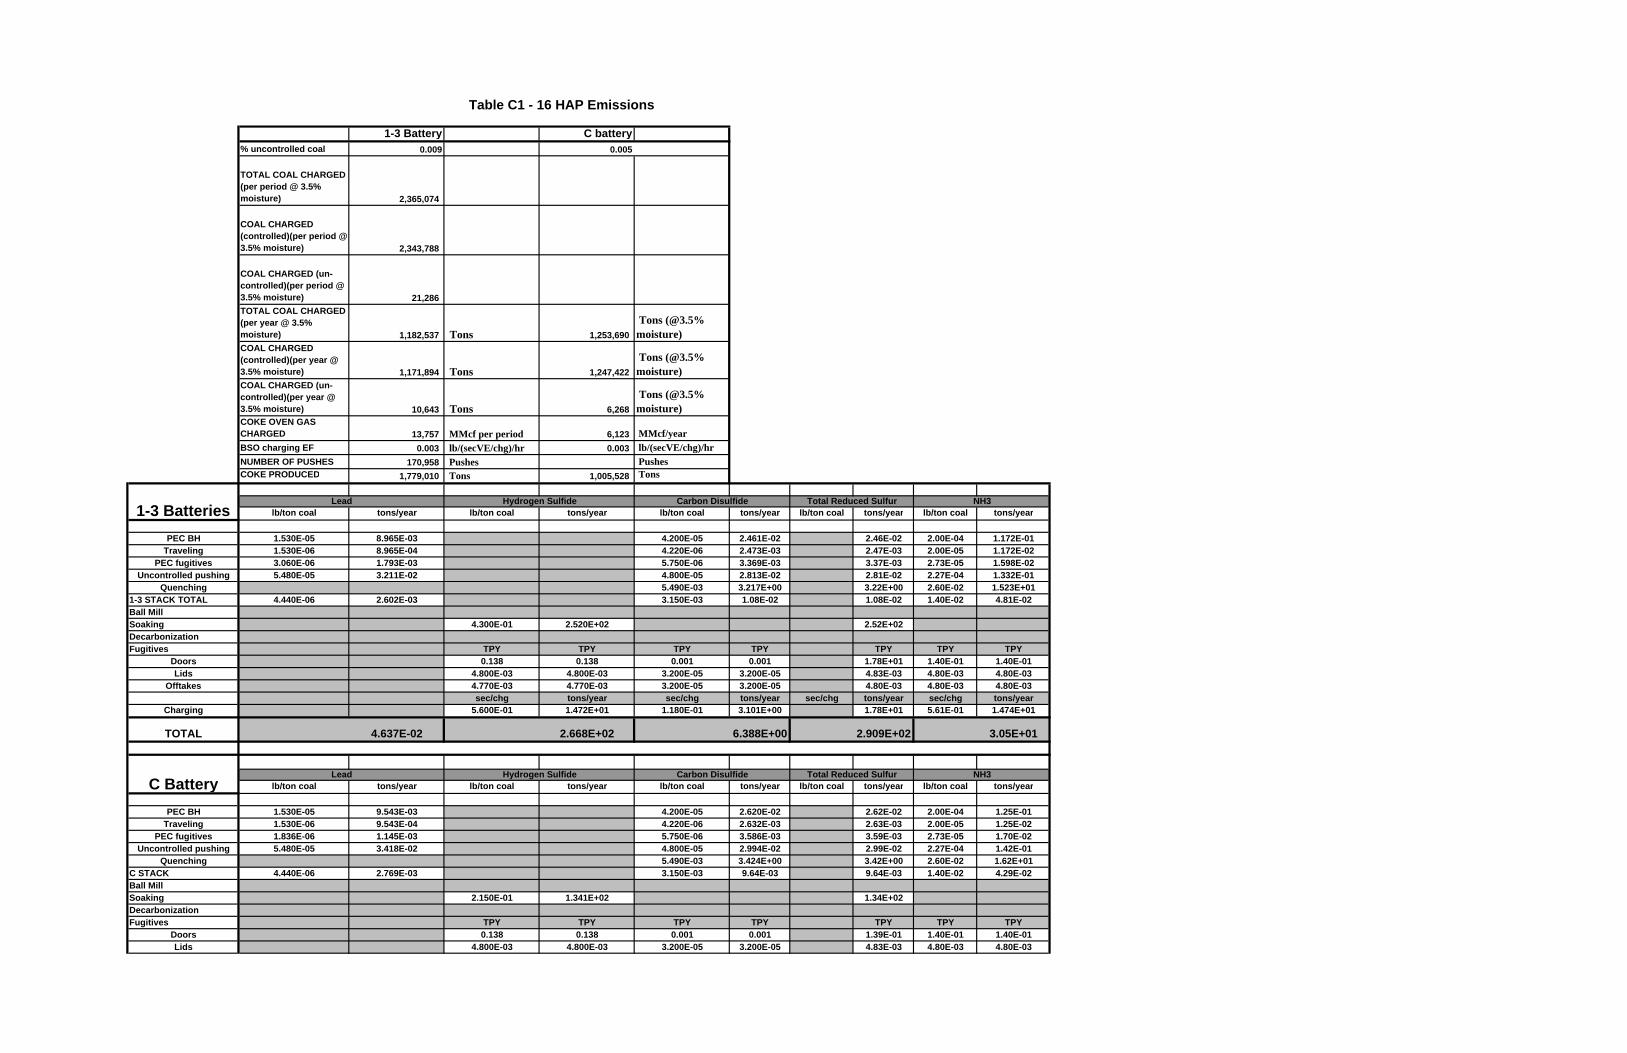
1-3 Battery C battery% uncontrolled coal 0.009 0.005
TOTAL COAL CHARGED (per period @ 3.5% moisture) 2,365,074
COAL CHARGED (controlled)(per period @ 3.5% moisture) 2,343,788
COAL CHARGED (un-controlled)(per period @ 3.5% moisture) 21,286 TOTAL COAL CHARGED (per year @ 3.5% moisture) 1,182,537 Tons 1,253,690
Tons (@3.5% moisture)
COAL CHARGED (controlled)(per year @ 3.5% moisture) 1,171,894 Tons 1,247,422
Tons (@3.5% moisture)
COAL CHARGED (un-controlled)(per year @ 3.5% moisture) 10,643 Tons 6,268
Tons (@3.5% moisture)
COKE OVEN GAS CHARGED 13,757 MMcf per period 6,123 MMcf/year BSO charging EF 0.003 lb/(secVE/chg)/hr 0.003 lb/(secVE/chg)/hr NUMBER OF PUSHES 170,958 Pushes Pushes COKE PRODUCED 1,779,010 Tons 1,005,528 Tons
lb/ton coal tons/year lb/ton coal tons/year lb/ton coal tons/year lb/ton coal tons/year lb/ton coal tons/year
PEC BH 1.530E-05 8.965E-03 4.200E-05 2.461E-02 2.46E-02 2.00E-04 1.172E-01Traveling 1.530E-06 8.965E-04 4.220E-06 2.473E-03 2.47E-03 2.00E-05 1.172E-02
PEC fugitives 3.060E-06 1.793E-03 5.750E-06 3.369E-03 3.37E-03 2.73E-05 1.598E-02Uncontrolled pushing 5.480E-05 3.211E-02 4.800E-05 2.813E-02 2.81E-02 2.27E-04 1.332E-01
Quenching 5.490E-03 3.217E+00 3.22E+00 2.60E-02 1.523E+011-3 STACK TOTAL 4.440E-06 2.602E-03 3.150E-03 1.08E-02 1.08E-02 1.40E-02 4.81E-02Ball MillSoaking 4.300E-01 2.520E+02 2.52E+02DecarbonizationFugitives TPY TPY TPY TPY TPY TPY TPY
Doors 0.138 0.138 0.001 0.001 1.78E+01 1.40E-01 1.40E-01Lids 4.800E-03 4.800E-03 3.200E-05 3.200E-05 4.83E-03 4.80E-03 4.80E-03
Offtakes 4.770E-03 4.770E-03 3.200E-05 3.200E-05 4.80E-03 4.80E-03 4.80E-03sec/chg tons/year sec/chg tons/year sec/chg tons/year sec/chg tons/year
Charging 5.600E-01 1.472E+01 1.180E-01 3.101E+00 1.78E+01 5.61E-01 1.474E+01
TOTAL 4.637E-02 2.668E+02 6.388E+00 2.909E+02 3.05E+01
lb/ton coal tons/year lb/ton coal tons/year lb/ton coal tons/year lb/ton coal tons/year lb/ton coal tons/year
PEC BH 1.530E-05 9.543E-03 4.200E-05 2.620E-02 2.62E-02 2.00E-04 1.25E-01Traveling 1.530E-06 9.543E-04 4.220E-06 2.632E-03 2.63E-03 2.00E-05 1.25E-02
PEC fugitives 1.836E-06 1.145E-03 5.750E-06 3.586E-03 3.59E-03 2.73E-05 1.70E-02Uncontrolled pushing 5.480E-05 3.418E-02 4.800E-05 2.994E-02 2.99E-02 2.27E-04 1.42E-01
Quenching 5.490E-03 3.424E+00 3.42E+00 2.60E-02 1.62E+01C STACK 4.440E-06 2.769E-03 3.150E-03 9.64E-03 9.64E-03 1.40E-02 4.29E-02Ball MillSoaking 2.150E-01 1.341E+02 1.34E+02DecarbonizationFugitives TPY TPY TPY TPY TPY TPY TPY
Doors 0.138 0.138 0.001 0.001 1.39E-01 1.40E-01 1.40E-01Lids 4.800E-03 4.800E-03 3.200E-05 3.200E-05 4.83E-03 4.80E-03 4.80E-03
Table C1 - 16 HAP Emissions
Lead Hydrogen Sulfide Carbon Disulfide Total Reduced Sulfur NH3
NH3Lead Hydrogen Sulfide Carbon Disulfide Total Reduced SulfurC Battery
1-3 Batteries

Offtakes 4.770E-03 4.770E-03 3.200E-05 3.200E-05 4.80E-03 4.80E-03 4.80E-03sec/chg tons/year sec/chg tons/year sec/chg tons/year sec/chg tons/year
Charging 5.600E-01 1.472E+01 1.180E-01 3.101E+00 1.78E+01 5.61E-01 1.474E+01
TOTAL 4.859E-02 1.342E+02 3.497E+00 1.377E+02 3.14E+01

Estimate Heat Release During DecarbJune 25, 2007 updated for C Battery 12/11/2006
(C Battery Oven Dimensions Assumed the Same as B Battery)
Input: Oven Dimensions & CapacitiesInput: Carbon Removal EstimatesInput: Technical Data & Estimates
Estimate amount of C burned from internal surfaces during Decarbonization: Clairton Batteries 1-3
Clairton Battery C
Tunnel Head Areas Height, coal line to roof (ft) 1.07 1.17Length between doors (ft) 37.38 52.96Average width (ft) 1.56 1.50SURFACE AREA (ft2) 138.4 203.0
Other Wall Areas Height to coal line (ft) 10.78 18.83Length between doors (ft) 37.38 52.96Average width (ft) 1.56 1.50SURFACE AREA (ft2) 864.1 2074.2
Charging Holes Height, roof to battery top (ft) 4.65 5.52Average length (est) (ft) 2.75 2.75Width (ft) 1.17 1.17SURFACE AREA (ft2) 36.4 43.2
(in) 0.03 0.03= (ft) 0.0025 0.0025
C Removed, Other Wall Areas (average thickness / cycle) (in) 0.01 0.01= (ft) 0.0008 0.0008
C Removed, Charging Holes (average thickness / cycle) (in) 0.03 0.03= (ft) 0.0025 0.0025
C Removed (average volume / cycle) (ft3) 1.2 2.3C Density (Graphite, Perry 7th Ed) (lb / ft3) 135 135C Removed (average weight / cycle) (lb) 156 316
Coal Charge / oven (tons) 15.7 36.8
Ovens pushed / battery / day (Ovens / battery / day) 86 110
Coal Charge (t/day) 4040 4048C Consumed (lb / ton coal) 10.0 8.6CO Produced (lb / ton coal) 23.3 20.1
Check: AP-42 CO Emissions from decarb = 29 lb of CO emitted / ton coal
Above Calculation: (lb/cycle) (Lb C / ton coal) (Equiv lb CO / ton coal)
1-3 Batts 156 9.98 23.3C Battery 316 8.60 20.11-3 Batts 1.16C Battery 1.00
RATIO CO Emissions from C Battery to 1-3 Batteries 0.862
CO Emissions Reduction from Decarbonizing = 14%
Table C2 - 1 Decarbonization Emissions
CO Emissions, 95% burnned at SP exit
Input Options Key:
C Removed, Tunnel Head (average thickness / cycle)
C Removed

Estimated BSO Emissions Rates -- Doors, Lids, Offtakes & ChargingBased on AP-42 Draft, July, 2007
Door Leaks Enter Values for Shaded Cells
Batteries 1-3 Battery C w/o PROven Battery C w/ PROven
PLD EDOORS EDOORS NDOORS NOVENS Fb EDOORS EDOORS NDOORS NOVENS Fb EDOORS EDOORS
(%) (lb/hr) (kg/hr) (number) (number) (fract) (lb/hr) (kg/hr) (number) (number) (fract) (lb/hr) (kg/hr)0 2.151 0.975 384 192 0.06 0.941 0.427 168 84 0.06 0.470 0.2131 2.295 1.041 384 192 0.06 1.004 0.455 168 84 0.06 0.502 0.2282 2.439 1.106 384 192 0.06 1.067 0.484 168 84 0.06 0.533 0.2423 2.582 1.171 384 192 0.06 1.130 0.512 168 84 0.06 0.565 0.256
NESHAP Limit 1- 3 3.8 2.698 1.223 384 192 0.06 1.180 0.535 168 84 0.06 0.590 0.2684 1.193 0.541 168 84 0.06 0.596 0.270
NESHAP Limit C 4.3 1.212 0.550 168 84 0.06 0.606 0.275ACTUAL PLD 2.3 2.482 1.126 384 192 0.06
EDOORS = BSO Emission Rate, DoorsPLD = Average Percent Leaking Doors as determined by Method 303
NOVENS = Total number of ovens on the batteryNDOORS = Total number of doors on the battery
Fb = Fraction of the doors with visible leaks from the bench but not from the yard0.06 Fb default = 0.06 in the absence of battery-specific bench observations 0.011 = Typical door leak rate for doors that from the bench have visible leaks, kg/hr0.002 = Door leak rate for doors without visible leaks, kg/hr
USS 50.0% = Percent reduction attributable to PROven
NESHAP Limits (PLD)Batteries 1-3 3.8Battery C, (6M, brownfield battery) 4.3
Batteries 1-3 Actual PLD, base period 2.3
Table C3 - 1
AP 42
1 of 4HRM
12/10/2007

Estimated BSO Emissions Rates -- Doors, Lids, Offtakes & ChargingBased on AP-42 Draft, July, 2007
Table C3 - 1
Lid Leaks Enter Values for Shaded Cells
Batteries 1-3 Battery C Battery C w/ PROven
PLL ELIDS ELIDS NLIDS NOVENS ELIDS ELIDS NLIDS NOVENS ELIDS ELIDS
(%) (lb/hr) (kg/hr) (number) (number) (lb/hr) (kg/hr) (number) (number) (lb/hr) (kg/hr)0 0.000 0.000 768 192 0.000 0.000 336 84 0.000 0.000
0.1 0.006 0.003 768 192 0.002 0.001 336 84 0.002 0.0010.2 0.011 0.005 768 192 0.005 0.002 336 84 0.004 0.0020.3 0.017 0.008 768 192 0.007 0.003 336 84 0.007 0.003
NESHAP Limit 0.4 0.022 0.010 768 192 0.010 0.004 336 84 0.009 0.004ACTUAL PLL 0.05 0.003 0.001 768 192
ELIDS = BSO Emission Rate, LidsPLL = Average Percent Leaking lids as determined by Method 303
NOVENS = Total number of ovens on the batteryNLIDS = Total number of lids on the battery0.0033 = Typical lid leak rate, kg/hr
USS 10.0% = Percent reduction attributable to PROven
NESHAP Limits (PLL)Batteries 1-3 0.4Battery C, (6M, brownfield battery) 0.4
Batteries 1-3 Actual PLD, base period 0.05
AP 42
2 of 4HRM
12/10/2007

Estimated BSO Emissions Rates -- Doors, Lids, Offtakes & ChargingBased on AP-42 Draft, July, 2007
Table C3 - 1
Offtake Leaks Enter Values for Shaded Cells
Batteries 1-3 Battery C Battery C w/ PROven
PLO EOFFTAKES EOFFTAKES NOFFTKS NOVENS EOFFTAKES EOFFTAKES NOFFTKS * NOVENS EOFFTAKES EOFFTAKES
(%) (lb/hr) (kg/hr) (number) (number) (lb/hr) (kg/hr) (number) (number) (lb/hr) (kg/hr)0.0 0.000 0.000 384 192 0.000 0.000 84 84 0.000 0.0001.0 0.028 0.013 384 192 0.006 0.003 84 84 0.006 0.0021.5 0.042 0.019 384 192 0.009 0.004 84 84 0.008 0.0042.0 0.056 0.025 384 192 0.012 0.006 84 84 0.011 0.005
NESHAP Limit 2.5 0.070 0.032 384 192 0.015 0.007 84 84 0.014 0.006ACTUAL PLO 1.0 0.028 0.013 384 192
* NOTE: REVISED FOR ONE OFFTAKE PER OVEN ON C BATTERY, NO JUMPER PIPE
EOFFTKS = BSO Emission Rate, OfftakesPLO = Average Percent Leaking lids as determined by Method 303
NOVENS = Total number of ovens on the batteryNOFFTKS = Total number of lids on the battery
0.0033 = Typical lid leak rate, kg/hrUSS 10.0% = Percent reduction attributable to PROven
NESHAP Limits (PLO)Batteries 1-3 2.5Battery C, (6M, brownfield battery) 2.5
Batteries 1-3 Actual PLD, base period 1.00
AP 42
3 of 4HRM
12/10/2007

Estimated BSO Emissions Rates -- Doors, Lids, Offtakes & ChargingBased on AP-42 Draft, July, 2007
Table C3 - 1
Charging Emissions Enter Values for Shaded Cells
Batteries 1-3 Battery C Battery C w/ PROven
VE ECHG ECHG T NOVENS ECHG ECHG T NOVENS ECHG ECHG
(sec) (lb/hr) (kg/hr) (hr) (number) (lb/hr) (kg/hr) (hr) (number) (lb/hr) (kg/hr)0.0 0.000 0.000 18 192 0.000 0.000 18 84 0.000 0.0003.0 0.030 0.013 18 192 0.013 0.006 18 84 0.013 0.0066.0 0.059 0.027 18 192 0.026 0.012 18 84 0.026 0.0129.0 0.089 0.040 18 192 0.039 0.018 18 84 0.039 0.018
NESHAP Limit 12.0 0.119 0.054 18 192 0.052 0.024 18 84 0.052 0.024ACTUAL Sec/chg 4.0 0.040 0.018 18 192
ECHG = BSO Emission Rate, ChargingChg Sec = Average Percent Leaking lids as determined by Method 303NOVENS = Total number of ovens on the battery
T = Coking cycle time, hrVE = Average seconds of visible emissions per charge
0.0042 = Typical emission rate per charge, kg/charge *USS 0.0% = Percent reduction attributable to PROven
* According to AP42 nomenclature these units are kg/charge. Proper units are kg/sec of VE.
NESHAP Limits (Sec/chg)Batteries 1-3 12Battery C, (6M, brownfield battery) 12
Batteries 1-3 Actual Sec/chg, base period 4.00
AP 42
4 of 4HRM
12/10/2007
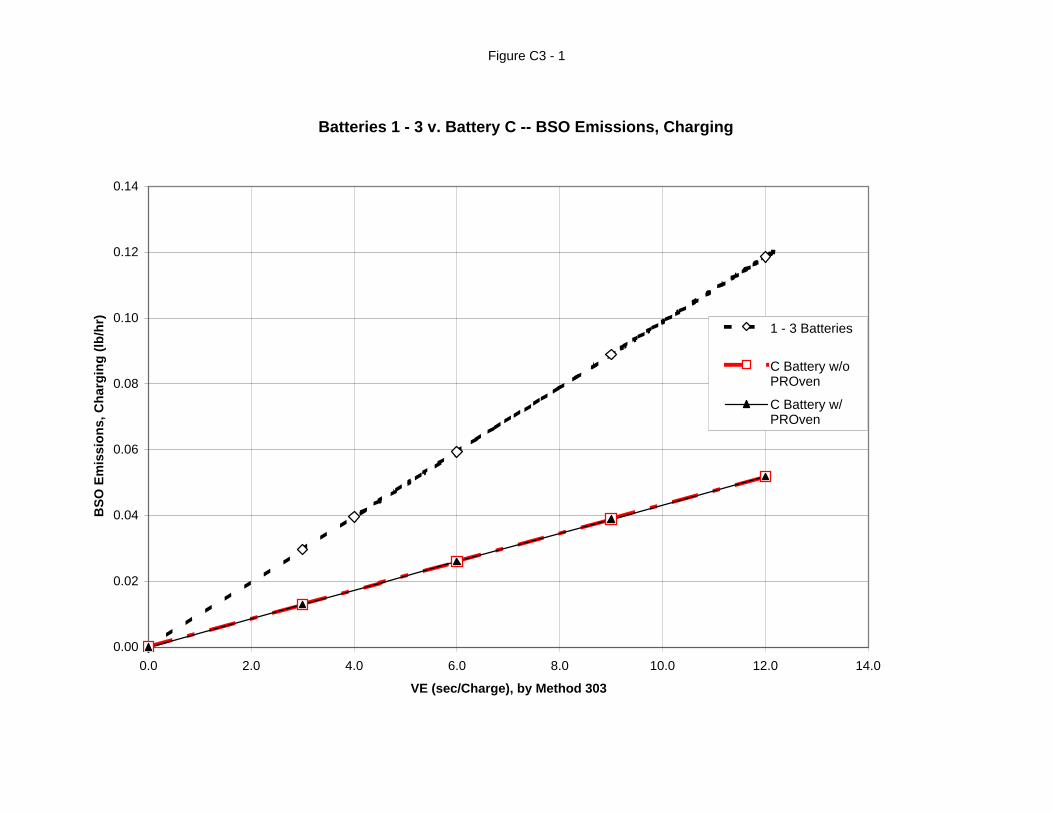
Figure C3 - 1
Batteries 1 - 3 v. Battery C -- BSO Emissions, Charging
0.00
0.02
0.04
0.06
0.08
0.10
0.12
0.14
0.0 2.0 4.0 6.0 8.0 10.0 12.0 14.0
VE (sec/Charge), by Method 303
BSO
Em
issi
ons,
Cha
rgin
g (lb
/hr) 1 - 3 Batteries
C Battery w/oPROven
C Battery w/PROven

Figure C3 - 2
Batteries 1 - 3 v. Battery C -- BSO Emissions, Offtakes
0.00
0.01
0.02
0.03
0.04
0.05
0.06
0.07
0.08
0.0 0.5 1.0 1.5 2.0 2.5 3.0
PLO by Method 303
BSO
Em
issi
ons,
Offt
akes
(lb/
hr)
1 - 3 Batteries
C Battery w/oPROven
C Battery w/PROven
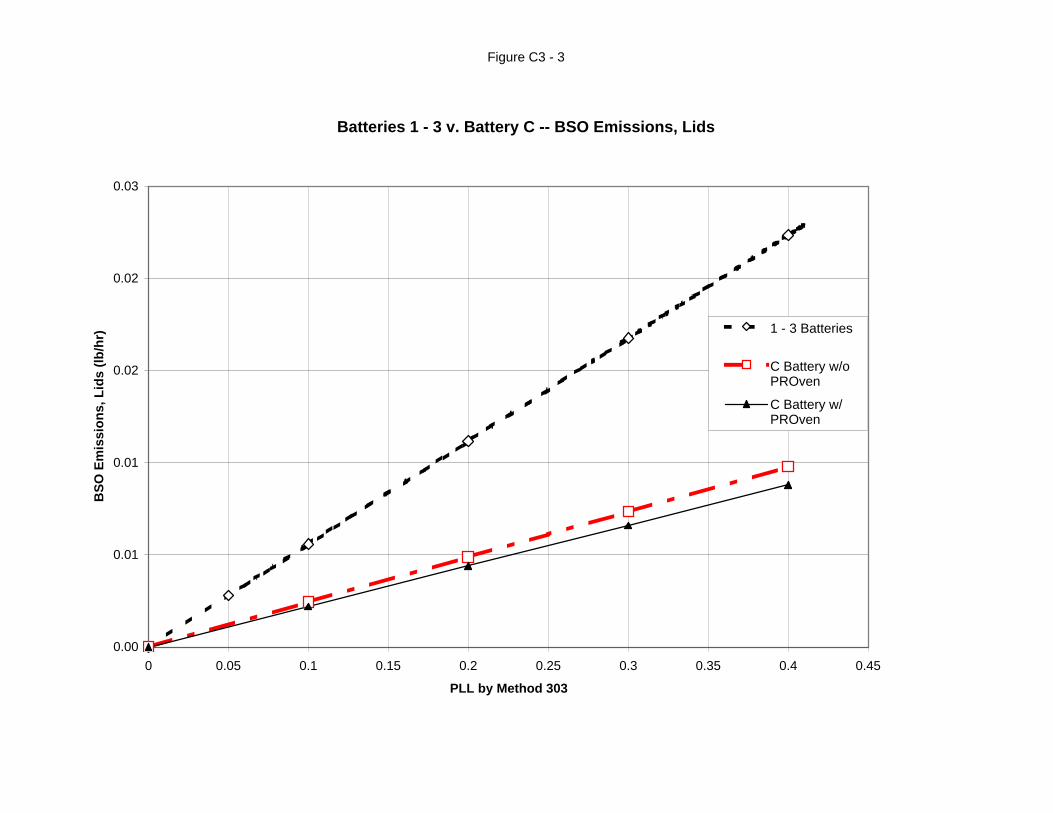
Figure C3 - 3
Batteries 1 - 3 v. Battery C -- BSO Emissions, Lids
0.00
0.01
0.01
0.02
0.02
0.03
0 0.05 0.1 0.15 0.2 0.25 0.3 0.35 0.4 0.45
PLL by Method 303
BSO
Em
issi
ons,
Lid
s (lb
/hr) 1 - 3 Batteries
C Battery w/oPROven
C Battery w/PROven
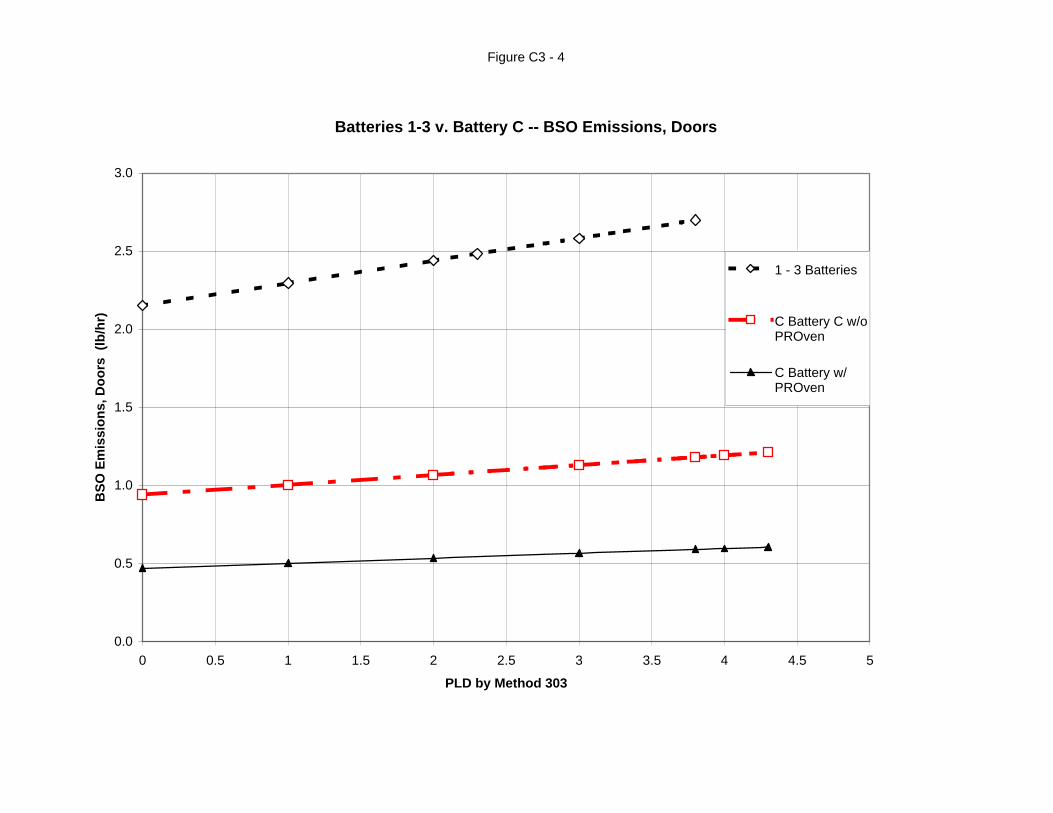
Figure C3 - 4
Batteries 1-3 v. Battery C -- BSO Emissions, Doors
0.0
0.5
1.0
1.5
2.0
2.5
3.0
0 0.5 1 1.5 2 2.5 3 3.5 4 4.5 5
PLD by Method 303
BSO
Em
issi
ons,
Doo
rs (
lb/h
r)
1 - 3 Batteries
C Battery C w/oPROven
C Battery w/PROven

SUMMARY -- Effect of C Battery PEC Hood, Capture of Emissions from CS During Prep for Push
1-3 Batteries C BatteryReductions Resulting from C
Battery
Emissions Location
PollutantTotal
Emissions (Excl via SP)
Total Emissions (Excl via SP)
Total Emissions
(Excl via SP)
Total Emissions (Excl via SP)
Total Emissions
(Excl via SP)
Total Emissions (Excl via
SP)
Total Emissions
(Excl via SP)
[Note 1] [Note 1] [Note 1] [Note 1] [Note 1] [Note 1] [Note 1]
(ton/yr) (lb/ton coal) (ton/yr) (lb/ton coal) (ton/yr) (lb/ton coal) (%)
PM10 0.487 6.8E-04 0.021 2.9E-05 0.47 0.0007 95.6%PM2.5 0.127 1.8E-04 0.006 7.6E-06 0.12 0.0002 95.6%PM10 0.137 1.9E-04 0.004 4.9E-06 0.13 0.0002 97.4%PM2.5 0.036 5.0E-05 0.001 1.3E-06 0.03 0.0000 97.4%
Jamb BSO 1.11 1.6E-03 0.04 5.8E-05 1.06 0.0015 96.1%Gas Channel BSO 1.38 1.9E-03 0.05 7.3E-05 1.33 0.0019 96.1%Door Plug BSO 4.04 5.7E-03 0.17 2.3E-04 3.87 0.0054 95.8%
TOTAL [Note 3]
PM2.5 6.69 0.00939 0.27 0.00037 6.42 0.009 95.9%
TOTAL [Note 3]
PM10 7.16 0.01004 0.29 0.00040 6.86 0.010 95.9%
Notes
1
2
3
Table C4 - 1
NOTE 12/19/2007: C BATTERY WILL BE A SINGLE COLLECTOR MAIN BATTERY WITH THE MAIN LOCATED ON THE PS OF THE OVENS. THE CALCULATIONS SUMMARIZED ABOVE ASSUME A STANDPIPE LOCATE ON THE CS OF THE BATTERY INDUCING A DRAFT & DRAWING SOME OF THE EMISSIONS FROM THE COKE FACE & CS JAMB INTO THE SP. THOSE EMISSIONS MAY BE BURNED IN THE SP OR EMITTED TO ATMOSPHERE UNCHANGED. HAVING NO SP OR JUMPER PIPE ON THE CS IS LIKELY TO REDUCE THE DRAFT EFFECT AND RESULT IN MORE EFFICIENT CAPTURE OF EMISSIONS FROM THE COKE FACE & CS JAMB. THAT ADDITIONAL CAPTURE IS NOT REFLECTED IN THE ABOVE ESTIMATE. THEREFORE THE C BATTERY EMISSION RATE IS SOMEWHAT CONSERVATIVE (HIGH).
Assumes BSO is 100% PM2.5
Coke Face
Fallout [Note 2]
When the oven door is off and the SP open, draft from the open SP draws a portion of the emissions generated on the CS into the oven and through the open SP. Some of those emissions will be burned as they pass through the tunnel head & SP. It is assumed that there is no change in the quantity or nature of those emissions in C Battery. This table addresses only the emissions not drawn into the SP.Often, when the CS door is removed a small amount of coke falls from the coke face onto the bench. Generally this coke burns until it is returned to the oven or removed.
1 of 212/14/2007
HRM

SUMMARY -- Effect of C Battery PEC Hood, Capture of Emissions from CS During Prep for Push
Detailed Summary:
1-3 Batteries
Emissions Location
Pollutant
CS PM & BSO
Generated Before Push
Begins
Destroyed in SP or Exit via SP
Rest of PM & BSO
Released at CS (Not Captured
by Hood)
Released at Baghouse
Stacks
Total Emissions (Excl via
SP)
Total Emissions
(Excl via SP)
(ton/yr) (ton/yr) (ton/yr) (ton/yr) (ton/yr) (ton/yr) (lb/ton coal)
PM10 4.87 4.39 0.49 0.49 0.00 0.49 6.8E-04PM2.5 1.27 1.14 0.13 0.13 0.00 0.13 1.8E-04PM10 0.18 0.05 0.14 0.14 0.00 0.14 1.9E-04PM2.5 0.05 0.01 0.04 0.04 0.00 0.04 5.0E-05
Jamb BSO 5.5 4.4 1.1 1.1 0.0 1.1 1.6E-03Gas Channel BSO 1.4 0.0 1.4 1.4 0.0 1.4 1.9E-03Door Plug BSO 4.0 0.0 4.0 4.0 0.0 4.0 5.7E-03
C Battery
Emissions Location
Pollutant
CS PM & BSO
Generated Before Push
Begins
Destroyed in SP or Exit via SP
Rest of PM & BSO
Released at CS (Not Captured
by Hood)
Released at Baghouse
Stacks
Total Emissions (Excl via
SP)
Total Emissions
(Excl via SP)
(ton/yr) (ton/yr) (ton/yr) (ton/yr) (ton/yr) (ton/yr) (lb/ton coal)
PM10 3.60 3.24 0.36 0.02 0.00 0.02 2.9E-05PM2.5 0.94 0.84 0.09 0.00 0.00 0.01 7.6E-06PM10 0.08 0.02 0.06 0.00 0.00 0.00 4.9E-06PM2.5 0.02 0.01 0.02 0.00 0.00 0.00 1.3E-06
Jamb BSO 3.6 2.9 0.7 0.0 0.0 0.0 5.8E-05Gas Channel BSO 0.9 0.0 0.9 0.0 0.0 0.1 7.3E-05Door Plug BSO 2.9 0.0 2.9 0.1 0.0 0.2 2.3E-04
Table C4 -1 (cont.)
Coke Face
Fallout
Fallout
Coke Face
2 of 212/14/2007
HRM

Effect of C Battery PEC Hood Design on Emissions(C Battery PEC Hood Covers Face of the Open Oven and the Door That Has Been Removed from the
Oven to Be Pushed)December 14, 2007
INPUT
1-3 Batts C BatteryCoal Charge @ 50lb/ft3 (6% H2O) 15.7 Tons/oven 36.8 Tons/ovenCoke Produced @ 69% TC Yield 10.5 Tons/oven 24.7 Tons/ovenLength of Time from Door Off to Push 10 min 10 minLength of Time from Push to Door On 2 min 2 minArea of Coke Face 18.1 ft2 30.6 ft2
Area of Jamb Face 9.5 ft2 14.1 ft2
Area of Gas Channel & Seal'g Strip 9.5 ft2 14.1 ft2
Area of Door Plug 27.7 ft2 45.0 ft2
Pushes per Day @ 18 hr CT 256 pushes 112 pushesCoke Burned at Coke Face (CS) 0.05 lb/min/ft2 0.05 lb/min/ft2
Average "Fallout" per Oven 17 lb 17 lbFract of "Fallout" Burned 2.0% 2.0%Capture Efficiency 0.0% 95.0%Baghouse Efficiency 0.0% 99.0%Tar Volatilized from Jamb 0.0020 in/cycle 0.0020 in/cycleTar Volatilized from Sealing Strip & Gas Channel 0.0005 in/cycle 0.0005 in/cycle
Tar Volatilized from Door Plug 0.0005 in/cycle 0.0005 in/cycle
Percent of Emissions Percent of Emissions
Emissions SourceDrawn to
SP & Burned
Emitted Directly to
Atm
Drawn to SP &
Burned
Captured by Hood
Combustion at CS Face 90.0% 10.0% 90.0% 10.0%Combustion of "Fallout" 25.0% 75.0% 25.0% 75.0%VM from Jamb 80.0% 20.0% 80.0% 20.0%VM from Gas Channel & Sealing Strip 0.0% 100.0% 0.0% 100.0%VM from Door Plug 0.0% 100.0% 0.0% 100.0%
Table C4 - 2
Page 1 of 312/114/2007
HRM

Table C4 - 2
Combustion at CS Face and "fallout"
PM15 EF (AP42 Uncontrolled anthracite combustion, Table 1.2-4) 32 lb/ton
(coke)PM10 EF (AP42 Uncontrolled anthracite combustion, Table 1.2-4) 23 lb/ton
(coke)PM2.5 EF (AP42 Uncontrolled anthracite combustion, Table 1.2-4) 6 lb/ton
(coke)
1-3 CCoke Burned at Face 9.1 lb/push 15.3 lb/pushPM15 0.15 lb/push 0.24 lb/pushPM10 0.10 lb/push 0.18 lb/pushPM2.5 0.03 lb/push 0.05 lb/pushPM15 6.78 ton/yr 5.00 ton/yrPM10 4.87 ton/yr 3.60 ton/yrPM2.5 1.27 ton/yr 0.94 ton/yr
1-3 CCoke Burned - Fallout 0.34 lb/push 0.34 lb/pushPM15 0.005 lb/push 0.005 lb/pushPM10 0.004 lb/push 0.004 lb/pushPM2.5 0.001 lb/push 0.001 lb/pushPM15 0.25 ton/yr 0.11 ton/yrPM10 0.18 ton/yr 0.08 ton/yrPM2.5 0.05 ton/yr 0.02 ton/yr
Page 2 of 312/114/2007
HRM

Table C4 - 2
VM from Jamb, Gas Channel & Door Plug
1-3 CTar (Assumed BSO / PM) thickness escaping from surfaces Jamb 0.002 Inch/cycle 0.002 Inch/cycle Gas Channel & Sealing Edge 0.0005 Inch/cycle 0.0005 Inch/cycle Door Plug 0.0005 Inch/cycle 0.0005 Inch/cycle Jamb 0.002 ft3/cycle 0.002 ft3/cycle Gas Channel & Sealing Edge 0.000 ft3/cycle 0.001 ft3/cycle Door Plug 0.001 ft3/cycle 0.002 ft3/cycle Jamb 0.118 lb/cycle 0.176 lb/cycle Gas Channel & Sealing Edge 0.030 lb/cycle 0.044 lb/cycle Door Plug 0.087 lb/cycle 0.141 lb/cycle Jamb 5.5 ton/yr 3.6 ton/yr Gas Channel & Sealing Edge 1.4 ton/yr 0.9 ton/yr Door Plug 4.0 ton/yr 2.9 ton/yr
Page 3 of 312/114/2007
HRM
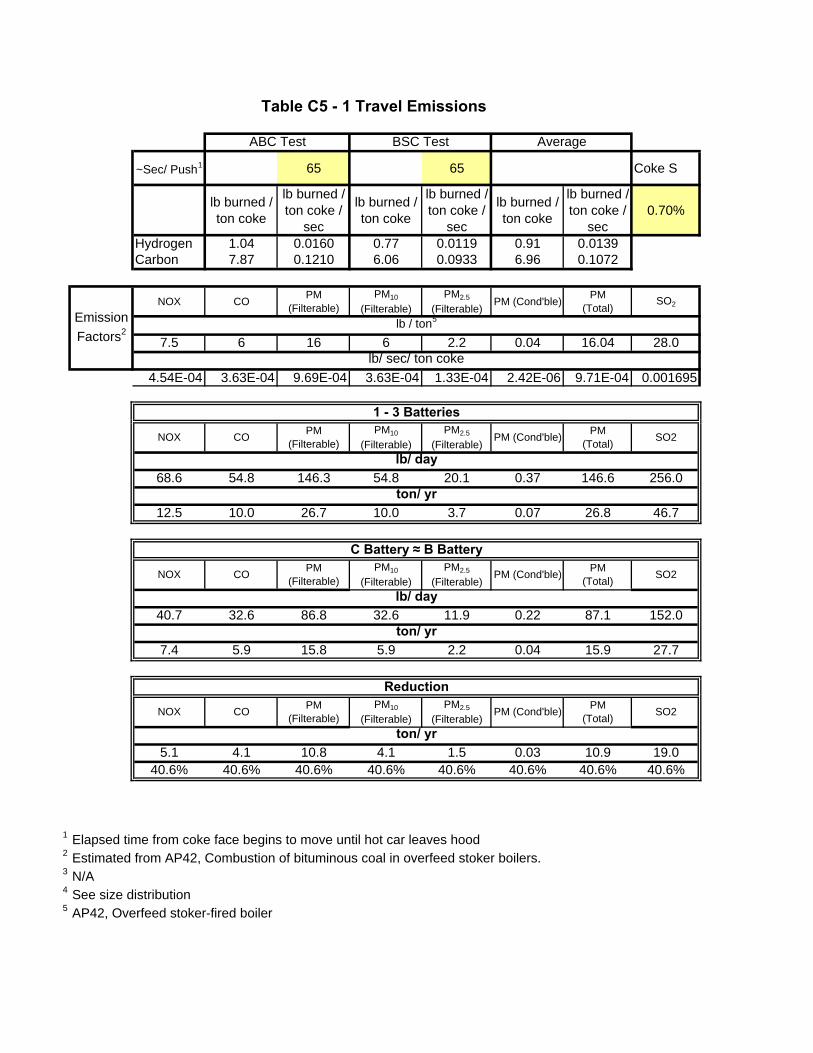
ABC Test BSC Test Average
~Sec/ Push1 65 65 Coke S
lb burned / ton coke
lb burned / ton coke /
sec
lb burned / ton coke
lb burned / ton coke /
sec
lb burned / ton coke
lb burned / ton coke /
sec0.70%
Hydrogen 1.04 0.0160 0.77 0.0119 0.91 0.0139Carbon 7.87 0.1210 6.06 0.0933 6.96 0.1072
NOX CO PM (Filterable)
PM10
(Filterable)PM2.5
(Filterable)PM (Cond'ble) PM
(Total)SO2
lb / ton5
7.5 6 16 6 2.2 0.04 16.04 28.0lb/ sec/ ton coke
4.54E-04 3.63E-04 9.69E-04 3.63E-04 1.33E-04 2.42E-06 9.71E-04 0.001695
1 - 3 Batteries
NOX CO PM (Filterable)
PM10
(Filterable)PM2.5
(Filterable)PM (Cond'ble) PM
(Total) SO2
lb/ day68.6 54.8 146.3 54.8 20.1 0.37 146.6 256.0
ton/ yr12.5 10.0 26.7 10.0 3.7 0.07 26.8 46.7
C Battery ≈ B Battery
NOX CO PM (Filterable)
PM10
(Filterable)PM2.5
(Filterable)PM (Cond'ble) PM
(Total) SO2
lb/ day40.7 32.6 86.8 32.6 11.9 0.22 87.1 152.0
ton/ yr7.4 5.9 15.8 5.9 2.2 0.04 15.9 27.7
Reduction
NOX CO PM (Filterable)
PM10
(Filterable)PM2.5
(Filterable)PM (Cond'ble) PM
(Total) SO2
ton/ yr5.1 4.1 10.8 4.1 1.5 0.03 10.9 19.0
40.6% 40.6% 40.6% 40.6% 40.6% 40.6% 40.6% 40.6%
1 Elapsed time from coke face begins to move until hot car leaves hood2 Estimated from AP42, Combustion of bituminous coal in overfeed stoker boilers.3 N/A4 See size distribution5 AP42, Overfeed stoker-fired boiler
Emission Factors2
Table C5 - 1 Travel Emissions
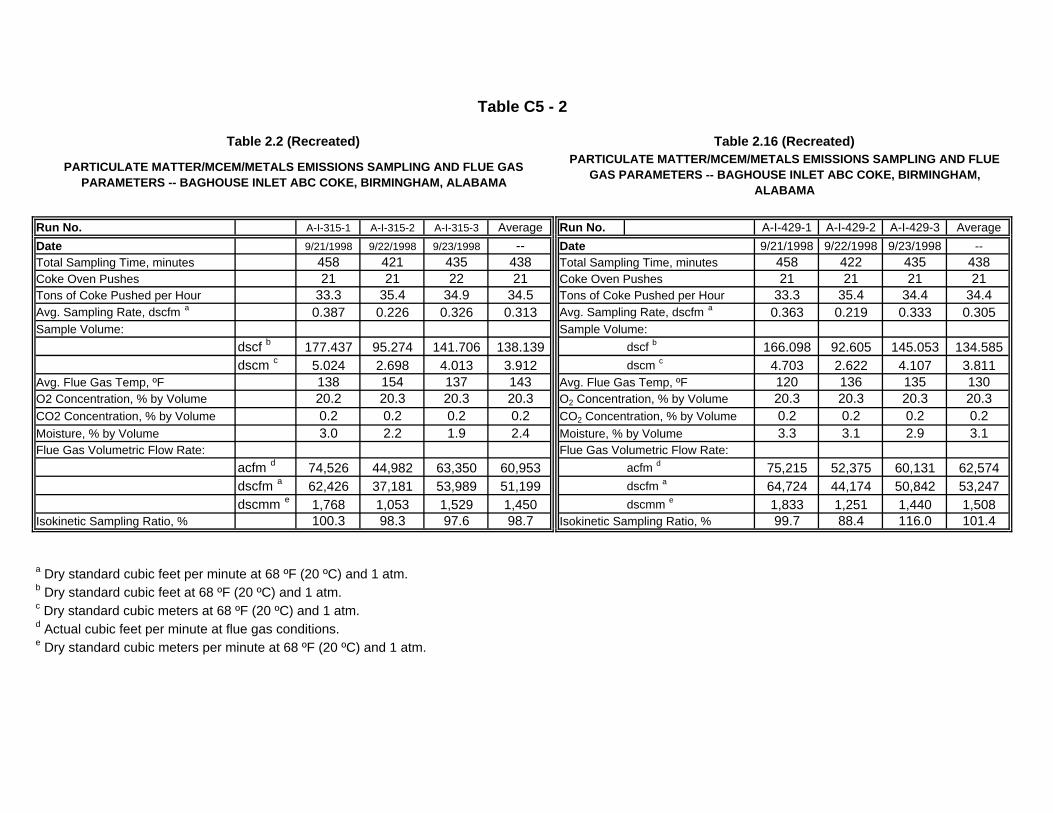
Table 2.2 (Recreated) Table 2.16 (Recreated)
Run No. A-I-315-1 A-I-315-2 A-I-315-3 Average Run No. A-I-429-1 A-I-429-2 A-I-429-3 AverageDate 9/21/1998 9/22/1998 9/23/1998 -- Date 9/21/1998 9/22/1998 9/23/1998 --Total Sampling Time, minutes 458 421 435 438 Total Sampling Time, minutes 458 422 435 438Coke Oven Pushes 21 21 22 21 Coke Oven Pushes 21 21 21 21Tons of Coke Pushed per Hour 33.3 35.4 34.9 34.5 Tons of Coke Pushed per Hour 33.3 35.4 34.4 34.4Avg. Sampling Rate, dscfm a 0.387 0.226 0.326 0.313 Avg. Sampling Rate, dscfm a 0.363 0.219 0.333 0.305Sample Volume: Sample Volume:
dscf b 177.437 95.274 141.706 138.139 dscf b 166.098 92.605 145.053 134.585dscm c 5.024 2.698 4.013 3.912 dscm c 4.703 2.622 4.107 3.811
Avg. Flue Gas Temp, ºF 138 154 137 143 Avg. Flue Gas Temp, ºF 120 136 135 130O2 Concentration, % by Volume 20.2 20.3 20.3 20.3 O2 Concentration, % by Volume 20.3 20.3 20.3 20.3CO2 Concentration, % by Volume 0.2 0.2 0.2 0.2 CO2 Concentration, % by Volume 0.2 0.2 0.2 0.2Moisture, % by Volume 3.0 2.2 1.9 2.4 Moisture, % by Volume 3.3 3.1 2.9 3.1Flue Gas Volumetric Flow Rate: Flue Gas Volumetric Flow Rate:
acfm d 74,526 44,982 63,350 60,953 acfm d 75,215 52,375 60,131 62,574dscfm a 62,426 37,181 53,989 51,199 dscfm a 64,724 44,174 50,842 53,247dscmm e 1,768 1,053 1,529 1,450 dscmm e 1,833 1,251 1,440 1,508
Isokinetic Sampling Ratio, % 100.3 98.3 97.6 98.7 Isokinetic Sampling Ratio, % 99.7 88.4 116.0 101.4
a Dry standard cubic feet per minute at 68 ºF (20 ºC) and 1 atm.b Dry standard cubic feet at 68 ºF (20 ºC) and 1 atm.c Dry standard cubic meters at 68 ºF (20 ºC) and 1 atm.d Actual cubic feet per minute at flue gas conditions.e Dry standard cubic meters per minute at 68 ºF (20 ºC) and 1 atm.
PARTICULATE MATTER/MCEM/METALS EMISSIONS SAMPLING AND FLUE GAS PARAMETERS -- BAGHOUSE INLET ABC COKE, BIRMINGHAM, ALABAMA
PARTICULATE MATTER/MCEM/METALS EMISSIONS SAMPLING AND FLUE GAS PARAMETERS -- BAGHOUSE INLET ABC COKE, BIRMINGHAM,
ALABAMA
Table C5 - 2
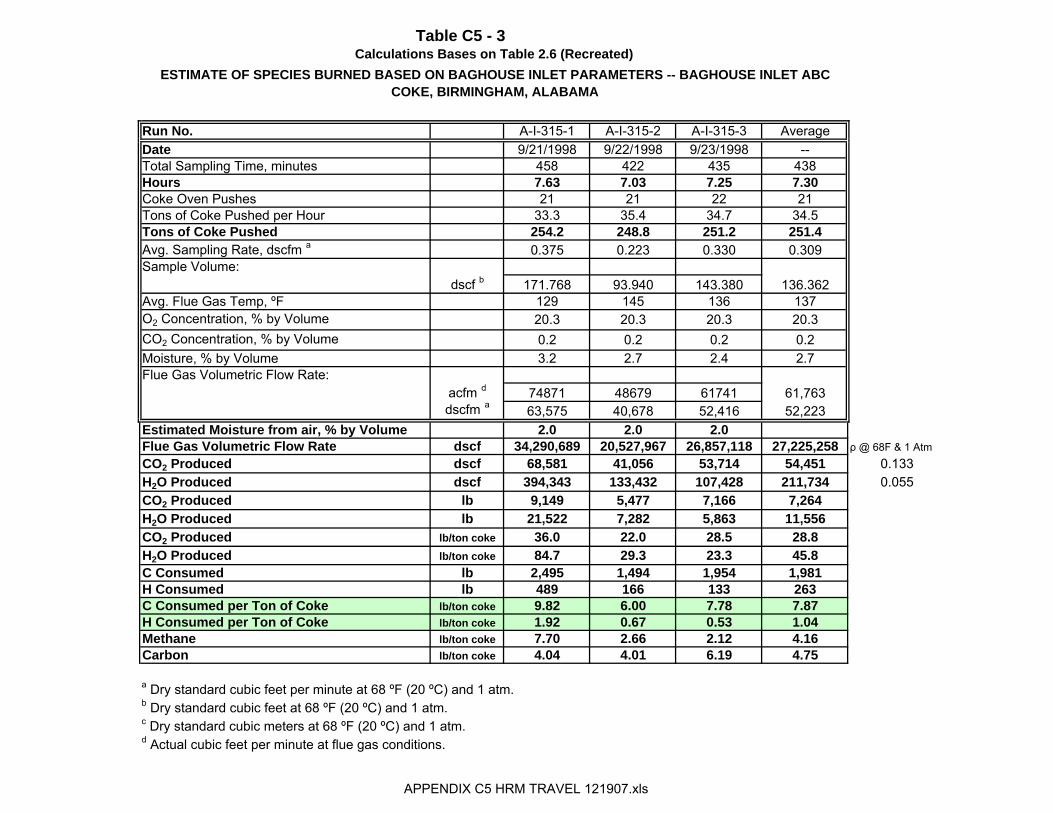
Calculations Bases on Table 2.6 (Recreated)
Run No. A-I-315-1 A-I-315-2 A-I-315-3 AverageDate 9/21/1998 9/22/1998 9/23/1998 --Total Sampling Time, minutes 458 422 435 438Hours 7.63 7.03 7.25 7.30Coke Oven Pushes 21 21 22 21Tons of Coke Pushed per Hour 33.3 35.4 34.7 34.5Tons of Coke Pushed 254.2 248.8 251.2 251.4Avg. Sampling Rate, dscfm a 0.375 0.223 0.330 0.309Sample Volume:
dscf b 171.768 93.940 143.380 136.362Avg. Flue Gas Temp, ºF 129 145 136 137O2 Concentration, % by Volume 20.3 20.3 20.3 20.3CO2 Concentration, % by Volume 0.2 0.2 0.2 0.2Moisture, % by Volume 3.2 2.7 2.4 2.7Flue Gas Volumetric Flow Rate:
acfm d 74871 48679 61741 61,763dscfm a 63,575 40,678 52,416 52,223
Estimated Moisture from air, % by Volume 2.0 2.0 2.0Flue Gas Volumetric Flow Rate dscf 34,290,689 20,527,967 26,857,118 27,225,258 ρ @ 68F & 1 AtmCO2 Produced dscf 68,581 41,056 53,714 54,451 0.133H2O Produced dscf 394,343 133,432 107,428 211,734 0.055CO2 Produced lb 9,149 5,477 7,166 7,264H2O Produced lb 21,522 7,282 5,863 11,556CO2 Produced lb/ton coke 36.0 22.0 28.5 28.8H2O Produced lb/ton coke 84.7 29.3 23.3 45.8C Consumed lb 2,495 1,494 1,954 1,981H Consumed lb 489 166 133 263C Consumed per Ton of Coke lb/ton coke 9.82 6.00 7.78 7.87H Consumed per Ton of Coke lb/ton coke 1.92 0.67 0.53 1.04Methane lb/ton coke 7.70 2.66 2.12 4.16Carbon lb/ton coke 4.04 4.01 6.19 4.75
a Dry standard cubic feet per minute at 68 ºF (20 ºC) and 1 atm.b Dry standard cubic feet at 68 ºF (20 ºC) and 1 atm.c Dry standard cubic meters at 68 ºF (20 ºC) and 1 atm.d Actual cubic feet per minute at flue gas conditions.
ESTIMATE OF SPECIES BURNED BASED ON BAGHOUSE INLET PARAMETERS -- BAGHOUSE INLET ABC COKE, BIRMINGHAM, ALABAMA
Table C5 - 3
APPENDIX C5 HRM TRAVEL 121907.xls
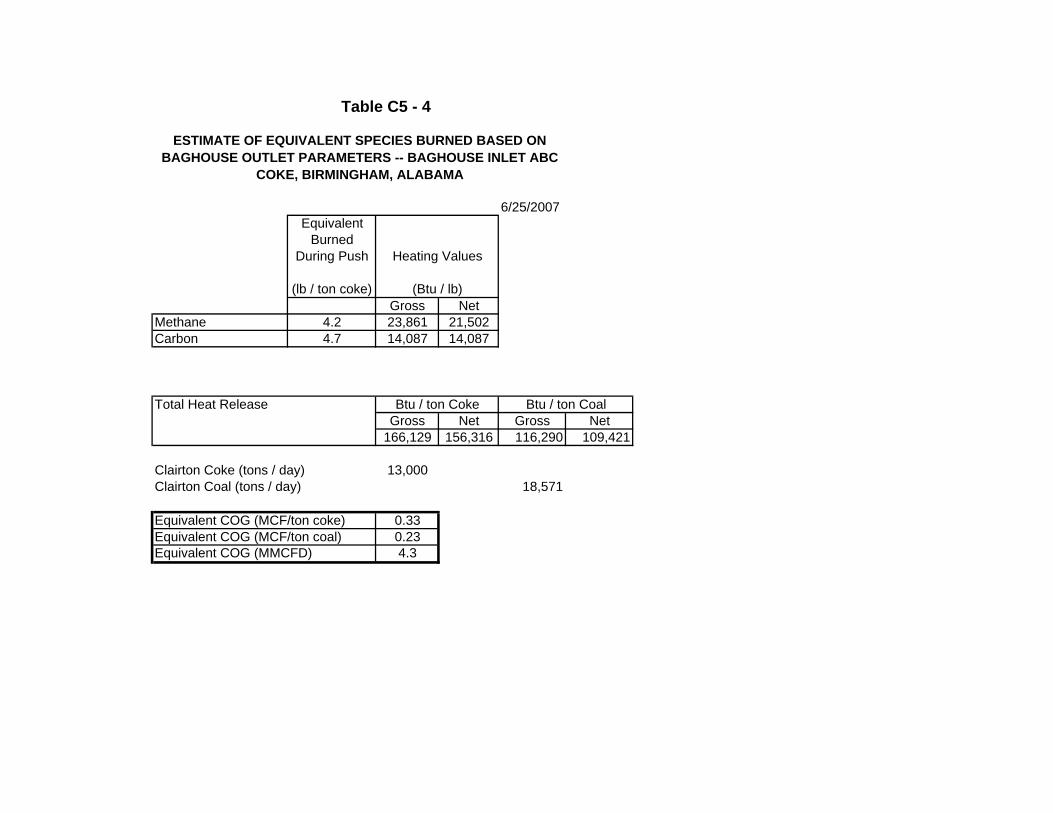
6/25/2007Equivalent
Burned During Push Heating Values
(lb / ton coke) (Btu / lb)Gross Net
Methane 4.2 23,861 21,502Carbon 4.7 14,087 14,087
Total Heat Release Btu / ton Coke Btu / ton CoalGross Net Gross Net
166,129 156,316 116,290 109,421
Clairton Coke (tons / day) 13,000Clairton Coal (tons / day) 18,571
Equivalent COG (MCF/ton coke) 0.33Equivalent COG (MCF/ton coal) 0.23Equivalent COG (MMCFD) 4.3
ESTIMATE OF EQUIVALENT SPECIES BURNED BASED ON BAGHOUSE OUTLET PARAMETERS -- BAGHOUSE INLET ABC
COKE, BIRMINGHAM, ALABAMA
Table C5 - 4

Table 2.2 (Recreated) Table 2.16 (Recreated)
Run No. B-I-315-1 B-I-315-2 B-I-315-3 Average Run No. B-I-429-1 B-I-429-2 B-I-429-3 AverageDate 8/11/1998 8/12/1998 8/13/1998 -- Date 8/11/1998 8/12/1998 8/13/1998 --Total Sampling Time, minutes 459 510 483 484 Total Sampling Time, minutes 453 482 362 432Coke Oven Pushes 46 47 42 45 Coke Oven Pushes 46 47 27 40Tons of Coke Pushed per Hour 143.1 131.6 124.2 133.0 Tons of Coke Pushed per Hour 145.0 139.2 106.5 130.3Avg. Sampling Rate, dscfm a 0.270 0.239 0.247 0.252 Avg. Sampling Rate, dscfm a 0.192 0.178 0.187 0.186Sample Volume: Sample Volume:
dscf b 123.890 121.824 119.125 121.613 dscf b 87.151 85.686 67.729 80.189dscm c 3.508 3.450 3.373 3.444 dscm c 2.468 2.426 1.918 2.271
Avg. Flue Gas Temp, ºF 153 158 170 160 Avg. Flue Gas Temp, ºF 142 147 145 145O2 Concentration, % by Volume 20.1 20.0 20.0 20.0 O2 Concentration, % by Volume 20.1 20.0 20.0 20.0CO2 Concentration, % by Volume 0.5 0.5 0.5 0.5 CO2 Concentration, % by Volume 0.5 0.5 0.5 0.5Moisture, % by Volume 2.5 2.3 2.0 2.3 Moisture, % by Volume 3.3 3.4 3.9 3.5Flue Gas Volumetric Flow Rate: Flue Gas Volumetric Flow Rate:
acfm d 77,509 77,263 76,952 77,241 acfm d 70,118 63,871 69,027 67,672dscfm a 64,257 63,845 62,601 63,568 dscfm a 58,683 53,111 57,287 56,360dscmm e 1,820 1,808 1,773 1,800 dscmm e 1,662 1,504 1,622 1,596
Isokinetic Sampling Ratio, % 118.1 105.2 110.8 111.4 Isokinetic Sampling Ratio, % 90.5 94.1 91.8 92.1
a Dry standard cubic feet per minute at 68 ºF (20 ºC) and 1 atm.b Dry standard cubic feet at 68 ºF (20 ºC) and 1 atm.c Dry standard cubic meters at 68 ºF (20 ºC) and 1 atm.d Actual cubic feet per minute at flue gas conditions.e Dry standard cubic meters per minute at 68 ºF (20 ºC) and 1 atm.
Coke tons per oven (Final Report p.3-1) = 23.8
PARTICULATE MATTER/MCEM/METALS EMISSIONS SAMPLING AND FLUE GAS PARAMETERS -- BAGHOUSE INLET BETH STEEL, CHESTERTON, IN
PARTICULATE MATTER/MCEM/METALS EMISSIONS SAMPLING AND FLUE GAS PARAMETERS -- BAGHOUSE INLET BETH STEEL, CHESTERTON, IN
Table C5 - 5
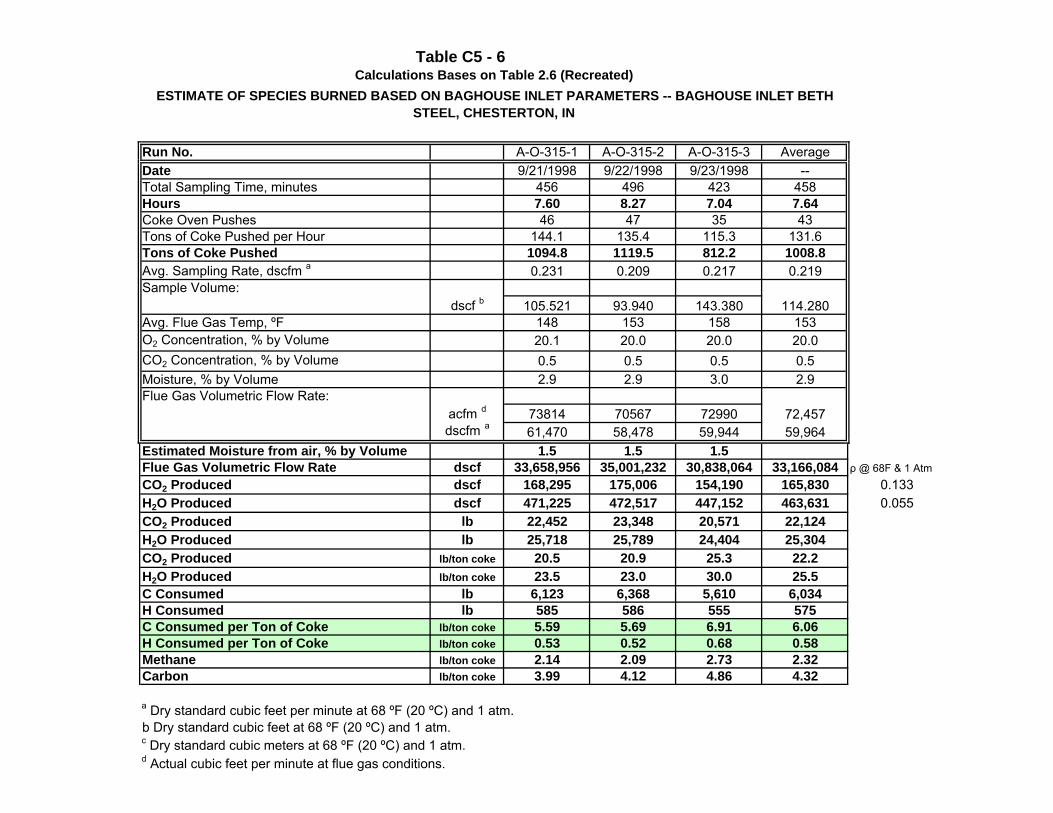
Calculations Bases on Table 2.6 (Recreated)
Run No. A-O-315-1 A-O-315-2 A-O-315-3 AverageDate 9/21/1998 9/22/1998 9/23/1998 --Total Sampling Time, minutes 456 496 423 458Hours 7.60 8.27 7.04 7.64Coke Oven Pushes 46 47 35 43Tons of Coke Pushed per Hour 144.1 135.4 115.3 131.6Tons of Coke Pushed 1094.8 1119.5 812.2 1008.8Avg. Sampling Rate, dscfm a 0.231 0.209 0.217 0.219Sample Volume:
dscf b 105.521 93.940 143.380 114.280Avg. Flue Gas Temp, ºF 148 153 158 153O2 Concentration, % by Volume 20.1 20.0 20.0 20.0CO2 Concentration, % by Volume 0.5 0.5 0.5 0.5Moisture, % by Volume 2.9 2.9 3.0 2.9Flue Gas Volumetric Flow Rate:
acfm d 73814 70567 72990 72,457dscfm a 61,470 58,478 59,944 59,964
Estimated Moisture from air, % by Volume 1.5 1.5 1.5Flue Gas Volumetric Flow Rate dscf 33,658,956 35,001,232 30,838,064 33,166,084 ρ @ 68F & 1 AtmCO2 Produced dscf 168,295 175,006 154,190 165,830 0.133H2O Produced dscf 471,225 472,517 447,152 463,631 0.055CO2 Produced lb 22,452 23,348 20,571 22,124H2O Produced lb 25,718 25,789 24,404 25,304CO2 Produced lb/ton coke 20.5 20.9 25.3 22.2H2O Produced lb/ton coke 23.5 23.0 30.0 25.5C Consumed lb 6,123 6,368 5,610 6,034H Consumed lb 585 586 555 575C Consumed per Ton of Coke lb/ton coke 5.59 5.69 6.91 6.06H Consumed per Ton of Coke lb/ton coke 0.53 0.52 0.68 0.58Methane lb/ton coke 2.14 2.09 2.73 2.32Carbon lb/ton coke 3.99 4.12 4.86 4.32
a Dry standard cubic feet per minute at 68 ºF (20 ºC) and 1 atm.b Dry standard cubic feet at 68 ºF (20 ºC) and 1 atm.c Dry standard cubic meters at 68 ºF (20 ºC) and 1 atm.d Actual cubic feet per minute at flue gas conditions.
ESTIMATE OF SPECIES BURNED BASED ON BAGHOUSE INLET PARAMETERS -- BAGHOUSE INLET BETH STEEL, CHESTERTON, IN
Table C5 - 6
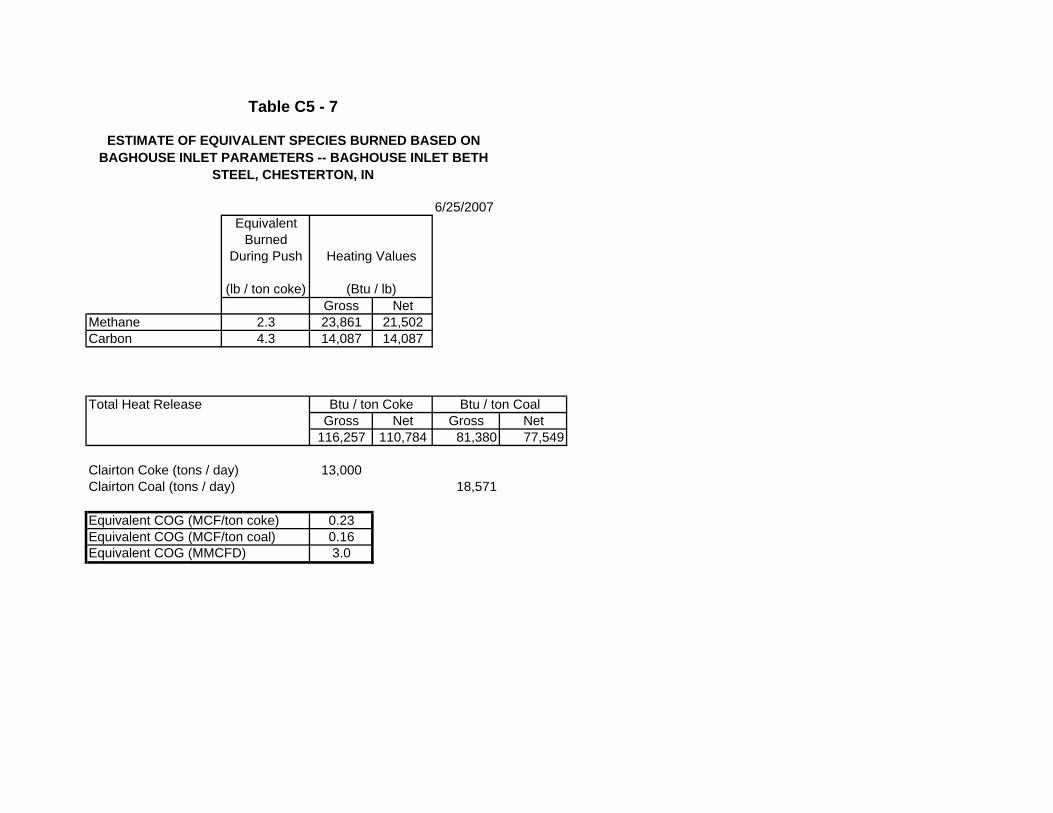
6/25/2007Equivalent
Burned During Push Heating Values
(lb / ton coke) (Btu / lb)Gross Net
Methane 2.3 23,861 21,502Carbon 4.3 14,087 14,087
Total Heat Release Btu / ton Coke Btu / ton CoalGross Net Gross Net
116,257 110,784 81,380 77,549
Clairton Coke (tons / day) 13,000Clairton Coal (tons / day) 18,571
Equivalent COG (MCF/ton coke) 0.23Equivalent COG (MCF/ton coal) 0.16Equivalent COG (MMCFD) 3.0
ESTIMATE OF EQUIVALENT SPECIES BURNED BASED ON BAGHOUSE INLET PARAMETERS -- BAGHOUSE INLET BETH
STEEL, CHESTERTON, IN
Table C5 - 7
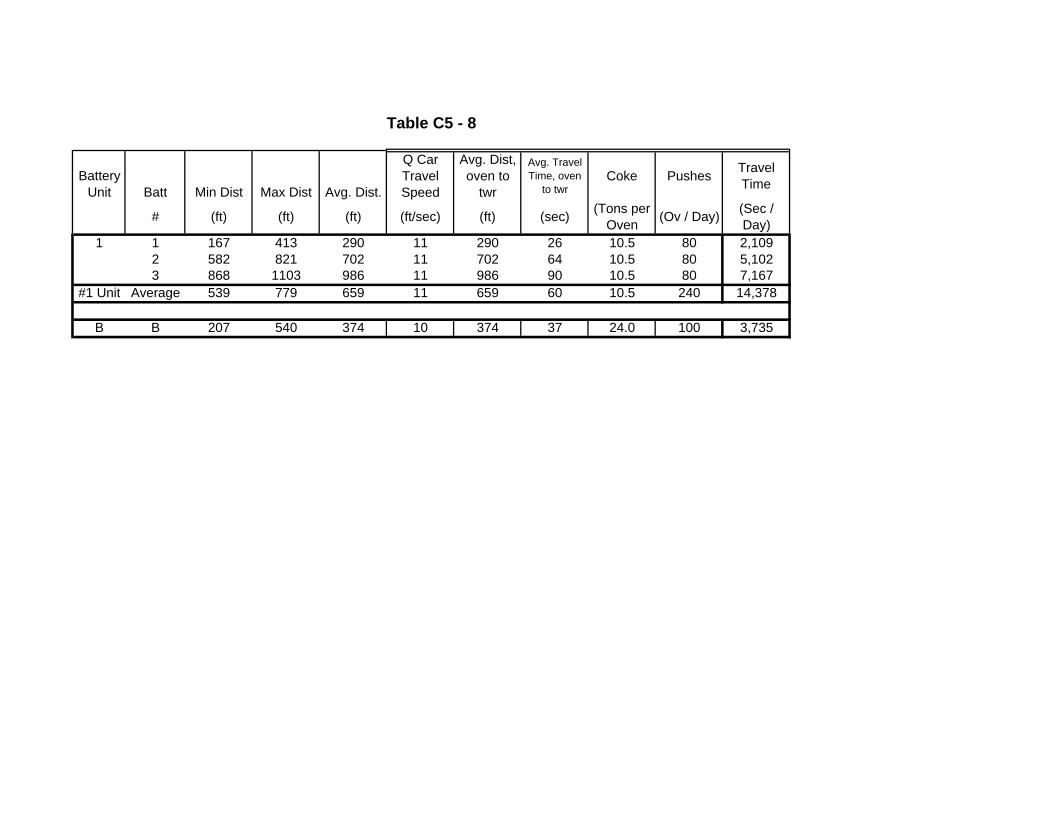
Battery Unit Batt Min Dist Max Dist Avg. Dist.
Q Car Travel Speed
Avg. Dist, oven to
twr
Avg. Travel Time, oven
to twrCoke Pushes Travel
Time
1 1 167 413 290 11 290 26 10.5 80 2,1092 582 821 702 11 702 64 10.5 80 5,1023 868 1103 986 11 986 90 10.5 80 7,167
#1 Unit Average 539 779 659 11 659 60 10.5 240 14,378
B B 207 540 374 10 374 37 24.0 100 3,735
(Tons per Oven (Ov / Day)
Table C5 - 8
# (ft) (ft) (ft/sec)(ft) (Sec / Day)(ft) (sec)

Dry Bulb Rel Hum Approx. Hum
Approx. Hum
Approx. Hum H2O
F % # H2O per # Dry Air
ft3 H2O per # Dry
Air
ft3 H2O per ft3 Dry
Air%vol
70 50 0.0075 0.166 0.012 1.15%70 60 0.009 0.199 0.014 1.38%70 70 0.011 0.243 0.017 1.68%70 80 0.013 0.287 0.020 1.98%75 50 1.29%75 60 1.53% Estimate for Burns Harbor, IN75 70 1.83%75 80 2.13%80 50 0.0093 0.206 0.014 1.43%80 60 0.011 0.243 0.017 1.68%80 70 0.013 0.287 0.020 1.98% Estimate for B'ham, AL80 80 0.015 0.331 0.023 2.28%
Density H2O Vapor = 0.0453 # / ft3Sp vol H2O Vapor = 22.1 ft3 / #Density Air = 0.0704 # / ft3Sp vol Air = 14.2 ft3 / #
Table C5 - 9

Ratio of Battery Stack Emission Rates in One PROven-Equipped 6M Battery vs. Three Conventional 3.6M Batteries with Equal Capacity
(e.g Clairton Batteries 1-3)
November 14, 20070.6131.0050.616
Difference in Wall Area per Ton of Coal - 6M Battery v 3.6 M Battery
Battery "Size"6M 3.6M
Floor to Top of Horizontal (ft) 17.74 9.93Width of Roof (ft) 1.50 1.56Length of Oven - Face to Face of Brick (ft) 54.75 40.04Total Wall Area (ft2) 2024.6 857.4Working Volume (ft3) 1472.0 626.3Bulk Density (lb/ft3) 48.0 48.0Coal Charge (tons) 35.3 15.0Wall Area per Ton of Coal (ft2/ton coal) 57.3 57.0
Wall Area Effect Ratio 6M/3.6M
Table C6 - 1
1.005
Pressure differential effect (Same value as doors)Wall area effectTotal effect
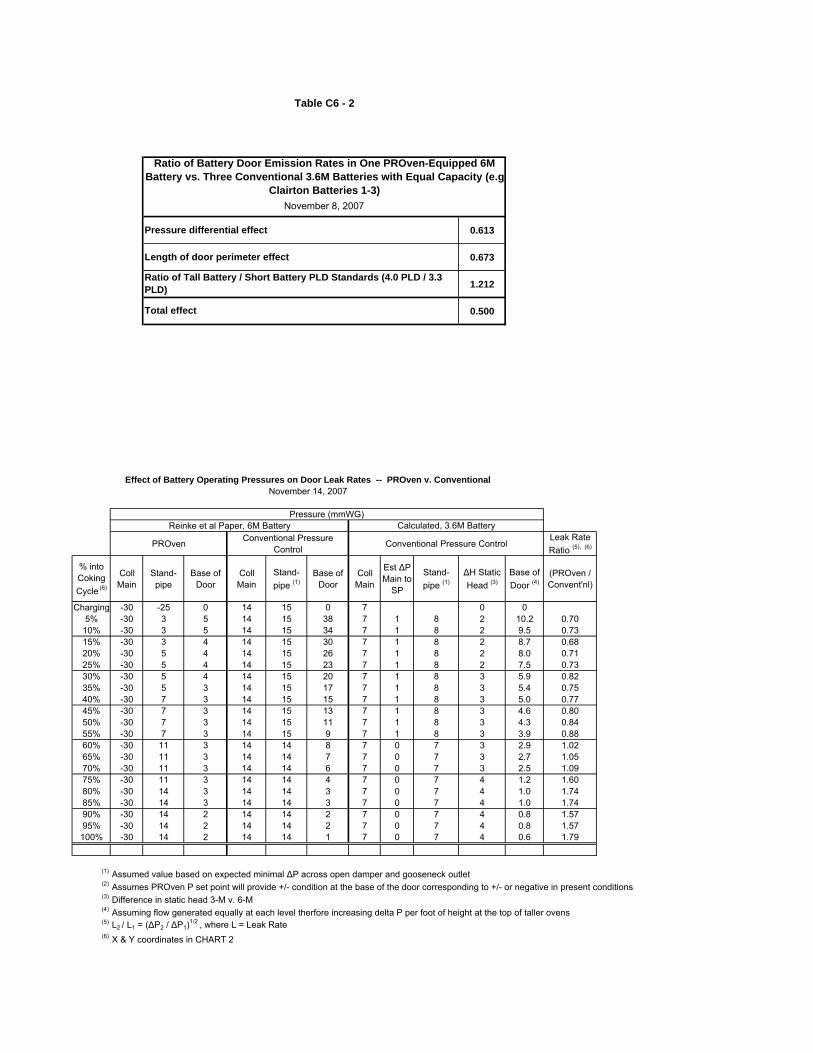
0.613
0.673
1.212
0.500
Effect of Battery Operating Pressures on Door Leak Rates -- PROven v. ConventionalNovember 14, 2007
Pressure (mmWG)Reinke et al Paper, 6M Battery Calculated, 3.6M Battery
PROven Conventional Pressure Control Conventional Pressure Control
Leak Rate Ratio (5), (6)
% into Coking Cycle (6)
Coll Main
Stand- pipe
Base of Door
Coll Main
Stand- pipe (1)
Base of Door
Coll Main
Est ΔP Main to
SP
Stand- pipe (1)
ΔH Static Head (3)
Base of Door (4)
(PROven / Convent'nl)
Charging -30 -25 0 14 15 0 7 0 05% -30 3 5 14 15 38 7 1 8 2 10.2 0.70
10% -30 3 5 14 15 34 7 1 8 2 9.5 0.7315% -30 3 4 14 15 30 7 1 8 2 8.7 0.6820% -30 5 4 14 15 26 7 1 8 2 8.0 0.7125% -30 5 4 14 15 23 7 1 8 2 7.5 0.7330% -30 5 4 14 15 20 7 1 8 3 5.9 0.8235% -30 5 3 14 15 17 7 1 8 3 5.4 0.7540% -30 7 3 14 15 15 7 1 8 3 5.0 0.7745% -30 7 3 14 15 13 7 1 8 3 4.6 0.8050% -30 7 3 14 15 11 7 1 8 3 4.3 0.8455% -30 7 3 14 15 9 7 1 8 3 3.9 0.8860% -30 11 3 14 14 8 7 0 7 3 2.9 1.0265% -30 11 3 14 14 7 7 0 7 3 2.7 1.0570% -30 11 3 14 14 6 7 0 7 3 2.5 1.0975% -30 11 3 14 14 4 7 0 7 4 1.2 1.6080% -30 14 3 14 14 3 7 0 7 4 1.0 1.7485% -30 14 3 14 14 3 7 0 7 4 1.0 1.7490% -30 14 2 14 14 2 7 0 7 4 0.8 1.5795% -30 14 2 14 14 2 7 0 7 4 0.8 1.57100% -30 14 2 14 14 1 7 0 7 4 0.6 1.79
(1) Assumed value based on expected minimal ΔP across open damper and gooseneck outlet(2) Assumes PROven P set point will provide +/- condition at the base of the door corresponding to +/- or negative in present conditions(3) Difference in static head 3-M v. 6-M(4) Assuming flow generated equally at each level therfore increasing delta P per foot of height at the top of taller ovens(5) L2 / L1 = (ΔP2 / ΔP1)
1/2 , where L = Leak Rate(6) X & Y coordinates in CHART 2
Table C6 - 2
Ratio of Tall Battery / Short Battery PLD Standards (4.0 PLD / 3.3 PLD)
Total effect
Ratio of Battery Door Emission Rates in One PROven-Equipped 6M Battery vs. Three Conventional 3.6M Batteries with Equal Capacity (e.g
Clairton Batteries 1-3)November 8, 2007
Pressure differential effect
Length of door perimeter effect
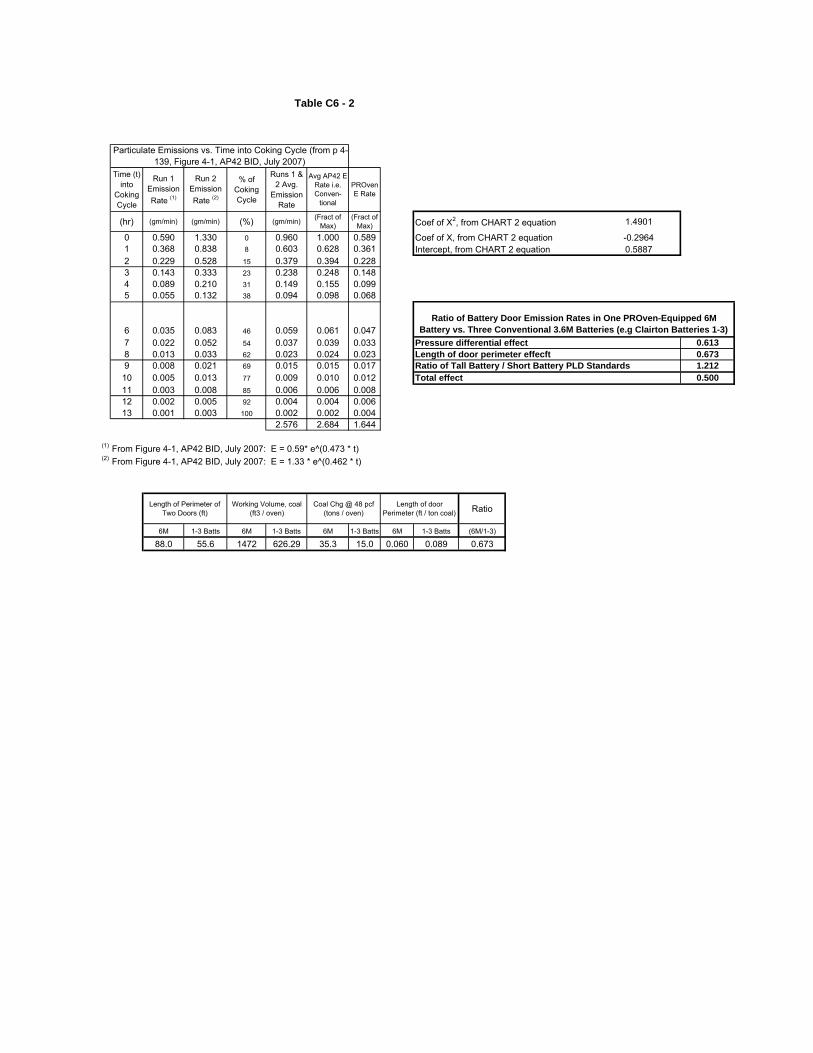
Table C6 - 2
Particulate Emissions vs. Time into Coking Cycle (from p 4-139, Figure 4-1, AP42 BID, July 2007)
Time (t) into
Coking Cycle
Run 1 Emission Rate (1)
Run 2 Emission Rate (2)
% of Coking Cycle
Runs 1 & 2 Avg.
Emission Rate
Avg AP42 E Rate i.e. Conven-
tional
PROven E Rate
(hr) (gm/min) (gm/min) (%) (gm/min) (Fract of Max)
(Fract of Max) Coef of X2, from CHART 2 equation 1.4901
0 0.590 1.330 0 0.960 1.000 0.589 Coef of X, from CHART 2 equation -0.29641 0.368 0.838 8 0.603 0.628 0.361 Intercept, from CHART 2 equation 0.58872 0.229 0.528 15 0.379 0.394 0.2283 0.143 0.333 23 0.238 0.248 0.1484 0.089 0.210 31 0.149 0.155 0.0995 0.055 0.132 38 0.094 0.098 0.068
6 0.035 0.083 46 0.059 0.061 0.047Ratio of Battery Door Emission Rates in One PROven-Equipped 6M
Battery vs. Three Conventional 3.6M Batteries (e.g Clairton Batteries 1-3)7 0.022 0.052 54 0.037 0.039 0.033 Pressure differential effect 0.6138 0.013 0.033 62 0.023 0.024 0.023 Length of door perimeter effecft 0.6739 0.008 0.021 69 0.015 0.015 0.017 Ratio of Tall Battery / Short Battery PLD Standards 1.21210 0.005 0.013 77 0.009 0.010 0.012 Total effect 0.50011 0.003 0.008 85 0.006 0.006 0.00812 0.002 0.005 92 0.004 0.004 0.00613 0.001 0.003 100 0.002 0.002 0.004
2.576 2.684 1.644
(1) From Figure 4-1, AP42 BID, July 2007: E = 0.59* e^(0.473 * t)(2) From Figure 4-1, AP42 BID, July 2007: E = 1.33 * e^(0.462 * t)
Length of Perimeter of Two Doors (ft)
Working Volume, coal (ft3 / oven)
Coal Chg @ 48 pcf (tons / oven)
Length of door Perimeter (ft / ton coal) Ratio
6M 1-3 Batts 6M 1-3 Batts 6M 1-3 Batts 6M 1-3 Batts (6M/1-3)
88.0 55.6 1472 626.29 35.3 15.0 0.060 0.089 0.673
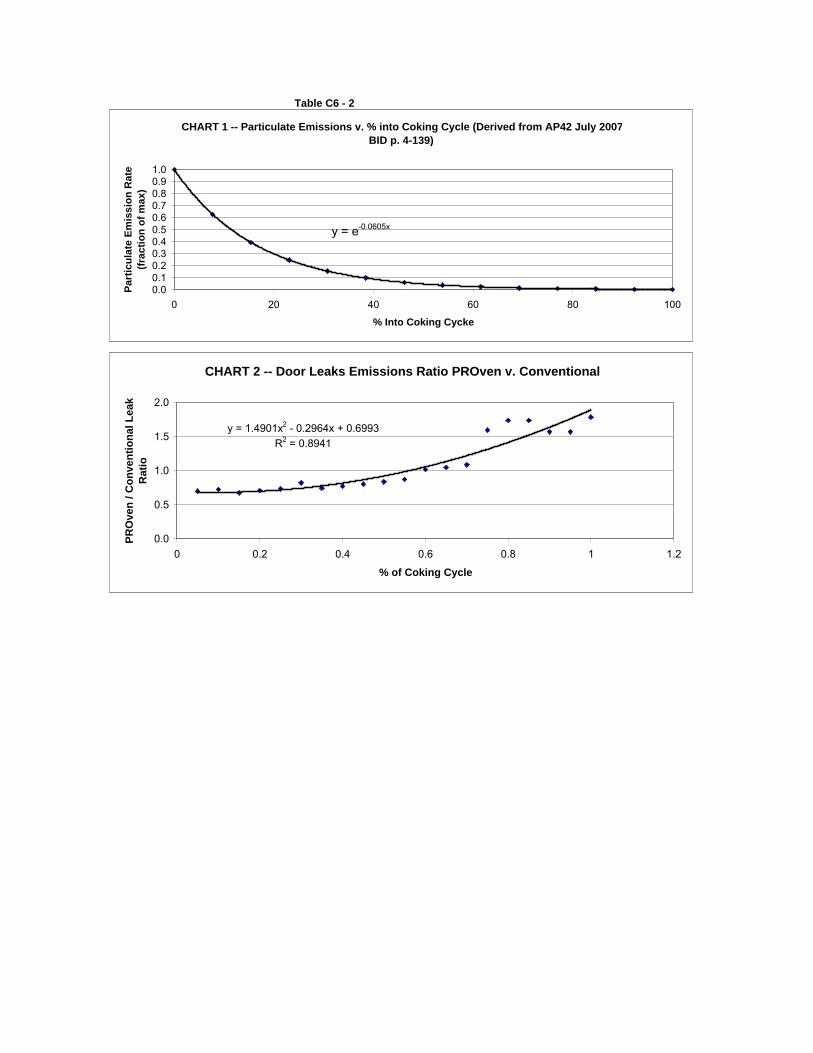
Table C6 - 2
CHART 1 -- Particulate Emissions v. % into Coking Cycle (Derived from AP42 July 2007BID p. 4-139)
y = e-0.0605x
0.00.10.20.30.40.50.60.70.80.91.0
0 20 40 60 80 100
% Into Coking Cycke
Part
icul
ate
Emis
sion
Rat
e (fr
actio
n of
max
)
CHART 2 -- Door Leaks Emissions Ratio PROven v. Conventional
y = 1.4901x2 - 0.2964x + 0.6993R2 = 0.8941
0.0
0.5
1.0
1.5
2.0
0 0.2 0.4 0.6 0.8 1 1.2
% of Coking Cycle
PRO
ven
/ Con
vent
iona
l Lea
k R
atio

1
Appendix C7
Notes: Travel Emissions Clairton Batteries 1-3 vs. Battery C
December 18, 2007
1. EPA’s AP42 pushing emissions estimates use 74.1% capture efficiency. However that efficiency includes uncontrolled travel which according to the NESHAP BID justifies using the low value. It is important for USS to treat pushing and travel separately because C Battery with a significantly shorter average travel distance (oven to Q tower) compared to 1-3 Batteries will realize a substantial reduction in travel emissions.
2. From an emissions perspective, pushing and travel are two entirely different components of the coking operation.
During pushing the coke mass is moving, breaking apart, falling a significant distance, landing in the hot car while being exposed to high velocity air and combustion gasses as air is drawn into the PEC hood and coke burns. A large quantity of particulate matter is generated mechanically. The PEC hood design is properly intended to provide as tight a seal as practical to maximize capture efficiency. However, minimizing air infiltration leads to inefficient combustion of coke and residual VM and consequently PM generation.
Travel, on the other hand, is a relatively tranquil operation. Only combustion, influenced by the draft induce by the burning coke and the motion of the hot car, affects emissions. Therefore, travel should be treated strictly as a combustion source.
3. Travel emissions can be estimated using two parameters: an emissions rate (expressed in lb/ton of coke/second of travel) and travel time from the oven to the quench tower.
4. Little, if any, testing of travel emissions has been published. However, EPA conducted tests of PEC baghouse inlet and outlet streams at ABC Coke (Birmingham, Alabama, August 11 – 13, 1998) and at Bethlehem Steel (Chesterton, Indiana, aka Burns Harbor). Those tests included extensive testing of the inlet and outlet streams of the baghouse including their water and carbon dioxide content. From those test results it is possible to calculate the hydrogen and carbon consumed by combustion during the push and to express the H & C combustion in terms of pound consumed per ton of coke per second. That result provides a conservative estimate of the combustion that occurs during travel.
5. Emission rates for coal combustion are applied to the combustion during travel to estimate travel emissions.
6. Using this method, a reduction in emissions of approximately 40% is demonstrated.
7. Comparing to the USS factor estimated to be 10% of pushing emissions:
Travel Emissions (tons/yr)
Estimating Method NOX CO PM10 SO2
10% of Pushing, 1-3 Batts 1.1 NA 16.5 42.8
Equivalent Coal combustion, 1-3 Batts
12.5 10.0 10.0 46.7
Equivalent Coal combustion, C Batt
7.4 5.9 5.9 27.7
1
Appendix C8
Discussion of Leak Rates from Battery Stacks with PROven Technology as Compared to Conventional Oven Pressure Control – Replacement of Three Short Conventional
Batteries with One Tall PROven-Equipped Battery
November 16, 2007
I. Executive Summary
There are three significant factors affecting coke oven stacks emissions when three
old, short (3.6M) batteries are replaced by one modern, tall (6M) battery. The three
factors are: (1) the overall condition of the refractory, (2) the higher fuel efficiency
that will be achieved with the larger battery equipped with an advanced heating
system design including modern heating controls and (3) the PROven oven pressure
control system. The assumption is made here that three short batteries at USS
Clairton would be replaced with one modern tall battery.
For purposes of calculating the emissions benefit associated with the aforementioned
battery replacement, no credit is taken for the emissions reduction that will certainly
result from replacing old batteries with a new battery that has not experienced the
wear and tear of 50+ years of operation.
A fuel savings (Btu / pound of coal charged) of approximately 10% has been
projected by battery designers. A conservative (low side) estimate of the emissions
reduction that will result from this factor assumes that stack emissions will fall in
proportion to the change in fuel consumption – assuming a starting point of good
combustion, e.g. a well-operated COG- fired source.
PROven oven pressure control technology controls gas pressure at the gooseneck of
each oven. The pressure set point for each oven is varied according to a program
that maintains the proper gas pressure within the oven as the coking cycle proceeds.
By controlling pressure in this manner, PROven is able to minimize high gas
pressures that occur early in the coking cycle and thereby minimize leakage from the
oven into the combustion flues. In a separate calculation, the emissions impact of
PROven technology on door emissions was estimated. The estimated decrease in
door emissions from PROven’s improved oven pressure control was 39%.
2
II. Description of Process
In batteries with conventional oven pressure control systems, the pressure is
controlled by maintaining the collector main at a regulated, constant pressure. The
regulated collector main pressure must be kept as low as possible to avoid coke oven
gas (COG) leaking from doors, lids and offtakes and to avoid COG leaking into the
combustion flues where it causes localized overheating and stack emissions. The
minimum required pressure in the main is dictated by the need to avoid allowing the
gauge pressure at the base of the oven to become negative. A negative gauge
pressure is possible because of the difference in the density of hot coke oven gas in
the interior of the oven and the density of air at ambient temperature outside of the
oven. That difference in densities causes a difference in static head of the fluids
inside and outside of the oven of about 1.2 mmWG per meter of elevation [difference
between the oven floor and collector main] at the end of the coking cycle. If the
gauge pressure at the oven floor were allowed to become negative, air would
infiltrate the oven at the bottom of the doors causing combustion of the COG and
coke in the oven – overheating and damaging refractory, doors and door jambs. This
phenomenon requires taller batteries to operate with a higher collector main pressure
to maintain a positive pressure at the foot of the door.
The PROven system is an innovation that allows control of the pressure in individual
ovens by means of a regulated opening between the collector main and the
gooseneck. PROven is operated with a negative pressure in the collector main.
During the early stages of the coking cycle, the pressure in the gooseneck is
controlled to just slightly above atmospheric to minimize pressure at the oven floor
and consequently reduces door leaks and leaks of COG from the oven into the
combustion flues. As the coking cycle proceeds pressure drop from the oven floor to
the oven top decreases because coke has a higher porosity that coal, the COG
produced has a lower density and the gas production rate decreases. As the coking
cycle progresses, PROven gradually increases the set point for pressure at the
gooseneck. At the end of the cycle the gooseneck pressure is just high enough to
avoid a negative pressure at the foot of the door.

3
III. Discussion of Stacks Leak Rates
The condition of the battery’s refractory and the amount of carbon present to seal
cracks that allow oven-to-flue leakage through the oven walls are important to the
amount of oven-to-flue leakage that occurs in a battery. However, the significant
factor in the amount of leakage pertinent to this discussion is the COG pressure
within the oven, i.e. the driving force that causes COG to leak from the oven into the
combustion flues.
Leakage from oven to flues is positively related to the difference between the gas
pressure inside the oven and the pressure in the combustion flues, generally slightly
less than atmospheric pressure. Especially at the beginning of the coking cycle,
flow through the coal charge is impeded by the densely packed coal. (The flow
pathway through coke is much more porous than the pathway through coal.)
By controlling the pressure in the gooseneck of each oven, PROven minimizes the
peak pressure in the oven at the beginning of the cycle and avoids negative pressure
at the end of the cycle. The EPA (July 2007 AP42 BID, Figure 4-1) shows that door
leakage is at its maximum early in the cycle and decreases as coking progresses. The
lower pressure differential between the oven and pressure in the flues, especially
early in the cycle, is a significant factor leading to reduced stack emissions with the
PROven system as compared to the conventional pressure control technique.
No analogous studies have been found regarding the timing of stack emissions,
possibly because the effect of any single oven is masked by the mixing of
combustion products from all heating walls in the stack. However, it is generally
accepted that oven-to-flue leakage is highest at the beginning of the coking cycle and
decreases as coking proceeds. The effect of the improved pressure control with
PROven is analogous to PROven’s effect on door leaks. Therefore, it is appropriate
to estimate that stack emissions will be reduced by the same percentage reduction as
the percentage reduction expected for door emissions. Consequently it is estimated
that stack emissions from oven-to-flue leakage will be reduced by approximately
39%.
• Combined effect

4
There is no way to differentiate between emissions that result from oven-to-flue
leakage and emissions that occur during normal, well-controlled COG combustion.
However it is generally accepted that the large majority of coke battery stack
emissions result from leaks. Therefore as a reasonable approximation, a 90/10 split
between leaks and normal combustion emissions is assumed.
Combined:
Fraction of Original
Emissions
Fraction Reduced
Fraction of Original Emission
Remaining
Fraction of Original
Emissions with New Battery & PROven
Cause of Emissions
A B C = 1-B A x C Normal, Well-Controlled
Combustion 0.10 0.10 0.90 0.090
Oven-to Flue Leaks 0.90 0.39 0.61 0.549 Fraction of Original Emissions Remaining
after New Battery & PROven 0.639
Percent Emissions Reduction 35%
IV. Conclusions
Replacing three small batteries at USS Clairton Works with one tall battery equipped
with PROven technology would reduce stack emissions per ton of coal charged by
about 35%, without taking any credit for the pristine refractory condition that would
be present in a new battery.
It is certain that initially, a new battery could achieve a better stack emissions
performance than batteries that are 50+ years old. Although normal wear and tear on
the new battery is unavoidable, PROven technology will have long term performance
benefits. By minimizing COG leaks into the combustion flues, damage from
localized overheating is avoided, and by maintaining a positive pressure at the foot
of the doors, PROven can avoid temperature-related refractory damage that might
result from combustion of COG and coke that results from air infiltration.
1
Appendix C9
Discussion of Coke Oven Door Leak Rates with PROven Technology as Compared to Conventional Oven Pressure Control – Replacement of Three Short Conventional
Batteries with One Tall PROven-Equipped Battery
November 16, 2007
I. Executive Summary
Three factors affecting coke oven door emissions are addressed under the assumption that three short batteries at USS Clairton would be replaced with one tall battery. The three factors are: (1) the PROven oven pressure control system, (2) the fact that larger ovens have a significantly lower length of door seal per ton of coal charge and (3) the assumption that tall oven doors are more difficult to seal effectively as recognized in the federal door leak standards.
PROven technology avoids high internal oven pressure that occurs especially at the foot of the oven doors near the beginning of the coking cycle. The resulting decrease in door emissions from this factor is estimated to be 39%.
Based on a linear relationship between the length of door seal per ton of coal, a reduction in emissions of 33% is projected.
The projected effect of reduced door sealing efficiency on tall versus short batteries is calculated based on the ratio of federal standards for the two classes of batteries and is estimated to be an emissions increase of about 20%.
The combined effect of these three factors is a reduction of 50% in door emissions on an “emissions per ton of coal” basis.
II. Description of Process
In batteries with conventional oven pressure control systems oven pressure is controlled by maintaining the collector main at a regulated, constant pressure. The regulated collector main pressure must be kept as low as possible to avoid coke oven gas (COG) leaking from doors, lids and offtakes and to avoid COG leaking into the combustion flues where it would cause localized overheating and stack emissions. The minimum required pressure in the main is dictated by the need to avoid allowing the gauge pressure at the base of the oven to become negative. A negative gauge pressure is possible because of the difference in the density of hot coke oven gas in the interior of the oven and the density of air at ambient temperature outside of the oven. That difference in densities causes a difference in static head of the fluids inside and outside of the oven of about 1.2 mmWG per meter of elevation [difference between the oven floor and collector main] at the end of the coking cycle. If the gauge pressure at the oven floor were allowed to become negative, air would infiltrate the oven causing combustion of the COG and coke in the oven and damaging refractory, doors and door jambs. This phenomenon requires taller batteries to operate with a higher collector main pressure to maintain a positive pressure at the foot of the door.
2
The PROven system is an innovation that allows control of the pressure in individual ovens by means of a regulated opening between the collector main and the gooseneck. PROven is operated with a negative pressure in the collector main. During the early stages of the coking cycle, the pressure in the gooseneck is controlled to just slightly above atmospheric to minimize pressure at the oven floor and consequently reduce door leaks. As the coking cycle proceeds pressure drop from the oven floor to the oven top decreases because coke has a higher porosity that coal, the COG produced has a lower density and the gas production rate decreases. PROven gradually increases the oven pressure as the coking cycle progresses. At the end of the cycle the gooseneck pressure is just high enough to avoid a negative pressure at the foot of the door.
III. Factors Influencing Door Leak Rates
Three factors in the amount of door leakage are pertinent to this discussion: COG pressure within the oven, the length of door sealing edge per ton of coal charged and the increased difficulty sealing taller doors.
• Leakage from oven doors is positively related to the difference between the gas pressure inside the oven and ambient pressure outside the oven. Oven doors are designed with a “gas channel” to allow COG to flow from the base of the door to the top of the oven. However, at the beginning of the coking cycle, the pressure drop in the gas channel is high because the rate of COG generation is high and flow through the coal charge is impeded by the densely packed coal. (The flow pathway through coke is much more porous than the pathway through coal.)
By controlling the pressure in the gooseneck of each oven, PROven minimizes the peak pressure at the foot of the doors at the beginning of the cycle and avoids negative pressure at the end of the cycle. The EPA (July 2007 AP42 BID, Figure 4-1) shows that door leakage is at its maximum early in the cycle and decreases as coking progresses. The lower pressure differential between the oven and ambient, especially early in the cycle is a significant factor leading to reduced door emissions with the PROven system as compared to the conventional pressure control technique.
• The relative size of coke ovens is an important factor affecting emission rates. Ovens in modern batteries are generally both taller and longer (PS to CS) than ovens in batteries built in the 1950’s. For example, an oven in USS Clairton Works’ 1, 2 and 3 Batteries are 3.6 meters tall and have a design coal volume of 626 ft3; B Battery is 6 meters tall and has a design coal volume of 1,472 ft3. Relating the oven capacity to the length of door sealing edge, Batteries 1-3 have 0.089 feet of sealing edge per ton of coal charge, and B Battery has only 0.060 feet of sealing edge per ton of coal charge.
The relative length of sealing edge will lead to a proportional reduction in door emissions partially offset by the increased difficulty related to taller doors as discussed below.
• In order to obtain the best emissions performance from doors the doors’ sealing edges must conform closely to its jamb. Taller doors present a more difficult
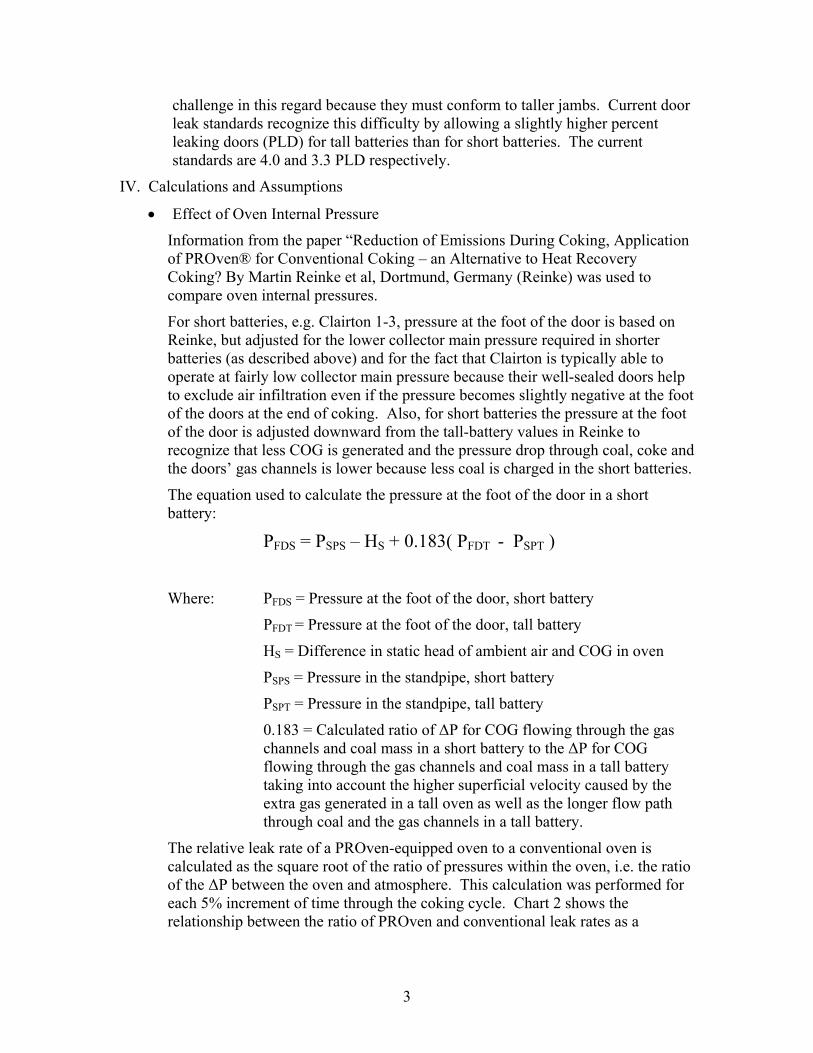
3
challenge in this regard because they must conform to taller jambs. Current door leak standards recognize this difficulty by allowing a slightly higher percent leaking doors (PLD) for tall batteries than for short batteries. The current standards are 4.0 and 3.3 PLD respectively.
IV. Calculations and Assumptions
• Effect of Oven Internal Pressure
Information from the paper “Reduction of Emissions During Coking, Application of PROven® for Conventional Coking – an Alternative to Heat Recovery Coking? By Martin Reinke et al, Dortmund, Germany (Reinke) was used to compare oven internal pressures.
For short batteries, e.g. Clairton 1-3, pressure at the foot of the door is based on Reinke, but adjusted for the lower collector main pressure required in shorter batteries (as described above) and for the fact that Clairton is typically able to operate at fairly low collector main pressure because their well-sealed doors help to exclude air infiltration even if the pressure becomes slightly negative at the foot of the doors at the end of coking. Also, for short batteries the pressure at the foot of the door is adjusted downward from the tall-battery values in Reinke to recognize that less COG is generated and the pressure drop through coal, coke and the doors’ gas channels is lower because less coal is charged in the short batteries.
The equation used to calculate the pressure at the foot of the door in a short battery:
PFDS = PSPS – HS + 0.183( PFDT - PSPT )
Where: PFDS = Pressure at the foot of the door, short battery
PFDT = Pressure at the foot of the door, tall battery
HS = Difference in static head of ambient air and COG in oven
PSPS = Pressure in the standpipe, short battery
PSPT = Pressure in the standpipe, tall battery
0.183 = Calculated ratio of ΔP for COG flowing through the gas channels and coal mass in a short battery to the ΔP for COG flowing through the gas channels and coal mass in a tall battery taking into account the higher superficial velocity caused by the extra gas generated in a tall oven as well as the longer flow path through coal and the gas channels in a tall battery.
The relative leak rate of a PROven-equipped oven to a conventional oven is calculated as the square root of the ratio of pressures within the oven, i.e. the ratio of the ΔP between the oven and atmosphere. This calculation was performed for each 5% increment of time through the coking cycle. Chart 2 shows the relationship between the ratio of PROven and conventional leak rates as a
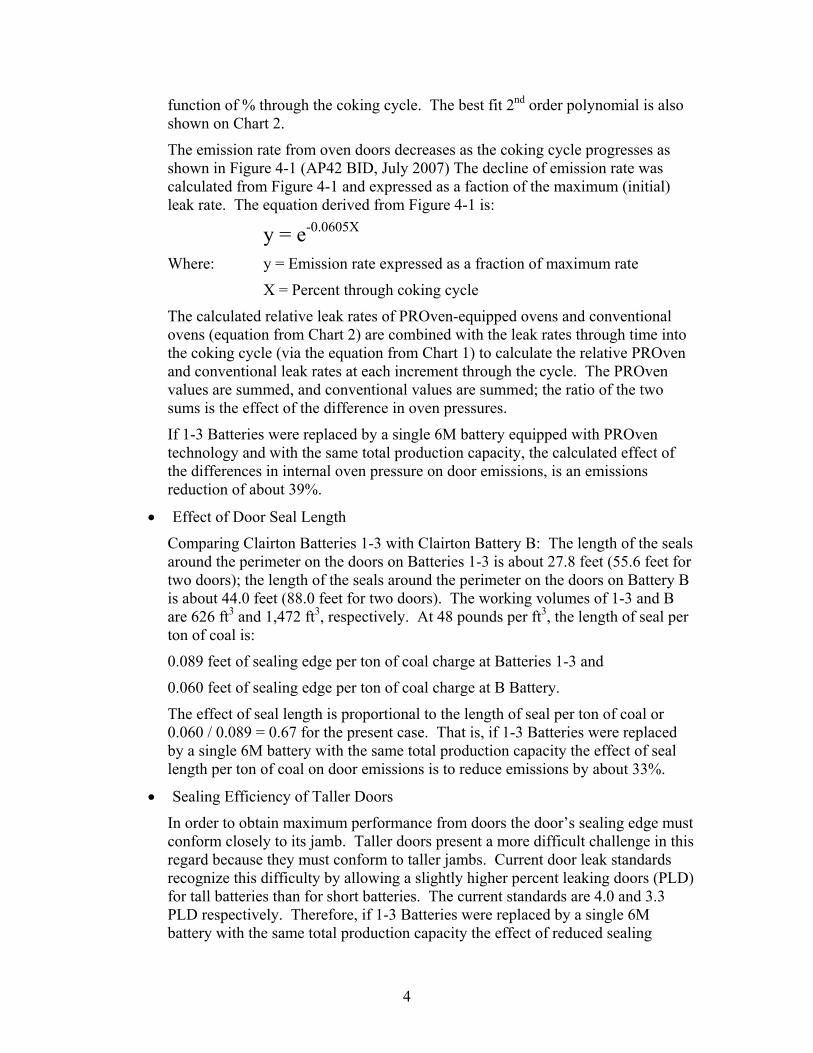
4
function of % through the coking cycle. The best fit 2nd order polynomial is also shown on Chart 2.
The emission rate from oven doors decreases as the coking cycle progresses as shown in Figure 4-1 (AP42 BID, July 2007) The decline of emission rate was calculated from Figure 4-1 and expressed as a faction of the maximum (initial) leak rate. The equation derived from Figure 4-1 is:
y = e-0.0605X Where: y = Emission rate expressed as a fraction of maximum rate
X = Percent through coking cycle
The calculated relative leak rates of PROven-equipped ovens and conventional ovens (equation from Chart 2) are combined with the leak rates through time into the coking cycle (via the equation from Chart 1) to calculate the relative PROven and conventional leak rates at each increment through the cycle. The PROven values are summed, and conventional values are summed; the ratio of the two sums is the effect of the difference in oven pressures.
If 1-3 Batteries were replaced by a single 6M battery equipped with PROven technology and with the same total production capacity, the calculated effect of the differences in internal oven pressure on door emissions, is an emissions reduction of about 39%.
• Effect of Door Seal Length
Comparing Clairton Batteries 1-3 with Clairton Battery B: The length of the seals around the perimeter on the doors on Batteries 1-3 is about 27.8 feet (55.6 feet for two doors); the length of the seals around the perimeter on the doors on Battery B is about 44.0 feet (88.0 feet for two doors). The working volumes of 1-3 and B are 626 ft3 and 1,472 ft3, respectively. At 48 pounds per ft3, the length of seal per ton of coal is:
0.089 feet of sealing edge per ton of coal charge at Batteries 1-3 and
0.060 feet of sealing edge per ton of coal charge at B Battery.
The effect of seal length is proportional to the length of seal per ton of coal or 0.060 / 0.089 = 0.67 for the present case. That is, if 1-3 Batteries were replaced by a single 6M battery with the same total production capacity the effect of seal length per ton of coal on door emissions is to reduce emissions by about 33%.
• Sealing Efficiency of Taller Doors
In order to obtain maximum performance from doors the door’s sealing edge must conform closely to its jamb. Taller doors present a more difficult challenge in this regard because they must conform to taller jambs. Current door leak standards recognize this difficulty by allowing a slightly higher percent leaking doors (PLD) for tall batteries than for short batteries. The current standards are 4.0 and 3.3 PLD respectively. Therefore, if 1-3 Batteries were replaced by a single 6M battery with the same total production capacity the effect of reduced sealing
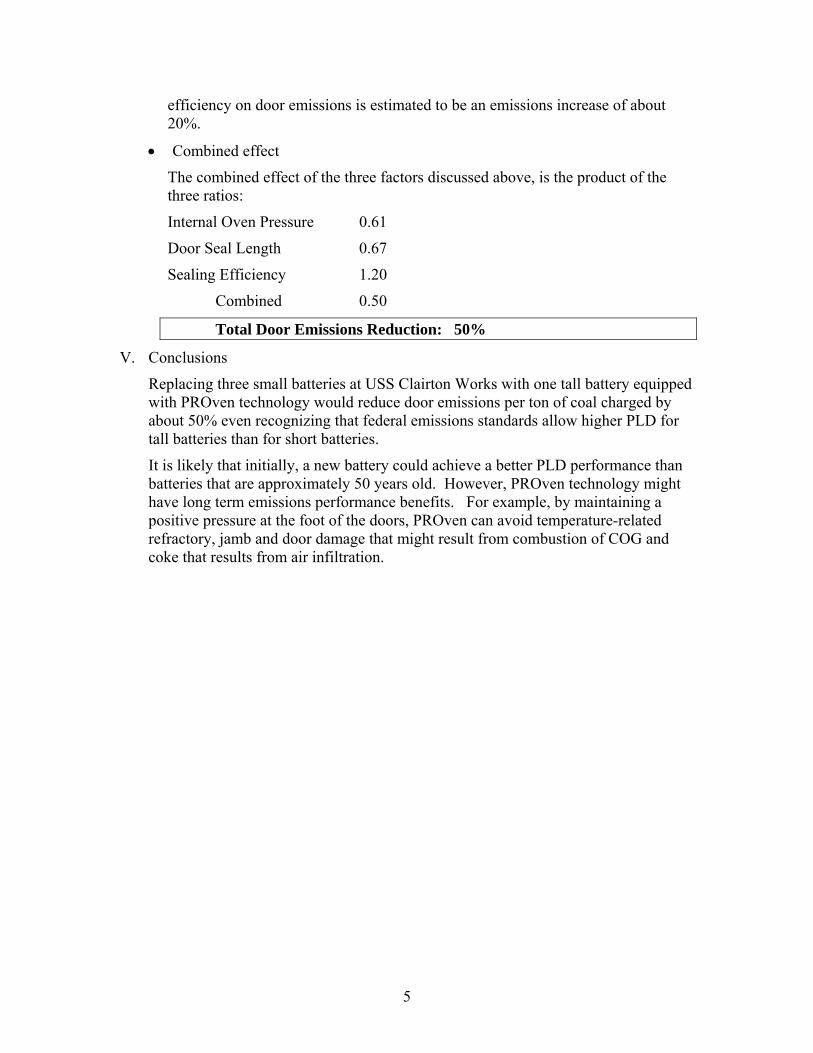
5
efficiency on door emissions is estimated to be an emissions increase of about 20%.
• Combined effect
The combined effect of the three factors discussed above, is the product of the three ratios:
Internal Oven Pressure 0.61
Door Seal Length 0.67
Sealing Efficiency 1.20
Combined 0.50
Total Door Emissions Reduction: 50%
V. Conclusions
Replacing three small batteries at USS Clairton Works with one tall battery equipped with PROven technology would reduce door emissions per ton of coal charged by about 50% even recognizing that federal emissions standards allow higher PLD for tall batteries than for short batteries.
It is likely that initially, a new battery could achieve a better PLD performance than batteries that are approximately 50 years old. However, PROven technology might have long term emissions performance benefits. For example, by maintaining a positive pressure at the foot of the doors, PROven can avoid temperature-related refractory, jamb and door damage that might result from combustion of COG and coke that results from air infiltration.
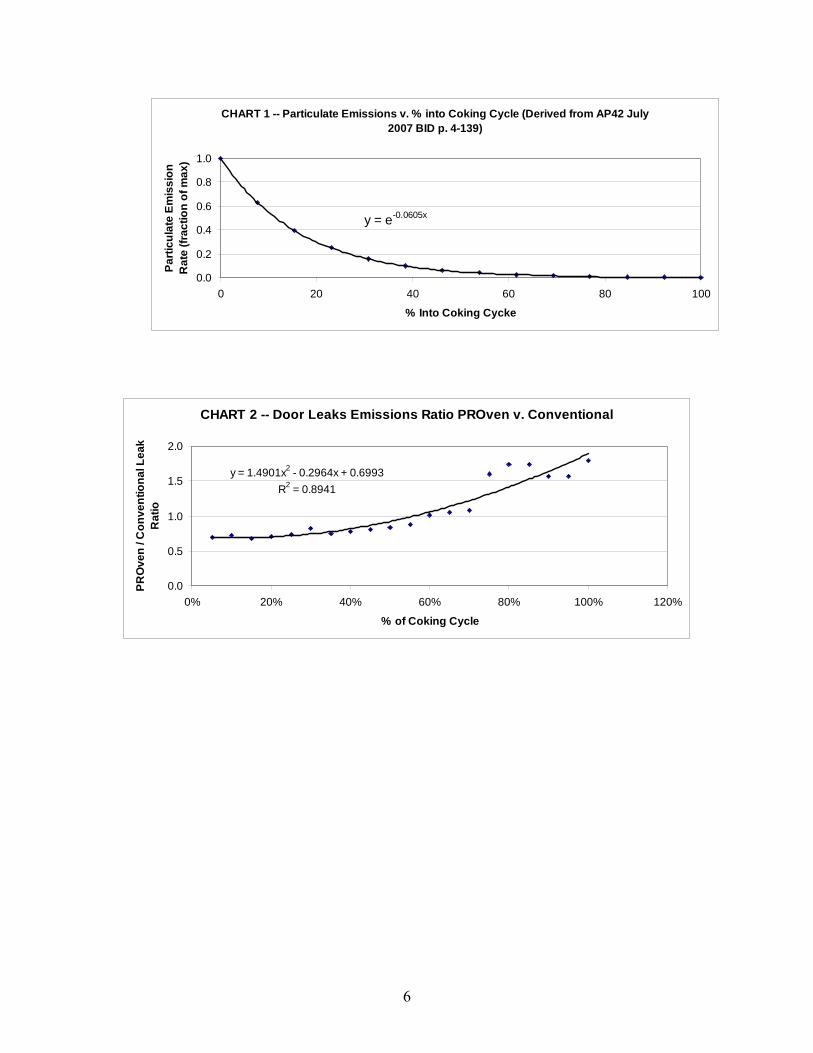
6
CHART 1 -- Particulate Emissions v. % into Coking Cycle (Derived from AP42 July 2007 BID p. 4-139)
y = e-0.0605x
0.0
0.2
0.4
0.6
0.8
1.0
0 20 40 60 80 100
% Into Coking Cycke
Parti
cula
te E
mis
sion
R
ate
(frac
tion
of m
ax)
CHART 2 -- Door Leaks Emissions Ratio PROven v. Conventional
y = 1.4901x2 - 0.2964x + 0.6993R2 = 0.8941
0.0
0.5
1.0
1.5
2.0
0% 20% 40% 60% 80% 100% 120%
% of Coking Cycle
PRO
ven
/ Con
vent
iona
l Lea
k R
atio
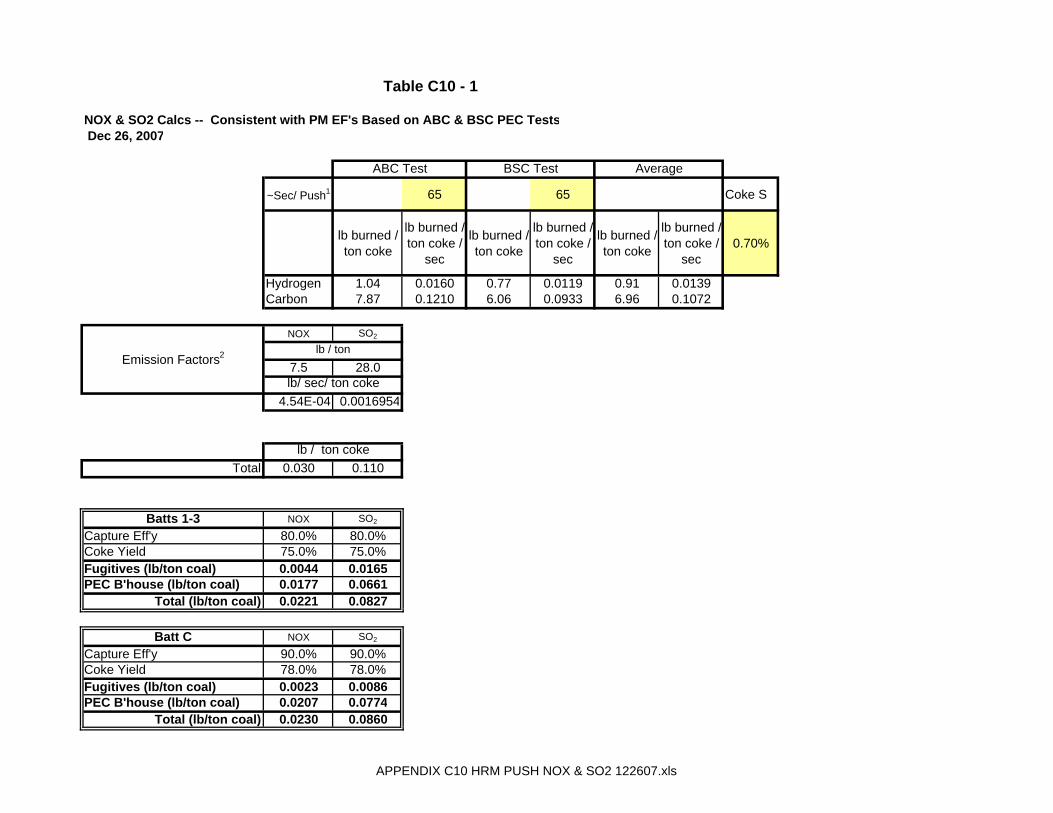
NOX & SO2 Calcs -- Consistent with PM EF's Based on ABC & BSC PEC Tests Dec 26, 2007
ABC Test BSC Test Average
~Sec/ Push1 65 65 Coke S
lb burned / ton coke
lb burned / ton coke /
sec
lb burned / ton coke
lb burned / ton coke /
sec
lb burned / ton coke
lb burned / ton coke /
sec0.70%
Hydrogen 1.04 0.0160 0.77 0.0119 0.91 0.0139Carbon 7.87 0.1210 6.06 0.0933 6.96 0.1072
NOX SO2
lb / ton7.5 28.0lb/ sec/ ton coke
4.54E-04 0.0016954
lb / ton cokeTotal 0.030 0.110
Batts 1-3 NOX SO2
Capture Eff'y 80.0% 80.0%Coke Yield 75.0% 75.0%Fugitives (lb/ton coal) 0.0044 0.0165PEC B'house (lb/ton coal) 0.0177 0.0661
Total (lb/ton coal) 0.0221 0.0827
Batt C NOX SO2
Capture Eff'y 90.0% 90.0%Coke Yield 78.0% 78.0%Fugitives (lb/ton coal) 0.0023 0.0086PEC B'house (lb/ton coal) 0.0207 0.0774
Total (lb/ton coal) 0.0230 0.0860
Emission Factors2
Table C10 - 1
APPENDIX C10 HRM PUSH NOX & SO2 122607.xls
January 2008 D:\final permit application 12-31-07\Permit Application
Technical Support Document Dec 31.doc
Appendix D Literature on the PROven® System

THE COKE OVEN MANAGERS’ YEAR-BOOK 93.
Mr Giertz is a Project Engineer with Deutsche Montan Technologie, Essen, Germany.
Mr Jessup is a Senior Process Engineer for OSC Process Engineering Limited, Stockport England.
COKE OVEN CHAMBER PRESSURE CONTROL – A NEW EMISSION CONTROL SYSTEM
By
J. Giertz and A S Jessup
Read before the Midland Section on 15 April 1999 at Corus Conference Centre, Scunthorpe
Background
Coke works in Britain are regulated by the Environmental Protection
Act, under the watchful eye of the environmental inspector. The EPA does give the inspector some flexibility in determining the requirements for each site. This is because the Act recognises that pollution control comes at a financial cost and there is a balance to be struck in achieving the best possible environmental improvements without jeopardising the economic viability of the works. These compromises are summarised by the terms “Best Available Techniques Not Entailing Excessive Cost” and “Best Practice Environmental Option”: BATNEEC & BPEO.
Coke works are being subjected to evertightening constraints on
emissions, whether they be liquid effluents or emissions to atmosphere. The guidance for inspectors is regularly revised to incorporate new “best” technology, and applicants for authorisations are expected to keep abreast of such developments. This applies to existing, as well as new plant.
The incorporation of new techniques into existing plant must of course
give achievable levels of improvement. It is no good incorporating new equipment to solve a problem if there is a more fundamental problem which will prevent any benefits from the supposed “improvement” being realised.
Any new development for use in the coking industry must meet the
BATNEEC requirements and above all be robust. It is also desirable that someone else has proven it to work first!
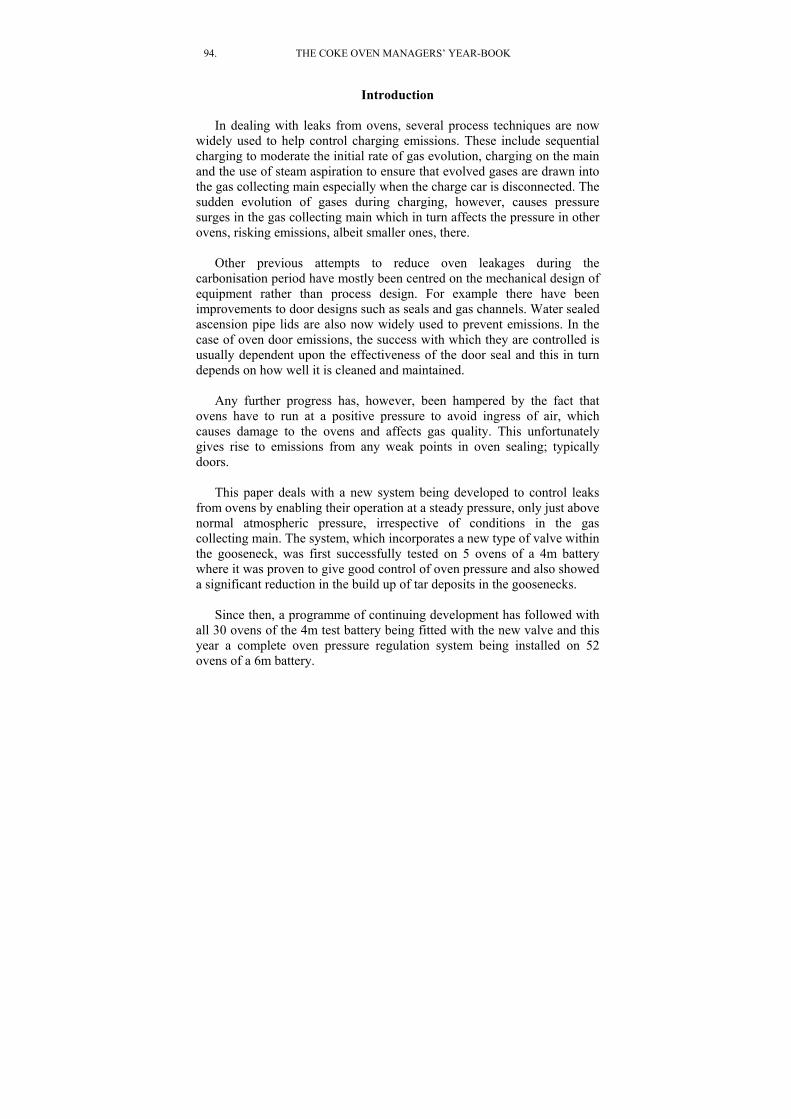
94. THE COKE OVEN MANAGERS’ YEAR-BOOK
Introduction In dealing with leaks from ovens, several process techniques are now
widely used to help control charging emissions. These include sequential charging to moderate the initial rate of gas evolution, charging on the main and the use of steam aspiration to ensure that evolved gases are drawn into the gas collecting main especially when the charge car is disconnected. The sudden evolution of gases during charging, however, causes pressure surges in the gas collecting main which in turn affects the pressure in other ovens, risking emissions, albeit smaller ones, there.
Other previous attempts to reduce oven leakages during the
carbonisation period have mostly been centred on the mechanical design of equipment rather than process design. For example there have been improvements to door designs such as seals and gas channels. Water sealed ascension pipe lids are also now widely used to prevent emissions. In the case of oven door emissions, the success with which they are controlled is usually dependent upon the effectiveness of the door seal and this in turn depends on how well it is cleaned and maintained.
Any further progress has, however, been hampered by the fact that
ovens have to run at a positive pressure to avoid ingress of air, which causes damage to the ovens and affects gas quality. This unfortunately gives rise to emissions from any weak points in oven sealing; typically doors.
This paper deals with a new system being developed to control leaks
from ovens by enabling their operation at a steady pressure, only just above normal atmospheric pressure, irrespective of conditions in the gas collecting main. The system, which incorporates a new type of valve within the gooseneck, was first successfully tested on 5 ovens of a 4m battery where it was proven to give good control of oven pressure and also showed a significant reduction in the build up of tar deposits in the goosenecks.
Since then, a programme of continuing development has followed with
all 30 ovens of the 4m test battery being fitted with the new valve and this year a complete oven pressure regulation system being installed on 52 ovens of a 6m battery.

COKE OVEN CHAMBER PRESSURE CONTROL – 95. A NEW EMISSION CONTROL SYSTEM – GIERTZ & JESSUP
Typical Current Oven Operation The top curve in Fig 1 shows a typical relationship between the
pressure behind a coke oven door with respect to coking time. The oven must be kept at a positive pressure to prevent ingress of air and the subsequent damage to the oven ends and poor gas quality that would otherwise result. The higher the oven pressure, the more leakage that will occur through a given leakage path. Any shortcomings in the door sealing strips will be especially noticeable at the start of the coking cycle when the oven pressure is highest.
Coking time [hours]
current practiceadjustment
low emissionadjustment
ideal pressure
15
10
5
0
-5
25Pres
sure
[m
m w
g]
Fig. 1
Typical Pressure at Coke Oven Door If the gas collecting main were to be put under suction, the pressure in
the oven could be reduced, as shown in the bottom curve in Fig 1, and hence the emissions would be reduced. Simply doing this would however
lead to air ingress into the oven during the latter part of the coking cycle.Ideally the oven pressure should be kept low and constant. Just enough
pressure to avoid air ingress, but low enough to avoid emissions. This ideal is represented by the horizontal line in Fig 1.
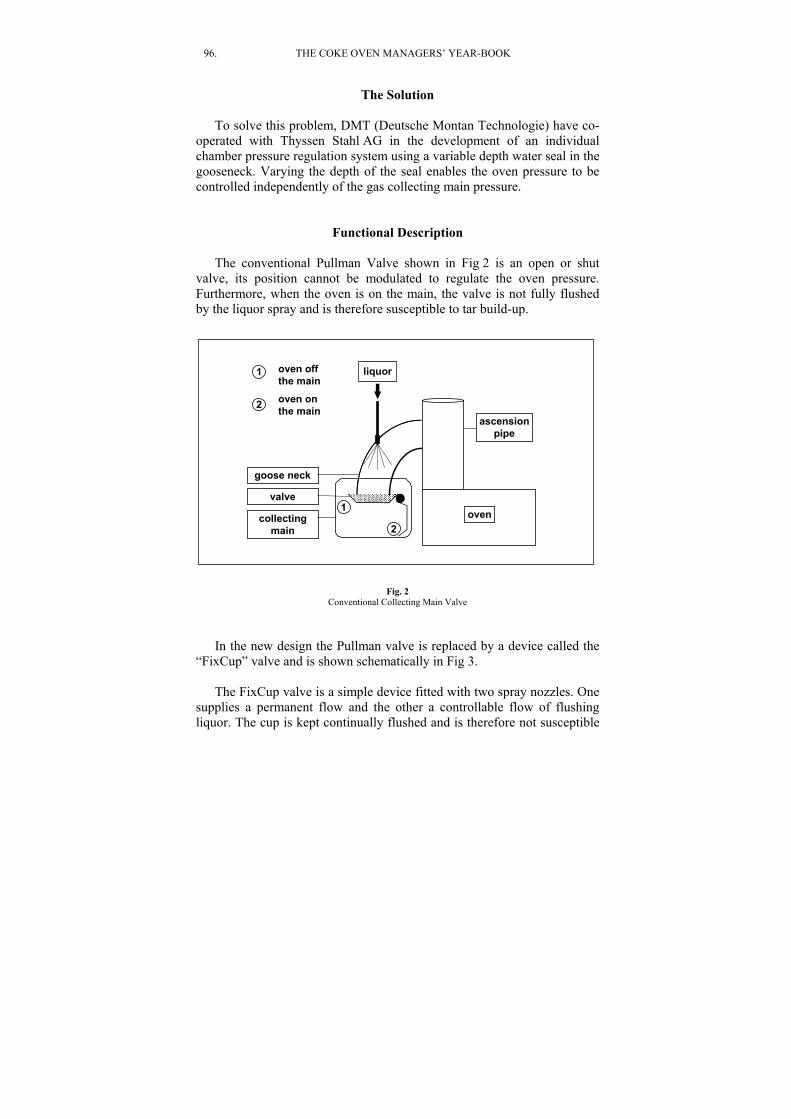
96. THE COKE OVEN MANAGERS’ YEAR-BOOK
The Solution To solve this problem, DMT (Deutsche Montan Technologie) have co-
operated with Thyssen Stahl AG in the development of an individual chamber pressure regulation system using a variable depth water seal in the gooseneck. Varying the depth of the seal enables the oven pressure to be controlled independently of the gas collecting main pressure.
Functional Description The conventional Pullman Valve shown in Fig 2 is an open or shut
valve, its position cannot be modulated to regulate the oven pressure. Furthermore, when the oven is on the main, the valve is not fully flushed by the liquor spray and is therefore susceptible to tar build-up.
collectingmain
goose neck
water
oven1
2
ascensionpipe
1 oven offthe main
2 oven onthe main
valve
liquor
Fig. 2 Conventional Collecting Main Valve
In the new design the Pullman valve is replaced by a device called the
“FixCup” valve and is shown schematically in Fig 3. The FixCup valve is a simple device fitted with two spray nozzles. One
supplies a permanent flow and the other a controllable flow of flushing liquor. The cup is kept continually flushed and is therefore not susceptible
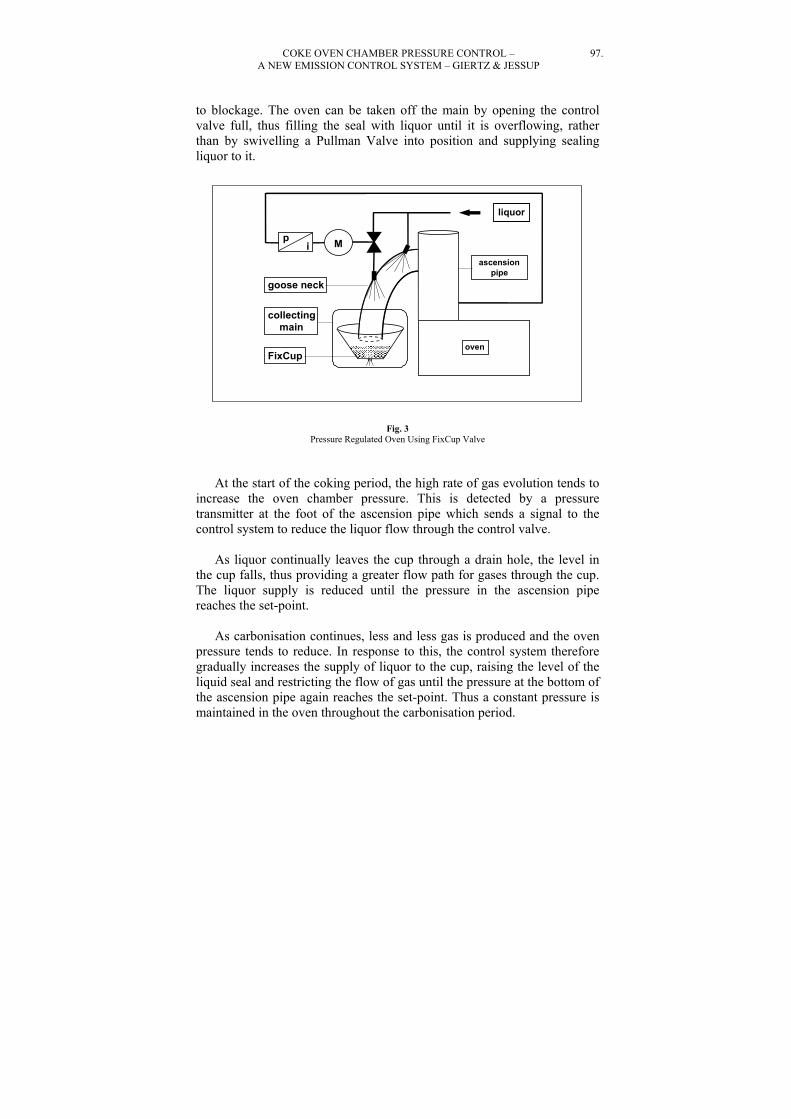
COKE OVEN CHAMBER PRESSURE CONTROL – 97. A NEW EMISSION CONTROL SYSTEM – GIERTZ & JESSUP to blockage. The oven can be taken off the main by opening the control valve full, thus filling the seal with liquor until it is overflowing, rather than by swivelling a Pullman Valve into position and supplying sealing liquor to it.
Mpi
goose neck
FixCup
collectingmain
waterliquor
oven
ascensionpipe
Fig. 3 Pressure Regulated Oven Using FixCup Valve
At the start of the coking period, the high rate of gas evolution tends to increase the oven chamber pressure. This is detected by a pressure transmitter at the foot of the ascension pipe which sends a signal to the control system to reduce the liquor flow through the control valve.
As liquor continually leaves the cup through a drain hole, the level in
the cup falls, thus providing a greater flow path for gases through the cup. The liquor supply is reduced until the pressure in the ascension pipe reaches the set-point.
As carbonisation continues, less and less gas is produced and the oven
pressure tends to reduce. In response to this, the control system therefore gradually increases the supply of liquor to the cup, raising the level of the liquid seal and restricting the flow of gas until the pressure at the bottom of the ascension pipe again reaches the set-point. Thus a constant pressure is maintained in the oven throughout the carbonisation period.
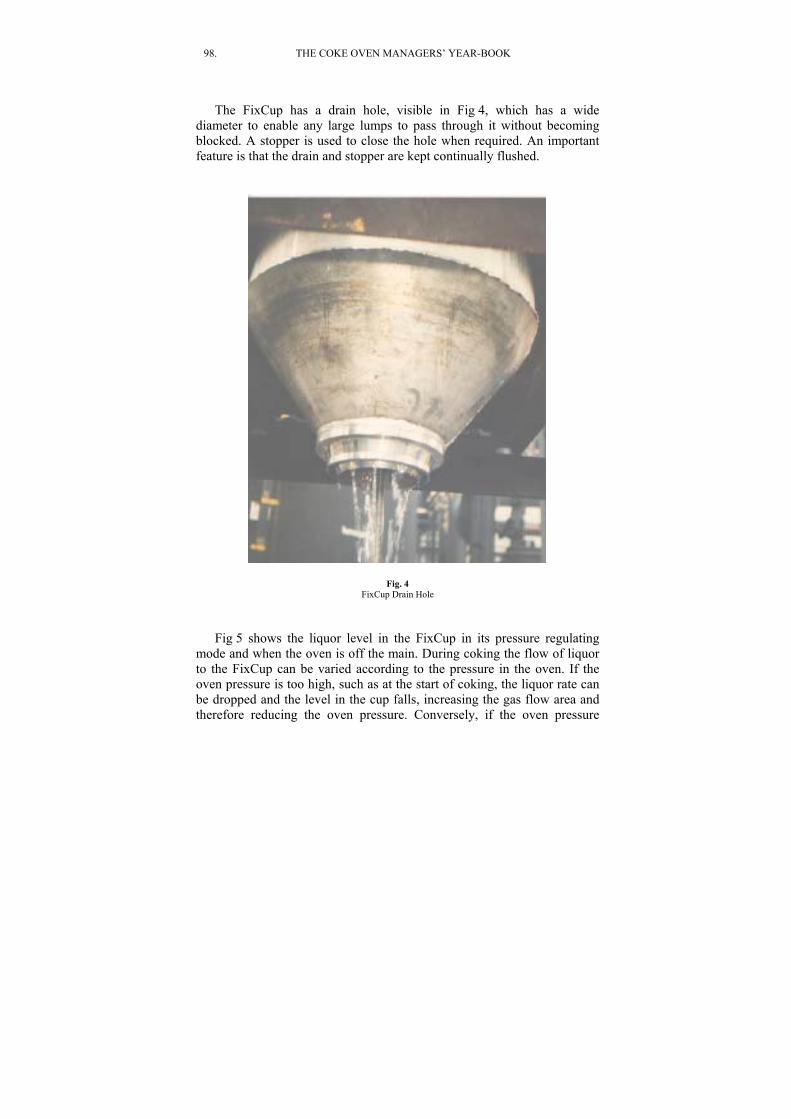
98. THE COKE OVEN MANAGERS’ YEAR-BOOK
The FixCup has a drain hole, visible in Fig 4, which has a wide
diameter to enable any large lumps to pass through it without becoming blocked. A stopper is used to close the hole when required. An important feature is that the drain and stopper are kept continually flushed.
Fig. 4 FixCup Drain Hole
Fig 5 shows the liquor level in the FixCup in its pressure regulating
mode and when the oven is off the main. During coking the flow of liquor to the FixCup can be varied according to the pressure in the oven. If the oven pressure is too high, such as at the start of coking, the liquor rate can be dropped and the level in the cup falls, increasing the gas flow area and therefore reducing the oven pressure. Conversely, if the oven pressure

COKE OVEN CHAMBER PRESSURE CONTROL – 99. A NEW EMISSION CONTROL SYSTEM – GIERTZ & JESSUP starts to fall, as it does towards the end of the coking time, the liquor rate can be increased and the level in the cup rises, restricting the flow of gas and therefore maintaining the required slightly positive oven pressure.
art of coking
End of coking
St
Off the main
Fig. 5 Different Water Levels in the FixCup Valve
The set point for the oven pressure can be freely selected, being only
limited by the suction available and the range of seal depths in the cup. The
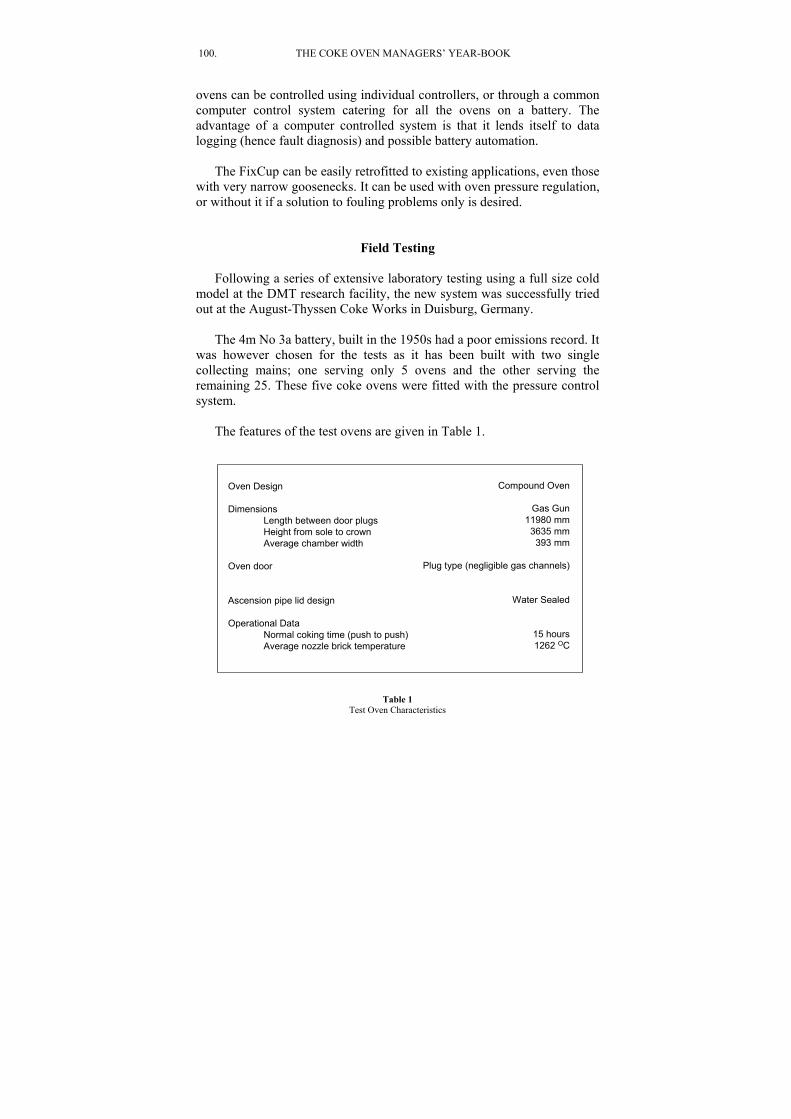
100. THE COKE OVEN MANAGERS’ YEAR-BOOK ovens can be controlled using individual controllers, or through a common computer control system catering for all the ovens on a battery. The advantage of a computer controlled system is that it lends itself to data logging (hence fault diagnosis) and possible battery automation.
The FixCup can be easily retrofitted to existing applications, even those
with very narrow goosenecks. It can be used with oven pressure regulation, or without it if a solution to fouling problems only is desired.
Field Testing Following a series of extensive laboratory testing using a full size cold
model at the DMT research facility, the new system was successfully tried out at the August-Thyssen Coke Works in Duisburg, Germany.
The 4m No 3a battery, built in the 1950s had a poor emissions record. It
was however chosen for the tests as it has been built with two single collecting mains; one serving only 5 ovens and the other serving the remaining 25. These five coke ovens were fitted with the pressure control system.
The features of the test ovens are given in Table 1.
Oven Design
DimensionsLength between door plugsHeight from sole to crownAverage chamber width
Oven door
Ascension pipe lid design
Operational DataNormal coking time (push to push)Average nozzle brick temperature
Plug type (n
Compound Oven
Gas Gun11980 mm3635 mm393 mm
egligible gas channels)
Water Sealed
15 hours1262 OC
Table 1 Test Oven Characteristics

COKE OVEN CHAMBER PRESSURE CONTROL – 101. A NEW EMISSION CONTROL SYSTEM – GIERTZ & JESSUP
A set of preliminary investigations was first carried out without individual oven chamber pressure regulation. This was to characterise the pressure conditions at the oven doors, in the ascension pipes, the gas-spaces and in the collecting main.
The results showed comparable pressures in the ascension pipes
compared with the gas spaces. At the door, the pressures were substantially different from the ascension pipes and gas spaces. This was due to the old type of door design which had very narrow gas channels. For ovens equipped with larger gas channels it is expected that the differentials will be significantly reduced to a point where the door pressure can be confidently characterised predominantly by the ascension pipe pressure.
Fig 6 shows a graph of the number 2 oven ascension pipe and
corresponding collection main pressures taken over 20 hours of normal operation. Noticeable are the clear positive and negative spikes.
The two negative spikes are caused by steam ejection during charging
of number 2 oven. Steam ejection causes an increase in the volumetric flow into the collecting main and therefore an increase in main pressure which is represented by the positive spikes on the lower chart.
Pres
sure
[m
m w
g]
20
10
0
-1020
10
0
Time [hours]
collecting main
ascension pipe oven no. 2
19.00 00.00 05.00 10.00
Fig. 6 Pressure Conditions during Normal Operation

102. THE COKE OVEN MANAGERS’ YEAR-BOOK
During the carbonisation period, further peaks in pressure occur in the
collecting main due to steam ejection from neighbouring ovens. These pressure rises are transmitted to oven 2. The increase in oven pressure caused by the charging of other ovens resulted in additional emissions from the ascension pipe lids and the upper parts of oven doors and leveller doors.
A magnification of the graph around the oven pushing and charging
period is given in Fig 7. This shows more clearly how the pressure in the collecting main is affected by the pressure in the ascension pipes.
Pres
sure
[m
m w
g]
20
10
0
-1020
10
0
Time [hours]
collecting main
ascension pipe oven no. 2
15.00 16.00
oven offthe main charging
17.00
Fig. 7 Pressure Conditions during Normal Operation
At the end of the coking period, no more gas is being produced and the
pressures in the ascension pipe and collecting main are the same - about 4mm WG.
When the oven is taken off the main and the ascension pipe lid is
opened, the pressure at the bottom of the ascension pipe immediately drops to just below atmospheric. Pressures stay relatively constant during the push.
When charging takes place, the aid of steam ejection causes the pressure in the ascension pipe to drop steeply, causing a corresponding increase in GC main pressure, which, as was seen in the previous figure, causes pressure peaks in adjacent ovens.
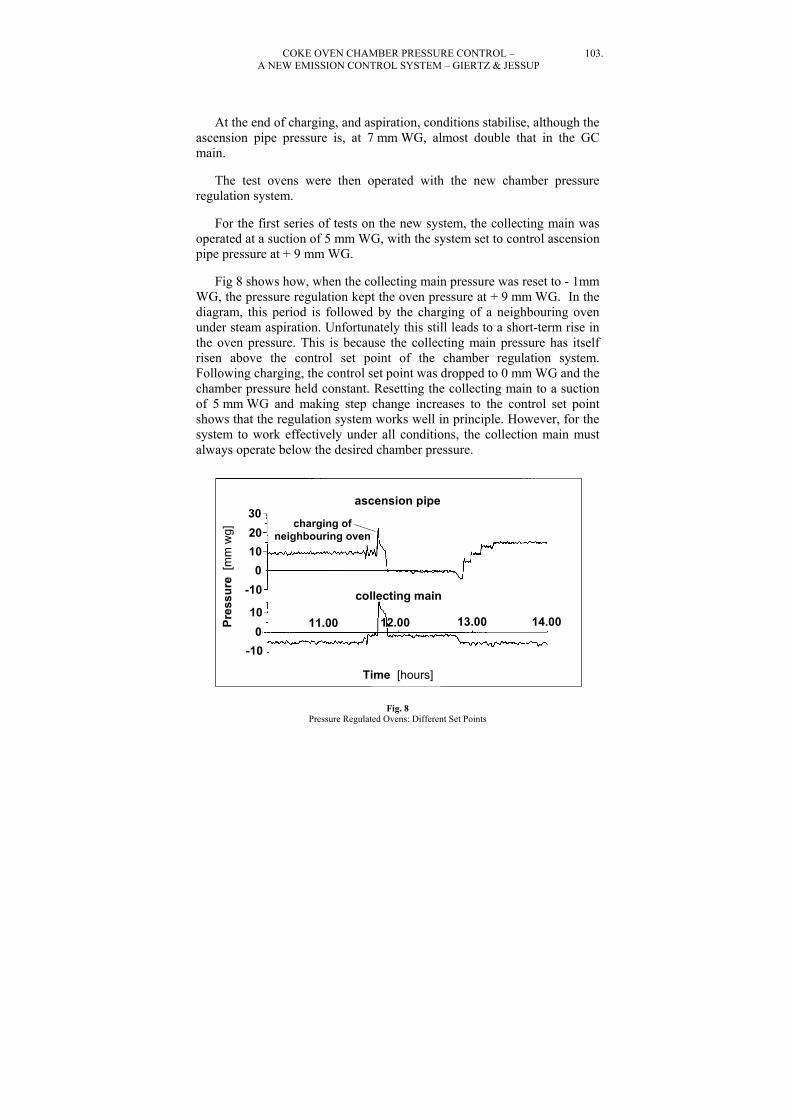
COKE OVEN CHAMBER PRESSURE CONTROL – 103. A NEW EMISSION CONTROL SYSTEM – GIERTZ & JESSUP
At the end of charging, and aspiration, conditions stabilise, although the
ascension pipe pressure is, at 7 mm WG, almost double that in the GC main.
The test ovens were then operated with the new chamber pressure
regulation system. For the first series of tests on the new system, the collecting main was
operated at a suction of 5 mm WG, with the system set to control ascension pipe pressure at + 9 mm WG.
Fig 8 shows how, when the collecting main pressure was reset to - 1mm
WG, the pressure regulation kept the oven pressure at + 9 mm WG. In the diagram, this period is followed by the charging of a neighbouring oven under steam aspiration. Unfortunately this still leads to a short-term rise in the oven pressure. This is because the collecting main pressure has itself risen above the control set point of the chamber regulation system. Following charging, the control set point was dropped to 0 mm WG and the chamber pressure held constant. Resetting the collecting main to a suction of 5 mm WG and making step change increases to the control set point shows that the regulation system works well in principle. However, for the system to work effectively under all conditions, the collection main must always operate below the desired chamber pressure.
Pres
sure
[m
m w
g]
30
100
-10
100
-10
Time [hours]
collecting main
ascension pipe
11.00
charging ofneighbouring oven20
12.00 13.00 14.00
Fig. 8 Pressure Regulated Ovens: Different Set Points

104. THE COKE OVEN MANAGERS’ YEAR-BOOK
If the pressure in the collecting main could be lowered far enough, it
follows that the regulation system can be applied with greatest success. This is demonstrated in Fig 9. The collecting main pressure here was set to - 12 mm WG. Reducing the pressure this far meant that steam ejection was no longer required during charging. The oven is taken off the main simply by adjusting the liquor flow to the FixCup to its maximum value, hence filling the cup. During pushing the pressure in the oven is essentially 0 mm WG which is below the controller set point value. This forces the pressure regulator to keep the flushing liquor supply valve open at its maximum position.
Prior to the start of coal charging, the ascension pipe lid is closed and
the oven is connected to the main by opening the drain hole in the bottom of the cup. This allows the full flow of gases released during charging to pass into the GC main. At the end of coal charging, the oven pressure is maintained at the set point, albeit from a temporary overshoot of the controller.
Pres
sure
[m
m w
g]
20
10
0
-10
-10
0
Time [hours]
co
as
llecting main
cension pipe
10.00 11.00
oven offthe main charging
12.00
Fig. 9 Vacuum in Main Replaces Steam Ejection
It should also be noted that charging does not give rise to a pressure peak in the gas collecting main. This means that there are no pressure peaks in adjacent ovens.

COKE OVEN CHAMBER PRESSURE CONTROL – 105. A NEW EMISSION CONTROL SYSTEM – GIERTZ & JESSUP
Here one can see the possibilities for automated battery top operations:
Table 2 shows how this might be achieved, with the computer initiating operation of the FixCup valve and ascension pipe lid once the pusher is in place. After the oven has been pushed and the charge car is ready to charge, the computer could then reverse the sequence of lid and FixCup operations and activate the pressure regulation system.
Aspiration no longer necessary This leads to savings in terms of steam (or liquor), the infrastructure pumps, pipework) and the maintenance which they require.
Automation Enabling disconnection from and re-connection to the GC main.
Controlled double collecting main operation Flow of gas in the oven space can be directed in a specified direction f
Reduced Gooseneck cleaning.
Improved Emission Control: From doors and frames (especially when used with doors incorporat From leveler doors. From charge hole lids and frames. From ascension pipes. From adjacent ovens when charging.
(boilers,
or a specified duration.
ing modern gas channels.
Table 2 Summary
When studying Fig 9, it must be remembered that the ascension pipe
pressures were being measured as opposed to oven door pressures. The ovens in the test have traditional plug-type doors with virtually ineffective gas channels. A comparison of ascension pipe and door pressures, as given in Fig 10, shows the differences.
Here the collecting main was run at an essentially constant pressure.
(The pressure spikes have been omitted for clarity.) For the first 12.5 hours the pressure control was turned off. During this period, the pressure at the ascension pipe is constant. At the oven sole, however, the pressure behind the door drops significantly from its initial pressure, when the rate of gas evolution is greatest. After half the cycle time the door pressure becomes negative, resulting in air ingress into the ovens. Once this condition had been reached, it was possible to adjust the set point to give zero pressure at

106. THE COKE OVEN MANAGERS’ YEAR-BOOK the oven door, thus stopping air ingress. Unfortunately the ascension pipe pressure had risen to + 8 mm WG. At such a late point in the carbonisation of the coal, this does not give rise to emissions from oven tops and leveller doors. This would not be the case if the same set point had been applied at the start of carbonisation.
Fig. 10
Without and With Pressure Regulation
Pres
sure
[m
m w
g]20
10
0
10
100
Coking time [hours]
collecting main
ascension pipe
0
oven door
onoffpressure regulation:
86420 10 1412
wg]
5ascension pipe
Pres
sure
[m
m
0
10
0
Coking time [hours]
collecting main
-20
oven door
5 10
5 10 15 20
15 20
Fig. 11 Pressures Expected with Optimised Doors
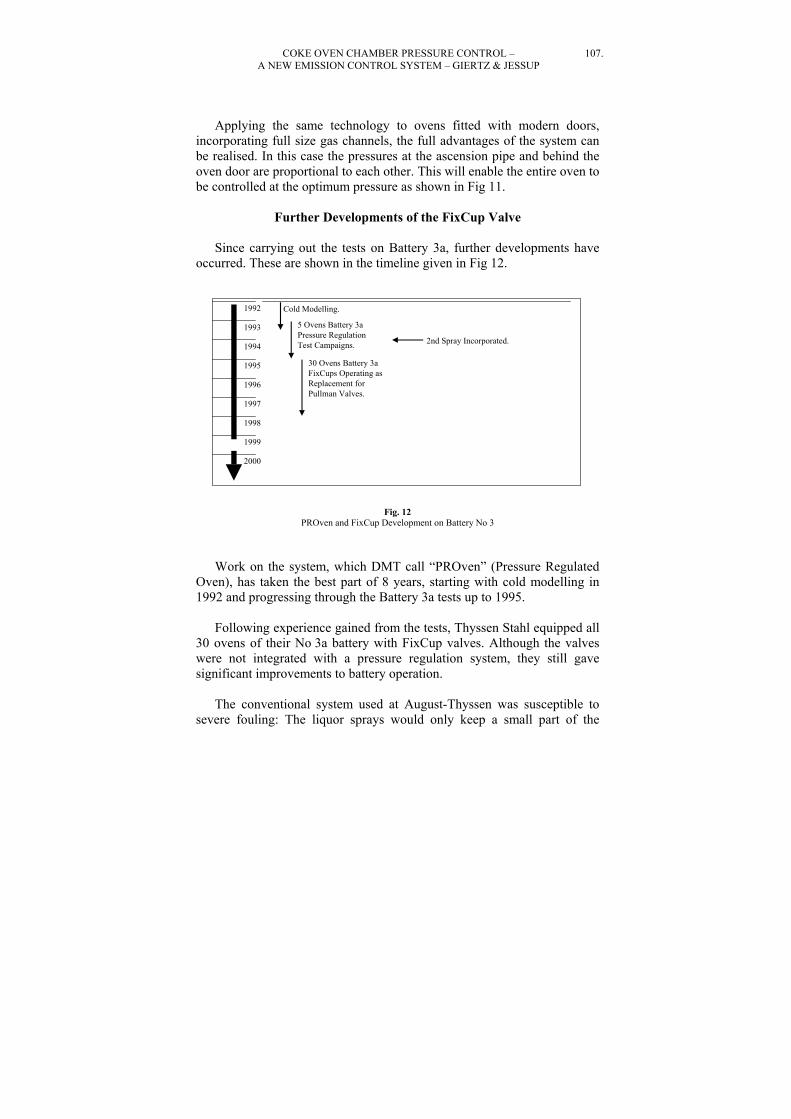
COKE OVEN CHAMBER PRESSURE CONTROL – 107. A NEW EMISSION CONTROL SYSTEM – GIERTZ & JESSUP
Applying the same technology to ovens fitted with modern doors,
incorporating full size gas channels, the full advantages of the system can be realised. In this case the pressures at the ascension pipe and behind the oven door are proportional to each other. This will enable the entire oven to be controlled at the optimum pressure as shown in Fig 11.
Further Developments of the FixCup Valve
Since carrying out the tests on Battery 3a, further developments have
occurred. These are shown in the timeline given in Fig 12.
1992
1993
1994
1995
1996
1997
1998
1999
2000
Cold Modelling.
5 Ovens Battery 3aPressure RegulationTest Campaigns. 2nd Spray Incorporated.
30 Ovens Battery 3aFixCups Operating asReplacement for Pullman Valves.
Fig. 12 PROven and FixCup Development on Battery No 3
Work on the system, which DMT call “PROven” (Pressure Regulated
Oven), has taken the best part of 8 years, starting with cold modelling in 1992 and progressing through the Battery 3a tests up to 1995.
Following experience gained from the tests, Thyssen Stahl equipped all
30 ovens of their No 3a battery with FixCup valves. Although the valves were not integrated with a pressure regulation system, they still gave significant improvements to battery operation.
The conventional system used at August-Thyssen was susceptible to
severe fouling: The liquor sprays would only keep a small part of the

108. THE COKE OVEN MANAGERS’ YEAR-BOOK gooseneck clean, leaving a build-up of tarry material deposited around the periphery of spray contact area. Furthermore, the spray nozzle which projected about 10 cm into the gooseneck, being a cold unwetted surface, allowed tarry deposits to condense upon it. As the amount of deposits grew around the nozzle, the effective cone angle of the spray was reduced more and more, leading to more deposits and hence a restriction to the gas flow from the oven. Consequently the pressures would build up in the oven, leading to increased emission problems.
Continual operator intervention was required to keep the goosenecks
clean. A difficult job in uncomfortable conditions. Without cleaning, the gooseneck would become plugged, inhibiting the operation of the Pullman valve and giving rise to significant operational problems. Frequently the deposit could not be removed in situ and it became necessary to exchange goosenecks. Fig 13 shows such a fouled gooseneck.
The new FixCup valves avoid the problems highlighted by providing a
spray system which almost completely wets the entire gooseneck and avoids regions that are not flushed. This is achieved by incorporating two, rather than one spray nozzle. Fig 14 shows the condition of a gooseneck, fitted with SelfClean sprays, which hasn’t been manually cleaned for 30 days.
The build-up of tar deposits was monitored for 6 months. Fig 15 shows
a plot summarising these results. Installation of the FixCup has reduced cleaning frequency from daily to every 10 days.
On this battery, operation of the FixCup was simple. A lever located at
the top of the oven was pulled down to close the drain hole. The seal took effect and the ascension pipe lid could be opened. The actions were reversed to put the oven back on the main.
This simple retrofit rectified the problems of blockages to the Pullman
valve mechanisms and an improved liquor spray system ensured a much reduced rate of deposition.
In 1998 Battery 3 was, as a result of old age, shut down after some 40
years of service. August-Thyssen had achieved a notable level of success with the FixCup on this 4m battery and had already started a programme to incorporate it on their 6m batteries. Fig 12a shows that a scaled-up version was first fitted to 1 oven on Battery 6a in 1996 where it has since operated as a replacement for a Pullman valve

COKE OVEN CHAMBER PRESSURE CONTROL – 109. A NEW EMISSION CONTROL SYSTEM – GIERTZ & JESSUP
1992
1993
1994
1995
1996
1997
1998
1999
2000
Cold Modelling.
5 Ovens Battery 3aPressure RegulationTest Campaigns. 2nd Spray Incorporated.
30 Ovens Battery 3aFixCups Operating asReplacement for Pullman Valves.
1 Oven Battery 6aFixCup Operating aReplacement forPullman Valve.
s
Battery 3Shutdown.
52 OvensFixCupsPROven Ins
Battery 6b Installed by Easter 1999,
talled May 1999.
Fig. 12a PROven and FixCup Development on Battery No 6
The confidence gained has resulted this year in equipping the 52 ovens of battery 6b with FixCups. The installation of the valves was completed just before Easter and August-Thyssen expects to have the complete PROven system installed by the end of May. DMT will carry out tests on the new installation as well as continuing with cold modelling at their laboratory.
Although DMT will need to perform a controlled study of gooseneck
fouling, preliminary indications are that the cleaning frequency will be further reduced, beyond the 10-day interval experienced on battery 3.
DMT will also investigate other possible benefits of the PROven
system including operation of water-sealed ascension pipe lids without water and chargehole lids without grouting.
These further tests will include studying outflow control as opposed to
controlling the supply of liquor. This change in philosophy will allow the system to run continually with the full flowrate of flushing liquor which is expected to give benefits in terms of maximum gas cooling and maximum cup cleaning.

110. THE COKE OVEN MANAGERS’ YEAR-BOOK
Fig. 13 Conventional Gooseneck Plugged by Tar

COKE OVEN CHAMBER PRESSURE CONTROL – 111. A NEW EMISSION CONTROL SYSTEM – GIERTZ & JESSUP
Fig. 14 Gooseneck Fitted with SelfClean Spra s after 30 Days y
Without Any Cleaning

112. THE COKE OVEN MANAGERS’ YEAR-BOOK
02468
101214
0 10
Time [days]
Width[cm]
20 30
Fig. 15 Growth of Tar Deposits at Gooseneck Inlet
Although no trials on batteries with double collector mains have been
proposed, they too may benefit from an automated system in which a FixCup is installed in each gooseneck. This is shown in Fig 16. At any one time during normal coking, one of the cups would remain filled with liquor
for a given duration. This would force the gas across the oven to only one of the GC mains via the FixCup, providing pressure control for that oven. After the required period the roles of the FixCups for the oven in question could then be reversed to give gas flow in the opposite direction.Fig. 16
FixCupFull
Gas Flow
FixCupRegulating
Gas Flow
FixCupFull
FixCupRegulating
Double Collector Main Operation
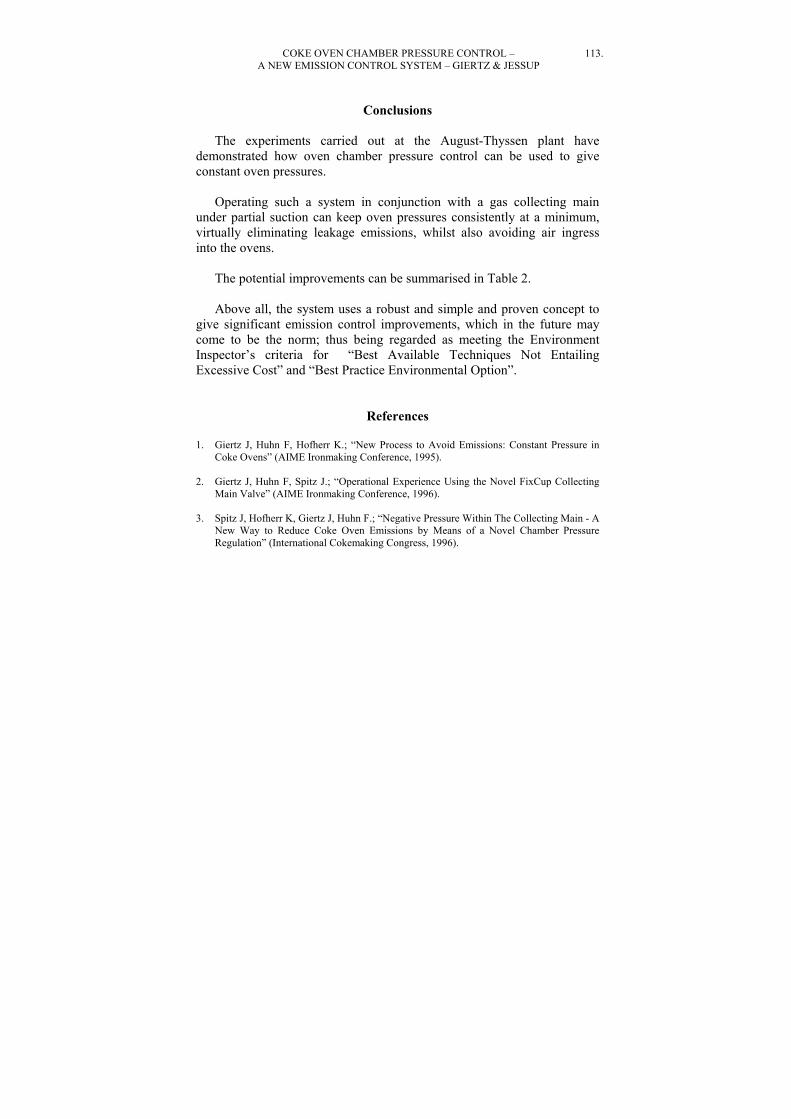
COKE OVEN CHAMBER PRESSURE CONTROL – 113. A NEW EMISSION CONTROL SYSTEM – GIERTZ & JESSUP
Conclusions The experiments carried out at the August-Thyssen plant have
demonstrated how oven chamber pressure control can be used to give constant oven pressures.
Operating such a system in conjunction with a gas collecting main
under partial suction can keep oven pressures consistently at a minimum, virtually eliminating leakage emissions, whilst also avoiding air ingress into the ovens.
The potential improvements can be summarised in Table 2. Above all, the system uses a robust and simple and proven concept to
give significant emission control improvements, which in the future may come to be the norm; thus being regarded as meeting the Environment Inspector’s criteria for “Best Available Techniques Not Entailing Excessive Cost” and “Best Practice Environmental Option”.
References
1. Giertz J, Huhn F, Hofherr K.; “New Process to Avoid Emissions: Constant Pressure in Coke Ovens” (AIME Ironmaking Conference, 1995).
2. Giertz J, Huhn F, Spitz J.; “Operational Experience Using the Novel FixCup Collecting
Main Valve” (AIME Ironmaking Conference, 1996). 3. Spitz J, Hofherr K, Giertz J, Huhn F.; “Negative Pressure Within The Collecting Main - A
New Way to Reduce Coke Oven Emissions by Means of a Novel Chamber Pressure Regulation” (International Cokemaking Congress, 1996).

Reduction of Emissions during Coking
Application of PROven® for Conventional Coking – an Alternative to Heat Recovery Coking ?
Martin Reinke, Rainer Worberg Uhde GmbH
Friedrich Uhde Strasse 15 D-44141 Dortmund, Germany
Tel: +49 231 547 2810 Fax: +49 231 547 2070
E-mail: [email protected]
Key words: Coke ovens, Emissions, Environmental, Pressure control, Gas collecting main
INTRODUCTION For the conventional coking process, typical emissions during pushing, quenching and at the chimney stack are reduced by means of well known practices such as the installation of PEC-systems, improved quench tower arrangements and low NOx combustion systems and desulfurization processes for COG and BF-gas. In some cases the strict regulations, which have been promulgated by the EPA with regard to diffuse emissions at chamber closures and during charging, may not be fulfilled. Especially with regard to diffuse emissions at doors and charging holes the Non- respectively Heat Recovery Coking System has been developed and established and at least acknowledged by the EPA as an environmentally friendly coking system. At some locations, especially in integrated iron and steel works, the compound operation between conventional by-product coking plants, blast furnaces and downstream steel production facilities provides great advantage in terms of energy savings, since the surplus gases from the BOF, BF and coking plant can be utilized in most cases without any need for further gas imports. To maintain this advantage while fulfilling the stringent environmental regulations, the application of the PROven® - System to conventional coking plants represents a serious alternative.
BASIC PROCESS PARAMETERS OF PROVEN®
To describe the PROven® process, which stands for Pressure Regulated Oven for each individual oven chamber, a comparison with the conventional coking will be made, see Figure 1. As demonstrated, one of the main differences between coking with PROven® and conventional operation is the pressure level in the collecting main, showing values of approximately +14 mm WG for the conventional system and – 30 mm WG for operation with the new system. In conventionally operated coke oven batteries, the pressure inside each oven chamber of a battery changes individually during coking. Pressure values in Figure 1 refer to measurements at the foot of the door. The pressure condition at this point is of high importance, since positive values must be maintained to the end of the coking period to avoid air ingress into the oven chambers. Air drawn into the oven chamber would otherwise result in combustion of carbonaceous material and overheating of the oven refractory. As is well known, a pressure peak occurs during and immediately after charging, as the highest amount of raw gas is generated in the early stages of the carbonization time, creating a higher potential for emissions during these periods. By applying the PROven® - system the pressure in each oven chamber, and of course also at the foot of each door, shows almost constant and always positive values at a low level throughput the entire coking period. This pressure behavior results in emission-free operation for the oven doors, charging holes and standpipes during the whole coking process.

Figure 1: Comparison of conventional raw gas system and PROven® Figure 1 provides further information, referred to as “pressure in standpipe” which relates to the function of PROven® . This value represents the set-point for the pressure control of the system. As can be seen, this set-point shows a stepwise increase during coking. The reason for this increase of set-pressure in the standpipe is a decrease of the flow resistance of the coke cake towards the end of the coking period. If the pressure at the standpipe, which represents the nearest point to the oven charge, were maintained at the low level required at the beginning of coking, a negative pressure would then result at the foot of the oven door at the end of the coking period. This would create undesired air ingress into the oven chamber. During charging the full suction in the collection main is available for emission-free operation.
DESIGN AND FUNCTION OF PROVEN® As previously mentioned, the basic principle of the PROven® system is to operate the gas collecting main under suction of approximately –30 mm WG and to install pressure controllers for each single oven. In Figures 2 to 5 the schematic arrangement and function of these pressure controllers is illustrated in their different states of operation. The PROven® arrangement mainly consists of: • The crown tube, being a pipe with calibrated slots cut into its end, fitted to the downstream end of the standpipe elbow. • The FixCup which is a conical shaped vessel with a drain hole at its bottom, being suspended inside of the gas collecting main.
The water level in the FixCup is used for partly or completely closing the slots at the end of the crown tube. • The overflow regulation device, comprising of the regulation part for the water level and the plug for the drain hole in the FixCup.
This device is actuated by a pneumatic cylinder. • The pressure controller, taking a pressure measurement in the standpipe elbow and, by a control valve, controlling the position of
the pneumatic cylinder for the actuation of the overflow regulation device. • The fast flooding pipe which supplies ammonia liquor to quickly fill the FixCup to allow the oven to be disconnected from the
gas collecting main.

Figure 2: Schematic arrangement of PROven® During charging of an oven, the overflow regulation device including the plug is lifted to its uppermost position. The FixCup is drained completely and the raw gas can flow undisturbed into the Gas collecting main. In this position the full suction of the gas collecting main is available in the standpipe elbow, providing for a perfect discharge of the large initial gas amounts during charging. Oven aspiration by high pressure water or steam injection is not required.
Figure 3: Oven connected for charging After charging the overflow regulation device is lowered, closing the drain hole of the FixCup by the plug. The ammonia liquor sprayed into the standpipe elbow is collected in the FixCup and the water level slowly rises up to the overflow level adjusted by the overflow regulation device. In this control position, the slots of the crown tube are partly immersed into the water, reducing the free space through which the raw gas can be drawn into the gas collecting main. With rising water level the free space is reduced, while by lowering the water level the free space is increased. The pressure controller constantly compares the actual pressure in the standpipe elbow with the desired set point, regulating the water level in the FixCup via the control valve, pneumatic cylinder and overflow regulation device accordingly.

Figure 4: Control position of the PROVen® system When the coal in an oven chamber is fully carbonized and there is no further raw gas produced, which is indicated by the position of the actuator for the overflow regulation device, the slots in the overflow regulation device are completely closed, effecting a further rise of the water level until the water is overflowing at the top level of the FixCup. By the rising water level, the slots in the crown tube are flooded completely, disconnecting the oven from the gas collecting main. In order to shorten the time for the disconnection of the oven, the fast flooding pipe is opened to supply ammonia liquor for filling of the FixCup in addition to the flow of liquor sprayed into the standpipe elbow. At the same time, the standpipe lid is opened automatically by a pneumatic cylinder which will then close the lid after pushing, before the next coal charge.
Figure 5: Oven disconnected from the gas collecting main
OPERATIONAL EXPERIENCE The two batteries of the new Schwelgern coking plant have been operated using the PROven® - system since commissioning in March 2003. Based on satisfactory results gained from earlier investigations and development work at an old battery of the August Thyssen coking plant, the decision was made to completely forego additional emission control devices such as U-tubes, jumper pipes, high pressure flushing liquor aspiration or steam injection for the new batteries at Schwelgern. The charging process is carried out with almost zero emissions and the battery front on PS and CS as well as all charging holes and standpipes do not show any raw gas leakage. The ability of PROven® to reduce emissions has also been proven by measurements during which PAH – concentrations have been determined. The measurements were taken on the pusher side and on the coke side of the battery, in the periods 0 to 2 hours and 2 to 5 hours after coal charging. The result, which is displayed in Figure 6, shows a reduction of the PAH-emissions of approximately 70%.
Figure 6: Measured PAH-concentrations with and without PROven® A further advantage created by the operation of the new system should be mentioned. Due to the individual control of the oven pressure, no excessive suction is created in the goosenecks and standpipes. This results in a tremendous reduction of carry over of coal during charging and therefore improves the tar quality. The raw tar from the decanters contains approximately 50% fewer particles in comparison to other plants. For safety reasons, for example in case of exhauster malfunction, the collecting main pressure is automatically adjusted to positive pressure values when actuating the bleeders at the battery.
INSTALLATION OF PROVEN® ON EXISTING BATTERIES As mentioned above, the PROven® system has been installed for testing purposes on an old battery of ThyssenKrupp Steel, a fact which proves generally that this type of retrofit is possible. Recently a contract was placed for the installation of PROven® at one coke plant in Brazil. In total three batteries with a total of 147 ovens will be equipped with PROven® in connection with the renewal of goose necks at the standpipes. The installation will be carried out oven by oven, anticipating normal positive pressure operation of the collecting mains initially. After total completion of the installation work the system will be switched over to negative pressure values in the collecting main and full PROven® system operation. In the case of retrofit installations of the system at old batteries one additional important advantage has to be mentioned. Raw gas leakage from the oven chambers into the heating flues, creating visible grey plumes at the chimney stack after charging will be minimised due to the reduced chamber pressure from the very beginning of the coking period. Apart from improved environmental aspects this operating condition will reduce the amount of damage to the refractory material.
ACCEPTANCE OF PROVEN® BY ENVIRONMENTAL AUTHORITIES In the USA, the EPA has acknowleged the PROven® System for the pad-up-rebuild of the former LTV (now Beemsterboer) 6 meter battery in South Chicago. In Germany new batteries will be granted an operating permit only if they are equipped with PROven®, and a comparable development may be expected for Europe 25.
SUMMARY AND OUTLOOK The experiences collected during the trial phase and actual operation of the PROven® system prove that the following advantages are provided by the system: • Reduction and precise, automatic control of the pressure in each single oven chamber according to the varying amounts of raw
gas evolved during the carbonization time. • Substantial reduction of emissions at all oven closures • Avoidance of the use of mini standpipes or jumper pipes during coal charging • Avoidance of high pressure water or steam injection due to the operation of the gas collecting main under pressure. • The PROven® system can also be retrofitted at existing plants, as demonstrated at an old battery of the August Thyssen coke
plant . Clearly the above-mentioned advantages are very convincing. In total six new PROven® - equipped batteries have been ordered including one in South Korea for POSCO, four in Mainland China and one in Germany. Further batteries are under negotiation including one for a German coke plant.

120. THE COKE OVEN MANAGERS’ASSOCIATION
Dr-Ing Rainer Worberg – ThyssenKrupp EnCoke GmbH, Bochum, Germany Dipl-Ing Peter Liszio – Thyssen Krupp Stahl AG, Duisburg, Germany
CONCEPT AND ERECTION OF THE SCHWELGERN COKING PLANT
By
Dr.-Ing. Rainer Worberg
& Dipl.-Ing. Peter Liszio
Presented to the Midland Section on 21 March 2002
at the Corus Conference Centre, Scunthorpe
Industrial Concept of Thyssen Krupp Stahl AG and the Coke Supply
After the merger of Thyssen Stahl AG, Duisburg, and Krupp-Hoesch Stahl AG, Dortmund, to form Thyssen Krupp Stahl AG (TKS), the industrial concept of the new company was to concentrate the hot metal production in Duisburg at the Rhine river and to shut down the blast furnaces in the Dortmund location.
According to this concept, the four blast furnaces in Duisburg will produce
approx. 11.4 million mt of hot metal per year. For this production about 3.8 million mt/a blast furnace coke is required.
As you know, apart from playing the role of reducing agent in the blast
furnace, coke has to fulfil other functions which are important for the stability of the blast furnace operation. Owing to its lump shape, it ensures a high voidage over the whole furnace height, a function which is essential for the gas permeability which influences the processes in the different zones of the blast furnace.
For dimensional reasons, the coke used in TKS’s large blast furnaces in
Schwelgern is subjected to the pressure of a burden column, which is 4 to 5m higher than in the smaller blast furnaces in Hamborn. Fig.1 illustrates the blast furnace outlines and their main dimensional differences.
If the necessary voidage is to be maintained under that enhanced pressure,
the coke has to meet higher quality standards in terms of cold and hot strength (I40 values; CSR values) and also in terms of homogeneity and size distribution.
CONCEPT AND ERECTION OF THE SCHWELGERN COKING PLANT 121. - WORBERG and LISZIO
It is known from operational experience that a 5% reduction in the CSR
value of the coke results in around 5% reduction in hot metal production in the blast furnaces. In Duisberg this would translate to a loss of around 600,000mt/a on the targeted hot metal production of 11.4 million mt/a.
Accordingly high coke quality for the big blast furnaces is very important. In the past, the coke demand at Duisberg has been satisfied by the
production from the coking plant August Thyssen with some additional quantities of coke purchased from DSK (former Ruhrkohle) coking plants.
Coke Supply from the Coking Plant August Thyssen Since 1896, blast furnace coke has been produced by the coking plant
August Thyssen in Duisburg-Bruckhausen for the nearby blast furnaces. The layout and configuration of the existing plant is more or less as it was in 1937 when the plant was conceived. In the years 1972 and 1974, the 6m-batteries VIa and VIb were put into operation.
When the battery II was rebuilt in 1983, the authorities set the permit for
coking coal throughput to 10,600 mt of coal (wet)/d which corresponds to an annual coke production of 2.5 million mt.
Since that time, six coke oven batteries with a total of 354 ovens of
different dimensions were operated at the coking plant August Thyssen. Up to 530 ovens per day were pushed by five operating teams.
From 1983 to date, there has been no major capital investment or “state of
the art developments” at the coking plant August Thyssen, although the demands placed on coke quality have been increasing at the blast furnaces 1 and 2 in Schwelgern.
Due to the high age of the coke oven batteries, the coke production has
steadily dropped to below 2 million mt/a since the beginning of the nineties. In addition emission problems became increasingly hard to manage,
especially at the batteries I, III and IV, all of which dated from the Fifties. Finally, this resulted in the shutdown of the batteries in 1998/99. The remaining part of the coking plant which was left after those shutdowns, produces 1.2 million mt of blast furnace coke per year with the battery units II

122. THE COKE OVEN MANAGERS’ASSOCIATION and VIa and VIb operated by two operating teams. On the basis of economic and environmental considerations, the management of TKS decided that the service life of the remaining coking plant would end in the year 2005.
When it came to deciding upon the future strategic coke supply for the
TKS blast furnaces, the capacity and the limited residual service life of TKS’s own coking plant gave rise to an intensive analysis of the national and the international coke markets.
National and International Coke Supply Traditionally, TKS’s remaining requirements of blast furnace coke could
be fully covered by the Ruhrkohle AG from the production of the coking plants Kaiserstuhl and Prosper. These two coking plants also supplied the blast furnaces of Hüttenwerke Krupp Mannesmann (HKM) and Stahlwerke Bremen. The coking plant Prosper whose large-capacity batteries dated from 1985 and 1989 was granted the long-term prospect of staying in operation up to 2010.
On the other hand, the coking plant Kaiserstuhl which was put into
operation in 1992 as the world’s most modern plant, promised to ensure a strategically secured coke supply. This coking plant is, however, 80 km away from the Duisburg metallurgical plants, would have to be supplied in the long run with imported coal by rail and had lost the advantages of the energy linkage with the metallurgical plant in Dortmund since the hot metal facilities had been shut down. In 2000, the coking plant Kaiserstuhl was shut down.
Against this background, it would no longer have been possible to source
TKS’s coke demand of 3.8 million mt/a from German coking plants in the long term after the shutdown of the coking plant August Thyssen. Consequently, coke would have to be sourced from the world market.
In the process of deciding upon the new construction of a coking plant,
TKS undertook a detailed evaluation of the international coke trade market. To summarise the study:
Poland
Based on TKS’s experiences from the current five-year contract with Polski Koks covering about 1 million mt of blast furnace coke per year, the qualities are sufficiently known. The cold and hot strengths required by TKS

CONCEPT AND ERECTION OF THE SCHWELGERN COKING PLANT 123. - WORBERG and LISZIO cannot be furnished from those coking plants, so that the Polish coke can be used exclusively by TKS’s smaller blast furnaces.
Japan
The Japanese supply is to a high degree dependent on the domestic
economic situation in Japan. As a consequence of the Japanese blast furnace philosophy, the quality of the freely available coke is below the quality standards fixed by TKS. From a strategic standpoint Japanese coke imports are considered as high risk.
China
The Chinese commercial coke qualities are extremely variable. Because of
the nature and location of their coal reserves, the Chinese are in a good position to produce coke in horizontal chamber ovens, coke which meets high quality standards in terms of CSR and I40. However, the coke often has high ash contents and also tends to have high water contents because of poor transport and intermediate storage facilities.
Since the Chinese intend to strengthen their position in the international
coke market, an increase of the supply quantity and quality is to be expected. On the other hand, however, the Chinese will increase their own hot metal production, thereby consuming more high quality coke. For this reason it is difficult to foresee what commercial quantities of good blast furnace coke will be available from China in the long term.
Importance of the Energy Balance within the Integrated Steelworks A very important additional factor has to be considered; the energy link
between the coke plant and the steelworks. Exclusive sourcing of coke from external suppliers would mean abandoning the energy linkage between coke production and the integrated metallurgical plant in Duisburg.
The fully integrated TKS iron and steel works in Duisburg purchases the
following energy sources from outside suppliers (Fig.2): • Coking coal for TKS’s own coking plant and coke, respectively • Injection coal • Natural gas • Electric power

124. THE COKE OVEN MANAGERS’ASSOCIATION
As all production processes are optimised, the energy required for the
operation of the production plants is utilised in the best possible way. Coking coal, injection coal and purchased coke do not only deliver the process heat for the production of coke in TKS’s own coking plant and, respectively, of hot metal and steel at the blast furnace and in the oxygen steel mill, but also other energy carriers which can be used in other production stages. Ideally, an integrated iron and steel works could almost work independently, except for the purchase of coal.
The gaseous products of coke oven gas, top gas and converter gas which
are produced in the individual process stages in the metallurgical plant are exchanged between the individual production stages and economically utilised in the best possible way. Any surplus gas from the metallurgical plant is used in TKS’s own power stations for process steam generation and for conversion into electric power.
Operation without a coking plant would mean operation without a
centralised “energy transformer” able to “transform” the low-caloric mixture of blast furnace and converter gas into a high-caloric coke oven gas, which in its turn replaces natural gas which would have to be purchased from outside suppliers.
If the coke demand of the iron and steel works were completely sourced
from outside, the natural gas purchases of TKS would double and the power purchase would increase by one fifth.
For TKS, the energy balance within the steelworks and the contribution of
the coke plant was a major issue in determining the strategy for coke production at Schwelgern.
Coking Plant Schwelgern Only by operating a company-owned coking plant with an upstream coal
blending capability and access to the low cost overseas coking coal market it is possible to influence in the long-term the coke quantity available to the blast furnace on a day to day basis.
Only the operating of a company-owned coking plant offers this possibility
– via the purchase of the required coking coals – of a strategic procurement of coke qualities for the blast furnace operation.

CONCEPT AND ERECTION OF THE SCHWELGERN COKING PLANT 125. - WORBERG and LISZIO
Only a coking plant which is linked to the iron and steel works can
ultimately safeguard the energy balance which is valuable both to the coking plant and to the iron and steel works, and thereby safeguard against changes in the energy market.
Against this background, the task was to design a new coking plant
according to the latest state of the art and, above all, to the most recent environmental regulations, which offers not only the above-mentioned strategic advantages, but also optimum profitability for the company.
The Site of the New Coking Plant In the TKS-owned Rhine port Schwelgern, a peninsular of about 30 ha
would be an appropriate site for the new coking plant. The direct position on the river permits to ship the imported coal at low cost on the Rhine from Dutch Sea ports. The proximity to the large blast furnaces Schwelgern 1 and 2 as well as to the sinter plant permit to produce hot metal in the Schwelgern works according to update standards (Fig.3).
While the coking plant August Thyssen had sourced German and
international coking coals by rail, coking coals can be transported to Schwelgern either by rail or by ship. Coke and coke breeze are transported to the blast furnaces and to the sinter plant in Schwelgern by belt conveyors; they can also be transported by rail, if required for security reasons.
At this point, the Schwelgern coking plant has considerable cost
advantages as compared with the coking plant August Thyssen where not only the coal transport, but also the coke transport was burdened by the handling costs of rail transport.
Fundamental Environmental Aspects The coke oven batteries of the coking plant August Thyssen are only about
200m away from the neighbourhood Duisburg-Bruckhausen. The increasing age of the batteries – three of the six batteries date from the Fifties – led to emission problems, which became more and more hard to manage.
An essential advantage of the new coking plant in the Schwelgern port is
the distance of 1200m to the nearest residential area. This distance will secure

126. THE COKE OVEN MANAGERS’ASSOCIATION the new coking plant against tightening emission limits for the next decades, and thus represents a considerable locational advantage.
Because of the intense ecopolitical discussion about the coking plant
August Thyssen, Thyssen Stahl AG applied for a coking coal throughput of 10,600 mtwet/d for the coking plant in Schwelgern in 1994. This throughput corresponds exactly to what was authorised in 1982 for the coking plant August Thyssen. The notice of permit effective August 16, 1999, authorises the construction of the most modern coking plant in the world, which meets all German environmental protection standards in terms of air, soil and water.
Coke Oven Design of the Coking Plant Schwelgern The design of the coke oven had to take into account that the coking coal
throughput of 10,600 mtwet/d had to be operated by only one operating team. Discussion with TKEC resulted in the consensus that this could be realised with one machine set and with 135 oven cycles per day.
On the basis of this key data, a useful oven volume of 93 m³ was
calculated, assuming a filling weight of about 79 mt per oven and an expected bulk density of 845 kgwet/m3. The chamber width was fixed to 590 mm, so as to be able to push fully carbonised coke at a medium flue temperature of 1,320 °C after 24.9 hrs. The temperature measured in the flue at the nozzle brick – especially in case of mixed gas underfiring, which is intended to be used in 95% of the annual availability, allow low NOx values in the exhaust gas.
The oven length with a taper of 50mm was fixed to 20.8m. The useful oven
length of 20m is thus 2m longer than the hitherto longest oven at the coking plant Kaiserstuhl. The useful oven height of 7,880m is 450mm higher than the hitherto highest oven at HKM’s coking plant in Huckingen. The comparison with large-compartment batteries of other companies shows that the oven dimension concept of the coking plant Schwelgern was developed very carefully (Table 1).
For lack of other criteria to evaluate the security and the stability of the
ovens, reference was made to the SUGA value. For the ovens built in the past, these values are given in Table 2. The ovens of the coking plant Schwelgern has to have the same stability as the ovens of the coking plant Kaiserstuhl. The stability is attained by the greater oven-distance from centre to centre, a greater heating wall width, a stronger binder brick and by a somewhat deeper oven

CONCEPT AND ERECTION OF THE SCHWELGERN COKING PLANT 127. - WORBERG and LISZIO roof. The gun fired regenerative double staged twin flue compound oven is at present the latest state of the art in coke oven construction (Figure 4).
Environment Protection Measures While at the coking plant August Thyssen, more than 700 coke oven doors
with a sealing length of almost 7,500m and over 1,500 charging holes had to be sealed, the Schwelgern coking plant only has 280 coke oven doors with just over 5,000m sealing length and 560 charging holes (Table 3).
The Pressure Regulated Oven System (PROven) which has been developed
at the coking plant August Thyssen and to be used at the coking plant Schwelgern has particular importance with a view to environment protection, since it facilitates a substantial reduction in battery emissions. The classic Pullman valve is replaced by the fix cup (Fig.5) developed by Deutsche Montan Technologie (DMT), Essen, in conjunction with the coking plant August Thyssen. This fix cup with an adjustable water level effectively decouples the pressure of each oven of a battery from that of the gas collecting main. In this process, the gas collecting main is operated at negative pressure so that the ovens can be charged without the necessity to use high-pressure water. This process employed at the battery VIb of the coking plant August Thyssen to large technical scale led to measurable improvements in terms of emissions (Fig.6). Visible emissions are completely avoided.
The sealing systems at the coke oven doors has been further improved. The original permit for the Schwelgern coking plant covers the operation of
two coke dry quenching plants with a throughput of 170 mt/h each, as well as of an emergency quenching tower.
Based on the good experiences gathered at HKM’s coking plant in
Huckingen where the wet quenching system of TKEC is used, the sump quenching process was further developed with the focus not only on the reduction of emissions of hydrogen sulphide and carbon monoxide, but particularly on the reduction of dusty emissions.
The further developed CSQ process (Coke Stabilisation Quenching) is the
process engineering combination of a one-point quenching car with sump and top quenching as well as an enlarged quenching tower with two built-in emission protection devices and other scrubbing stages for dust removal (Fig.7).
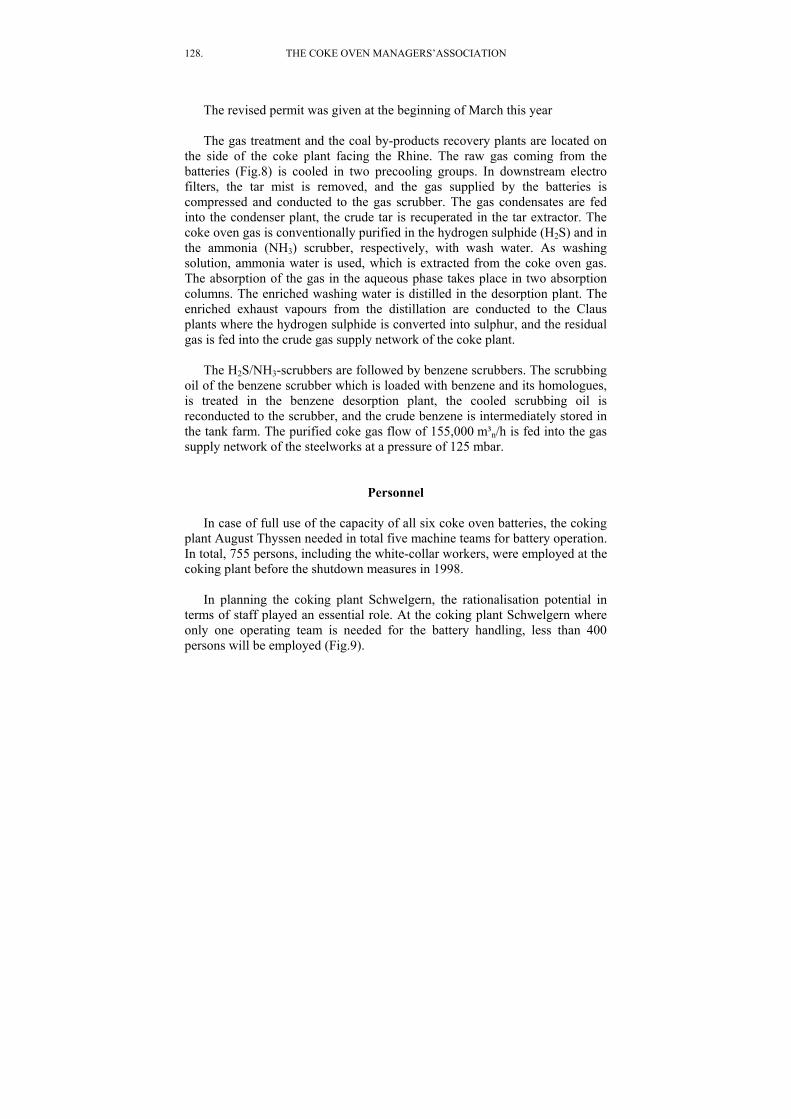
128. THE COKE OVEN MANAGERS’ASSOCIATION
The revised permit was given at the beginning of March this year The gas treatment and the coal by-products recovery plants are located on
the side of the coke plant facing the Rhine. The raw gas coming from the batteries (Fig.8) is cooled in two precooling groups. In downstream electro filters, the tar mist is removed, and the gas supplied by the batteries is compressed and conducted to the gas scrubber. The gas condensates are fed into the condenser plant, the crude tar is recuperated in the tar extractor. The coke oven gas is conventionally purified in the hydrogen sulphide (H2S) and in the ammonia (NH3) scrubber, respectively, with wash water. As washing solution, ammonia water is used, which is extracted from the coke oven gas. The absorption of the gas in the aqueous phase takes place in two absorption columns. The enriched washing water is distilled in the desorption plant. The enriched exhaust vapours from the distillation are conducted to the Claus plants where the hydrogen sulphide is converted into sulphur, and the residual gas is fed into the crude gas supply network of the coke plant.
The H2S/NH3-scrubbers are followed by benzene scrubbers. The scrubbing
oil of the benzene scrubber which is loaded with benzene and its homologues, is treated in the benzene desorption plant, the cooled scrubbing oil is reconducted to the scrubber, and the crude benzene is intermediately stored in the tank farm. The purified coke gas flow of 155,000 m³n/h is fed into the gas supply network of the steelworks at a pressure of 125 mbar.
Personnel In case of full use of the capacity of all six coke oven batteries, the coking
plant August Thyssen needed in total five machine teams for battery operation. In total, 755 persons, including the white-collar workers, were employed at the coking plant before the shutdown measures in 1998.
In planning the coking plant Schwelgern, the rationalisation potential in
terms of staff played an essential role. At the coking plant Schwelgern where only one operating team is needed for the battery handling, less than 400 persons will be employed (Fig.9).

CONCEPT AND ERECTION OF THE SCHWELGERN COKING PLANT 129. - WORBERG and LISZIO
Financing The Schwelgern coking plant comprises an operative investment volume of
about Euro 700 million. The supervisory board of ThyssenKrupp AG has decided on the grounds of strategic considerations to finance this coking plant completely “off balance sheet” within the scope of a so-called BOO-Model. This complex arrangement is described in Fig.10. The leasing subsidiaries of a consortium of banks founded a possessor company, the “Carbonaria” which leased the TKS estate in the Schwelgern port and will build the coking plant there.
Within the scope of a construction attendance contract, the building of this
plant is the duty of TKS, which works on behalf and on account of Carbonaria. The company ThyssenKrupp EnCoke provides the engineering. Procurement and installation of the plant is undertaken exclusively by TKS as the construction attendance company. Lessee and operator of this coking plant is the company “PRUNA” which will supply the TKS blast furnaces with coke within the scope of a long-term coke supply contract. The management of the coking plant is provided by Kokereibetriebsgesellschaft Schwelgern mbH (KBS) which will also be the employer of the former personnel of the coking plant August Thyssen. The shares of “PRUNA” will be held by the leasing companies, while the Kokereibetriebsgesellschaft Schwelgern mbH is a wholly owned subsidiary of TKS.
Summary Since the remaining lifetime of the coking plant August Thyssen is limited
to the year 2005 for technical reasons, TKS had to take a strategic decision as to the medium and long-term coke supply of the blast furnaces.
An extensive feasibility study revealed that the most cost effective way
forward for TKS is offered by the construction of the new coking plant Schwelgern, as compared with the procurement of coke from external sources, even though the construction of the new coking plant will involve a capital investment of Euro 700 million.
In order to underpin the hot metal production in Duisburg, the coking plant
Schwelgern will produce 2.5 million mt/a of high-quality blast furnace coke, with a maximum degree of rationalisation and a minimum technical risk.

130. THE COKE OVEN MANAGERS’ASSOCIATION
As a consequence of its geographic location and state-of-the-art environmental protection technology, the coking plant Schwelgern will facilitate the long-term production of coke on the Duisburg site.
The Project will be financed for TKS “off balance sheet” within the scope
of a complex financing model on the basis of a long-term coke supply contract and via a leasing structure, and run by a plant management company which will at the same time be the future employer for the personnel of the coking plant August Thyssen.
The construction of the coke plant started on March 30, 2000. After a
sludge pit dating back to the fifties had been removed and seven 250-kg bombs from World War II had been unearthed, the cornerstone ceremony was celebrated on July 26, 2000. Battery 2 and 1 are scheduled to be commissioned in March and June 2003 respectively.
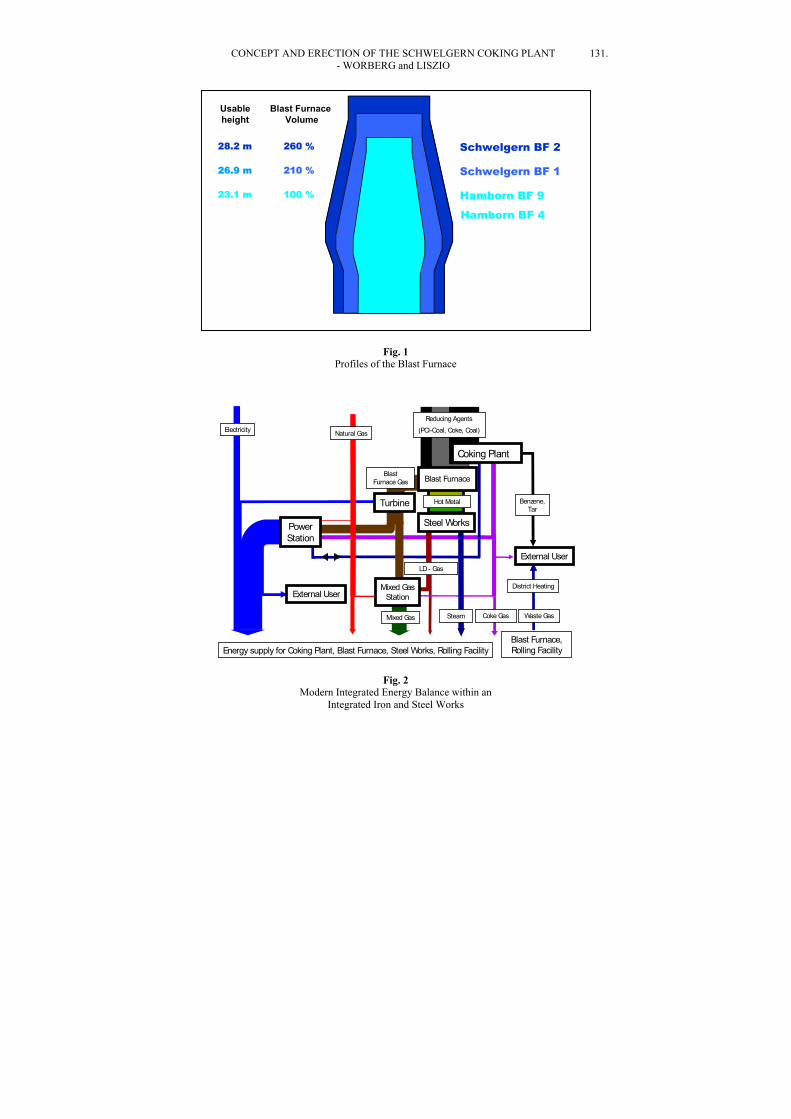
CONCEPT AND ERECTION OF THE SCHWELGERN COKING PLANT 131. - WORBERG and LISZIO
Hamborn BF 9
Schwelgern BF 1
Schwelgern BF 2
Hamborn BF 4
28.2 m
26.9 m
23.1 m
Blast Furnace Volume
100 %
210 %
260 %
Usableheight
Fig. 1 Profiles of the Blast Furnace
s
Facil
oki
nts
, Coal)
ce
Coke Gas
ng Plant
Waste Gas
Benzene,Tar
District Heating
External User
ityBlast Furnace,Rolling Facility
Turbine
Steel Work
Energy supply for Coking Plant, Blast Furnace, Steel Works, Rolling
PowerStation
C
SteamMixed Gas
BlastFurnace Gas
Mixed GasStation
Natural GasElectricity
LD - Gas
Reducing Age
(PCI-Coal, Coke
Blast Furna
Hot Metal
External User
Fig. 2
Modern Integrated Energy Balance within an Integrated Iron and Steel Works

132. THE COKE OVEN MANAGERS’ASSOCIATION
CokingPlant
Screening Unit
CokingPlant
Screening Unit
BF 1 + 2Schwelgern
BF 1 + 2Schwelgern
Fig. 3
Situation of the new Coking Plant Schwelgern
Fig. 4 Heating Unit

CONCEPT AND ERECTION OF THE SCHWELGERN COKING PLANT 133. - WORBERG and LISZIO
Fig. 5 Function Mode of the Single Chamber Pressure Control
0 %
20 %
40 %
60 %
80 %
100 %
0-2 h 2-5 h
Coking Time
BaP with PROven
PAH with PROven
Fig. 6
PAK – resp. BaP-Emissions with and without PROven
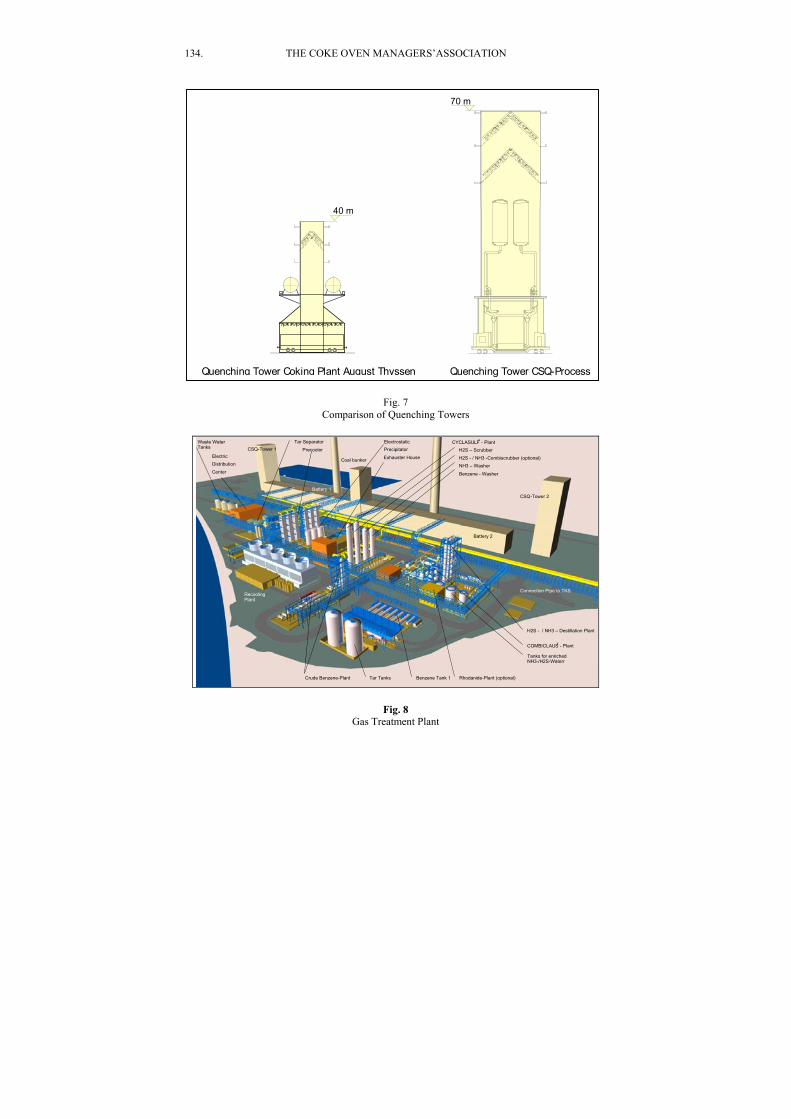
134. THE COKE OVEN MANAGERS’ASSOCIATION
70 m
Quenching Tower Coking Plant August Thyssen Quenc
40 m
hing Tower CSQ-Process
Fig. 7 Comparison of Quenching Towers
Waste Water Tar Separator Electrostatic CYCLASULF
y - Plant
Tanks
ElectricDistribution
Center
Precooler Precipitator
Exhauster HouseH2S – Scrubb
H2S - / NH3NH3 – Was
Benzene - Was
CSQ-Tower 1
Coal bunker
Batte
Battery 1
Rhodanide-PBenzene Tank 1Tar TanksCrude Benzene-Plant
RecoolingPlant
er
-Combiscrubber (optional)her
her
CSQ-Tower 2
ry 2
COMBICLAUSy - Plant
H2S - / NH3 – Destillation Plant
Tanks for enrichedNH3-/H2S-Waterr
lant (optional)
Connection Pipe to TKS
Fig. 8 Gas Treatment Plant
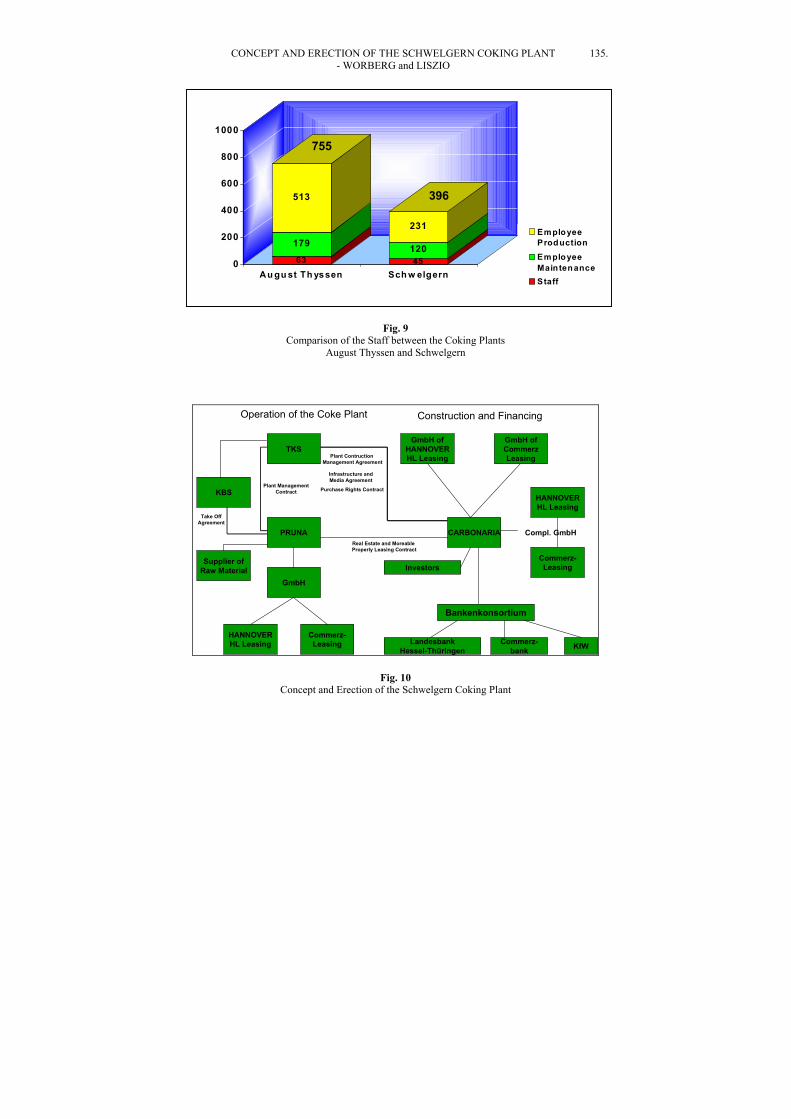
CONCEPT AND ERECTION OF THE SCHWELGERN COKING PLANT 135. - WORBERG and LISZIO
63
179
513
45120
231
0
200
400
600
800
1000
Au gu st Th yssen Sch w elgern
EmployeeProductionEmployeeMaintenanceStaff
755
396
Fig. 9 Comparison of the Staff between the Coking Plants
August Thyssen and Schwelgern
Operation of the Coke Plant Construction and Financing
TKSGmbH of
HANNOVERHL Leasing
CARBONA
Bankenkonsortium
Investors
KBS
PRUNA
GmbH
Supplier ofRaw Material
HANNOVERHL Leasing
Commerz-Leasing Landesbank
Hessel-Thüringen
Real Estate and Moreable Properly Leasing Contract
Take OffAgreement
Plant ManagementContract
Plant Contruction Management Agreement
Purchase Rights Contract
Infrastructure andMedia Agreement
Compl. GmbH
GmbH ofCommerzLeasing
RIA
HANNOVERHL Leasing
Commerz-Leasing
Commerz-bank KfW
Fig. 10
Concept and Erection of the Schwelgern Coking Plant
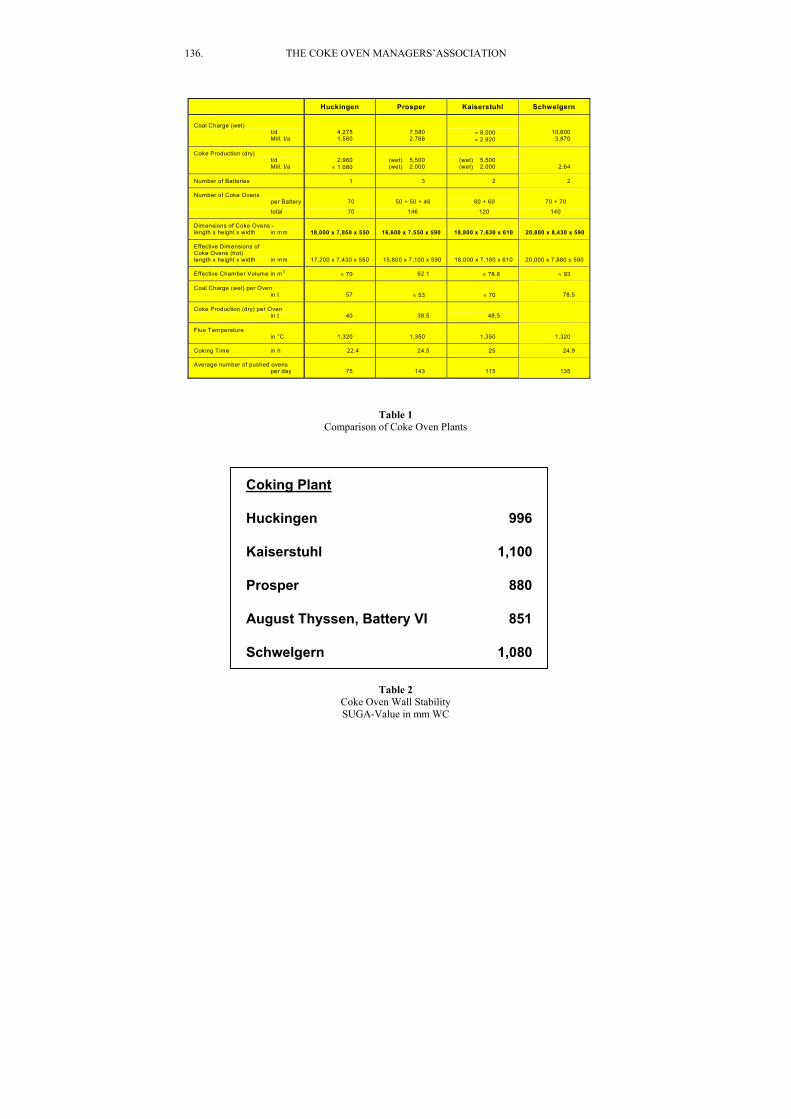
136. THE COKE OVEN MANAGERS’ASSOCIATION
Huckingen Prosper Kaiserstuhl Schwelgern
Coal Charge (wet)t/dMill. t/a
4,2751.560
7,5802.766
≈ 8,000≈ 2.920
10,6003.870
Coke Production (dry)t/dMill. t/a
2,960≈ 1.080
(wet) 5,500(wet) 2.000
(wet) 5,500(wet) 2.000
7,3402.64
Number of Batteries 1 3 2 2
Number of Coke Ovensper Battery 70 50 + 50 + 46 60 + 60 70 + 70
total 70 146 120 140
Dimensions of Coke Ovens -length x height x width in mm 18,000 x 7,850 x 550 16,600 x 7,550 x 590 18,800 x 7,630 x 610 20,800 x 8,430 x 590
Effective Dimensions ofCoke Ovens (hot)length x height x width in mm 17,200 x 7,430 x 550 15,800 x 7,100 x 590 18,000 x 7,180 x 610 20,000 x 7,880 x 590
Effective Chamber Volume in m3 ≈ 70 62.1 ≈ 78.8 ≈ 93
Coal Charge (wet) per Ovenin t 57 ≈ 53 ≈ 70 78.5
Coke Production (dry) per Ovenin t 40 38.5 48.5 ≈ 54.7
Flue Temperaturein °C 1,320 1,350 1,350 1,320
Coking Time in h 22.4 24.5 25 24.9
Average number of pushed ovensper day 75 143 115 135
Table 1 Comparison of Coke Oven Plants
Coking Plant
Huckingen
Kaiserstuhl
Prosper
August Thyssen, Battery VI
Schwelgern
996
1,100
880
851
1,080
Table 2 Coke Oven Wall Stability SUGA-Value in mm WC
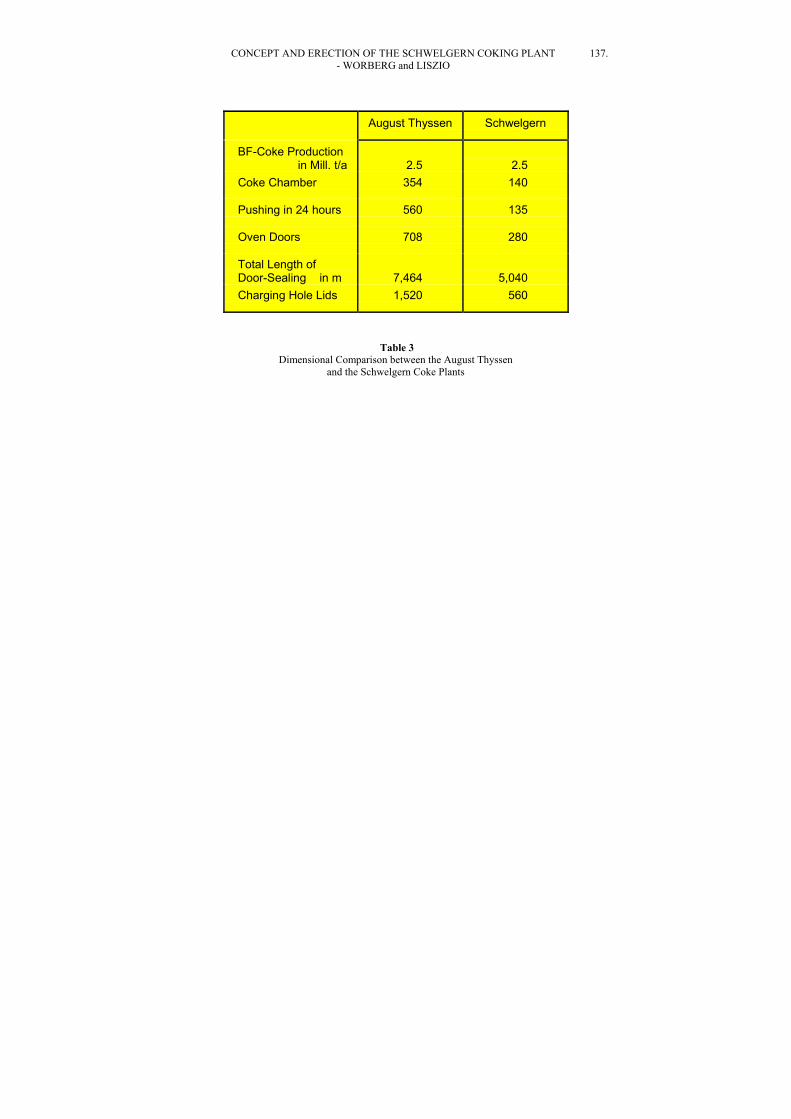
CONCEPT AND ERECTION OF THE SCHWELGERN COKING PLANT 137. - WORBERG and LISZIO
August Thyssen Schwelgern
BF-Coke Productionin Mill. t/a 2.5 2.5
Coke Chamber 354 140
Pushing in 24 hours 560 135
Oven Doors 708 280
Total Length ofDoor-Sealing in m 7,464 5,040Charging Hole Lids 1,520 560
Table 3 Dimensional Comparison between the August Thyssen
and the Schwelgern Coke Plants

January 2008 D:\final permit application 12-31-07\Permit Application
Technical Support Document Dec 31.doc
Appendix E Best Available Control Technology Backup

UNITED STATES STEEL CORPORATIONCLAIRTON WORKS - Clairton, PA
INSTALLATION PERMIT APPLICATION FOR THE PROPOSED C BATTERY REPLACEMENT PROJECT
APPENDIX E-1
COKE OVEN BATTERY EMISSIONS CONTROL TECHNOLOGY INFORMATIONSUMMARY OF DESIGN INFORMATION
Merchant Furnace Foundry Otheror Number Oven Coke Coke Coke
Mill / Integrated of Height Production Production ProductionLocation Plant Battery Ovens (m) (1,000 tons/yr) (1,000 tons/yr) (1,000 tons/yr) Notes
BYPRODUCT COKE OVEN BATTERIES
ABC Coke / Merchant 1A 78 5.0 0.0 536.0 0.0Tarrant, AL 5 25 4.0 12.0 89.0 0.0
6 29 4.0 14.0 103.0 0.0Acme Steel / Integrated 1 50 4.0 246.8 10.0 0.0 Plant shut down in 2001. Chicago, IL 2 50 4.0 246.8 10.0 0.0 Formerly Interlake, Inc.AK Steel / Integrated 3 76 4.0 355.4 0.0 0.0Ashland, KY 4 70 5.0 587.5 0.0 0.0AK Steel / Integrated 3 76 4.0 410.0 0.0 0.0Middletown, OHChicago Coke / Integrated 2 60 6.0 590.2 0.0 0.0 Permitted, but not builtChicago, IL Formerly LTV and Republic Steel.Citizens Gas / Merchant E 47 3.5 0.0 89.0 16.0Indianapolis, IN H 41 3.5 173.0 78.0 14.0
1 72 5.0 0.0 201.0 64.0EES Coke Battery, LLC / Integrated 5 85 6.0 908.7 0.0 0.0 • Formerly National Steel; the steel mill is now owned by Ecorse, MI U.S. Steel. The battery and byproducts plant, however, are
now owned and operated by Detroit Energy Services.• Battery 5 was rebuilt in 1992.
Empire Coke / Merchant 1 40 2.49 0.0 95.0 0.0 Plant was shut downHolt, AL 2 20 2.49 0.0 48.0 0.0Erie Coke / Merchant A 23 3.5 0.0 48.0 8.0Erie, PA B 35 3.5 0.0 74.0 12.0Geneva Steel / Integrated 1 63 4.0 189.4 4.4 0.0 Plant was shut down. Provo, UT 2 63 4.0 115.3 2.7 0.0 Formerly US Steel
3 63 4.0 222.3 5.2 0.04 63 4.0 173.0 4.0 0.0
Gulf States Steel / Integrated 2 65 4.0 208.4 0.0 0.0 Plant was shut down. Gadsden, AL 3 65 4.0 312.6 0.0 0.0 Formerly Republic SteelKoppers / Merchant 1B 37 4.0 237.0 0.0 0.0 Formerly Wheeling-Pittsburgh. Monessen, PA 2 19 4.0 122.0 0.0 0.0 Battery 1 was rebuilt in 1981, Battery 2 in 1979. Mittal Steel / Integrated 1 82 6.0 814.0 40.4 0.0 Formerly Bethlehem Steel. Burns Harbor, IN 2 82 6.0 858.3 42.4 0.0 Battery 1 was rebuilt in 1983.Mittal Steel / Integrated 7 76 3.5 375.8 0.0 0.0 Plant was shut down in 2001 . Lackawanna, NY 8 76 3.5 371.9 0.0 0.0 Formerly Bethlehem Steel. Battery 8 was rebuilt in 1981Mittal Steel / Integrated 4 85 4.0 543.2 0.0 0.0 Formerly Republic SteelWarren, OH
Appendix E.xlsDesign Information Page 1 of 3
1/3/20081:40 PM

UNITED STATES STEEL CORPORATIONCLAIRTON WORKS - Clairton, PA
INSTALLATION PERMIT APPLICATION FOR THE PROPOSED C BATTERY REPLACEMENT PROJECT
APPENDIX E-1
COKE OVEN BATTERY EMISSIONS CONTROL TECHNOLOGY INFORMATIONSUMMARY OF DESIGN INFORMATION
Merchant Furnace Foundry Otheror Number Oven Coke Coke Coke
Mill / Integrated of Height Production Production ProductionLocation Plant Battery Ovens (m) (1,000 tons/yr) (1,000 tons/yr) (1,000 tons/yr) Notes
BYPRODUCT COKE OVEN BATTERIES (continued)
Mountain State Carbon / Integrated 1 47 3.0 137.4 4.0 0.0 Formerly Wheeling-Pittsburgh SteelFollansbee , WV 2 47 3.0 137.4 4.0 0.0
3 51 3.0 137.4 4.0 0.08 79 6.0 837.2 24.3 0.0
New Boston Coke / Merchant 2 70 4.0 318.0 0.0 5.0 Plant was shut down in 2002 . Portsmouth, OHShenango / Merchant 1 56 4.0 354.0 0.0 0.0Pittsburgh, PASloss Industries / Merchant 3 30 3.7 127.0 0.0 34.0Birmingham, AL 4 30 3.7 127.0 0.0 0.0
5 60 3.7 15.0 131.0 0.0Tonawanda Coke / Merchant 2 60 4.0 0.0 136.0 64.0Buffalo, NYUnited States Steel / Integrated 1 64 3.6 315.0 0.0 0.0Clairton, PA 2 64 3.6 315.0 0.0 0.0
3 64 3.6 315.0 0.0 0.07 62 3.6 320.0 0.0 0.08 64 3.6 320.0 0.0 0.09 64 3.6 320.0 0.0 0.0
13 61 3.6 332.3 0.0 0.014 61 3.6 332.3 0.0 0.015 61 3.6 332.3 0.0 0.019 87 4.3 537.0 0.0 0.020 87 4.3 537.0 0.0 0.0B 75 6.1 878.3 0.0 0.0
United States Steel / Integrated 2 57 6.0 640.0 0.0 0.0Gary, IN 3 57 6.0 619.0 0.0 0.0
5 77 3.0 269.5 0.0 0.07 77 3.0 284.9 0.0 0.0
United States Steel / Integrated A 45 4.0 285.3 0.0 0.0Granite City, IL B 45 4.0 285.4 0.0 0.0
Total: 58 Byproduct Coke Oven Batteries44 are currently operating13 were shut down since February 2001
1 have been permitted but have not been built
Appendix E.xlsDesign Information Page 2 of 3
1/3/20081:40 PM

UNITED STATES STEEL CORPORATIONCLAIRTON WORKS - Clairton, PA
INSTALLATION PERMIT APPLICATION FOR THE PROPOSED C BATTERY REPLACEMENT PROJECT
APPENDIX E-1
COKE OVEN BATTERY EMISSIONS CONTROL TECHNOLOGY INFORMATIONSUMMARY OF DESIGN INFORMATION
Merchant Furnace Foundry Otheror Number Oven Coke Coke Coke
Mill / Integrated of Height Production Production ProductionLocation Plant Battery Ovens (m) (1,000 tons/yr) (1,000 tons/yr) (1,000 tons/yr) Notes
NON-RECOVERY COKE OVEN BATTERIES
Indiana Harbor Coke / Merchant A 67 2.7 325.0 0.0 0.0East Chicago, IN B 67 2.7 325.0 0.0 0.0
C 67 2.7 325.0 0.0 0.0D 67 2.7 325.0 0.0 0.0
Jewell Coal and Coke / Merchant 2D 18 2.82 90.0 0.0 0.0Vansant, VA 2E 27 2.82 135.0 0.0 0.0
3B 26 3.13 130.0 0.0 0.03C 36 3.13 180.0 0.0 0.03F 17 2.82 85.0 0.0 0.03G 18 2.82 90.0 0.0 0.0
FDS Coke Plant, LLC / Merchant A 84 10.0 0.0 720.0 0.0 Permitted, but not builtToledo, OH B 84 10.0 0.0 720.0 0.0
Total: 12 Non-Recovery Coke Oven Batteries10 are currently operating
0 were shut down since February 20012 have been permitted but have not been built
COMBINED TOTAL: 70 Coke Oven Batteries54 are currently operating13 were shut down since February 2001
3 have been permitted but have not been built
NOTES:1. This summary presents information for coke oven batteries that was listed in USEPA's Background Information document
(referred to herein as USEPA's BID) for the National Emissions Standards for Hazardous Air Pollutants (NESHAPs) for Coke Ovens: Pushing, Quenching, and Battery Stacks, published in February 2001, (supporting the standards under 40 CFR Part 63, Subpart CCCCC). The information from the USEPA's BID was supplemented by information obtained through additional research,including from USEPA's RACT/BACT/LAER Clearinghouse, permit files, and consultation with agency and industry staff.
Appendix E.xlsDesign Information Page 3 of 3
1/3/20081:40 PM

UNITED STATES STEEL CORPORATIONCLAIRTON WORKS - Clairton, PA
INSTALLATION PERMIT APPLICATION FOR THE PROPOSED C BATTERY REPLACEMENT PROJECT
APPENDIX E-2
COKE OVEN BATTERY EMISSIONS CONTROL TECHNOLOGY INFORMATIONCHARGING
Charging Emissions Control Charging ChargingEmissions Opacity
Mill / Charging Discharge Lid Limit LimitLocation Battery Type Type Lifting (lb/ton Coke) (%) Notes
BYPRODUCT COKE OVEN BATTERIES - TALL OVENS
EES Coke Battery, LLC / 5 Stage Screw feed Manual See note See note • Subject to LAER for particulate matterEcorse, MI • Charging of coal is limited on a dry tons basis
to 125,000 tons/month, 1,300,000 tons/yr• Particulate emissions from charging are limitedin combination with particulate from door leaksand quenching.• Visible emissions are not limited to a numericalvalue, but are limited to 55 seconds in anyconsecutive 5 charges
AK Steel / 4 No information No information No informationAshland, KYChicago Coke / 2 Combination Screw feed Automatic • Will employ the PROven® system to minimizeChicago, IL car fugitive emissions, including charnging emissions.
• Visible emissions are limited to 10 sec/chargeand 55 sec during 5 consecutive charges• Visible emissions from are also limited to 1.5%of the standpipe lids and 2% of the topside lids• The amount of dry coal charged to the cokeoven battery shall not exceed 2,765 tons/day(monthly average) and 900,000 tons/year
Citizens Gas / 1 No information No information No informationIndianapolis, INMittal Steel / 1 Stage Screw feed AutomaticBurns Harbor, IN 2 Stage Screw feed AutomaticABC Coke / 1A No information No information No informationTarrant, ALUnited States Steel / B Stage Gravity feed AutomaticClairton, PAUnited States Steel / 2 No information Turntable Automatic Batteries 2 and 3 employ Redler "Precarbon" Gary, IN 3 No information Turntable Automatic conveyor system, controlled with ESPs, to
control charging emissions.Mountain State Carbon / 8 Stage Screw feed AutomaticFollansbee , WV
Totals: 11 Tall Byproduct Coke Oven Batteries5 employ staged charging1 employ a different charging type5 no information was found regarding charging type5 employ screw feed1 employ gravity feed2 employ turntable feed3 no information was found regarding discharge mechanism7 employ automatic lid lifting1 employ manual lid lifting3 no information was found regarding lid lifting mechanism
Appendix E.xlsCharging Page 1 of 3
1/3/20081:42 PM
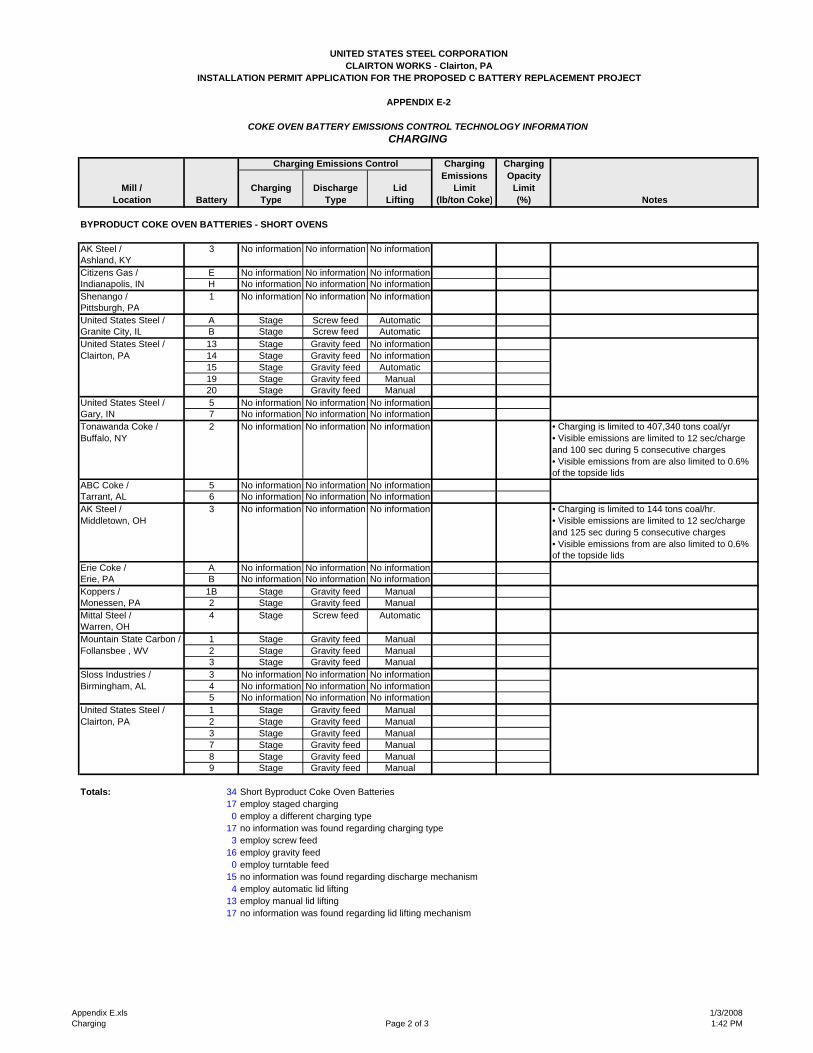
UNITED STATES STEEL CORPORATIONCLAIRTON WORKS - Clairton, PA
INSTALLATION PERMIT APPLICATION FOR THE PROPOSED C BATTERY REPLACEMENT PROJECT
APPENDIX E-2
COKE OVEN BATTERY EMISSIONS CONTROL TECHNOLOGY INFORMATIONCHARGING
Charging Emissions Control Charging ChargingEmissions Opacity
Mill / Charging Discharge Lid Limit LimitLocation Battery Type Type Lifting (lb/ton Coke) (%) Notes
BYPRODUCT COKE OVEN BATTERIES - SHORT OVENS
AK Steel / 3 No information No information No informationAshland, KYCitizens Gas / E No information No information No informationIndianapolis, IN H No information No information No informationShenango / 1 No information No information No informationPittsburgh, PAUnited States Steel / A Stage Screw feed AutomaticGranite City, IL B Stage Screw feed AutomaticUnited States Steel / 13 Stage Gravity feed No informationClairton, PA 14 Stage Gravity feed No information
15 Stage Gravity feed Automatic19 Stage Gravity feed Manual20 Stage Gravity feed Manual
United States Steel / 5 No information No information No informationGary, IN 7 No information No information No informationTonawanda Coke / 2 No information No information No information • Charging is limited to 407,340 tons coal/yrBuffalo, NY • Visible emissions are limited to 12 sec/charge
and 100 sec during 5 consecutive charges• Visible emissions from are also limited to 0.6%of the topside lids
ABC Coke / 5 No information No information No informationTarrant, AL 6 No information No information No informationAK Steel / 3 No information No information No information • Charging is limited to 144 tons coal/hr.Middletown, OH • Visible emissions are limited to 12 sec/charge
and 125 sec during 5 consecutive charges• Visible emissions from are also limited to 0.6%of the topside lids
Erie Coke / A No information No information No informationErie, PA B No information No information No informationKoppers / 1B Stage Gravity feed ManualMonessen, PA 2 Stage Gravity feed ManualMittal Steel / 4 Stage Screw feed AutomaticWarren, OHMountain State Carbon / 1 Stage Gravity feed ManualFollansbee , WV 2 Stage Gravity feed Manual
3 Stage Gravity feed ManualSloss Industries / 3 No information No information No informationBirmingham, AL 4 No information No information No information
5 No information No information No informationUnited States Steel / 1 Stage Gravity feed ManualClairton, PA 2 Stage Gravity feed Manual
3 Stage Gravity feed Manual7 Stage Gravity feed Manual8 Stage Gravity feed Manual9 Stage Gravity feed Manual
Totals: 34 Short Byproduct Coke Oven Batteries17 employ staged charging0 employ a different charging type
17 no information was found regarding charging type3 employ screw feed
16 employ gravity feed0 employ turntable feed
15 no information was found regarding discharge mechanism4 employ automatic lid lifting
13 employ manual lid lifting17 no information was found regarding lid lifting mechanism
Appendix E.xlsCharging Page 2 of 3
1/3/20081:42 PM

UNITED STATES STEEL CORPORATIONCLAIRTON WORKS - Clairton, PA
INSTALLATION PERMIT APPLICATION FOR THE PROPOSED C BATTERY REPLACEMENT PROJECT
APPENDIX E-2
COKE OVEN BATTERY EMISSIONS CONTROL TECHNOLOGY INFORMATIONCHARGING
Charging Emissions Control Charging ChargingEmissions Opacity
Mill / Charging Discharge Lid Limit LimitLocation Battery Type Type Lifting (lb/ton Coke) (%) Notes
NON-RECOVERY COKE OVEN BATTERIES
FDS Coke Plant, LLC / A Not relevant for a non-recovery coke oven battery 20%Toledo, OH B Not relevant for a non-recovery coke oven battery 20%Indiana Harbor Coke / A Not relevant for a non-recovery coke oven batteryEast Chicago, IN B Not relevant for a non-recovery coke oven battery
C Not relevant for a non-recovery coke oven batteryD Not relevant for a non-recovery coke oven battery
Jewell Coal and Coke / 2D Not relevant for a non-recovery coke oven batteryVansant, VA 2E Not relevant for a non-recovery coke oven battery
3B Not relevant for a non-recovery coke oven battery3C Not relevant for a non-recovery coke oven battery3F Not relevant for a non-recovery coke oven battery3G Not relevant for a non-recovery coke oven battery
Totals: 12 Non-Recovery Coke Oven Batteries
COMBINED TOTALS: 57 Coke Oven Batteries22 employ staged charging1 employ a different charging type
22 no information was found regarding charging type8 employ screw feed
17 employ gravity feed2 employ turntable feed
18 no information was found regarding discharge mechanism11 employ automatic lid lifting14 employ manual lid lifting20 no information was found regarding lid lifting mechanism
NOTES:1. This summary provides information for coke oven batteries that are either in operation or those for which a permit
to construct has been issued and are expected to operate in the future. As shown in Appendix E-1, there were several other coke oven batteries that were listed in USEPA's Background Information document for the National Emissions Standards for Hazardous Air Pollutants (NESHAPs) for Coke Ovens: Pushing, Quenching, and Battery Stacks, published in February 2001, (supporting the standards under 40 CFR Part 63, Subpart CCCCC) were subsequently shut down, and therefore information pertinent to those batteries is not presented here.
2. Tall ovens are defined in 40 CFR Part 63, Subpart CCCCC as those with a height of 5 meters or more.This distinction applies to byproduct coke oven batteries only.
Appendix E.xlsCharging Page 3 of 3
1/3/20081:42 PM

UNITED STATES STEEL CORPORATIONCLAIRTON WORKS - Clairton, PA
INSTALLATION PERMIT APPLICATION FOR THE PROPOSED C BATTERY REPLACEMENT PROJECT
APPENDIX E-3
COKE OVEN BATTERY EMISSIONS CONTROL TECHNOLOGY INFORMATIONPUSHING
Pushing Pushing TravelingPushing Emissions Opacity Opacity
Mill / Emissions Limit Limit LimitLocation Battery Control (lb/ton Coke) (%) (%) Notes
BYPRODUCT COKE OVEN BATTERIES - TALL OVENS
EES Coke Battery, LLC / 5 MH-DP-BH 0.02 20% in push • Subject to LAER for particulate matterEcorse, MI • The opacity limit shown is an instantaneous limit.
There is also an opacity limit of 15% applied ona six reading average basis.• The capture efficiency of the control system isestimated to be 98%. This is an estimate, not apermit requirement.
Chicago Coke / 2 MH-DP-BH 0.02 20% in push • The capture efficiency of the control system isChicago, IL estimated to be 90%.AK Steel / 4 MH-BSD-BH 0.03 20% in pushAshland, KYCitizens Gas / 1 MH-BSD-BH 0.04 20% in push Opacity limit is based on an average for the push,Indianapolis, IN not an instantaneous limit.Mittal Steel / 1 MH-BSD-WS 0.04 40% in pushBurns Harbor, IN 2 MH-BSD-BH 0.04 40% in pushUnited States Steel / B CS-BH 0.04 20% 10% Opacity limit is an instantaneous limitClairton, PAUnited States Steel / 2 ECG-SC 0.04 20% in pushGary, IN 3 ECG-SC 0.04 20% in pushABC Coke / 1A MH-BSD-BH none 40% in pushTarrant, ALMountain State Carbon / 8 MH-DP-WS No information 20% 10%Follansbee , WV
Totals: 11 Tall Byproduct Coke Oven Batteries5 employ a moveable hood, equipped with a belt-sealed duct, vented to a baghouse2 employ a moveable hood, equipped with dampered ports, vented to a baghouse0 employ a moveable hood, equipped with a belt-sealed duct, vented to wet scrubber1 employ a moveable hood, equipped with dampered ports, vented to a wet scrubber1 employ a cokeside shed, vented to a baghouse0 employ a cokeside shed, vented to a wet scrubber0 employ a cokeside shed, not vented to a control device2 employ an enclosed coke guide, coupled with a mobile scrubber car0 employ no controls
Appendix E.xlsPushing Page 1 of 4
1/3/20081:42 PM
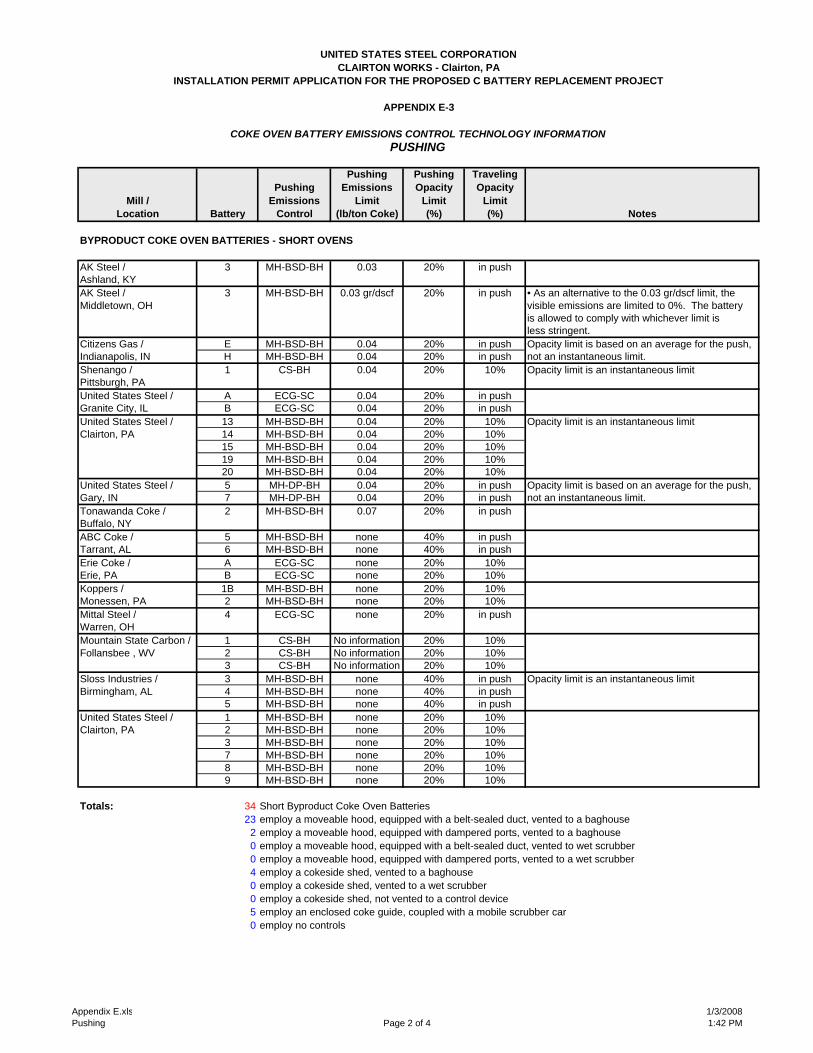
UNITED STATES STEEL CORPORATIONCLAIRTON WORKS - Clairton, PA
INSTALLATION PERMIT APPLICATION FOR THE PROPOSED C BATTERY REPLACEMENT PROJECT
APPENDIX E-3
COKE OVEN BATTERY EMISSIONS CONTROL TECHNOLOGY INFORMATIONPUSHING
Pushing Pushing TravelingPushing Emissions Opacity Opacity
Mill / Emissions Limit Limit LimitLocation Battery Control (lb/ton Coke) (%) (%) Notes
BYPRODUCT COKE OVEN BATTERIES - SHORT OVENS
AK Steel / 3 MH-BSD-BH 0.03 20% in pushAshland, KYAK Steel / 3 MH-BSD-BH 0.03 gr/dscf 20% in push • As an alternative to the 0.03 gr/dscf limit, theMiddletown, OH visible emissions are limited to 0%. The battery
is allowed to comply with whichever limit is less stringent.
Citizens Gas / E MH-BSD-BH 0.04 20% in push Opacity limit is based on an average for the push,Indianapolis, IN H MH-BSD-BH 0.04 20% in push not an instantaneous limit.Shenango / 1 CS-BH 0.04 20% 10% Opacity limit is an instantaneous limitPittsburgh, PAUnited States Steel / A ECG-SC 0.04 20% in pushGranite City, IL B ECG-SC 0.04 20% in pushUnited States Steel / 13 MH-BSD-BH 0.04 20% 10% Opacity limit is an instantaneous limitClairton, PA 14 MH-BSD-BH 0.04 20% 10%
15 MH-BSD-BH 0.04 20% 10%19 MH-BSD-BH 0.04 20% 10%20 MH-BSD-BH 0.04 20% 10%
United States Steel / 5 MH-DP-BH 0.04 20% in push Opacity limit is based on an average for the push,Gary, IN 7 MH-DP-BH 0.04 20% in push not an instantaneous limit.Tonawanda Coke / 2 MH-BSD-BH 0.07 20% in pushBuffalo, NYABC Coke / 5 MH-BSD-BH none 40% in pushTarrant, AL 6 MH-BSD-BH none 40% in pushErie Coke / A ECG-SC none 20% 10%Erie, PA B ECG-SC none 20% 10%Koppers / 1B MH-BSD-BH none 20% 10%Monessen, PA 2 MH-BSD-BH none 20% 10%Mittal Steel / 4 ECG-SC none 20% in pushWarren, OHMountain State Carbon / 1 CS-BH No information 20% 10%Follansbee , WV 2 CS-BH No information 20% 10%
3 CS-BH No information 20% 10%Sloss Industries / 3 MH-BSD-BH none 40% in push Opacity limit is an instantaneous limitBirmingham, AL 4 MH-BSD-BH none 40% in push
5 MH-BSD-BH none 40% in pushUnited States Steel / 1 MH-BSD-BH none 20% 10%Clairton, PA 2 MH-BSD-BH none 20% 10%
3 MH-BSD-BH none 20% 10%7 MH-BSD-BH none 20% 10%8 MH-BSD-BH none 20% 10%9 MH-BSD-BH none 20% 10%
Totals: 34 Short Byproduct Coke Oven Batteries23 employ a moveable hood, equipped with a belt-sealed duct, vented to a baghouse
2 employ a moveable hood, equipped with dampered ports, vented to a baghouse0 employ a moveable hood, equipped with a belt-sealed duct, vented to wet scrubber0 employ a moveable hood, equipped with dampered ports, vented to a wet scrubber4 employ a cokeside shed, vented to a baghouse0 employ a cokeside shed, vented to a wet scrubber0 employ a cokeside shed, not vented to a control device5 employ an enclosed coke guide, coupled with a mobile scrubber car0 employ no controls
Appendix E.xlsPushing Page 2 of 4
1/3/20081:42 PM
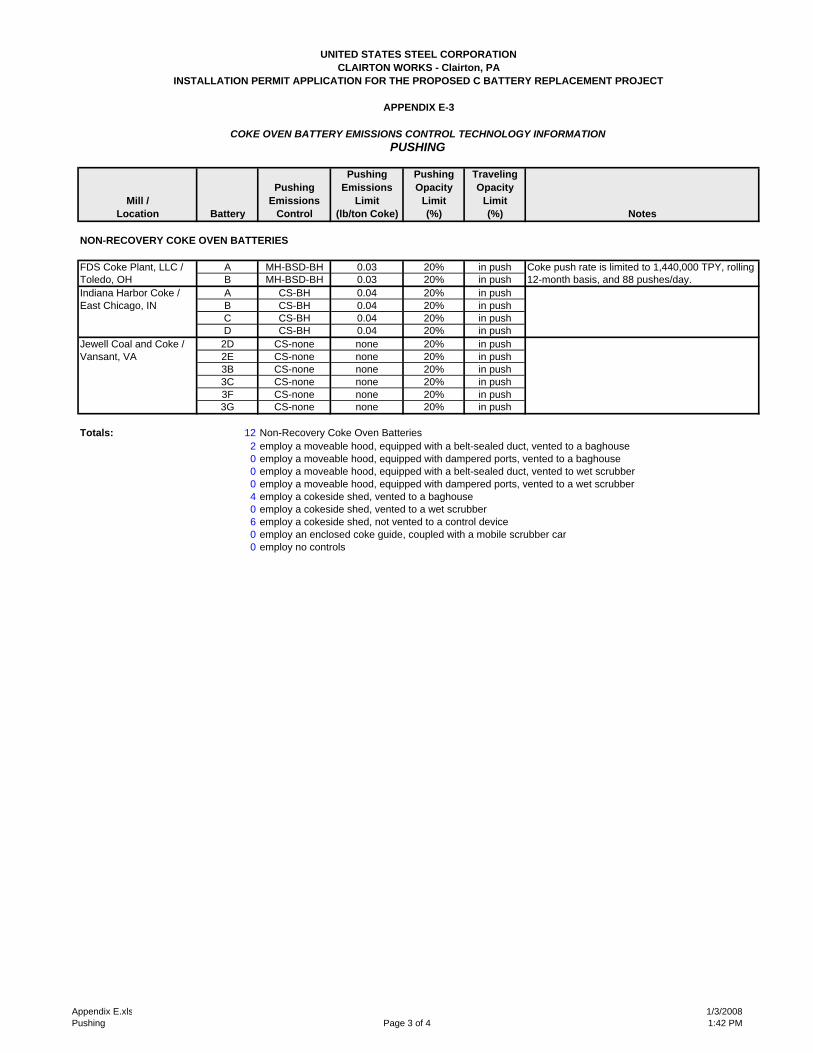
UNITED STATES STEEL CORPORATIONCLAIRTON WORKS - Clairton, PA
INSTALLATION PERMIT APPLICATION FOR THE PROPOSED C BATTERY REPLACEMENT PROJECT
APPENDIX E-3
COKE OVEN BATTERY EMISSIONS CONTROL TECHNOLOGY INFORMATIONPUSHING
Pushing Pushing TravelingPushing Emissions Opacity Opacity
Mill / Emissions Limit Limit LimitLocation Battery Control (lb/ton Coke) (%) (%) Notes
NON-RECOVERY COKE OVEN BATTERIES
FDS Coke Plant, LLC / A MH-BSD-BH 0.03 20% in push Coke push rate is limited to 1,440,000 TPY, rollingToledo, OH B MH-BSD-BH 0.03 20% in push 12-month basis, and 88 pushes/day.Indiana Harbor Coke / A CS-BH 0.04 20% in pushEast Chicago, IN B CS-BH 0.04 20% in push
C CS-BH 0.04 20% in pushD CS-BH 0.04 20% in push
Jewell Coal and Coke / 2D CS-none none 20% in pushVansant, VA 2E CS-none none 20% in push
3B CS-none none 20% in push3C CS-none none 20% in push3F CS-none none 20% in push3G CS-none none 20% in push
Totals: 12 Non-Recovery Coke Oven Batteries2 employ a moveable hood, equipped with a belt-sealed duct, vented to a baghouse0 employ a moveable hood, equipped with dampered ports, vented to a baghouse0 employ a moveable hood, equipped with a belt-sealed duct, vented to wet scrubber0 employ a moveable hood, equipped with dampered ports, vented to a wet scrubber4 employ a cokeside shed, vented to a baghouse0 employ a cokeside shed, vented to a wet scrubber6 employ a cokeside shed, not vented to a control device0 employ an enclosed coke guide, coupled with a mobile scrubber car0 employ no controls
Appendix E.xlsPushing Page 3 of 4
1/3/20081:42 PM

UNITED STATES STEEL CORPORATIONCLAIRTON WORKS - Clairton, PA
INSTALLATION PERMIT APPLICATION FOR THE PROPOSED C BATTERY REPLACEMENT PROJECT
APPENDIX E-3
COKE OVEN BATTERY EMISSIONS CONTROL TECHNOLOGY INFORMATIONPUSHING
Pushing Pushing TravelingPushing Emissions Opacity Opacity
Mill / Emissions Limit Limit LimitLocation Battery Control (lb/ton Coke) (%) (%) Notes
COMBINED TOTALS: 57 Coke Oven Batteries30 employ a moveable hood, equipped with a belt-sealed duct, vented to a baghouse
4 employ a moveable hood, equipped with dampered ports, vented to a baghouse0 employ a moveable hood, equipped with a belt-sealed duct, vented to wet scrubber1 employ a moveable hood, equipped with dampered ports, vented to a wet scrubber9 employ a cokeside shed, vented to a baghouse0 employ a cokeside shed, vented to a wet scrubber6 employ a cokeside shed, not vented to a control device7 employ an enclosed coke guide, coupled with a mobile scrubber car0 employ no controls
NOTES:1. This summary provides information for coke oven batteries that are either in operation or those for which a permit
to construct has been issued and are expected to operate in the future. As shown in Appendix E-1, there were several other coke oven batteries that were listed in USEPA's Background Information document for the National Emissions Standards for Hazardous Air Pollutants (NESHAPs) for Coke Ovens: Pushing, Quenching, and Battery Stacks, published in February 2001, (supporting the standards under 40 CFR Part 63, Subpart CCCCC) were subsequently shut down, and therefore information pertinent to those batteries is not presented here.
2. Tall ovens are defined in 40 CFR Part 63, Subpart CCCCC as those with a height of 5 meters or more.This distinction applies to byproduct coke oven batteries only.
3. Abbreviations used to describe pushing emissions capture systems are as follows:MH Moveable hoodCS Cokeside shedECG Enclosed coke guideBSD Belt-sealed ductDP Dampered ports
4. Abbreviations used to describe pushing emissions control systems are as follows:BH BaghouseWS Wet scrubberSC Scrubber car
5. For traveling emissions, the term "in push" iindicates that the traveling emissions are are limited in combination with the pushing emissions, not separately.
Appendix E.xlsPushing Page 4 of 4
1/3/20081:42 PM

CLAIRTON WORKS - Clairton, PAINSTALLATION PERMIT APPLICATION FOR THE PROPOSED C BATTERY REPLACEMENT PROJECT
APPENDIX E-4
COKE OVEN BATTERY EMISSIONS CONTROL TECHNOLOGY INFORMATIONQUENCHING
QuenchingQuenching Water TDS Baffle Baffle
Mill / Emissions Limit Cleaning InspectionLocation Control (mg/L) Schedule Schedule Notes
BYPRODUCT COKE OVEN BATTERY QUENCH TOWERS
ABC Coke / Baffles 1,100 Daily MonthlyTarrant, AL Baffles 1,100 Daily MonthlyAK Steel / Baffles 750 Daily Monthly Quenching water can not contain byproduct plant Ashland, KY effluent or process waterAK Steel / Baffles none Daily MonthlyMiddletown, OHChicago Coke / Baffles 1,100 Daily Monthly Quenching water can not contain byproduct plant Chicago, IL effluent or process waterCitizens Gas / Baffles 1,100 Daily MonthlyIndianapolis, IN Baffles 1,100 Daily MonthlyEES Coke Battery, LLC / Baffles 800 Daily Monthly • Quenching water can not contain byproduct plant Ecorse, MI effluent or process water.
• Stainless steel baffles and backwash sprays areemployed; these were installed in August 2004.• Particulate emissions from quenching are limitedin combination with particulate from door leaksand charging.
Erie Coke / Baffles 1,100 Daily MonthlyErie, PAKoppers / Baffles 1,100 Daily Monthly Quenching water can not contain byproduct plant Monessen, PA effluent or process waterMittal Steel / Baffles 1,100 Daily MonthlyBurns Harbor, IN Baffles 500Mittal Steel / Baffles 1,100 Daily MonthlyWarren, OHMountain State Carbon / Baffles 1,100 Daily MonthlyFollansbee , WV Baffles 1,100 Daily Monthly
Baffles 1,100 Daily MonthlyBaffles 1,100 Daily Monthly
Shenango / Baffles 1,100 Daily Monthly Quenching water can not contain byproduct plant Pittsburgh, PA effluent or process waterSloss Industries / Baffles 1,100 Daily MonthlyBirmingham, ALTonawanda Coke / Baffles 1,100 Daily MonthlyBuffalo, NYUnited States Steel / Baffles 1,100 Daily MonthlyClairton, PA Baffles 1,100 Daily Monthly
Baffles 1,100 Daily MonthlyBaffles 1,100 Daily MonthlyBaffles 1,100 Daily Monthly
United States Steel / Baffles 1,100 Daily MonthlyGary, IN Baffles 1,100 Daily MonthlyUnited States Steel / Baffles 1,100 Daily Monthly Quenching water can not contain byproduct plant Granite City, IL effluent or process water
Appendix E.xlsQuenching Page 1 of 2
1/3/20081:44 PM

CLAIRTON WORKS - Clairton, PAINSTALLATION PERMIT APPLICATION FOR THE PROPOSED C BATTERY REPLACEMENT PROJECT
APPENDIX E-4
COKE OVEN BATTERY EMISSIONS CONTROL TECHNOLOGY INFORMATIONQUENCHING
QuenchingQuenching Water TDS Baffle Baffle
Mill / Emissions Limit Cleaning InspectionLocation Control (mg/L) Schedule Schedule Notes
NON-RECOVERY COKE OVEN BATTERY QUENCH TOWERS
FDS Coke Plant, LLC / Baffles 1,100 Daily MonthlyToledo, OH Baffles 1,100 Daily MonthlyIndiana Harbor Coke / Baffles 1,100 Daily MonthlyEast Chicago, INJewell Coal and Coke / Baffles 1,100 Daily Monthly Quenching water can not contain byproduct plant Vansant, VA Baffles 1,100 Daily Monthly effluent or process water
COMBINED TOTALS: 33 Quench towers3 are subject to TDS limits for their quench water that are lower than the applicable NESHAPs
standard of 1,100 mg/L1 undergoes a baffle inspection daily, rather than the applicable NESHAPs requirement for
daily inspectionsNOTES:
1. This summary provides information for coke oven batteries that are either in operation or those for which a permitto construct has been issued and are expected to operate in the future. As shown in Appendix E-1, there were several other coke oven batteries that were listed in USEPA's Background Information document for the National Emissions Standards for Hazardous Air Pollutants (NESHAPs) for Coke Ovens: Pushing, Quenching, and Battery Stacks, published in February 2001, (supporting the standards under 40 CFR Part 63, Subpart CCCCC) were subsequently shut down, and therefore information pertinent to those batteries is not presented here.
Appendix E.xlsQuenching Page 2 of 2
1/3/20081:44 PM
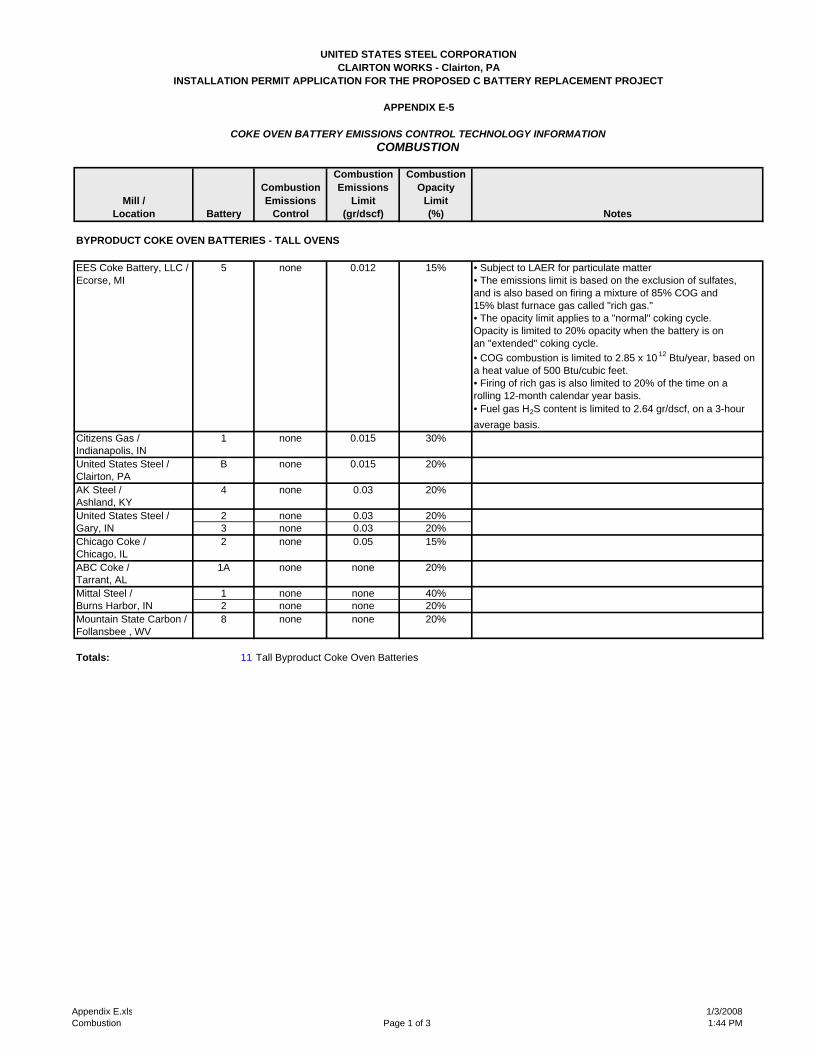
UNITED STATES STEEL CORPORATIONCLAIRTON WORKS - Clairton, PA
INSTALLATION PERMIT APPLICATION FOR THE PROPOSED C BATTERY REPLACEMENT PROJECT
APPENDIX E-5
COKE OVEN BATTERY EMISSIONS CONTROL TECHNOLOGY INFORMATIONCOMBUSTION
Combustion CombustionCombustion Emissions Opacity
Mill / Emissions Limit LimitLocation Battery Control (gr/dscf) (%) Notes
BYPRODUCT COKE OVEN BATTERIES - TALL OVENS
EES Coke Battery, LLC / 5 none 0.012 15% • Subject to LAER for particulate matterEcorse, MI • The emissions limit is based on the exclusion of sulfates,
and is also based on firing a mixture of 85% COG and 15% blast furnace gas called "rich gas."• The opacity limit applies to a "normal" coking cycle. Opacity is limited to 20% opacity when the battery is on an "extended" coking cycle.• COG combustion is limited to 2.85 x 10 12 Btu/year, based ona heat value of 500 Btu/cubic feet.• Firing of rich gas is also limited to 20% of the time on a rolling 12-month calendar year basis.• Fuel gas H2S content is limited to 2.64 gr/dscf, on a 3-hour average basis.
Citizens Gas / 1 none 0.015 30%Indianapolis, INUnited States Steel / B none 0.015 20%Clairton, PAAK Steel / 4 none 0.03 20%Ashland, KYUnited States Steel / 2 none 0.03 20%Gary, IN 3 none 0.03 20%Chicago Coke / 2 none 0.05 15%Chicago, ILABC Coke / 1A none none 20%Tarrant, ALMittal Steel / 1 none none 40%Burns Harbor, IN 2 none none 20%Mountain State Carbon / 8 none none 20%Follansbee , WV
Totals: 11 Tall Byproduct Coke Oven Batteries
Appendix E.xlsCombustion Page 1 of 3
1/3/20081:44 PM

UNITED STATES STEEL CORPORATIONCLAIRTON WORKS - Clairton, PA
INSTALLATION PERMIT APPLICATION FOR THE PROPOSED C BATTERY REPLACEMENT PROJECT
APPENDIX E-5
COKE OVEN BATTERY EMISSIONS CONTROL TECHNOLOGY INFORMATIONCOMBUSTION
Combustion CombustionCombustion Emissions Opacity
Mill / Emissions Limit LimitLocation Battery Control (gr/dscf) (%) Notes
BYPRODUCT COKE OVEN BATTERIES - SHORT OVENS
Shenango / 1 none 0.015 20%Pittsburgh, PAUnited States Steel / 13 none 0.015 20%Clairton, PA 14 none 0.015 20%
15 none 0.015 20%20 none 0.015 20%
AK Steel / 3 none 0.03 20%Ashland, KYCitizens Gas / E none 0.03 30%Indianapolis, IN H none 0.03 30%Mittal Steel / 4 none 0.03 20%Warren, OHUnited States Steel / B none 0.03 30%Granite City, ILUnited States Steel / 1 none 0.03 20%Clairton, PA 2 none 0.03 20%
3 none 0.03 20%7 none 0.03 20%8 none 0.03 20%9 none 0.03 20%
19 none 0.03 20%United States Steel / A none 0.05 30%Granite City, ILKoppers / 1B none 0.04 20%Monessen, PA 2 none 0.04 20%United States Steel / 5 none 0.05 20%Gary, IN 7 none 0.05 20%Tonawanda Coke / 2 none 0.05 20% The sulfur content of the coal is limited to 1%, by weightBuffalo, NYABC Coke / 5 none none 20%Tarrant, AL 6 none none 20%AK Steel / 3 none none 20%Middletown, OHMountain State Carbon / 1 none none 20%Follansbee , WV 2 none none 20%
3 none none 20%Sloss Industries / 3 none none 20%Birmingham, AL 4 none none 20%
5 none none 20%Erie Coke / A No information No information No informationErie, PA B No information No information No information
Totals: 34 Short Byproduct Coke Oven Batteries
Appendix E.xlsCombustion Page 2 of 3
1/3/20081:44 PM

UNITED STATES STEEL CORPORATIONCLAIRTON WORKS - Clairton, PA
INSTALLATION PERMIT APPLICATION FOR THE PROPOSED C BATTERY REPLACEMENT PROJECT
APPENDIX E-5
COKE OVEN BATTERY EMISSIONS CONTROL TECHNOLOGY INFORMATIONCOMBUSTION
Combustion CombustionCombustion Emissions Opacity
Mill / Emissions Limit LimitLocation Battery Control (gr/dscf) (%) Notes
NON-RECOVERY COKE OVEN BATTERIES
FDS Coke Plant, LLC / A FGD-DS, BH 0.008 10% • Each battery will be equipped with a dry lime spray tower,Toledo, OH SC followed by an activated carbon injection system and then
B FGD-DS, BH, 0.008 10% a baghouse.SC • In addition to the listed limit for PM, each battery willl be
subject to the following BACT limits:SO2: 0.99 lb/ton wet coal, when coal sulfur < 0.9%, by weightSO2: 1.06 lb/ton wet coal, when coal sulfur > 0.9%, by weightNOx: 1.00 lb/ton wet coalCO: 20 ppmvdVOCs: 10 ppmvd
Indiana Harbor Coke / A none 0.008 10%East Chicago, IN B none 0.008 10%
C none 0.008 10%D none 0.008 10%
Jewell Coal and Coke / 2D none none 20%Vansant, VA 2E none none 20%
3B none none 20%3C none none 20%3F none none 20%3G none none 20%
Totals: 12 Non-Recovery Coke Oven Batteries
COMBINED TOTALS: 57 Coke Oven Batteries
NOTES:1. This summary provides information for coke oven batteries that are either in operation or those for which a permit
to construct has been issued and are expected to operate in the future. As shown in Appendix E-1, there were several other coke oven batteries that were listed in USEPA's Background Information document for the National Emissions Standards for Hazardous Air Pollutants (NESHAPs) for Coke Ovens: Pushing, Quenching, and Battery Stacks, published in February 2001, (supporting the standards under 40 CFR Part 63, Subpart CCCCC) were subsequently shut down, and therefore information pertinent to those batteries is not presented here.
2. Tall ovens are defined in 40 CFR Part 63, Subpart CCCCC as those with a height of 5 meters or more.This distinction applies to byproduct coke oven batteries only.
3. Abbreviations used to describe emissions control systems are as follows:FGD-DS Flue gas desulfurization - dry scrubberBH BaghouseSC Staged combustion
Appendix E.xlsCombustion Page 3 of 3
1/3/20081:44 PM

January 2008 D:\final permit application 12-31-07\Permit Application
Technical Support Document Dec 31.doc
Appendix F Fugitive Dust Control Plan

Appendix F Fugitive Dust Control Plan
Construction
Fugitive dust and a small amount of vehicle exhaust emissions will be produced during demolition of 1 -3 Batteries and during construction of C Battery. Fugitive dust is generated from earthwork, traffic on unpaved roads, and traffic on paved roads. The primary control measure to be used to minimize emissions is watering of exposed surfaces and roads. Additional measures are available and will be employed as necessary. Following is a summary of fugitive dust controls by source.
Controls for Demolition Activities
Periodic watering by trucks commonly used at major construction sites would be the most widespread method of control. One or more trucks would be stationed near equipment being dismantled. Watering would be used to moisten areas as needed during dismantlement. Old equipment would be loaded onto trucks for removal off site to a landfill. Watering would be used during the truck loading process as well. Full trucks would be covered with secured tarps. Each truck would be spray washed prior to leaving the site.
Controls for Earthwork
Periodic watering by trucks would be the most widespread method of control. Watering would be used to moisten areas where dust has the potential to be generated by construction activities. This would be a continuous process during dry weather conditions. Furthermore, all trucks transporting loose dirt would be covered or will have the top layer adequately wetted to minimize loss.
Exposed soils such as embankments would have slope protective coverings applied as necessary to control both erosion from water and dust emissions from the wind. Other exposed soil areas could be similarly protected or kept moist during windy, dust producing conditions.
Dusts suppression measures might also be applied to soil stockpiles, including covering them with vinyl sheets, especially if the stockpile has the potential to generate windblown dust. If a soil stockpile with the potential to produce fugitive emissions is to be left in place for an extended period of time, grass or other protective vegetation could be planted to suppress dust.
The primary objective of these fugitive dust control efforts would be to prevent dust from being a nuisance to the public and nearby offsite residences. As stated above, periodic watering during construction would be the most common method of dust mitigation at the construction site. The use of additives (also known as surfactants) to the water to facilitate wetting unpaved roads and other exposed surfaces is not anticipated. In the unlikely event that it became necessary to improve the dust control measures at the construction site (due to abnormally dry and/or windy conditions), the use of additional dust control measures would be investigated. These measures might include more frequent watering and/or covering of exposed surfaces with vegetation or solid material. If necessary, the use of a state approved liquid wetting agent (dust palliative) would be considered.
Controls for Traffic on Unpaved Roads
In addition to earthwork, other activities would have associated truck traffic and some other mobile equipment. When this equipment operates on unpaved surfaces, the emissions and controls would be similar to those discussed above for earthwork activities. For additional controls, construction laydown and parking areas would be topped with an aggregate surface to help control dust and erosion and to provide a more durable road surface.

Controls for Paved Roads
The most effective method of controlling the emission of fine particulates on paved surfaces is by frequently flushing the road surface with water. A street cleaner provides an effective method of both wetting the surface and removing the dust.
January 2008 D:\final permit application 12-31-07\Permit Application
Technical Support Document Dec 31.doc
Appendix G ACHD Permits List

ACHD Permits Effective Date 7035003-010-26320 Coke Battery No. 1 5/24/1977 7035003-010-26318 Coke Battery No. 2 5/24/1977 7035003-010-26317 Coke Battery No. 3 5/24/1977 7035003-010-26312 Coke Battery No. 7 5/24/1977 7035003-010-26313 Coke Battery No. 8 5/24/1977 7035003-010-26319 Coke Battery No. 9 5/24/1977 7035003-010-26309 Coke Battery No. 13 5/24/1977 7035003-010-26307 Coke Battery No. 14 5/24/1977 7035003-010-26306 Coke Battery No. 15 5/24/1977 7035003-010-26304 Coke Battery No. 19 5/24/1977 7035003-010-53800 Coke Battery No. 20 1/26/1981 78-I-0083-P Coke Battery B and B Quench Tower 7/25/1980 91-I-0021-P Coke By-Products Recovery Plant 4/29/1991 7035003-010-00801 Boiler No. 1 11/28/1979 7035003-010-00800 Boiler No. 2 11/28/1979 7035003-010-01300 Boiler Nos. R1 and R2 5/9/1977 7035003-010-00600 Boiler Nos. T1 and T2 7/12/1977 7035003-010-25001 Coke Screening No. 1 12/14/1973 7035003-010-25002 Coke Screening No. 2 12/14/1973 0052-I003 Coke Screening No. 3 1/23/1998 0052-I006 Fan Upgrade 1-3 PEC 12/5/2001 0052-I007 Fan Upgrade 7-9 PEC 12/5/2001 0052-I008 Fan Upgrade 13-15 PEC 12/5/2001 0052-I005a Fan Upgrade 19/20 PEC 7/15/2004 0052-I002b Ammonia Flare 1/20/2005 0052-I004 Methanol/ MEA Tanks 6/5/2002 73-O-01138-P Coke Battery 1 8/10/1973 73-O-01136-P Coke Battery 2 8/10/1973 73-I-1135-P Coke Battery 3 8/10/1973 73-O-1130-P Coke Battery 7 8/10/1973 73-O-1131-P Coke Battery 8 8/10/1973 73-O-1137-P Coke Battery 9 8/10/1973 73-O-1127-P Coke Battery 13 8/10/1973 78-I-0009 Coke Batteries 13-15 rebuild 5/21/1979 73-O-1126-P Coke Battery 14 8/10/1973 73-O-1125-P Coke Battery 15 8/10/1973 93-I-0010-P Coke Battery 15 4/30/1993 73-O-1122-P Coke Battery 19 8/10/1973 73-O-1121-P Coke Battery 20 8/10/1973 77-I-0019-P Coke Battery 20 5/31/1979 87-I-0031-P PEC for 1-3 6/9/1988 87-I-0032-P PEC for 7-9 6/6/1988 88-I-0037-P PEC for 13-15 12/8/1988 87-I-0033-P PEC for 19/20 4/30/1990 78-I-0083-P Coke Battery B and Quench Tower 6/25/1981 90-I-0031-P Igniters for 1-3, 7-9, and 13-15 10/25/1990 90-I-0032-P Igniters for 19/20 10/25/1990 90-I-0033-P Igniters for B 10/25/1990
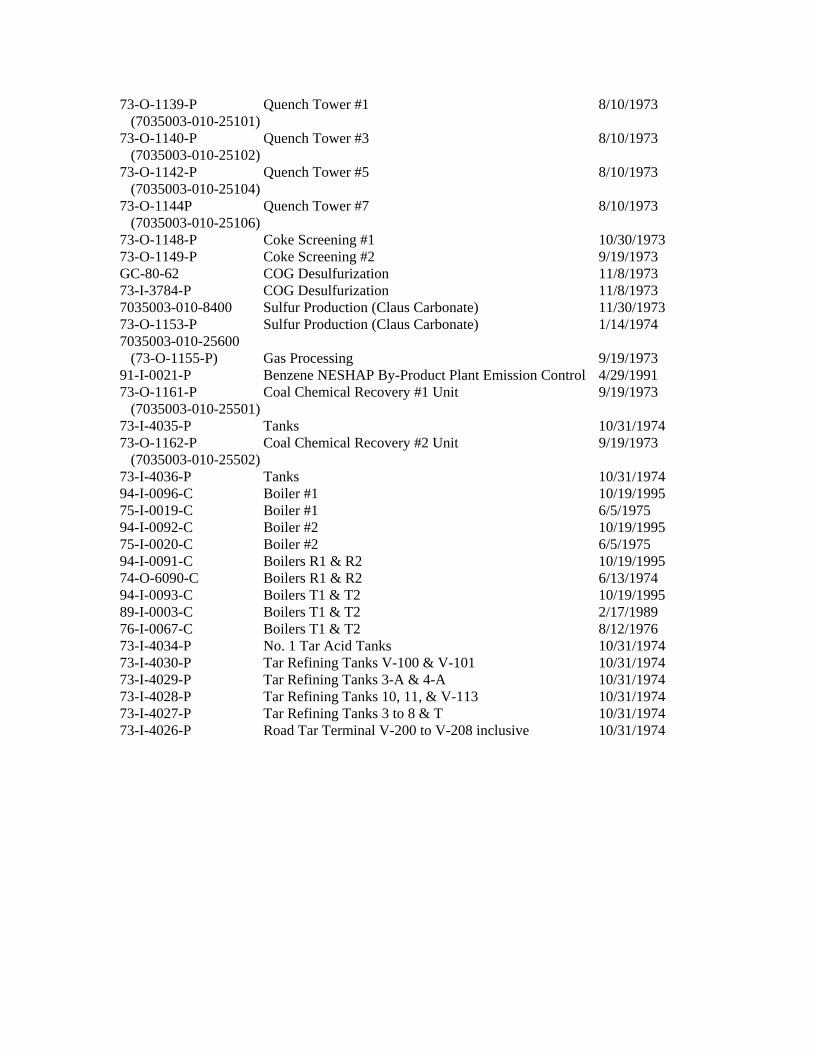
73-O-1139-P Quench Tower #1 8/10/1973 (7035003-010-25101) 73-O-1140-P Quench Tower #3 8/10/1973 (7035003-010-25102) 73-O-1142-P Quench Tower #5 8/10/1973 (7035003-010-25104) 73-O-1144P Quench Tower #7 8/10/1973 (7035003-010-25106) 73-O-1148-P Coke Screening #1 10/30/1973 73-O-1149-P Coke Screening #2 9/19/1973 GC-80-62 COG Desulfurization 11/8/1973 73-I-3784-P COG Desulfurization 11/8/1973 7035003-010-8400 Sulfur Production (Claus Carbonate) 11/30/1973 73-O-1153-P Sulfur Production (Claus Carbonate) 1/14/1974 7035003-010-25600 (73-O-1155-P) Gas Processing 9/19/1973 91-I-0021-P Benzene NESHAP By-Product Plant Emission Control 4/29/1991 73-O-1161-P Coal Chemical Recovery #1 Unit 9/19/1973 (7035003-010-25501) 73-I-4035-P Tanks 10/31/1974 73-O-1162-P Coal Chemical Recovery #2 Unit 9/19/1973 (7035003-010-25502) 73-I-4036-P Tanks 10/31/1974 94-I-0096-C Boiler #1 10/19/1995 75-I-0019-C Boiler #1 6/5/1975 94-I-0092-C Boiler #2 10/19/1995 75-I-0020-C Boiler #2 6/5/1975 94-I-0091-C Boilers R1 & R2 10/19/1995 74-O-6090-C Boilers R1 & R2 6/13/1974 94-I-0093-C Boilers T1 & T2 10/19/1995 89-I-0003-C Boilers T1 & T2 2/17/1989 76-I-0067-C Boilers T1 & T2 8/12/1976 73-I-4034-P No. 1 Tar Acid Tanks 10/31/1974 73-I-4030-P Tar Refining Tanks V-100 & V-101 10/31/1974 73-I-4029-P Tar Refining Tanks 3-A & 4-A 10/31/1974 73-I-4028-P Tar Refining Tanks 10, 11, & V-113 10/31/1974 73-I-4027-P Tar Refining Tanks 3 to 8 & T 10/31/1974 73-I-4026-P Road Tar Terminal V-200 to V-208 inclusive 10/31/1974