U.S. Size & Style Performance
11
Oct 20 Jan 21 Apr 21 Jul 21 Oct 21 80 100 Small Cap Blend (S&P 600) IJR Oct 20 Jan 21 Apr 21 Jul 21 Oct 21 200 250 Mid Cap Blend (S&P 400) IJH Oct 20 Jan 21 Apr 21 Jul 21 Oct 21 350 400 450 Large Cap Blend (S&P 500) IVV Ticker Fund TPHD Timothy Plan High Dividend Stock ETF CSML IQ Chaikin U.S. Small Cap ETF DIV Global X SuperDividend US ETF FEVR Inspire Faithward Large Cap Momentum ESG ETF RYJ Invesco Raymond James SB-1 Equity ETF AIEQ AI Powered Equity ETF MOAT VanEck Morningstar Wide Moat ETF QSY WisdomTree U.S. Quality Shareholder Yield Fund LSAF LeaderShares AlphaFactor US Core Equity ETF CDL VictoryShares US Large Cap High Dividend Volatility Wt.. 0.16% 0.15% 0.15% -0.08% -0.08% -0.09% -0.09% -0.10% -0.13% -0.18% Size & Style 1-Day Performance Leaders Ticker Fund LGH HCM Defender 500 Index ETF GVIP Goldman Sachs Hedge Industry VIP ETF MMLG First Trust Multi-Manager Large Growth ETF CSD Invesco S&P Spin-Off ETF XSMO Invesco S&P SmallCap Momentum ETF ACSI American Customer Satisfaction ETF CSF VictoryShares US Discovery Enhanced Volatility Wtd ETF XMHQ Invesco S&P MidCap Quality ETF QQXT First Trust Nasdaq-100 Ex-Technology Sector Index Fund DUSA Davis Select U.S. Equity ETF -1.19% -1.18% -1.16% -1.11% -1.09% -1.06% -1.06% -1.03% -1.01% -0.99% Size & Style 1-Day Performance Laggards Large Value (IVE) Large Cap (IVV) Large Growth (IVW) Mid Value (IJJ) Mid Cap (IJH) Mid Growth (IJK) Small Value (IJS) Small Cap (IJR) Small Growth (IJT) -0.8% -0.6% -0.4% -0.2% 0.0% -0.77% -0.75% -0.61% -0.66% -0.54% -0.49% -0.76% -0.57% -0.68% U.S. Size & Style 1-Day Performance Ticker Fund RZV Invesco S&P Smallcap 600 Pure Value ETF AVUV Avantis U.S. Small Cap Value ETF PWV Invesco Dynamic Large Cap Value ETF DEEP Roundhill Acquirers Deep Value ETF SVAL iShares US Small Cap Value Factor ETF RPV Invesco S&P 500 Pure Value ETF PEY Invesco High Yield Equity Dividend Achievers ETF XSVM Invesco S&P SmallCap Value with Momentum ETF FDM First Trust Dow Jones Select MicroCap Index Fund VFVA Vanguard U.S. Value Factor ETF 62.69 60.71 60.35 60.27 59.99 59.78 59.12 59.03 58.95 58.58 Size & Style Most Overbought Ticker Fund DFNV TrimTabs Donoghue Forlines Risk Managed Innovati.. JSML Janus Henderson Small Cap Growth Alpha ETF QGRO American Century STOXX U.S. Quality Growth ETF JSMD Janus Henderson Small/Mid Cap Growth Alpha ETF PDP Invesco DWA Momentum ETF SPGP Invesco S&P 500 GARP ETF FCTR First Trust Lunt U.S. Factor Rotation ETF NUMG Nuveen ESG Mid-Cap Growth ETF ALTL Pacer Lunt Large Cap Alternator ETF BIBL Inspire 100 ETF 38.76 38.99 39.47 40.22 40.62 40.87 41.03 41.13 41.31 41.43 Size & Style Most Oversold U.S. Size & Style Performance © ETF Action, Inc. 2021 * ETF Landscape represented using the ETF Action classification system**Leaders/Laggards/Overbought/Oversold ETFs must have $50 million to qualify Closing Price 50 Day Moving Average 200 Day Moving Average October 11, 2021
Transcript of U.S. Size & Style Performance

Oct20 Jan21 Apr21 Jul21 Oct21
80
100
SmallCapBlend(S&P600)IJR
Oct20 Jan21 Apr21 Jul21 Oct21
200
250
MidCapBlend(S&P400)IJH
Oct20 Jan21 Apr21 Jul21 Oct21
350
400
450
LargeCapBlend(S&P500)IVV
Ticker FundTPHD TimothyPlanHighDividendStockETF
CSML IQChaikinU.S.SmallCapETF
DIV GlobalXSuperDividendUSETF
FEVR InspireFaithwardLargeCapMomentumESGETF
RYJ InvescoRaymondJamesSB-1EquityETF
AIEQ AIPoweredEquityETF
MOAT VanEckMorningstarWideMoatETF
QSY WisdomTreeU.S.QualityShareholderYieldFund
LSAF LeaderSharesAlphaFactorUSCoreEquityETF
CDL VictorySharesUSLargeCapHighDividendVolatilityWt..
0.16%0.15%0.15%-0.08%-0.08%-0.09%-0.09%-0.10%-0.13%-0.18%
Size&Style1-DayPerformanceLeaders
Ticker FundLGH HCMDefender500IndexETF
GVIP GoldmanSachsHedgeIndustryVIPETF
MMLG FirstTrustMulti-ManagerLargeGrowthETF
CSD InvescoS&PSpin-OffETF
XSMO InvescoS&PSmallCapMomentumETF
ACSI AmericanCustomerSatisfactionETF
CSF VictorySharesUSDiscoveryEnhancedVolatilityWtdETF
XMHQ InvescoS&PMidCapQualityETF
QQXT FirstTrustNasdaq-100Ex-TechnologySectorIndexFund
DUSA DavisSelectU.S.EquityETF
-1.19%-1.18%-1.16%-1.11%-1.09%-1.06%-1.06%-1.03%-1.01%-0.99%
Size&Style1-DayPerformanceLaggards
LargeValue(IVE) LargeCap(IVV)LargeGrowth
(IVW)MidValue(IJJ) MidCap(IJH) MidGrowth(IJK) SmallValue(IJS) SmallCap(IJR) SmallGrowth(IJT)
-0.8%
-0.6%
-0.4%
-0.2%
0.0%
-0.77% -0.75%
-0.61%-0.66%
-0.54%-0.49%
-0.76%
-0.57%
-0.68%
U.S.Size&Style1-DayPerformance
Ticker FundRZV InvescoS&PSmallcap600PureValueETF
AVUV AvantisU.S.SmallCapValueETF
PWV InvescoDynamicLargeCapValueETF
DEEP RoundhillAcquirersDeepValueETF
SVAL iSharesUSSmallCapValueFactorETF
RPV InvescoS&P500PureValueETF
PEY InvescoHighYieldEquityDividendAchieversETF
XSVM InvescoS&PSmallCapValuewithMomentumETF
FDM FirstTrustDowJonesSelectMicroCapIndexFund
VFVA VanguardU.S.ValueFactorETF
62.6960.7160.3560.2759.9959.7859.1259.0358.9558.58
Size&StyleMostOverbought
Ticker FundDFNV TrimTabsDonoghueForlinesRiskManagedInnovati..
JSML JanusHendersonSmallCapGrowthAlphaETF
QGRO AmericanCenturySTOXXU.S.QualityGrowthETF
JSMD JanusHendersonSmall/MidCapGrowthAlphaETF
PDP InvescoDWAMomentumETF
SPGP InvescoS&P500GARPETF
FCTR FirstTrustLuntU.S.FactorRotationETF
NUMG NuveenESGMid-CapGrowthETF
ALTL PacerLuntLargeCapAlternatorETF
BIBL Inspire100ETF
38.7638.9939.4740.2240.6240.8741.0341.1341.3141.43
Size&StyleMostOversold
U.S.Size&StylePerformance
©ETFAction,Inc.2021
*ETFLandscaperepresentedusingtheETFActionclassificationsystem**Leaders/Laggards/Overbought/OversoldETFsmusthave$50milliontoqualify
ClosingPrice 50DayMovingAverage 200DayMovingAverage
October11,2021

Oct20 Jan21 Apr21 Jul21 Oct21
($5B)
$0B
$5B
$10B
Mid-Cap30-DayRollingFlows
Oct20 Jan21 Apr21 Jul21 Oct21
$0B
$10B
$20B
Small-Cap30-DayRollingFlows
Oct20 Jan21 Apr21 Jul21 Oct21
$0B
$20B
$40B
$60B
Large-Cap30-DayRollingFlows
Funds AUM 1Week 3Month 6Month 1Year
LargeCap,BetaGrowth,Beta
SmallCap,Beta,Beta:Value
LargeCap,BetaGrowth,Beta:Value
MidCap,Beta,Beta
SmallCap,Beta,Beta
MidCap,Beta,Beta:Value
MidCap,Beta,Beta:Growth
SmallCap,Beta,Beta:Growth
LargeCap,BetaGrowth,Beta:Growth $3.50B
$1.57B
($2.26B)
$4.34B
$24.28B
$8.67B
$32.32B
$9.56B
$85.09B
$8.18B
($0.24B)
($1.05B)
$1.58B
$4.87B
$2.40B
$11.96B
$0.87B
$55.09B
$4.73B
$0.17B
($0.07B)
$0.19B
$3.78B
$0.39B
$4.22B
$0.15B
$28.37B
($0.54B)
($0.09B)
$0.03B
$0.17B
$0.23B
$0.44B
$0.60B
$0.60B
$2.51B
$252B
$38B
$39B
$41B
$217B
$184B
$200B
$57B
$1,251B
10
7
6
6
12
10
11
7
24
U.S.Size&StyleLandscapeFlows
Ticker Fund 1Week 3Month 6Month 1Year AUM
QQQ InvescoQQQTrustIVV iSharesCoreS&P500ETFVOO VanguardS&P500ETFIJS iSharesS&PSmall-Cap600ValueETFVTV VanguardValueETFIWN iSharesRussell2000ValueETFVTI VanguardTotalStockMarketETFIJR iSharesCoreS&PSmallCapETFMDY SPDRS&PMidcap400ETFTrustIWD iSharesRussell1000ValueETF
$186.07B$12.06B$9.31B$4.76B$1.10B$293.27B$10.67B$2.01B($0.14B)$0.79B$252.98B$39.72B$23.44B$13.29B$0.46B
$9.18B$1.18B$0.17B$0.05B$0.31B$85.26B$15.72B$7.72B$2.55B$0.26B$16.24B$2.75B($0.44B)($0.08B)$0.25B
$268.55B$45.60B$20.80B$11.12B$0.25B$70.06B$4.51B$0.09B($0.45B)$0.21B$20.57B($0.32B)($0.79B)($0.87B)$0.21B$54.67B$5.10B$0.40B$0.32B$0.21B
U.S.Size&StyleFlowLeaders
Ticker Fund 1Week 3Month 6Month 1Year AUM
NOBL ProSharesS&P500DividendAristocratsETFSPYG SPDRPortfolioS&P500GrowthETF
IWM iSharesRussell2000ETFFDVV FidelityHighDividendETFIWF iSharesRussell1000GrowthETF
VUG VanguardGrowthETFVIG VanguardDividendAppreciationETFIJT iSharesS&PSmall-Cap600GrowthETFIWO iSharesRussell2000GrowthETF
VTHR VanguardRussell3000ETF
$8.82B$1.07B$0.58B$0.25B($0.43B)$13.35B$1.48B$2.03B$0.13B($0.37B)
$67.71B$6.46B($0.49B)$0.89B($0.23B)$0.93B$0.18B$0.09B($0.07B)($0.20B)$72.18B($2.05B)$0.16B$1.27B($0.18B)
$82.58B$3.96B$3.06B$1.27B($0.17B)$61.93B$3.80B$1.83B$1.24B($0.16B)$6.00B($0.11B)($0.41B)($0.30B)($0.05B)
$11.84B($0.21B)($0.05B)$0.20B($0.04B)$1.10B$0.17B$0.02B$0.00B($0.03B)
U.S.Size&StyleFlowLaggards
U.S.Size&StyleFlows
©ETFAction,Inc.2021
*ETFLandscaperepresentedusingtheETFActionclassificationsystem**Leaders/Laggards/Overbought/OversoldETFsmusthave$50milliontoqualify***Flowsdelayedoneday
October11,2021
Ticker FundIEO iSharesU.S.Oil&GasExploration&ProductionETF
RYE InvescoS&P500EqualWeightEnergyETF
PXE InvescoDynamicEnergyExploration&ProductionETF
FXN FirstTrustEnergyAlphaDEXFund
FTXN FirstTrustNasdaqOil&GasETF
PXI InvescoDWAEnergyMomentumETF
FCG FirstTrustNaturalGasETF
XOP SPDRS&POil&GasExploration&ProductionETF
IYE iSharesU.S.EnergyETF
XLE EnergySelectSectorSPDRFund
77.2075.4074.6174.1973.8773.8373.4373.0072.6772.40
Sector&IndustryMostOverbought
Ticker FundXME SPDRS&PMetals&MiningETF
PYZ InvescoDWABasicMaterialsMomentumETF
FXZ FirstTrustMaterialsAlphaDEXFund
AMZA InfraCapMLPETF
MLPA GlobalXMLPETF
IEZ iSharesU.S.OilEquipment&ServicesETF
IYM iSharesU.S.BasicMaterialsETF
XPH SPDRS&PPharmaceuticalsETF
MLPX GlobalXMLP&EnergyInfrastructureETF
AMLP AlerianMLPETF
1.63%0.89%0.85%0.83%0.73%0.68%0.63%0.60%0.56%0.54%
Sector&Industry1DayPerformanceLeaders
-2.0% 0.0% 2.0%
Metals&Mining(XME)
Pharmaceuticals(XPH)
Biotech(XBI)
RealEstate(XLRE)
Oil&GasEquip.&Svcs(XES)
Aerospace&Defense(XAR)
Materials(XLB)
ConsStaples(XLP)
Homebuilders(XHB)
Insurance(KIE)
Telecom(XTL)
Oil&GasExpl.&Prod(XOP)
Energy(XLE)
ConsDiscretionary(XLY)
Technology(XLK)
CapitalMkts(KCE)
S&P500(SPY)
Semiconductor(XSD)
HealthCare(XLV)
Transportation(XTN)
Industrial(XLI)
Software&Svcs(XSW)
Banks(KBE)
Financials(XLF)
RegionalBanking(KRE)
Internet(XWEB)
HealthCareEquipment(XHE)
Utilities(XLU)
HealthCareSvcs(XHS)
CommSvcs(XLC)
Retail(XRT
-1.51%
-1.47%
-1.36%
-1.25%
-1.23%
-1.16%
-1.00%
-0.91%
-0.85%
-0.80%
-0.80%
-0.78%
-0.74%
-0.72%
-1.99%
-0.55%
-0.41%
-0.37%
-0.34%
-0.33%
-0.23%
-0.22%
-0.03%
-0.68%
0.01%
0.03%
0.10%
0.13%
0.51%
0.60%
1.63%
S&PSector&Industry1DayPerformance
Ticker FundName%From52W
High%From52W
Low%Abv/Below50SMA
%Abv/Below200SMA RSI(14D)
XLE EnergySelectSectorSPDRFundXLF FinancialSelectSectorSPDRFundXLY ConsumerDiscretionarySelectSectorSPDRFundSPY SPDRS&P500ETFTrustXLP ConsumerStaplesSelectSectorSPDRFundXLI IndustrialSelectSectorSPDRFundXLK TechnologySelectSectorSPDRFundXLC CommunicationServicesSelectSectorSPDRFundXLV HealthCareSelectSectorSPDRFundXLU UtilitiesSelectSectorSPDRFundXLRE RealEstateSelectSectorSPDRFundXLB MaterialsSelectSectorSPDRFund
72.4014.47%13.79%104.15%0.00%60.149.92%2.75%65.27%0.00%51.644.73%0.44%27.74%-1.75%48.345.34%-1.18%34.09%-3.38%45.691.42%-1.84%12.51%-4.00%50.481.94%-1.39%34.83%-4.34%45.866.61%-2.03%37.07%-4.85%43.734.57%-2.40%37.86%-5.89%36.522.70%-4.38%24.87%-7.24%40.97-0.08%-3.81%10.98%-7.56%36.355.12%-4.19%31.31%-8.43%46.820.21%-2.58%31.06%-8.46%
SelectSectorSPDRsTechnicals
Ticker FundXRT SPDRS&PRetailETF
IYZ iSharesU.S.TelecommunicationsETF
XLC CommunicationServicesSelectSectorSPDRFund
XHS SPDRS&PHealthCareServicesETF
FUTY FidelityMSCIUtilitiesIndexETF
FCOM FidelityMSCICommunicationServicesIndexETF
VOX VanguardCommunicationServicesETF
XLU UtilitiesSelectSectorSPDRFund
IYG iSharesUSFinancialServicesETF
PTH InvescoDWAHealthcareMomentumETF
-1.99%-1.57%-1.51%-1.47%-1.41%-1.39%-1.36%-1.36%-1.33%-1.33%
Sector&Industry1DayPerformanceLaggards
Ticker FundIBB iSharesBiotechnologyETF
FXH FirstTrustHealthCareAlphaDEXFund
XHS SPDRS&PHealthCareServicesETF
RYH InvescoS&P500EqualWeightHealthCareETF
VHT VanguardHealthCareETF
JHMH JohnHancockMultifactorHealthcareETF
PTH InvescoDWAHealthcareMomentumETF
FHLC FidelityMSCIHealthCareIndexETF
SZNE PacerCFRA-StovallEqualWeightSeasonalRotationETF
XLRE RealEstateSelectSectorSPDRFund
29.7331.3432.5233.7434.9835.3335.3735.6135.8636.35
Sector&IndustryMostOversold
U.S.Sectors&IndustriesPerformance
©ETFAction,Inc.2021
*ETFLandscaperepresentedusingtheETFActionclassificationsystem**Leaders/Laggards/Overbought/OversoldETFsmusthave$50milliontoqualify
October11,2021

Funds AUM 1Week 3Month 6Month 1Year
CommunicationServices
ConsumerDiscretionary
ConsumerStaples
Energy
Financials
HealthCare
Industrial
Materials
Multi-Sector
RealEstate
Technology
Utilities $415M
$3,811M
$12,006M
$2,870M
$4,336M
$2,614M
$2,386M
$23,289M
$11,698M
($3,555M)
$2,824M
$2,340M
$560M
$3,747M
$6,400M
$823M
$145M
($4,151M)
$4,075M
$3,242M
$336M
$921M
($517M)
$1,943M
$756M
$3,015M
$3,839M
$471M
($2,623M)
($2,768M)
$1,032M
$1,564M
$63M
$538M
($563M)
$1,549M
$97M
$925M
($316M)
($56M)
($468M)
($461M)
($746M)
$524M
($831M)
($209M)
$382M
($53M)
$20B
$139B
$73B
$24B
$15B
$34B
$85B
$82B
$55B
$20B
$33B
$21B
10
24
21
16
10
14
25
28
34
12
13
9
U.S.SectorLandscape
-400M -200M 0M 200M 400M
1Week(CustomSQLQuery22)
Retail
Semiconductors
NaturalGas
HealthCareEquipment&Supplies
Transportation
MLPs(C-Corp)
Banks:Regional
Insurance
HealthCareProviders&Services
Leisure&Recreation
Oil&GasEquipment&Services
MLPs(Note)
Midstream
BDCs
Infrastructure
Food&Beverage
Construction&Engineering
Pharmaceuticals
MortgageREITs
Media&Entertainment
Metals&Mining
Aerospace&Defense
Banks
Homebuilding
Biotech
Oil&GasExploration&Production
Software ($269M)
($227M)
($151M)
($51M)
($42M)
($25M)
($19M)
$266M
($3M)
($2M)
($1M)
($1M)
$57M
$53M
$50M
$44M
$27M
$10M
$19M
$73M
$1M
$3M
$5M
$5M
$5M
$9M
$9M
U.S.Sector&Industry1-WeekFlows
Ticker Fund 1Week 3Month 6Month 1Year AUMVGT VanguardInformationTechnologyETFXLF FinancialSelectSectorSPDRFundXLK TechnologySelectSectorSPDRFundXRT SPDRS&PRetailETFXLY ConsumerDiscretionarySelectSectorSPDRFu..XLU UtilitiesSelectSectorSPDRFundVFH VanguardFinancialsETFSOXX iSharesSemiconductorETFFCG FirstTrustNaturalGasETFIHI iSharesU.S.MedicalDevicesETF
$49,777M$2,097M$2,346M$804M$805M$43,105M$12,005M($47M)$631M$387M$44,237M($69M)$274M$605M$349M
$972M$290M$350M($6M)$266M$20,187M$130M($975M)($483M)$117M$12,224M$7M$197M$503M$82M$11,367M$1,780M$455M($178M)$71M$7,189M$1,853M$227M$489M$67M$496M$260M$226M$155M$57M
$8,419M($1,558M)($757M)$419M$53M
U.S.Sector&IndustryFlowLeaders
Ticker Fund 1Week 3Month 6Month 1Year AUMXLE EnergySelectSectorSPDRFundXLV HealthCareSelectSectorSPDRFundXLI IndustrialSelectSectorSPDRFundXLB MaterialsSelectSectorSPDRFundIGV iSharesExpandedTech-SoftwareSectorETFVNQ VanguardRealEstateETFXOP SPDRS&POil&GasExploration&ProductionE..XLP ConsumerStaplesSelectSectorSPDRFundIBB iSharesBiotechnologyETFXLRE RealEstateSelectSectorSPDRFund
$27,074M$8,302M$1,048M$848M($790M)$29,626M$1,592M$3,006M($122M)($569M)$17,381M$469M($3,200M)($1,882M)($477M)$7,222M$1,730M($423M)($1,757M)($354M)$5,377M($1,293M)($276M)$70M($261M)
$42,407M$5,353M$2,287M$245M($236M)$4,202M$77M($483M)($93M)($235M)
$11,645M($2,944M)$744M$318M($219M)$10,088M($383M)$22M($136M)($124M)$4,198M$1,349M$1,335M$640M($101M)
U.S.Sector&IndustryFlowLaggards
U.S.SectorLandscape
©ETFAction,Inc.2021
*ETFLandscaperepresentedusingtheETFActionclassificationsystem**Leaders/Laggards/Overbought/OversoldETFsmusthave$50milliontoqualify***Flowsdelayedoneday
October11,2021
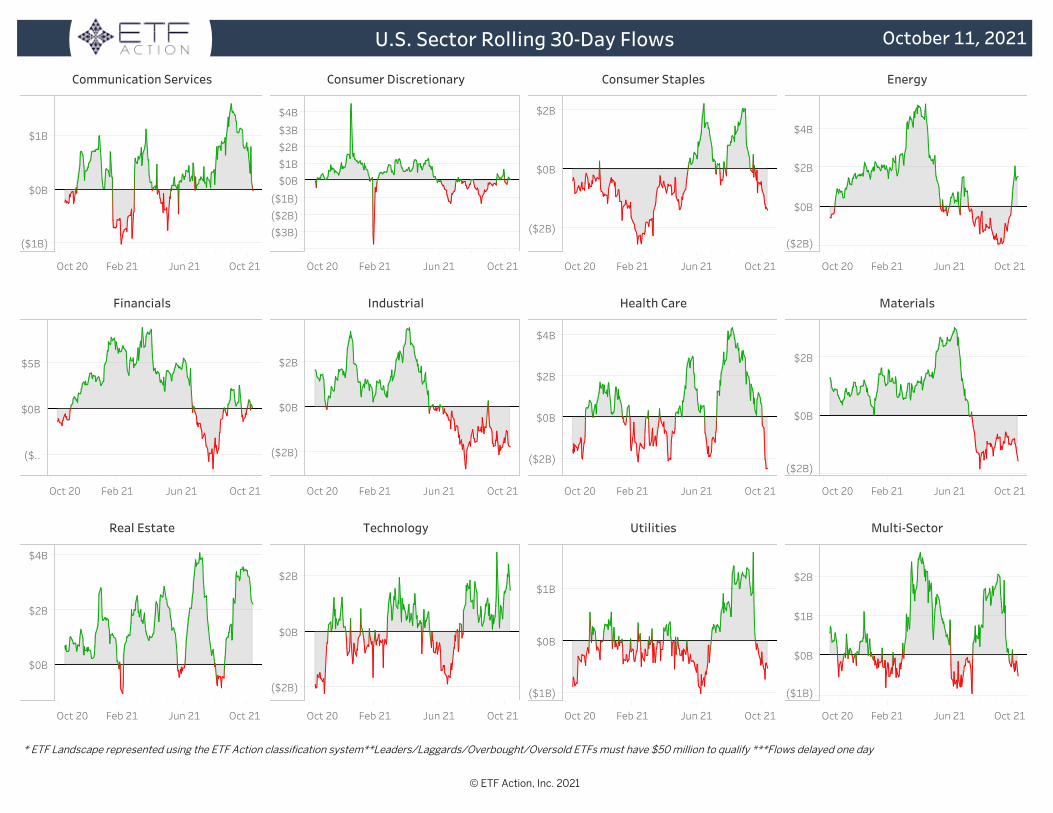
Oct20 Feb21 Jun21 Oct21
($1B)
$0B
$1B
CommunicationServices
Oct20 Feb21 Jun21 Oct21
($2B)
$0B
$2B
ConsumerStaples
Oct20 Feb21 Jun21 Oct21
($2B)
$0B
$2B
$4B
Energy
Oct20 Feb21 Jun21 Oct21
($3B)($2B)($1B)
$0B$1B$2B$3B
$4B
ConsumerDiscretionary
Oct20 Feb21 Jun21 Oct21
($2B)
$0B
$2B
$4B
HealthCare
Oct20 Feb21 Jun21 Oct21
($2B)
$0B
$2B
Industrial
Oct20 Feb21 Jun21 Oct21
($2B)
$0B
$2B
Materials
Oct20 Feb21 Jun21 Oct21
($2B)
$0B
$2B
Technology
Oct20 Feb21 Jun21 Oct21
($1B)
$0B
$1B
Utilities
Oct20 Feb21 Jun21 Oct21
$0B
$2B
$4B
RealEstate
Oct20 Feb21 Jun21 Oct21
($..
$0B
$5B
Financials
Oct20 Feb21 Jun21 Oct21
($1B)
$0B
$1B
$2B
Multi-Sector
U.S.SectorRolling30-DayFlows
©ETFAction,Inc.2021
*ETFLandscaperepresentedusingtheETFActionclassificationsystem**Leaders/Laggards/Overbought/OversoldETFsmusthave$50milliontoqualify***Flowsdelayedoneday
October11,2021

-5.00% 0.00% 5.00%
CleanEnergy:Solar(TAN)
AdvancedMaterials(REMX)
Blockchain(BLOK)
CleanEnergy(PBW)
Biotech..
NextGenTransportation(DRI..
CloudComputing(SKYY)
Multi-Theme(ARKK)
DisruptiveTech(ARKW)
eSports&VideoGames(ESPO
BigData(AIQ)
Robotics&AI(ROBO)
DigitalInfrastructure(SRVR)
Genomics(ARKG)
SmartInfrastructure(GRID)
CyberSecurity(HACK)
Connectivity(FIVG)
Space(UFO)
3DPrinting(PRNT)
IndustrialRevolution(ARKQ)
Water(PHO)
EvolvingConsumer(SOCL)
CleanEnergy:Wind(FAN)
Casinos&Gaming(BETZ)
FinTech(FINX)
Cannabis(MJ)
OnlineRetail(IBUY)
DigitalPayments(IPAY)
-1.83%
-1.54%
-1.44%
-1.27%
-1.14%
-1.09%
-1.06%
-0.91%
-0.82%
-0.77%
-0.74%
-0.72%
-0.68%
-2.92%
-0.60%
-0.60%
-0.46%
-0.43%
-0.37%
-0.33%
-0.20%
-0.68%
0.07%
0.53%
1.49%
1.49%
2.62%
3.64%
GlobalThematicSegment1-DayPerformance
Ticker FundAWAY ETFMGTravelTechETF
KWEB KraneSharesCSIChinaInternetETF
EVX VanEckEnvironmentalServicesETF
BLOK AmplifyTransformationalDataSharingETF
LEGR FirstTrustIndxxInnovativeTransaction&ProcessETF
BITQ BitwiseCryptoIndustryInnovatorsETF
EMQQ EmergingMarketsInternet&EcommerceETF
DAPP VanEckDigitalTransformationETF
UFO ProcureSpaceETF
BLCN SirenETFTrustSirenNasdaqNexGenEconomyETF
59.7055.2354.2454.0352.6152.5752.0751.6350.1850.08
ThematicMostOverbought
Ticker FundSRVR PacerBenchmarkData&InfrastructureRealEstateSCTR..
IDNA iSharesGenomicsImmunologyandHealthcareETFGeno..
PIO InvescoGlobalWaterETF
VPN GlobalXDataCenterREITs&DigitalInfrastructureETF
FAN FirstTrustGlobalWindEnergyETF
AGNG GlobalXAgingPopulationETF
ARKG ARKGenomicRevolutionETF
PBD InvescoGlobalCleanEnergyETF
GERM ETFMGTreatmentsTestingandAdvancementsETF
HTEC ROBOGlobalHealthcareTechnologyandInnovationETF
29.8329.9130.1030.9231.0332.5532.6332.6932.6933.07
ThematicMostOversold
Ticker FundTAN InvescoSolarETF
BKCH GlobalXBlockchainETF
REMX VanEckRareEarth/StrategicMetalsETF
BITQ BitwiseCryptoIndustryInnovatorsETF
CTEC GlobalXCleanTechETF
CNRG SPDRS&PKenshoCleanPowerETF
DAPP VanEckDigitalTransformationETF
ACES ALPSCleanEnergyETF
BLOK AmplifyTransformationalDataSharingETF
PBW InvescoWilderHillCleanEnergyETF
3.64%3.26%2.62%2.42%2.28%2.20%2.03%1.81%1.49%1.49%
GlobalThematic1-DayPerformanceLeaders
Ticker FundIPAY ETFMGPrimeMobilePaymentsETF
POTX GlobalXCannabisETF
IBUY AmplifyOnlineRetailETF
KSTR KraneSharesSSESTARMarket50IndexETF
KGRN KraneSharesMSCIChinaCleanTechnologyIndexETF
MJ ETFMGAlternativeHarvestETF
THCX CannabisETF
ONLN ProSharesOnlineRetailETF
FINX GlobalXFinTechETF
MILN GlobalXMillennialConsumerETF
-2.92%-2.49%-1.83%-1.80%-1.76%-1.54%-1.53%-1.47%-1.44%-1.40%
GlobalThematic1-DayPerformanceLaggards
-3.0% -2.0% -1.0% 0.0% 1.0% 2.0% 3.0% 4.0%
DisruptiveTech
EvolvingConsumer
FinTech
HealthInnovation
IndustrialRevolution
Multi
Sustainability SMOG
KWEB
REMX
CNRG
ARKG
ERTH
ARKK
BLCN BLOKARKF
ACES
SKYY
IDNA
SOCL
GRID
FINXIPAY
IZRL
TAN
LIT
GlobalThematic1-DayPerformanceLandscape
GlobalThematicPerformance
©ETFAction,Inc.2021
*ETFLandscaperepresentedusingtheETFActionclassificationsystem**Leaders/Laggards/Overbought/OversoldETFsmusthave$50milliontoqualify
October11,2021

Segment Funds AUM 1Week 3Month 6Month 1Year
DisruptiveTech
EvolvingConsumer
FinTech
HealthInnovation
IndustrialRevolution
Multi
Sustainability
GrandTotal $60,813M
$11,889M
$12,594M
$8,221M
$6,698M
$4,474M
$10,524M
$6,412M
$1,898M
$1,375M
($1,497M)
$149M
($1,090M)
($473M)
$4,163M
($729M)
$2,286M
$158M
($944M)
$426M
($842M)
($365M)
$3,630M
$224M
($416M)
($181M)
$7M
($66M)
($27M)
($58M)
$46M
($136M)
$128B
$21B
$28B
$17B
$9B
$8B
$17B
$28B
183
34
28
23
14
14
39
31
ThematicLandscapeAssets&Flows
Oct20 Nov20 Dec20 Jan21 Feb21 Mar21 Apr21 May21 Jun21 Jul21 Aug21 Sep21 Oct21
0B
5B
10B
15B
ThematicMonthlyFlows
Ticker FundARKK ARKInnovationETFKWEB KraneSharesCSIChinaInternetETFAWAY ETFMGTravelTechETFCLOU GlobalXCloudComputingETFFIW FirstTrustWaterETFFIVG DefianceNextGenConnectivityETFBLOK AmplifyTransformationalDataSharingETFGRID FirstTrustNasdaqCleanEdgeSmartGRIDInfrastructureIndexBKCH GlobalXBlockchainETFGXTG GlobalXThematicGrowthETF
$274M$82M$28M$17M$9M$7M$7M$5M$4M$3M
Thematic1WeekFlowLeaders
Ticker FundNXTG FirstTrustIndxxNextGETFTAN InvescoSolarETFARKW ARKNextGenerationInternetETFARKF ARKFintechInnovationETFIBUY AmplifyOnlineRetailETFARKG ARKGenomicRevolutionETFACES ALPSCleanEnergyETFPBD InvescoGlobalCleanEnergyETFICLN iSharesGlobalCleanEnergyETFBOTZ GlobalXRobotics&ArtificialIntelligenceETF
($77M)($76M)($71M)($65M)($49M)($33M)($30M)($29M)($23M)($22M)
Thematic1WeekFlowLaggards
GlobalThematicFlows
©ETFAction,Inc.2021
*ETFLandscaperepresentedusingtheETFActionclassificationsystem**Leaders/Laggards/Overbought/OversoldETFsmusthave$50milliontoqualify***Flowsdelayedoneday
DisruptiveTech EvolvingConsumer FinTech HealthInnovation IndustrialRevolution Multi Sustainability
October11,2021

Oct20
Nov
20
Dec20
Jan21
Feb21
Mar21
Apr2
1
May
..
Jun21
Jul21
Aug21
Sep21
Oct21
0B
5B
10B
Developedex-U.S.MonthlyFlows
Oct20 Jan21 Apr21 Jul21 Oct21
0B
10B
Developedex-U.S.30-DayRollingFlows
Japa
n(EWJ)
Australia
(EWA)
U.K.(EW
U)
SouthKo
rea
(EWY)
Cana
da(EWC)
Dev
ex-U.S.
(EFA
)
Fran
ce(EWQ)
Switzerlan
d(EWL)
German
y(EWG)
Nethe
rlan
ds(EWN)
Hon
gKo
ng(EWH)
-1.00%
-0.50%
0.00%
0.50%
-0.03%-0.21% -0.27% -0.32%
-0.51%-0.67% -0.70% -0.71%
-0.95%
0.44%
0.08%
Developedex-U.S.1-DayPerformanceTop10Countries
Ticker FundEWC iSharesMSCICanadaETFBBCA JPMorganBetaBuildersCanadaETFEWS iSharesMSCISingaporeETFEWP iSharesMSCISpainETFEWU iSharesMSCIUnitedKingdomETFFIDI FidelityInternationalHighDividendETFGREK GlobalXMSCIGreeceETFFLGB FranklinFTSEUnitedKingdomETFEWO iSharesMSCIAustriaETFEWA iSharesMSCIAustraliaETF
59.3959.3653.9753.4252.6052.5151.2250.7750.6950.66
Developedex-U.S.MostOverbought
Ticker FundPIZ InvescoDWADevelopedMarketsMomentumETFEFAV iSharesMSCIEAFEMinVolFactorETFEFAD ProSharesMSCIEAFEDividendGrowersETFRFDI FirstTrustRiverfrontDynamicDevelopedInternatio..EUDG WisdomTreeEuropeQualityDividendGrowthFundPDEV PrincipalInternationalMulti-FactorETFEWUS iSharesMSCIUnitedKingdomSmallCapETFIQDG WisdomTreeInternationalQualityDividendGrowth..RBIN NationwideRisk-BasedInternationalEquityETFEDEN iSharesMSCIDenmarkETF
28.6128.8729.5630.0530.7531.0531.1631.6331.7731.83
Developedex-U.S.MostOversold
Ticker FundDBJP XtrackersMSCIJapanHedgedEquityETFHEWJ iSharesCurrencyHedgedMSCIJapanETFDXJ WisdomTreeJapanHedgedEquityFundEIS iSharesMSCIIsraelETFISRA VanEckIsraelETFIVAL AlphaArchitectInternationalQuantitativeValueETFEWJV iSharesMSCIJapanValueETFFLJP FranklinFTSEJapanETFEWJ iSharesMSCIJapanETFEWO iSharesMSCIAustriaETF
1.49%1.41%1.29%0.83%0.78%0.64%0.54%0.47%0.44%0.43%
Developedex-U.S.1-DayPerformanceLeaders
Ticker FundGREK GlobalXMSCIGreeceETFEWP iSharesMSCISpainETFEIRL iSharesMSCIIrelandETFEWI iSharesMSCIItalyETFEWUS iSharesMSCIUnitedKingdomSmallCapETFEWD iSharesMSCISwedenETFEWH iSharesMSCIHongKongETFEDEN iSharesMSCIDenmarkETFIEUS iSharesMSCIEuropeSmall-CapETFPIZ InvescoDWADevelopedMarketsMomentumETF
-1.36%-1.29%-1.23%-1.21%-1.13%-1.11%-0.95%-0.91%-0.84%-0.79%
Developedex-U.S.1-DayPerformanceLaggards
Oct20 Jan21 Apr21 Jul21 Oct21
65
70
75
80
Developedex-U.S.(EFA)
200DayMovingAverage 50DayMovingAverage ClosingPrice
DevelopedMarketsex-U.S.Performance
©ETFAction,Inc.2021
*ETFLandscaperepresentedusingtheETFActionclassificationsystem**Leaders/Laggards/Overbought/OversoldETFsmusthave$50milliontoqualify***Flowsdelayedoneday
October11,2021

Russia
(ERU
S)
Indo
nesia
(EIDO)
Thailand
(THD)
Malay
sia
(EWM)
Taiw
an(EWT)
Emerging
Markets
(EEM
)
China
(MCH
I)
India
(INDA)
Mexico
(EWW)
South
Africa(E
Z..
Brazil
(EWZ)
-1.00%
0.00%
1.00%
-0.18% -0.20% -0.20% -0.28% -0.29%
-0.89%-1.08%
0.97%
0.64%
0.18% 0.08%
Emerging1-DayPerformanceTop10Countries
Ticker FundQAT iSharesMSCIQatarETFEIDO iSharesMSCIIndonesiaETFERUS iSharesMSCIRussiaETFRSX VanEckRussiaETFKSA iSharesMSCISaudiArabiaETFSMIN iSharesMSCIIndiaSmallCapETFEPU iSharesMSCIPeruETFEWM iSharesMSCIMalaysiaETFEPHE iSharesMSCIPhilippinesETFEPI WisdomTreeIndiaEarningsFund
78.6877.7773.1570.6968.2367.0563.9963.3662.4460.66
EmergingMostOverbought
Ticker FundECH iSharesMSCIChileETFTUR iSharesMSCITurkeyETFILF iSharesLatinAmerica40ETFPIE InvescoDWAEmergingMarketsMomentumETFEWW iSharesMSCIMexicoETFFRDM Freedom100EmergingMarketsETFMFEM PIMCORAFIDynamicMulti-FactorEmergingMarket..EWT iSharesMSCITaiwanETFDGRE WisdomTreeEmergingMarketsQualityDividendGr..EYLD CambriaEmergingShareholderYieldETF
26.9336.8738.8639.4340.0840.3240.6740.8041.2241.44
EmergingMostOversold
Oct20 Jan21 Apr21 Jul21 Oct21
0B
5B
10B
Emerging30-DayRollingFlows
Ticker FundEPOL iSharesMSCIPolandETFEPHE iSharesMSCIPhilippinesETFERUS iSharesMSCIRussiaETFEIDO iSharesMSCIIndonesiaETFFNI FirstTrustChindiaETFTUR iSharesMSCITurkeyETFRSX VanEckRussiaETFEPU iSharesMSCIPeruETFADRE InvescoBLDRSEmergingMarkets50ADRIndexFundNFTY FirstTrustIndiaNIFTY50EqualWeightETF
1.69%1.22%0.97%0.64%0.51%0.47%0.47%0.43%0.33%0.32%
Emerging1-DayPerformanceLeaders
Ticker FundEWZS iSharesMSCIBrazilSmall-CapETFECNS iSharesMSCIChinaSmall-CapETFEWZ iSharesMSCIBrazilETFFLBR FranklinFTSEBrazilETFEMGF iSharesMSCIEmergingMarketsMultifactorETFILF iSharesLatinAmerica40ETFEZA iSharesMSCISouthAfricaETFASHR XtrackersHarvestCSI300ChinaA-SharesETFCNYA iSharesMSCIChinaAETFGLIN VanEckIndiaGrowthLeadersETF
-1.78%-1.32%-1.08%-1.06%-1.03%-0.98%-0.89%-0.77%-0.77%-0.71%
Emerging1-DayPerformanceLaggards
Oct20
Nov
20
Dec20
Jan21
Feb21
Mar21
Apr2
1
May
21
Jun21
Jul21
Aug21
Sep21
Oct21
0B
5B
10B
EmergingMonthlyFlows
Oct20 Jan21 Apr21 Jul21 Oct21
45
50
55
Emerging(EEM)
200DayMovingAverage 50DayMovingAverage ClosingPrice
EmergingMarketsPerformance
©ETFAction,Inc.2021
*ETFLandscaperepresentedusingtheETFActionclassificationsystem**Leaders/Laggards/Overbought/OversoldETFsmusthave$50milliontoqualify***Flowsdelayedoneday
October11,2021
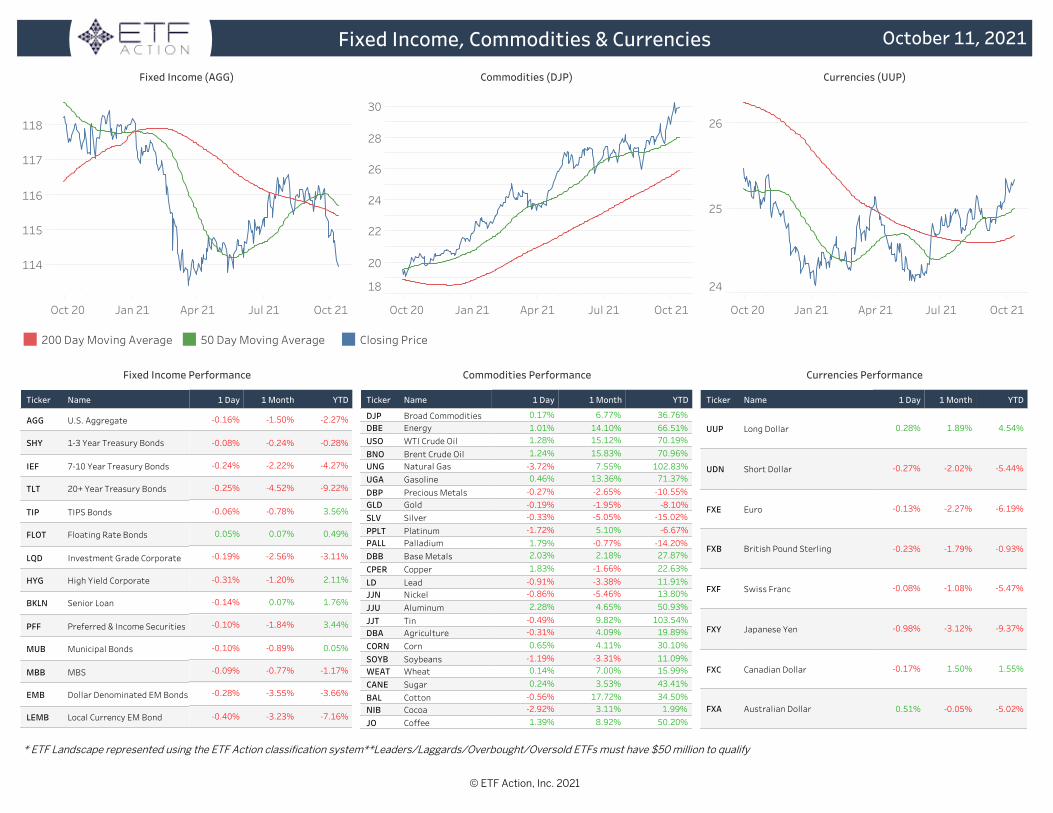
Oct20 Jan21 Apr21 Jul21 Oct21
114
115
116
117
118
FixedIncome(AGG)
200DayMovingAverage 50DayMovingAverage ClosingPrice
Oct20 Jan21 Apr21 Jul21 Oct21
18
20
22
24
26
28
30
Commodities(DJP)
Oct20 Jan21 Apr21 Jul21 Oct21
24
25
26
Currencies(UUP)
Ticker Name 1Day 1Month YTD
AGG U.S.Aggregate
SHY 1-3YearTreasuryBonds
IEF 7-10YearTreasuryBonds
TLT 20+YearTreasuryBonds
TIP TIPSBonds
FLOT FloatingRateBonds
LQD InvestmentGradeCorporate
HYG HighYieldCorporate
BKLN SeniorLoan
PFF Preferred&IncomeSecurities
MUB MunicipalBonds
MBB MBS
EMB DollarDenominatedEMBonds
LEMB LocalCurrencyEMBond
-2.27%-1.50%-0.16%
-0.28%-0.24%-0.08%
-4.27%-2.22%-0.24%
-9.22%-4.52%-0.25%
3.56%-0.78%-0.06%
0.49%0.07%0.05%
-3.11%-2.56%-0.19%
2.11%-1.20%-0.31%
1.76%0.07%-0.14%
3.44%-1.84%-0.10%
0.05%-0.89%-0.10%
-1.17%-0.77%-0.09%
-3.66%-3.55%-0.28%
-7.16%-3.23%-0.40%
FixedIncomePerformance
Ticker Name 1Day 1Month YTD
DJP BroadCommoditiesDBE EnergyUSO WTICrudeOilBNO BrentCrudeOilUNG NaturalGasUGA GasolineDBP PreciousMetalsGLD GoldSLV SilverPPLT PlatinumPALL PalladiumDBB BaseMetalsCPER CopperLD LeadJJN NickelJJU AluminumJJT TinDBA AgricultureCORN CornSOYB SoybeansWEAT WheatCANE SugarBAL CottonNIB CocoaJO Coffee
36.76%6.77%0.17%66.51%14.10%1.01%70.19%15.12%1.28%70.96%15.83%1.24%
102.83%7.55%-3.72%71.37%13.36%0.46%-10.55%-2.65%-0.27%-8.10%-1.95%-0.19%
-15.02%-5.05%-0.33%-6.67%5.10%-1.72%
-14.20%-0.77%1.79%27.87%2.18%2.03%22.63%-1.66%1.83%11.91%-3.38%-0.91%13.80%-5.46%-0.86%50.93%4.65%2.28%
103.54%9.82%-0.49%19.89%4.09%-0.31%30.10%4.11%0.65%11.09%-3.31%-1.19%15.99%7.00%0.14%43.41%3.53%0.24%34.50%17.72%-0.56%1.99%3.11%-2.92%
50.20%8.92%1.39%
CommoditiesPerformance
Ticker Name 1Day 1Month YTD
UUP LongDollar
UDN ShortDollar
FXE Euro
FXB BritishPoundSterling
FXF SwissFranc
FXY JapaneseYen
FXC CanadianDollar
FXA AustralianDollar
4.54%1.89%0.28%
-5.44%-2.02%-0.27%
-6.19%-2.27%-0.13%
-0.93%-1.79%-0.23%
-5.47%-1.08%-0.08%
-9.37%-3.12%-0.98%
1.55%1.50%-0.17%
-5.02%-0.05%0.51%
CurrenciesPerformance
FixedIncome,Commodities&Currencies
©ETFAction,Inc.2021
*ETFLandscaperepresentedusingtheETFActionclassificationsystem**Leaders/Laggards/Overbought/OversoldETFsmusthave$50milliontoqualify
October11,2021

©2021ETFAction.com
Definitions&Disclosures
DisclaimerofWarrantiesExceptfortheexpresswarrantiessetforthinthetermsofservice,allservices,includingallETFActionmaterials,areprovidedonan“asis,”“whereis”basis,andETFActionanditslicensorsdisclaimallrepresentationsorwarranties,expressorimpliedastotheservices.ETFActionanditslicensorsspecificallydisclaimallimpliedwarrantiesofmerchantability,fitnessforaparticularpurpose,titleandnon-infringement,andallwarrantiesarisingfromcourseofdealing,usageortradepractice.Withoutlimitingtheforegoing,ETFActionanditslicensorsmakenowarrantyofanykindthattheservicesorETFActionmaterials,oranyproductsorresultsoftheusethereof,willmeetcustomer’soranyotherperson’srequirements,operatewithoutinterruption,achieveanyintendedresult,becompatibleorworkwithanysoftware,systemorotherservices,orbesecure,accurate,complete,timely,freeofharmfulcodeorerrorfree.Allthird-partymaterialsareprovided“asis”andanyrepresentationorwarrantyoforconcerninganythird-partymaterialsisstrictlybetweencustomerandthethird-partyownerordistributorofthethird-partymaterials.
AdditionalDisclaimersTheservicesarenotintendedandshouldnotbeconstruedasfinancialorinvestmentadvice,arecommendationorpromotion.NeitherETFActionnoritslicensorsshallberesponsibleforinvestmentdecisions,damages,orotherlossesresultingfromuseoftheservices.Pastperformance doesnotguaranteefutureperformance.NeitherETFActionnoritslicensorsshallbeconsideredan“expert”underthesecuritiesactof1933.NeitherETFActionnoritslicensorswarrantthattheservicescomplywiththerequirementsoftheNASDoranysimilarorganizationorwiththesecuritieslawsofanyjurisdiction.Anyinformationcontainedinintheservicesshouldnotbeacteduponwithoutobtainingspecificlegal,tax,andinvestmentadvicefromalicensedprofessional.Distributionprohibitedwithoutpriorpermission. Fulltermsofservice,includingtermsofuse,copyrights,anddisclaimersareavailableathttps://www.etfaction.com/terms.
©CopyrightETFAction,Inc. AllRightsReserved.
DataReliabilityandDefinitionsETFAction,LLCbelievestheinformationhereintobeaccurate(attimeofpublication)andwasobtainedfromreliablesources,butmakesnoguaranteeswithrespecttoitsaccuracy.CalculationsoffundamentaldataarebasedonweightedaveragesofreportedresultsandconsensusestimatesofcurrentETFconstituents. Valuationdata(price/earnings,price/sales,price/cashflow,price/bookvalue)arecalculatedusingpersharedatadividedbycurrentNAVofcorrespondingETF. Performance,riskandtechnicaldata(movingaverages,relativeperformance,RSI)calculatedforspecifiedperiodsusingETFmarketpricewhichmaydifferfromnetassetvalue(NAV).ETFActionSectorBetaCompositesrepresentETFsthatmeetstringentcriteriasurroundingindexmethodology,liquidity,assetsundermanagement,andmanagementfee.
SourceData&ETFIssuerInformation ..
ETFActionisanindependenttechnologyandresearchfirmfocusedonhelpingadvisorsbuildbetterportfolios,createengagingexperienceswiththeirclients,andnavigatethevastETFlandscape.
Contactusat:
October11,2021