U.S. REFINERY AIR POLLUTANTS · Develop an approach to allocate refinery air pollutants to each...
22
WE START WITH YES. U.S. REFINERY AIR POLLUTANTS PINGPING SUN, AMGAD ELGOWAINY, ZIFENG LU, JEONGWOO HAN MICHAEL WANG SYSTEMS ASSESSMENT, ENERGY SYSTEMS DIVISION, ARGONNE NATIONAL LABORATORY Aug 16th, 2017 http://www.marathonrefinerycontractor.com/_Texas_Cit/ BEN YOUNG, BEN MORELLI, TROY HAWKINS EASTERN RESEARCH GROUP, INC. (ERG) 2017 International Emissions Inventory Conference by EPA
Transcript of U.S. REFINERY AIR POLLUTANTS · Develop an approach to allocate refinery air pollutants to each...
WE START WITH YES.
U.S. REFINERY AIR POLLUTANTS
erhtjhtyhy
PINGPING SUN, AMGAD ELGOWAINY, ZIFENG LU, JEONGWOO HAN MICHAEL WANG SYSTEMS ASSESSMENT, ENERGY SYSTEMS DIVISION, ARGONNE NATIONAL LABORATORY
Aug 16th, 2017
http://www.marathonrefinerycontractor.com/_Texas_Cit/
BEN YOUNG, BEN MORELLI, TROY HAWKINS EASTERN RESEARCH GROUP, INC. (ERG)
2017 International Emissions Inventory Conference by EPA
Background
Reducing air pollutant emissions from transportation is a target for U.S. major cities.
Accurate air pollutant emissions are needed for baseline petroleum fuels, including refining process
LCA provides a consistent platform for evaluating and comparing air pollutant emissions along the production pathways of transportation fuels
GREET model allows tracking of energy consumption and GHG/criteria pollutants emissions along transportation fuels production pathways
2
Objectives
Specifically focus on refinery air pollutants emissions
Develop both PADD level and National level pollutants emission intensity
Develop an approach to allocate refinery air pollutants to each refinery product
Derive refinery air pollutants emissions for refinery products, evaluate transportation fuels pollutants emissions along their life cycles
3

4
NEI by EPARefinery pollutants
emissions 2011/2014
ANL LP modeling database
Emissions allocation to refinery products
EIA RefCapRefinery facility
capacity/operation data
Acquire refinery air emissions and production data – approach
Emissions per crude input
Emissions per refinery products
Production calibration
5
Part I: U.S. Refinery Air Pollutants Emission-Per Refinery Throughput
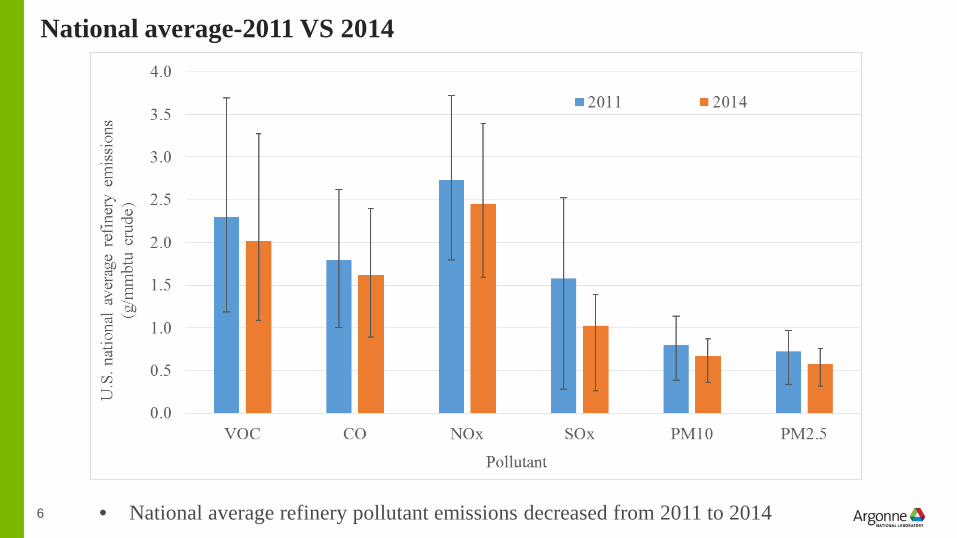
National average-2011 VS 2014
6 • National average refinery pollutant emissions decreased from 2011 to 2014
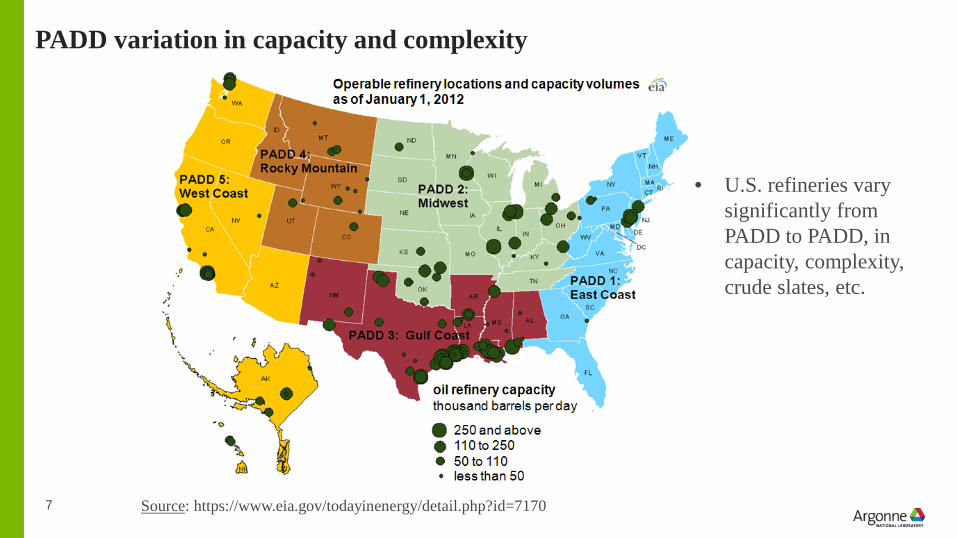
PADD variation in capacity and complexity
7 Source: https://www.eia.gov/todayinenergy/detail.php?id=7170
• U.S. refineries vary significantly from PADD to PADD, in capacity, complexity, crude slates, etc.
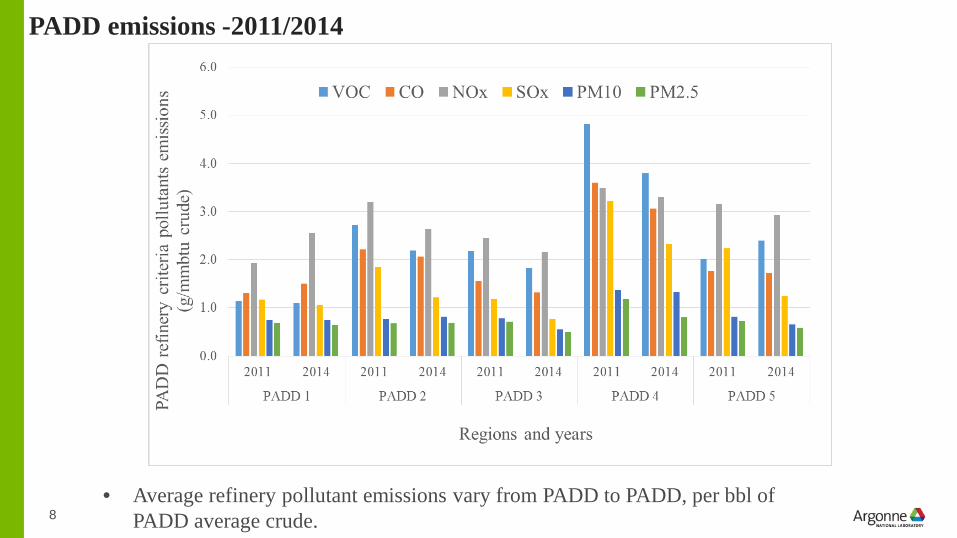
PADD emissions -2011/2014
8• Average refinery pollutant emissions vary from PADD to PADD, per bbl of
PADD average crude.
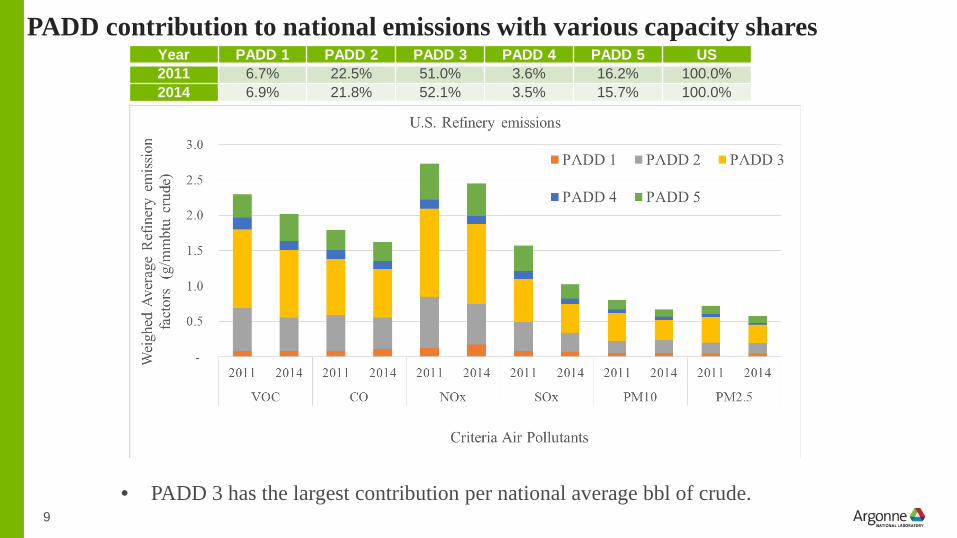
PADD contribution to national emissions with various capacity shares
9
Year PADD 1 PADD 2 PADD 3 PADD 4 PADD 5 US2011 6.7% 22.5% 51.0% 3.6% 16.2% 100.0%2014 6.9% 21.8% 52.1% 3.5% 15.7% 100.0%
• PADD 3 has the largest contribution per national average bbl of crude.
10
Part II: U.S. Refinery Air Pollutants Emission-LP Modeling Allocation
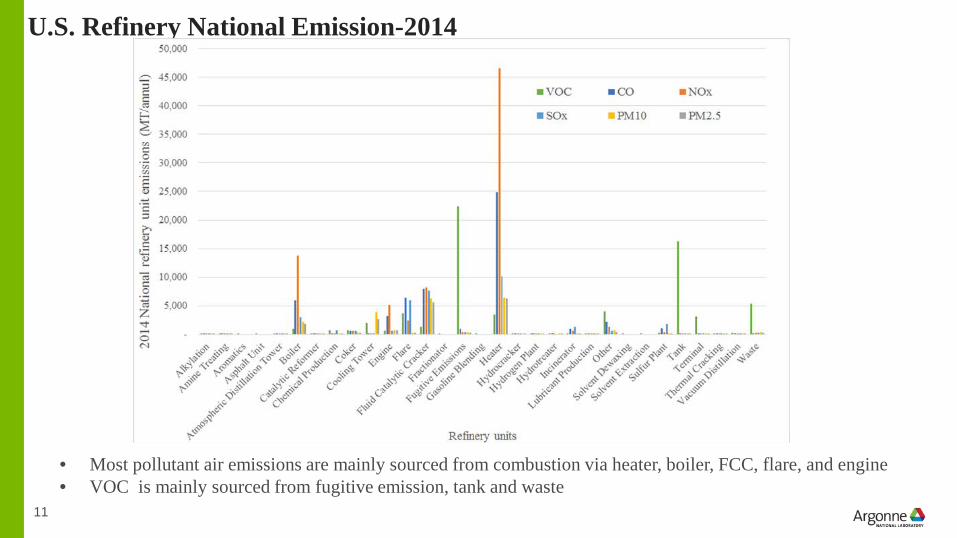
U.S. Refinery National Emission-2014
11
• Most pollutant air emissions are mainly sourced from combustion via heater, boiler, FCC, flare, and engine• VOC is mainly sourced from fugitive emission, tank and waste
12
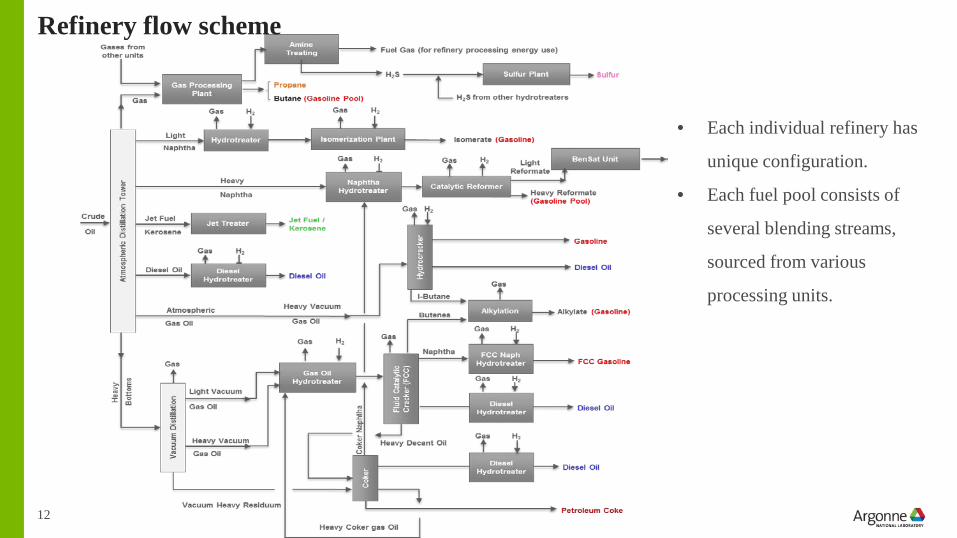
Refinery flow scheme
• Each individual refinery has
unique configuration.
• Each fuel pool consists of
several blending streams,
sourced from various
processing units.
13
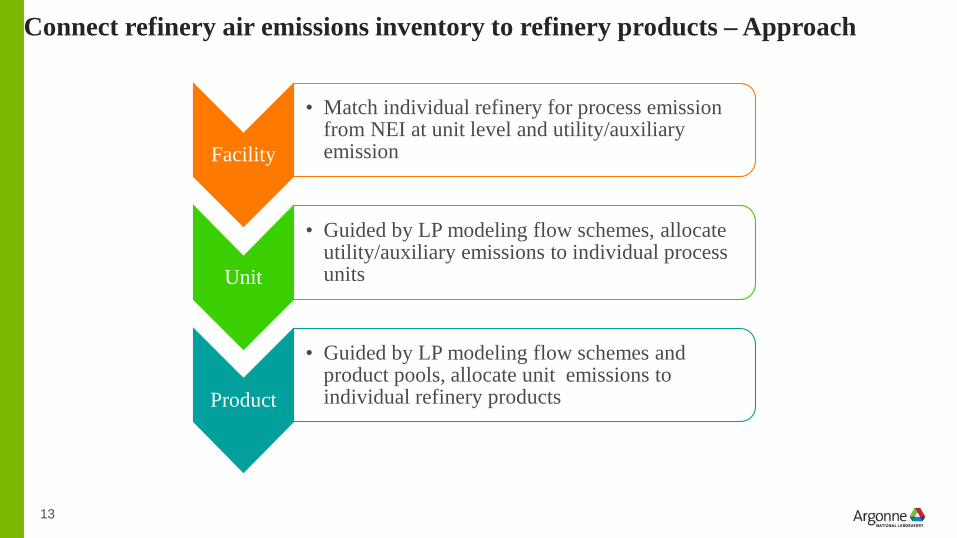
Facility
• Match individual refinery for process emission from NEI at unit level and utility/auxiliary emission
Unit
• Guided by LP modeling flow schemes, allocate utility/auxiliary emissions to individual process units
Product
• Guided by LP modeling flow schemes and product pools, allocate unit emissions to individual refinery products
Connect refinery air emissions inventory to refinery products – Approach
14
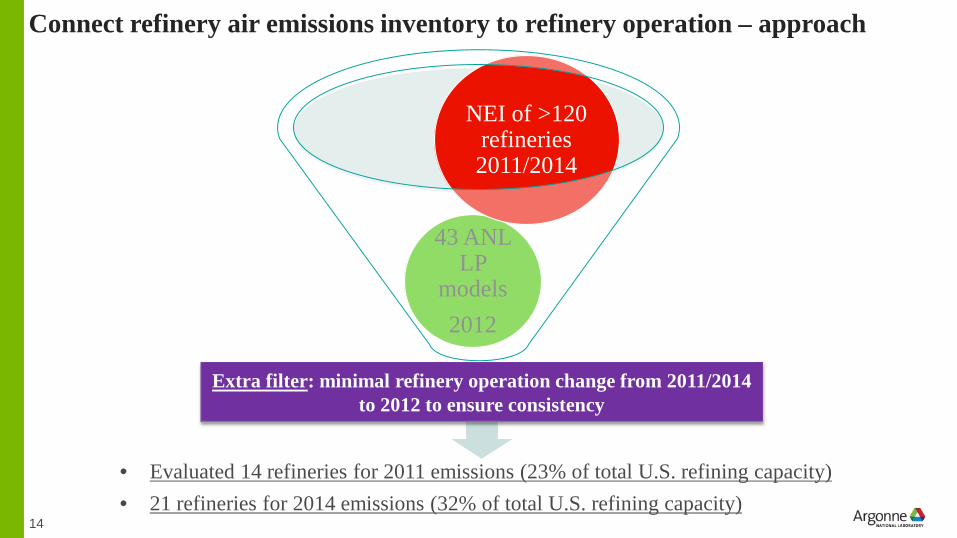
Connect refinery air emissions inventory to refinery operation – approach
• Evaluated 14 refineries for 2011 emissions (23% of total U.S. refining capacity) • 21 refineries for 2014 emissions (32% of total U.S. refining capacity)
43 ANL LP
models2012
Extra filter: minimal refinery operation change from 2011/2014 to 2012 to ensure consistency
NEI of >120 refineries 2011/2014
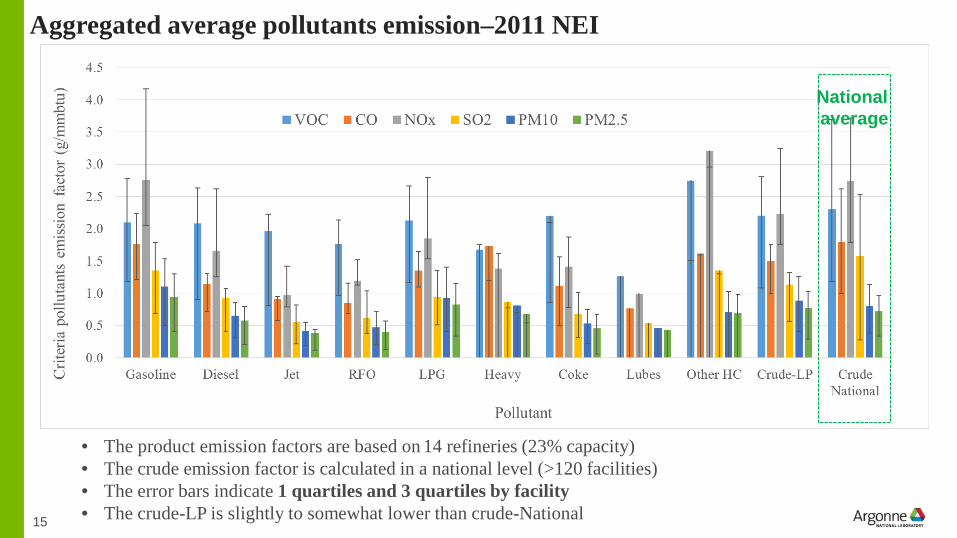
Aggregated average pollutants emission–2011 NEI
15
National average
• The product emission factors are based on 14 refineries (23% capacity) • The crude emission factor is calculated in a national level (>120 facilities)• The error bars indicate 1 quartiles and 3 quartiles by facility• The crude-LP is slightly to somewhat lower than crude-National
16
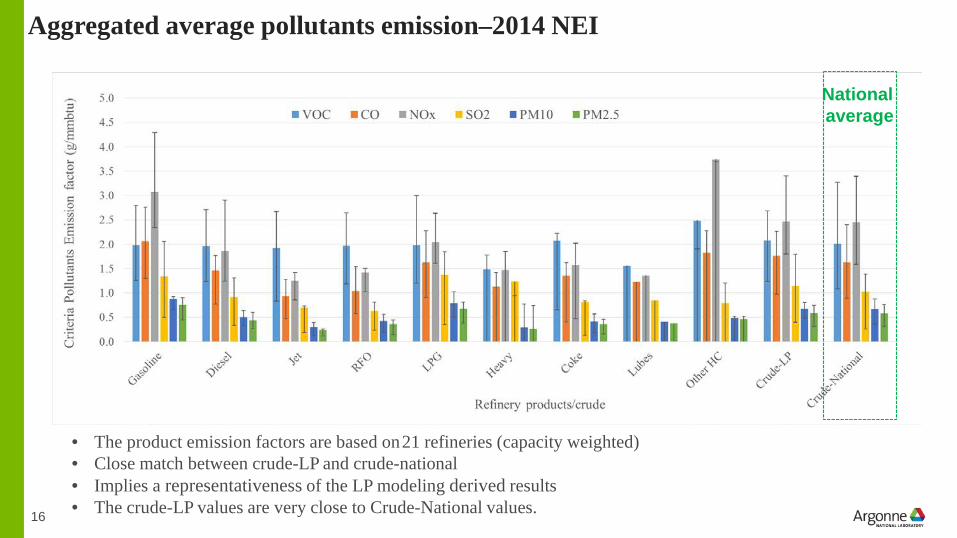
Aggregated average pollutants emission–2014 NEI
National average
• The product emission factors are based on 21 refineries (capacity weighted) • Close match between crude-LP and crude-national• Implies a representativeness of the LP modeling derived results• The crude-LP values are very close to Crude-National values.
17
Part III: Transportation fuels Life Cycle Analysis on Air Pollutants
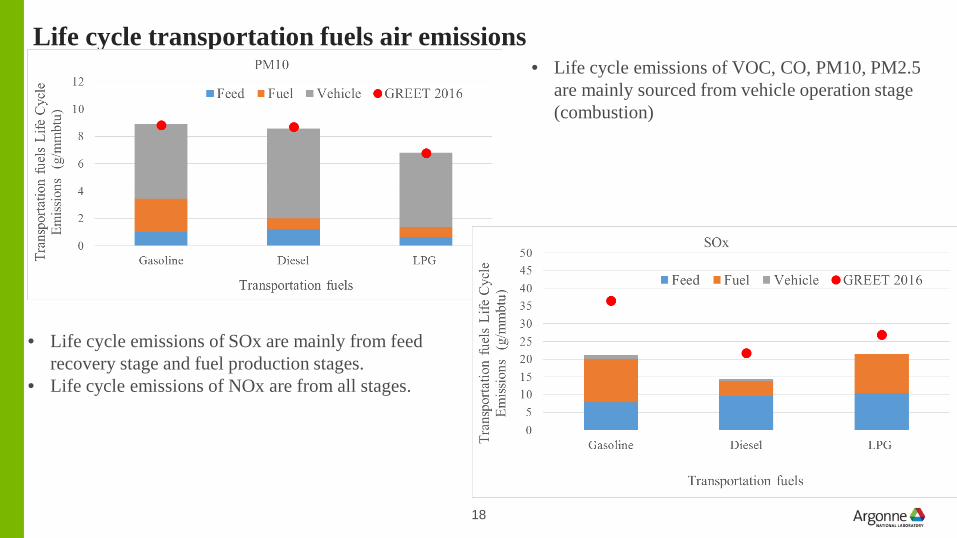
Life cycle transportation fuels air emissions
18
• Life cycle emissions of VOC, CO, PM10, PM2.5 are mainly sourced from vehicle operation stage (combustion)
• Life cycle emissions of SOx are mainly from feed recovery stage and fuel production stages.
• Life cycle emissions of NOx are from all stages.
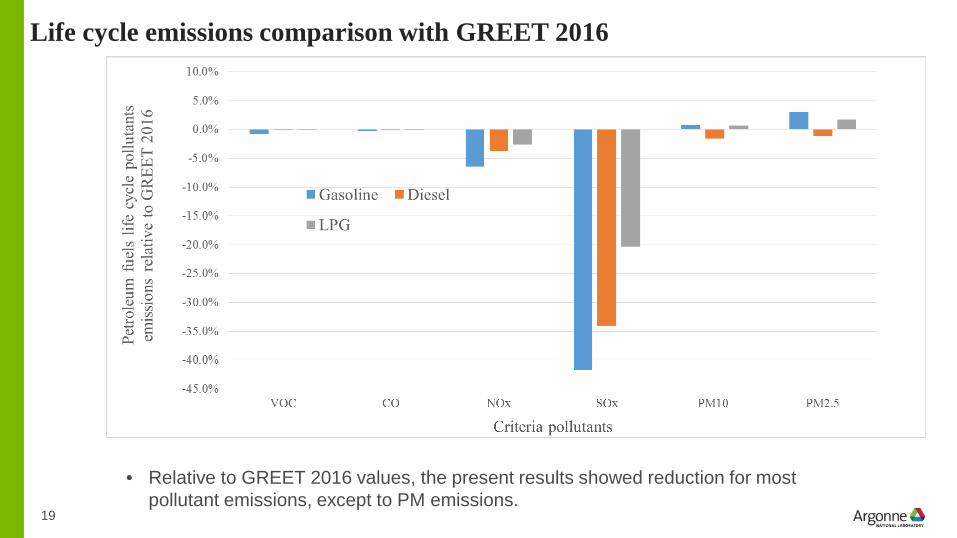
Life cycle emissions comparison with GREET 2016
19
• Relative to GREET 2016 values, the present results showed reduction for most pollutant emissions, except to PM emissions.
Conclusions
20
• New refinery criteria pollutants emissions per refinery throughput were
developed
• The emissions per crude input vary among PADDs
• A methodology is developed to allocate refinery facility emissions to
refinery products.
• Relative to GREET 2016, the updated results showed lower life cycle
emissions for most pollutants, especially for SOx
Acknowledgement
21
• The authors would like to gratefully acknowledge the sponsorship of the Fuel Cell
Technologies Office of the U.S. Department of Energy, under Contract No. DE-
AC02-06CH11357

Thank you!
22