us - PSY 225: Research Methods · My plea is that we cannot afford the increase: ... joke or a...
26
There are three kinds of lies: lies, damned lies, and statistics. -Disraeli Statistical thinking will one day be as necessary for efficient citizenship as the ability to read and write. -H. G. Wells It ain't so much the things we don't k.--now that get us in trouble. It's the things we know that ain't so. -Artemus Ward Round numbers are always false. -Samuel Johnson I have a great subject [statistics] to write upon, but feel keenly my literary incapacity to make it easily intelligible without sacrificing accuracy and thoroughness. -Sir Francis Galton
Transcript of us - PSY 225: Research Methods · My plea is that we cannot afford the increase: ... joke or a...

There are three kinds of lies: lies, damned lies, and statistics. -Disraeli
Statistical thinking will one day be as necessary for efficient citizenship as the ability to read and write.
-H. G. Wells
It ain't so much the things we don't k.--now that get us in trouble. It's the things we know that ain't so.
-Artemus Ward
Round numbers are always false. -Samuel Johnson
I have a great subject [statistics] to write upon, but feel keenly my literary incapacity to make it easily intelligible without sacrificing accuracy and thoroughness.
-Sir Francis Galton

Also by Darrell Huff
HOW TO TAKE A CHANCE
with illustrations by Irving Geis
CYCLES IN YOUR LIFE
with illustrations by Anatol Kovarsky
l -
l
How to Lie with
By DARRE LL HUFF
Pictures by IRVING GElS
W · W · NORTON & COMPA NY· INC· New York
MAGernsbacher
Text Box
https://archive.org/details/HowToLieWithStatistics
MAGernsbacher
Rectangle

HOW TO LIE WITII STATISTICS
You have pretty fair evidence to go on if you suspect that polls in general are biased in one specific direction, the direction of the Literary Digest error. This bias is
toward the person with more money, more education, more i11formation and alertness, better appearance, more conventional behavior, and more settled habits than the average of the population he is chosen to represent.
You can easily see what produces this. Let us say that you are an interviewer assigned to a street corner, with one interview to get. You spot two men who seem to fit the category you must complete: over forty, Negro, urban. One is in clean overalls, decently patched, neat. The other is dirty and he looks surly. With a job to get done, you approach the more likely-looking fellow, and your colleagues all over the country are making similar decisions.
Some of the strongest feeling against public-opinion polls is found in liberal or left-wing circles, where it is
rather commonly believed that polls are generally rigged. Behind this view is the fact that poll results so often fail to square with the opinions and desires of those whose thinking is not in the conservative direction. Polls, they point out, seem to elect Republicans even when voters shortly thereafter do otherwise.
Actually, as we have seen, it is not necessary that a poll be rigged-that is, that the results be deliberately twisted in order to create a false impression. The tendency of the sample to be biased in this consistent direction can rig
it automatically.
I
CHAPTER 2
The Well ,. Chosen Average
~
You, I trust, are not a snob, and I certainly am not in the real-estate business. But let's say that you are and I am
and that you are looking for property to buy along a road that is not far from the California valley in which I live.
Having sized you up, I take pains to tell you that the average income in this neighborhood is some $15,000 a year. Maybe that clinches your interest in living here; anyway, you buy and that handsome figure sticks in your mind. More than likely, since we have agreed that for the purposes of the moment you are a bit of a snob, you toss ,.: it in casually when telling your friends about where you live.
A year or so later we meet again. As a member of some taxpayers' committee I am circulating a petition to keep
27
MAGernsbacher
Rectangle
MAGernsbacher
Callout
$15,000 in 1954 dollars is approximately $136,000 in 2017 dollars

HOW TO LIE wt::ffi .. STATISTICS
the tax rate down or ~~essm~nts down or bus fa.re down. My plea is that we cannot afford the increase: After all, the average income in this neighborhood is only $3,500 a year. Perhaps you go along with me and my co~~~ttee in this-you're not only a snob, you're ~ti~_ too_:but you can't help being surprised to hear about that measly $3,500. Am I lying now, or was 1 lying last year?
You can't pin jt on me either time. That is the essential
beauty of doing your lying with statistics. Both those figures are legitimate averages, legally arrived at. Both represent the same data, the same people, the same incomes. All the same it is obvious that at least one of them must be so misleading as to rival an out-and-out lie.
My trick was to use a different kind of average each time, the word "average" having a very loose meaning. It is a trick commonly used, sometimes in innocence but often in guilt, by fellows wishing to influence public opinion or sell advertising space. When you are told that something is an average you still don't know very much about it unless you can find out which of the common kinds of average it is- mean, median, or mode.
The $15,000 figure I used when I wanted a big one is a mean, the arithmetic average of the incomes of all the families in the neighborhood. You get jt by adding up all th:e incomes and dividing by the number there are. The smaller figure is a median, and so it tells you that half the families in question have more than $3,500 a year and half have less. I might also have used the mode, which is the most frequently met-with figure in a series.
. ~
I I
l .· . . ·;
THE WELL-cHOSEN AVERAGE
H in this neighborhood there are more families with incomes of $5,000 a year than with any other amount, $5,000 a year is the modal income.
In this case, as usually is true with income figures, an unqualified "average" is virtually meaningless. One factor that adds to the confusion is that with some kinds of infonnation all the averages fall so close together that, for casual purposes, it may not be vital to distingui.sh among them.
H you read that the average height of the men of some primitive tribe is only five feet, you get a fairly good idea of the stature of these people. You don't have to ask whether that average is a mean, median, or mode; it would come out about the same. (Of course, if you are in the business of manufacturing overalls for Mricans yov
MAGernsbacher
Callout
$3,500 in 1954 dollars is approximately $32,000 in 2017 dollars
MAGernsbacher
Highlight
MAGernsbacher
Highlight
MAGernsbacher
Highlight
MAGernsbacher
Callout
$15,000 in 1954 dollars is approximately $136,000 in 2017 dollars
MAGernsbacher
Highlight
MAGernsbacher
Highlight
MAGernsbacher
Callout
$5,000 in 1954 dollars is approximately $45,000 in 2017 dollars
MAGernsbacher
Highlight
MAGernsbacher
Highlight
MAGernsbacher
Text Box
MAGernsbacher
Text Box
is five feet, 10 inches,
MAGernsbacher
Text Box
American men
MAGernsbacher
Text Box
of American men.

HOW TO LlE WITH STATISTICS
would want more information than can be found in any average. This has to do with ranges and deviations, and we1l tackle that one in the next chapter.)
The different averages come out close together when you deal with data, such as those having to do with many human characteristics, that have the grace to fall close to what is called the normal distribution. If you draw a curve to represent it you get something shaped like a bell, and mean, median, and mode fall at the same point.
Consequently one kind of average is as good as another for describing the heights of men, but for describing their pocketbooks it is not. If you should list the annual incomes of all the families in a given city you might find that they ranged from not much to perhaps $50,000 or so, and you might find a few very large ones. More than ninety-five per cent of the incomes would be under $10,000, putting them way over toward the left-hand side of the curve. Instead of being symmetrical, like a bell, it would be skewed. Its shape would be a little like that of a child's slide, the ladder rising sharply to a peak, the working part sloping gradually down. The mean would be quite a distance from the median. You can see what this would do to the validity of any comparison made between the "average" (mean) of one year and the "average" (median} of another.
In the neighborhood where I sold you some property the two averages are particularly far apart because the distribution is markedly skewed. It happens that most of your neighbors are small farmers or wage earners employed in
THE WELL·CHOSEN AVERAGE
a near-by village or elderly retired people on pensions. But three of the inhabitants are millionaire week-enders and these three boost the total income, and therefore the arith-
metic average, enormously. They boost it to a figure that practically everybody in the neighborhood has a good deal less than. You have in reality the case that sounds like a joke or a figure of speech: Nearly everybody is below average.
That's why when you read an announcement by a cor· poration executive or a business proprietor that the average pay of the people who work in his establishment is so much, the figure may mean something and it may not. If the average is a median, you can learn something significant from it : Half the employees make more than that; half make less. But if it is a mean (and believe me it may be that if its nature is unspecified) you may be getting nothing more revealing than the average of one $45,000 income-the proprietor's- and the salaries of a crew of un· derpaid workers. "Average annual pay of $5,700" may conceal both the $2,000 salaries and the owner's profits taken in the form of a whopping salary.
MAGernsbacher
Highlight
MAGernsbacher
Callout
$50,000 in 1954 dollars is approximately $455,000 in 2017 dollars
MAGernsbacher
Highlight

HOW TO LIE WITH STATISTICS
Let's take a longer look at that one. The facing page shows how many people get how much. The boss might like to express the situation as "average wage $5,700"using that deceptive mean. The mode, however, is more revealing: most common rate of pay in this business is $2,000 a year. As usual, the median tells more about the situation than any other single figure does; half the people get more than $3,000 and half get less.
How neatly this can be worked into a whipsaw device in which the worse the story, the better it looks is illustrated in some company statements. Let's try our hand at one in a small way.
You are one of the three partners who own a small manufacturing business. It is now the end of a very good year. You have paid out $198,000 to the ninety employees who do the work of making and shipping the chairs or whatever it is that you manufacture. You and your partners have paid yourselves $11,000 each in salaries. You find there are profits for the year of $45,000 to be divided equally among you. How are you going to describe this? To make it easy to understand, you put it in the fonn of averages. Since all the employees are doing about the same kind of work for similar pay, it won't make much difference whether you use a mean or a median. This is
what you come out with:
Average wage of employees ... .. . ............ .. $ 2,200 Average salary and profit of owners .. .. 26,000
That looks terrible, doesn't it? Let's try it another way.
. I
lltf $45,000
f $15,000
'' $10,000
f +ARJTifM£TICAL AVERAGE $5,700
ti1. $5,000
MAGernsbacher
Callout
$5,700 in 1954 dollars is approximately $52,000 in 2017 dollars

HOW TO LIE WITH STA TJSTICS
Take $30,000 of the profits and distribute it among the three partners as bonuses. And this time when you average up the wages, include yourself and your partners. And be sure to use a mean.
Average wage or salary . ... .................. $ 2,806.45 Average profit of owners .................... 5,000.00
Ah. That looks better. Not as good as you could make it look, but good enough. Less than six per cent of the money available for wages and profits has gone into profits, and you can go further and show that too if you like. Anyway, you've got figures now that you can publish, post on a bulletin board, or use in bargaining.
This is pretty crude because the example is simplified, but it is nothing to what has been done in the name of accounting. Given a complex corporation with hierarchies
THE WELL-cHOSEN AVERAGE 35
of employees ranging an the way from beginning typist to president with a several-hundred-thousand-dollar bonus, all sorts of things can he covered up in this manner.
So when you see an average-pay figure. first ask: Average of what? Who's included? The United States Steel Corporation once said that its employees average weekly earnings went up 107 per cent between 1940 and 1948. So thev did-but some of the punch goes out of the magnificent increase when you note that the 1940 figure includes a much larger number of partially employed people. If you work half-time one year and full-time the next, your earnings will double, but that doesn't indicate anything at all about your wage rate.
You may have read in the paper that the income of the average American family was $3,100 in 1949. You should not try to make too much out of that figure unless you al~o know what "family" has been used to mean, as well as what kind of average this is. (And who says so and how he knows and how accurate the figure is.)
This one happens to have come from the Bureau of the Census. If you have the Bureau's report you'll have no trouble finding the rest of the information you need right there: This is a median; "family" signifies .. two or more persons related to each other and living together." (If persons living alone are included in the group the median slips to $2,700, which is quite different.) You will also learn if you read back into the tables that the figure is
based on a sample of such size that there are nineteen chances out of twentv that the estimate-$3,107 before it
MAGernsbacher
Highlight
MAGernsbacher
Highlight
MAGernsbacher
Highlight
MAGernsbacher
Callout
$3,100 in 1949 dollars is approximately $32,000 in 2017 dollars
HOW TO LIE WITH STATISTICS
was rounded-is correct within a margin of $59 plus or minus.
That probability and that margin add up to a pretty good estimate. The Census people have both skill enough and money enough to bring their sampling studies down to a fair degree of precision. Presumably they have no particular axes to grind. Not all the figures you see are hom under such happy circumstances, nor are all of them accompanied by any infonnation at all to show how precise or unprecise they may be. We'll work that one over in the next chapter.
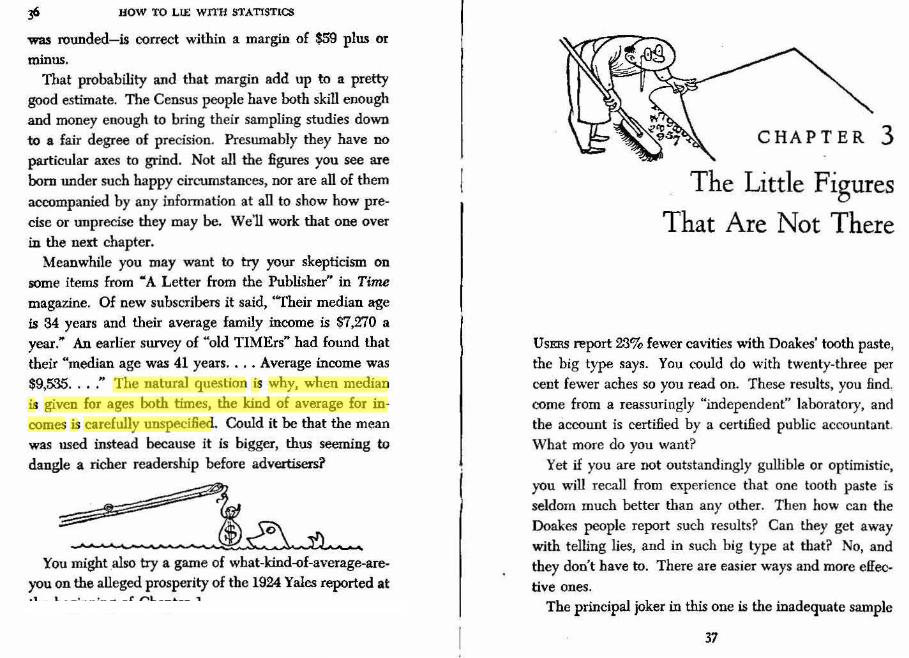
Meanwhile you may want to try your skepticism on some items from .. A Letter from the Publisher" in Time magazine. Of new subscribers it said, "Their median age is 34 years and their average family income is $7,270 a year." An earlier survey of "old TIMErs .. had found that their "median age was 41 years .... Average income was $9,535 ..•. " The natural question is why, when median is given for ages both times, the kind of average for incomes is carefully unspecified. Could it be that the mean was used instead because it is bigger, thus seeming to
dangle a richer readership before advertisers?
You might .also try a game of what-kind-of-average-areyou on the alleged prosperity of the 1924 Yales reported at the beginning of Chapter 1.
CHAPTER 3
The Little Figures
That Are Not There
UsERS report 23% fewer cavities with Doakes' tooth paste, the big type says. You could do with twenty-three per cent fewer aches so you read on. These results, you find, come from a reassuringly "independent" laboratory, and the account is certified by a certified public accountant. What more do you want?
Yet if you are not outstandingly gullible or optimistic, you will recall from experience that one tooth l)aste is seldom much better than any other. Then how can the Doakes people report such results? Can they get away with telling lies, and in such big type at that? No, and they don't have to. There are easier ways and more effective ones.
The principal joker in this one is the inadequate sample
37
MAGernsbacher
Highlight
MAGernsbacher
Text Box

HOW TO LIE WITH STATISTICS
-statistically inadequate, that is; for Doakes' purpose it
is just right. That test group of users, you discover by reading the small type, consisted of just a dozen persons. (You have to hand it to Doakes, at that, for giving you a sporting chance. Some advertisers would omit this information and leave even the statistically sophisticated only a guess as to what species of chicanery was afoot. His sample of a dozen isn't so bad either, as these things go. Something called Dr. Cornish's Tooth Powder came onto the market a few years ago with a claim to have shown "considerable success in correction of ... dental caries." The idea was that the powder contained urea, which laboratory work was supposed to have demonstrated to be valuable for the purpose. The pointlessness of this was that the experimental work had been purely preliminary and had been done !ln precisely six cases. )
But let's get back to how easy it is for Doakes to get a headline without a falsehood-in it and everything certified at that. Let any small group of persons keep count of cavities for six months, then switch to Doakes'. One of three things is bound to happen: distinctly more cavities, distinctly fewer, or about the same number. If the first or last of these possibilities occurs, Doakes & Company files the figures (well out of sight somewhere) and tries again. Sooner or later, by the operation of chance, a test group is going to show a big improvement worthy of a headline and perhaps a whole advertising campaign. This will happen whether they adopt Doakes' or baking soda or just keep on using their same old dentifrice.
39
The importance of using a small group is this: \Vith a large group any difference produced by chance is likely to be a small one and unworthy of big type. A two-per-centimprovement claim is not going to sell much tooth paste.
How results that are not indicative of anything can be produced by pure chance-given a small enough number of cases-is something you can test for yourself at small cost. Just start tossing a penny. How often will it com,e up heads? Half the time, of course. Everyone knows that.
Well, let's check that and see .... I have just tried ten tosses and got heads eight times, which proves that pennies
BY ACTUAL TEST {one test J
••• . .. . - .. :; ~~·;: . .. . , ....... ..
Science proves that tossed pennies come up heads 80 per cent of the time.
~ ~
come up heads eighty per cent of the time. Well> by tooth paste statistics they do. Now try it yourself. You may get a fifty-fifty result, but probably you won't; your result, like mine, stands a good chance of being quite a ways away from fifty-fifty. But if your patience holds out for a thousand tosses you are ahnost (though not quite) cer-
MAGernsbacher
Highlight

HOW TO LIE Wrl'H.STATlSTICS
tain to come out with a result very close to half heads-a
result, that is, which represents the real probability. Only when there is a substantial number of trials involved is
the law of averages a useful description or prediction.
How many is enough? That's a tricky one too. It de~ pends among other things on how large and how varied
a population you are studying by sampling. And sometimes the number in the sample is not what it appears
to be. A remarkable instance of this came out in connection
with a test of a polio vaccine a few years ago. It appeared to be an in1pressively large-scale experiment as medical
ones go: 450 children were vaccinated in a community
and 680 were left unvaccinated, as controls. Shortly thereafter the community was visited by an epidemic.
Not one of the vaccinated children contracted a recog
nizable case of polio. · Neither did any of the controls. What the experimenters
had overlooked or not understood in setting up their project was the low incidence of paralytic polio. At the
usual rate, only two cases would have been expected in a group this size, and so the test was doomed from the
r
THE LITILE FIGURES THAT ARE NOT THERE •tl
start to have no meaning. Something like fifteen to twentyfive times this many children would have been needed to
obtain an answer signifying anything. Many a great, if :Heeti'ng, medical discovery has been
launched similarly. "Make haste,'· as one physician put it,
"to use a new remedy before it is too late."
The guilt does not always lie with the medical pro
fession alone. Public pressure and hasty journalism often launch a treatment that is unproved, particularly when the demand is great and the statistical background hazy.
So it was with the cold vaccines that were popular some years back and the antihistamines more recently. A good
MAGernsbacher
Callout
Remember this is from the 1950s, before we had a scientifically validated polio vaccine.

HOW TO LIE WITH STATISTICS
deal of the popularity of these unsuccessful "cures" sprang from the unreliable nature of the ailment and from a defect of logic. Given tirne, a cold will cure itself.
How can you avoid being fooled by unconclusive results? Must every man be his own statistician and study the raw data for himself? It is not that bad; there is a test of significance that is easy to understand. It is simply a way of reporting how likely it is that a test figure repre
sents a real result rather than something produced by chance. This is the little figure that is not there-on the assumption that you, the lay reader, wouldn't understand it. Or that, where there's an axe to grind, you would.
If the source of your information gives you also the degree of significance, you'll have a better idea of where you stand. This degree of significance is most simply expressed as a probability, as when the Bureau of the Census tells you that there are nineteen chances out of twenty that their figures have a specified degree of precision. For most purposes nothing poorer than this five per cent level of significance is good enough. For some the demanded level is one per cent, which means that there are ninety-nine chances out of a hundred that an apparent difference, or whatnot, is real . Anything this likely is sometimes described as "practically certain."
There's another kind of little figure that is not there, one whose absence can be just as damaging. It is the one that tells the range of things or their deviation from the average that is given. Often an average-whether mean or . median, specified or unspecified- is such an oversimplifica-
THE LITI'LE FIGURES THAT ARE NOT THERE 43
tion that it is worse than useless. Knowing nothing about a subject is frequently healthier than knowing what is not so, and a little learning may be a dangerous thing.
Altogether too much of recent American housing, for instance, has been planned to fit the statistically average family of 3.6 persons. Translated into reality this means
three or four persons, which, in turn, means two bedrooms. And this size family, "average" though it is, actually makes up a minority of all families. "We build average houses for average families," say the builders-and neglect the majority that are larger or smaller. Some areas, in consequence of this, have been overbuilt with two-bedroom houses, underbuilt in respect to smaller and larger units. So here is a statistic whose misleading incompleteness has had expensive consequences. Of it the American Public Health Association says: '"When we look beyond the arithmetical average to the actual range which it misrepresents, we £nd that the three-person and four-person families make up only 45 per cent of the total. Thirty-five per cent are one-person and two-person; 20 per cent have more than four persons."
Common sense has somehow failed in the face of the convincingly precise and authoritative 3.6. It has some-
MAGernsbacher
Highlight
MAGernsbacher
Highlight
MAGernsbacher
Highlight
MAGernsbacher
Callout
Recall that the 1950s saw a housing boom in the U.S., particularly in the suburbs.

HOW TO LIE WITH STATISTICS
how outweighed what everybody knows from observation: that many families are small and quite a few are large.
In somewhat the same fashion those little figures that
are missing from what are called "Gesell's norms" have
produced pain in papas and mamas. Let a parent read, as many have done in such places as Sunday rotogravure
sections, that "a child" learns to sit erect at the age of so
many months and he thinks at once of his own child. Let his child fail to sit by the specified age and the parent must conclude that his offspring is "retarded" or "subnormal"
or something equally invidious. Since half the children are bound to fail to sit by the time mentioned, a good
many parents are made · unhappy. Of course, speaking mathematically, this unhappiness is balanced by the joy
THE Ll'ITI..E FIGURES THAT ARE NOT THERE 45
of the other fifty per cent of parents in discovering that their children are "advanced." But hann can come of the efforts of the unhappy parents to force their children to
conform to the norms and thus be backward no longer. All this does not reflect on Dr. Arnold Gesell or his
methods. The fault is in the filtering-down process from
the researcher through the sensational or ill-informed writer to the reader who fails to miss the figures that have
disappeared in the process. A good deal of the misunderstanding can be avoided if to the "norm" or average is
added an indication of the range. Parents seeing that their
youngsters fall 'v''ithin the nom1al range will quit worrying about small and meaningless differences. Hardly anybody
is exactly normal in any way, just as one hundred tossed
pennies will rarely come up exactly fifty heads and fifty tails.
Confusing "normal" with "desirable" makes it all the
worse. Dr. Gesell simply stated some observed facts; it was the parents who, in reading the books and articles,
concluded that a child who walks late by a day or a month
must be inferior. A good deal of the stupid criticism of Dr. Alfred Kinsey's
well-known ( if hardly well-read) report came from taking uonnal to be equivalent to good, right, desirable. Dr.
Kinsey was accused of <.:orrupting youth by giving them
ideas and particularly by calling all sorts of popular but unapproved sexual practices normal. But he simply said
that he had found these activities to be usual, which is
what normal means, and be did not stamp them with any
MAGernsbacher
Text Box
MAGernsbacher
Callout
The Gesell Norms were infant development milestones that were published and popular in the 1950s.

HOW TO LIE WITH STATISTICS
seal of approval. Whether they were naughty or not did not come within what Dr. Kinsey considered to be his province. So he ran up against something that has plagued many another observer; lt is dangerous to mention any subject having high emotional content without hastily saying where you are for or agin it.
The deceptive thing about the little figure that is not there is that its absence so often goes unnoticed. That, of
course, is the secret of its success. Critics of journalism as practiced today have deplored the paucity of good oldfashioned leg work and spoken harshly of "Washington's armchair correspondents," who live by uncritically rewriting government handouts. For a sample of unenterprising journalism take this item from a list of "new
,,
:•
THE LITTLE FIGURES THAT ARE NOT THERE 47
industrial developments" in the news magazine Fortnight:
"a new cold temper bath which triples the hardness of steel, from Westinghouse."
No~ that sounds like quite a development ... until you try to put your finger on what it means. And then it be· comes as elusive as a ball of quicksilver. Does the new bath make just any kind of steel three times as hard as it. was before treatment? Or does it produce a steel three
times as hard as any previous steel? Or what does it do? It appears that the reporter has passed along some word~ without inquiring what they mean, and you are expected to read them just as uncritically for the happy illusion they give you of having learned something. It is all too reminiscent of an old definition of the lecture method of classroom instruction: a process by which the contents of the textbook of the instructor are transferred to the notebook of the student without passing through the heads of either party.
A few minutes ago, while looking up something about Dr. Kinsey in Time, I came upon another of those statements that collapse under a second look. It appeared in an advertisement by a group of electric companies in 1948. "Today, electric power is available to more than threequarters of U. S. farms .... " That sounds pretty good. Those power companies are really on the job. Of course, if you wanted to be ornery you could paraphrase it into "Almost one-quarter of U. S. farms do not have electric power available today." The real gimmick, however, is in that word "available," and by using it .the companies have

HOW TO LlE WITH STATISTICS
been able to say just about anything they please. Obviously this does not mean that all those fanners actually have power, or the advertisement surely would have said so. They merely have it "available"-and that, for all I know, could mean that the power lines go past their farms or merely within ten or a hundred miles of them.
WORLD WlDE AVAILABILITY o(Howtolie with Statisth:s"
-Areas within 25 miles of a railroad, motora&fe road, port or novigable waterway (dog sled routes not shown,)
Let me quote a title from an article published in Collier's in 1952: "You Can Tell Now HOW TALL YOUR CHILD WILL GROW." With the article is conspicuously displayed a pair of charts, one for boys and one for girls, showing what percentage of his ultimate height a child reaches at each year of age. ''To determine your child's height at maturity," says a caption, "check present meas·
urement against chart." The funny thing about this is that the article itself-if
you read on-tells you what the fataJ weakness in the chart
'I
THE LITTLE FIGURES THAT ARE NOT THERE
is. Not all children grow in the same way. Some start slowly and then speed up; others shoot up quickly for a while, then level off slowly; for still others growth is a relatively steady process. The chart, as you might guess, is based on averages taken from a large number of measurements. For the total, or average, heights of a hundred youngsters taken at random it is no doubt accurate enough, but a parent is interested in only one height at a time, a purpose for which such a chart is virtually worthless. It you wish to know how tall your child is going to be, you can probably make a better guess by taking a look at his
. ·: , • •
::;,.;,;/t::.· ....
. ·~:-:;t:1
parents and grandparents. That method isn•t scientific and precise like the chart, but it is at least as accurate.
I am amused to note that, taking my height as recorded when 1 enrolled in high-school military training at fourteeLl and ended up in the rear rank of the smallest squad. I should eventually have grown to a bare five feet eight. I am Hve feet eleven. A three-inch error in human height come, down to a poor grade of guess.
MAGernsbacher
Highlight

HOW TO LIE WITH STATISTICS
Before me are wrappers from two boxes of Grape-Nuts Flakes. They are slightly different editions, as indicated by their testimonials: one cites Two-Gun Pete and the other says, "H you want to be like Happy ... you've got to eat like Hoppyl" Both offer charts to show ("Scientists proved it's true!" ) that these flakes "start giving you energy in 2 minutes!" In one case the chart hidden in these forests of exclamation points has numbers up the side; in
the other case the numbers have been omitted. This is just as well, since there is no hint of what the numbers mean. Both show a steeply climbing red line ("energy
tO
5 ~.;,
I
~ ..... .I ~ .... -~ ,.c.'·.-
•\'+-"
0 TIMt Of fATING I MINIITi LAlli
~ ' "
~ -+-"-<+>
""
release"), but one has it starting one minute after eating Crape-Nuts Flakes, the other two minutes later. One line climbs about twice as fast as the other, too, suggesting that even the draftsman didn't think these graphs meant
QOythin~.
THE LITTLE FIGl . .IRES THAT A.RE NOT TUER.t;
Such foolishness could be found only on material meant for the eye of a juvenile or his morning-weary parent, of course. No one would insult a big businessman's intelligence with such statistical tripe ... or would he? Let me tell you about a graph used to advertise an advertising agency ( I hope this isn't getting confusing) in the rather special columns of Fortune magazine. The line on this graph showed the impressive upward trend of the agency's business year by year. There were no numbers. With equal honesty this chart could have represented a tremendous growth, with business doubling or increasing by
1973 1924 192S 1976 1927 l928 l979 1930 1931
millions of dollars a year, or the snail-like progress of a static concern adding only a dollar or two to its annual billings. It made a striking picture, though.
Place little faith in an average or a graph or a trend when those important figures are missing. Otherwise you
MAGernsbacher
Highlight
MAGernsbacher
Highlight

HOW TO LIE WITH STATISTICS
are as blind as a man choosing a camp site from a report of mean temperature alone. You might take 61 degrees as a comfortable annual mean. giving you a choice in California between such areas as the inland desert and San
Nicolas Island off the south coast. But you can freeze or
roast if you ignore the range. For San Nicolas it is 47 to 87 degrees but for the desert it is 15 to 104.
Oklahoma City can claim a similar average temperature
for the last sixty years: 60.2 degrees. But as you can see from the chart below, that cool and comfortable figure conceals a range of 130 degrees.
Record Temperatures in Oklahoma City 1890-1952
Highest liZ'
l Range 1300
100
•
40
20
0 Lowest
-·~ -20
~ ~~
- · ~·"
~ , J
i''
l:J:r ---~~ .1--
Record Hl&bs-~
• ''tc r.:~ • ' . -.:
~" ~ , ~~ 1/ 1\ .,
~ Record tows-
~
I-!I.
,.-
~
~~ ~
(
J f Ill A I J J A S 0 I I -- ·
CHA PT ER 4
Much Ado about
Practically Nothing
IF YOU don't mind, we will begin by endowing you with two children. Peter and Linda (we might as well give
them modish names while we're about it) have been given
intelligence tests, as a great many children are in the
course of their schooling. Now the mental test of any
variety is one of the prime voodoo fetishes of our time,
so you may have to argue a little to find out the results of the tests; this is information so esoteric that it is often held
to be safe only in the hands of psy<:hologists and educators,
and they may be right at that. Anyway, you learn some· how that Peter's IQ is 98 and Linda's is 101. You know,
of course, that the IQ is based on 100 as average or "normal."
Aha. Linda is your brighter child. She is, furthermore,
53
MAGernsbacher
Text Box
foolish

54 HOW TO LIE WITH ST~TISTICS
above ave~ag~. Peter is below average, but let's not dwell
on that. . Any such conclusions as these are sheer nonsense. Just to clear the air, let's note first of all that whatever
an intelligence test measures it is not quite the same thing as we usually mean by intelligence. It neglects such im
portant things as leadership and creative imagination.
It takes no account of social judgment or musical or artistic or other aptitudes, to say nothing of such personality matters as diligence and emotional balance. On top of that, the tests most often given in schools are the quickand-cheap group kind that depend a good deal upon reading facility; bright or not, the poor reader hasn't a
chance. Let's say that we have recognized all that and agree
to regard the IQ simply as a measure of some vaguely
MUCH ADO ABOUT PRACTlCALLY NOTIDNG 55
defined capacity to handle canned abstractions. And Peter and Linda have been given what is generally regarded as the best of the tests, the Revised Stanford-Binet, which is administered individually and doesn't call for any particular reading ability.
Now what an IQ test purports to be is a sampling of the intellect. Like any other product of the sampling method, the IQ is a figure with a statistical error, which expresses the precision or reliability of that figure.
Asking these test questions is something like what you might do in estimating the quality of the corn in a field by going about and pulling off an ear here and an ear there at random. By the time you had stripped down and looked at a hundred ears, say, you would have gained a pretty good idea of what the whole field was like. Your infomwt!on would be exact enough for use in comparing this field with another field-provided the two fields were not very similar. If they were, you might have to look at many more ears, rating them all the while by some precise standard of quality.
How accurately your sample can be taken to represent the whole field is a measure that can be represented in figures: the probable error and the standard error.
Suppose that you had the task of measuring the size of a good many fields by pacing off the fence lines. The first thing you might do is check the accuracy of your measuring system by pacing off what you took to be a hundred yards, doing this a number of times. You might find that on the average you were off by three yards. That is, you

'fi HOW TO LIE WITH STATISTICS
fA~ ~
,Ji ---------· -----· ----------------l~-~--- .... -- ........ ___ ._.., ___ ----------------I 00 '(,...,_R OS
came within three yards of hitting the exact one hundred in half your trials, and in the other half of them you missed
by more than three yards. Your probable error then would be three yards in one
hundred, or three per cent. From then on, each fence line that measured one hundred yards by your pacing might
be recorded as 100 ± 3 yards. (Most statisticians now prefer to use another, but com
parable, measurement called the standard error. It takes in about two-thirds of the cases instead of exactly half and is considerably handier in a mathematical way. For our purposes we can stick to the .probable error, whi~h is the one still used in connection with the Stanford-Bmet.)
As with our hypothetical pacing, the probable error ot the Stanford-Binet IQ has been found to be three per cent. This has nothing to do with how good the test is basically, only with how consistently it measures whatever it measures. So Peter's indicated IQ might be more fully expressed as 98 ± 3 and Linda's as 101 ± 3.
This says that there is no more than an even chance that Peter's IQ falls anywhere between 95 and 101; it is just
I
t
MUCH ADO ABOUT PRACTICALLY NOTHING 'jJ
as likely that it is above or below that figure. Similarly Linda's has no better than a fifty-fifty probability of being within the range of 98 to 104. From this you can quickly see that there is one chance in four that Peter's IQ is really above 101 and a similar chance that Linda's is below 98. Then Peter is not inferior hut superior, and by a margin of anywhere from three points up.
What this comes down to is that the only way to think about IQs and many other sampling results is in ranges. "Normal" is not 100, but the range of 90 to 110, say, and there would be some point in comparing a child in this range with a child in a lower or higher range. But comparisons between figures with small differences are meaningless. You must always keep that plus-or-minus in mind, even (or especially) when it is not stated.
Ignoring these errors, which are implicit in all sampling studies, has led to some remarkably silly behavior. There are magazine editors to whom readership surveys are gospel. mainly because they do not understand them. With forty per cent male readership reported for one article and only thirty-five per cent for another, they demand more articles like the first.
The difference between thirty-five and forty per cent readership can be of importance to a magazine, but a survey difference may not be a real one. Costs often hold reader.c;hip samples down to a few hundred persons, particularly after those who do not read the magazine at all have been eliminated. For a magazine that appeals primarily to women the number of men in the sample may

HOW TO LIE WITH STATISTICS
be very small. By the time these have been divided among those who say they "read all," "read most," "read some,"
. or "didn't read" the article in question, the thirty-five per
cent conclusion may be based on only a handful. The
probable error hidden behind the impressively presented
figure may be so large that the editor who relies on it is
grasping at a thin straw.
Sometimes the big ado is made about a difference that
is mathematically real and demonstrable but so tiny as to
have no importance. This is in defiance of the fine old
saying that a difference is a difference only if it makes a difference. A case in point is the hullabaloo over prac
tically nothing that was raised so effectively, and so profit
ably, by the Old Gold cigarette people. It st:uted innocently with the editor of the Reader's
Digest, who smokes cigarettes but takes a dim view of
them all the same. His magazine went to work and had a battery of laboratory folk analyze the smoke from sev
eral brands of cigarettes. The magazine published the results, giving the nicotine and whatnot content of the
smoke by brands. The conclusion stated by the magazine
and borne out in its detailed figures was that all the brands were virtually iden tical and that it didn't make any dif
ference which one you smoked. Now you might think this was a blow to cigarette
manufacturers and to the fellows who think up the new copy angles in the advertising agencies. It would seem
to explode all advertising claims about soothing throats and kindness to T -zones.
~ ·
1 :.
:r .·:
if ,.
'( ,
MUCH ADO ABOUT PRACI1CALLY NOTHING 59 But somebody spotted something. In the lists of almost
identical amounts of poisons, one cigarette had to be at the bottom, and the one was Old Gold. Out went the telegrams, and big advertisements appeared in news
papers at once in the biggest type at hand. The headlines
and the copy simply said that of all cigarettes tested by this great national magazine Old Gold had the least of
these undesirable things in its smoke. Excluded were all 6gures and any hint that the difference was negligible.
In the end, the Old Gold people were ordered to "cease and desist" from such misleading advertising. That didn't make any difference; the good had been milked from the
idea long before. As the New Yo,.ker says, there'll always be an ad man.
/, 1-J.-" I I hkA_ tieL~"~-- 1 ~~~?cure&~~
~ .. .
-----V
MAGernsbacher
Highlight

I
CHAPTER 5
~.}-+-f'j+-~The Gee-- Whiz Graph 1/
THERE is terror in numbers. Humpty Dumpty's confidence in telling Alice that he was master of the words he used
would not be extended by many people to numbers. Perhaps we suf!er from a trauma induced by grade-school
arithmetic. Whatever the cause, it creates a real problem for the
writer who yearns to be read, the advertising man who
expects his copy to sell goods, the pubhsher who wants his books or magazines to be popular. When numbers in tabular form are taboo and words will not do the work
well, as is often the case, there is one answer left: Draw
a picture. About the simplest kind of statistical picture, or graph,
is the line variety. It is very useful for showing trends,
6o
' I
(
THE GEE·WHIZ GRAPH 6t
something practically everybody is interested in showing or knowing about or spotting or deploring or forecasting.
We1llet our graph show how national income increased ten per C'ent in a year.
Begin with paper ruled into squares. ~ame the months along the bottom. Indicate billions of dollars up the side.
Plot your points and draw your line, and your graph will
look like this:
~+
2.2. ~~·~ -2.0
1S
"' 16 ~
~ t+ ~ 12. c 0 10
- s cC
6
4
.2.
. -1\~ ~r~~~ '· >? ~
~ ~~ !,/ llo....
L ~lls;l/ ~ .. l - "'V ~ L\
1e~ ...... ~7 >i '/ -(..;; .J ~""(·
\ ~ ~lao ~ -1..~ j
I-' -I ~ ......
"'"' ~ 0 JfMA MJJ ASOND
Now that's clear enough. It shows what happened
during the year and it shows it month by month. He who
runs may see and understand, because the whole graph is in proportion and there is a zero line at the bottom for

HOW TO LIE WITH STATISTICS
comparison. Your ten per cent looks like ten per cent-an upward trend that is substantial but perhaps not overwhelming.
That is very well if all you want to do is convey information. But suppose you wish to win an argument, shock a reader, move him into action, sell him something. For that, this chart lacks sclunaltz. Chop off the bottom.
J;j t:~ !! ~g;;e:~etj::j J FM AM.J J ASONO
Now that's more like it. (You've saved paper too, something to point out if any carping fellow objects to your misleading graphics.) The figures are the same and so is the curve. It is the same graph. Nothing has been falsified-except the impression that it gives. But what the hasty reader sees now is a national-income line that has climbed halfway up the paper in twelve months, all because most of the chart isn't there any more. Like the missing parts of speech in sentences. that you met in grammar classes, it is "understood." Of course, the eye doesn't ··understand" what isn't there, and a small rise has become, visually, a big one.
Now that you have practiced to deceive, why stop with truncating? You have a further trick available that's worth a dozen of that. It will make your modest rise of ten per cent look livelier than one hundred per cent is entitled to
THE GEE-wmz GRAPH
look. Simply change the proportion between the ordinate and the abscissa. There's no rule against it, and it does give your graph a prettier shape. All you have to do is let each mark up the side stand for only one-tenth as many Jollars as before.
(f) 2.1 .6 1---1---1--+-~
~
0 21.+ 1---t--+. .... ,.......
~ 2.l-'2. rTl\iftZ~~~r. 0 2.1 .0 1-+-~~-"'~':--fo~~HH-ff-t--t--t--i
cc zo.a
2o.o LJ__l__J~::t:::::iJIU.Il_L_L_l_L...J J F M A M J J A 5 0 N D
That is impressive, isn't it? Anyone looking at it can just feel prosperity throbbing in the arteries of the country. It is a subtler equivalent of editing "National income rose ten per cent" into " ... climbed a whopping ten per cent." It is vastly more effective, however, because it contains no adjectives or adverbs to spoil the illusion of objectivity. There's nothing anyone can pin on you.

HOW TO LIE WITH STATISTICS
And you're in good, or at least respectable, company. Newsweek magazine used this method to show that "Stocks Hit a 21-Ycar High" in 1951, truncating the graph at the eighty mark. A Columbia Gas System advertisement in Time in 1952 reproduced a chart "from our ne"' Annual Report." If you read the little numbers and analyzed them you found that during a ten-year period living costs went up about sixty per cent and the cost of
gas dropped four per cent. This is a favorable picture, but it apparently was not favorable enough for Columbia Gas. They chopped off their chart at ninety per cent (with no gap or other indication to warn you) so that this was what your eye told you: Living costs have more than tripled, and gas has gone down one-third!
Steel companies have used similarly misleading graphic methods in attempts to line up public opinion against wage increases. Yet the method is far from new, and its impropriety was shown up long ago-not just in technical publications for statisticians either. An editorial writer in Dun's Review in 1938 reproduced a chart from an advertisement advocating advertising in Washington, D. C., the argument being nicely expressed in the headline over the chart: GOVERNMENT PAY ROLLS UP! The line in the graph went along with the exclamation point even though the figures behind it did not. What they showed was an increase from about $19,500,000 to $20,-200,000. But the red line shot from near the bottom of the graph clear to the top, making an increase of under four per cent look like more than 400. The magazine gave its
own graphic version of the same figures alongside-an
Till: GEE-WHI:£ GHAPH
honest red line that rose just four per cent, under this caption: GOVERNMENT PAY ROLLS STABLE.
~~-!0~.~0- J_-
' i I I I ! I
I I
i
I I I I I I I I I I I
-+-+-+-+-+--: I l I I
i I I j · 1 1 ' I l ~ I I
Collier's has used this same treatment with a bar chart in newspaper advertisements . Note especially that the middle of the chart has been cut out :
3,2oo,ooo.----------
3,150,000 1----·3
From an April 24, 1953, newspaper advertisement for Cou.rnR's

~ CHAPTER 6
The One ,. Dimensional Picture
A DECADE or so ago you heard a good deal about the little people, meaning practically all of us. When this began to sound too condescending, we became the common man. Pretty soon that was forgotten too, which was probably just as well. But the little man is still with us. He is the character on the chart.
A chart on which a little man represents a million men, a rnoneybag or stack of coins a thousand or a billion dollars, an outline of a steer your beef supply for next year, is a pictorial graph. It is a useful device. It has what I am afraid is known as eye-appeal. And it is capable of becoming a fluent, devious, and successful liar.
The daddy of the pictorial chart, or pictograph, is the
66
I
\
THE ONE-DIMENSIONAL PICI'URE
ordinary bar chart, a simple and popular method of representing quantities when two or more are to be compared. A bar chart is capable of deceit too. Look with suspicion on any version in which the bars change their widths as well as their lengths while representing a single factor or in which they picture three-dimensional objects the volumes of which are not easy to compare. A truncated bar chart has, and deserves, exactly the same reputation as the truncated line graph we have been talking about. The habitat of the bar chart is the geography book, the corporation statement, and the news magazine. This is true also of its eye-appealing offspring.
Perhaps I wish to show a comparison of two figures-the average weekly wage of carpenters in the United States and Rotundia, let's say. The sums might be $60 and $30. I wish to catch your eye with this, so I am not satisfied merely to print the numbers . . I make a bar chart. (By the way, if that $60 figure doesn't square with the huge sum you laid out when your porch needed a new railing last summer, remember that your carpenter may not have done as well every week as he did while working for you. And anyway I didn't say what kind of average I have in mind or how I arrived at it, so it isn't going to get you anywhere to quibble. You see how easy it is to hide behind the most disreputable statistic if you don't include any other information with it? You probably guessed I just made this one up for purposes of illustration, but 111 bet you wouldn't have if I'd used $59.83 instead. )

68 HOW TO LJE WITH STATISTICS
"' " 6o Ill Ill ~ 4o !{ II 0. 90 Ill ( ( 1o ... ..1 0 so 0
0 II.OTUNOI/'\ u.s.A.
There it is, with dollars-per-week indicated up the left side. lt is a clear and honest picture. Twice as much money is twice as big on the chart and looks it.
The chart lacks that eye-appeal though, doesn't it? I can easily supply that by using something that looks more like money than a bar does: moneybags. One moneybag
for the unfortunate Rotundian's pittance, two for the American's wage. Or three for the Rotundian, six for the American. Either way, the chart remains honest and clear, and it will not deceive your hasty glance. That is the wav an honest pictograph is made.
That would satisfy me if all I wanted was to communicate information. But I want more. I want to say that the American workingman is vastly better off than the Rotun-
\
'·
THE ONE-DIMENSIONAL PICIURE
dian, and the more I can dramatize the difference between thirty and sixty the better it will be for my argument. To tell the truth (which, of course, is what I am planning not to do), I want you to infer something, to come away with an exaggerated impression, but I don't want to be caught at my tricks. There is a way, and it is one that is being used every day to fool you .
I simply draw a moneybag to represent the Rotundian's
thirty dollars, and then I draw another one twice as tall to represent the American's sixty. That's in proportion, isn't it?
Now that gives the impression I'm after. The American's wage now dwarfs the foreigner's.
The catch, of course, is this. Because the second bag is twice as high as the .first, it is also twice as wide. It occupit:s not twice but four times as much area on the page. The numbers still say two to one, but the visual impiession, which is the dominating one most of the time, says the ratio is four to one. Or worse. Since these are

HOW TO LIE WITH STATISTICS
pictures of objects having in reality three dimensions, the second must also be twice as thick as the first. As your geometry book put it, the volumes of similar solids vary as the cube of any like dimension. Two times two times two is eight . If one money bag holds $30, the other, having eight times the volume, must hold not $60 but $240.
And that indeed is the impression my ingenious little chart gives. While saying "twice," I have left the lasting
impression of an overwhelming eight-to-one ratio. You'll have trouble pinning any criminal intent on me,
too. I am only doing what a great many other people do. Newsweek magazine has done it- with moneybags at that,
The American Iron and Steel Institute has done it, with a pair of blast furnaces. The idea was to show how the industrv's steelmaking capacity had boomed between the 1930s and the 1940s and so indicate that the industry was doing such a job on its own hook that any governmental interference was uncalled for. There is more merit in the principle than in the way it was presented. The blast furnace representing the ten-million-ton capacity added in the '30s was drawn just over two-thirds as tall as the one for the fourteen and a quarter million tons added in the '40s. The eye saw two furnaces, one of them close to three times as big as the other. To say "almost one and one-half' and to be heard as ''three"-that's what the onedimensional picture can accomplish.
This piece of art work by the steel people had some other points of interest. Somehow the second furnace had fattened out horizontally beyond the proportion of its
J I: I
THE ONE-DIMENSIONAL PICTURE
STEEL CAPACITY ADDED
Adapted by courtesy of STEELWAYS.
neighbor, and a black bar, suggesting molten iron, had become two and one-half times as long as in the earlier decade. Here was a 50 per cent increase given, then drawn as 150 per cent to give a visual impression ofun1ess my slide rule and I are getting out of their depth -over 1500 per cent. Arithmetic becomes fantasy.
( It is almost too unkind to mention that Jhe same glossy four-color page offers a fair-to-prime specimen of the truncated line graph. A curve exaggerates the per-capita growth of steelmaking capacity by getting along with the lower half of its graph missing. This saves paper and doubles the rate of climb. )
Some of this may be no more than sloppy draftsmanship. But it is rather like being short-changed: When all the
mistakes are in the cashier's favor, you can't help wondering.

HOW TO LIE WITH STATISTICS
Newsweek once showed how "U. S. Old Folks Grow Older" by means of a chart on which appeared two male figures, one representing the 68.2-year life expectancy of today, the other the 34-year life expectancy of 1879-1889. It was the same old story: One figure was twice as tall as the other and so would have had eight times the bulk or weight. This picture sensationalized facts in order to make a better story. I would call it a form of yellow journalism. The same issue of the magazine contained a truncated, or
gee-whiz, line graph.
THE CRESCIVE COW
~ ror 186o
There is still another kind of danger in varying the size of objects in a chart. It seems that in 1860 there were something over eight million milk cows in the United States and by 1936 there were more than twenty-five million Showing this increase by drawing two cows, one three times the height of the other, will exaggerate the impression in the manner we have been discussing. But the effect on the hasty scanner of the page may be even stranger: He may easily come away with the idea that cows are bigger now than they used to be.
THE DIMINISHING RHINOCEROS
Apply the same deceptive technique to what has happened to the rhinoceros population and this is what you get. Ogden Nash once rhymed rhinosterous with preposterous. That's the word for the method too.