
U.S. Private Equity Mergers & Acquisitions Activity€¦ · U.S. Private Equity M&A observations...
15
Q3 2019 Quarterly Insights U.S. Private Equity Mergers & Acquisitions Activity
Transcript of U.S. Private Equity Mergers & Acquisitions Activity€¦ · U.S. Private Equity M&A observations...

Q3 2019 Quarterly Insights
U.S. Private Equity Mergers
& Acquisitions Activity

Contents
Private Equity Activity
General Deal Overview
Deals by Size
Deals by Industry
Add-on Activity
Private Equity Overhang
Fundraising & Capital
Debt vs Equity
Private Equity Buyout Structure
Exits
Valuations
Who is buying
4
5
6
7
8
9
10
11

2
U.S. Private Equity M&A observations – 2019 YTD*
Source: PitchBook, LCD
* As of 9/30/2019
the
longest stock market bull run in history and a relatively strong economy. Valuations are at historic highs, and
PE sponsors have an incredible inventory of available capital. While the overall M&A market is showing strains
and has slowed from last year’s pace, PE activity remains strong by historic measures.
During 2019, we are witnessing the same phenomena that we have seen over the last several years in PE-
driven M&A:
• A historically high number of annual M&A transactions
• A continued buying frenzy among PE bidders at historically high multiples of EBITDA being paid due to an
oversupply of capital chasing too few quality companies/transactions
• PE funds continue to raise a record amount of capital from very willing limited partners
• Debt providers, particularly cash flow lenders, continue to provide historically cheap and available debt
financing
• Strategic balance sheets remain similarly very strong, a result of the very robust and growing U.S. economy
over the last ten years, accelerated by the Jobs Act of 2017
This activity has only recently been somewhat muted by selective macro economic issues, including tariff wars,
continued geopolitical tensions, slowing global economies and U.S. manufacturing output and continued
uncertainty regarding Brexit. Every cycle has uncertainty, and the question is whether an even short-term
economic slowdown can slow down this unprecedented M&A environment in private equity.
In our recent conversations with a wide variety of financial buyers of businesses, ranging from large and middle
market PE funds to family offices and fundless sponsors, several key themes are consistently repeated:
• Acknowledgement regarding how competitive the market is; consequently, that applies an upward force on
multiples while shortening the required diligence time frame to close a deal in order to prevail in an M&A
auction
• Increased use of “sponsor fund lines of credit” to remove the uncertainty of third-party financing
• Many generalist middle market firms are reviewing 1,000+ deals on an annualized basis, and on average
investing in only two or three platforms per year
• A focus on chasing transactions where the PE firm knows it can 1) have a very strong “angle” on the
business and believe that they can accelerate organic growth, 2) add scale and lower their blended
acquisition multiple by pursuing tuck-in acquisitions, and 3) therefore, be ultra competitive on pricing
• While deal volume remains high, PE firms are seeing “lower quality” businesses (i.e. customer
concentration, high capital expenditures relative to EBITDA, business cyclicality, flat or declining revenues
and/or compressed operating margins), with such businesses still trying to extract large multiples
With the Great Recession now one full decade in the rearview mirror,
we are still witnessing a historic M&A bull market among private equity (PE) players,
Kent Adams
Managing Director
Middle Market M&A
and Financial
Sponsor Coverage
Tim Ludwick
Vice President
Middle Market M&A
and Financial
Sponsor Coverage
The charts on the following pages support our view and what we are witnessing in the market. We continue to remain bullish given the
amount of capital (both equity and debt), available for transactions in the marketplace and no signs of a major market slowdown in PE
activity without a force majeure event or sustained economic slowdown in the U.S. Our bullishness is supported by the velocity by
which PE firms are participating in transactions for privately held businesses, including founder-owned, entrepreneurial led and PE
sponsor owned. PE is in the business of buying and selling businesses, and as average hold times have decreased, we continue to
expect an active M&A market over the next 12 months as owners seek to capitalize on the current bull market, and mitigate risk of
prolonged economic expansion and/or the 2020 election results.

3
U.S. Private Equity M&A observations – 2019 YTD*
$441bn
Total PE deal activity in
2019* down from $516bn
in Q1-Q3 2018, but
historically high level
29% Percentage of total
deals completed in the
IT sector, the most
active PE sector
6.0x
Average total debt to
EBITDA
$174bn
Total sponsor backed
transaction loan volume
$205mm
Median PE deal size,
up from $190.0mm
in 2018
Source: PitchBook, LCD
* As of 9/30/2019
$191bn
Total private equity
dollars raised
12.2x
Average EV/EBITDA
multiple paid by PE
firms, a historic high
3,883
Number of PE
transactions closed
40+ Advisory transactions
completed by BMO
and involving PE
since Q3 2018

4
General Deal Overview
Source: PitchBook
* As of 9/30/2019
Private Equity Activity
Deal volume in terms of both value and quantity through Q3 are
on pace to continue the bullish PE M&A run seen over the past ten years
Through the first three quarters of 2019, the total
number of U.S. private equity M&A deals is slightly
lagging the first three quarters of 2018, and the total
dollar value of such deals is also lower by 2%
Historically, deal value and quantity have strengthened
in the latter half of a respective year; however, it will
require a surge in activity in the last quarter of 2019 to
surpass the record levels of 2018 activity
The odds of a strong final quarter are met with
uncertainty with escalating geopolitical tension, slower
economic growth and a looming election year
Deal Activity – Annual Comparison, 2008 – 2019 YTD*
Share percentage of deal activity by deal value
`18YTD `19YTD*
35%
40%
25%33%
31%
36% Q1
Q2
Q3
$3
12
$1
41
$2
81
$3
29
$3
82
$4
38
$5
35
$5
61
$6
08
$6
31
$7
27
$5
16
$5
01
2,763
1,916
2,784
3,173
3,571 3,443
4,273 4,460 4,445
4,774
5,270
3,9733,883
0
1,000
2,000
3,000
4,000
5,000
6,000
$0
$150
$300
$450
$600
$750
$900
2008 2009 2010 2011 2012 2013 2014 2015 2016 2017 2018 '18YTD '19YTD
Deal value ($B) Deal count (thousands)

5
Deals by Size
Source: PitchBook, FactSet
* As of 9/30/2019
Private Equity Activity
The middle market of PE M&A transactions continues to dominate in terms
of number of transactions and overall deal value volume. Billion dollar transactions, which
comprise less than 2% of the number of all deals, comprise 30% of total deal value
Enterprise Value – Annual Comparison, 2015 – 2019 YTD*
Since 2015, over
90% of the number of
closed PE M&A
transactions have
had enterprise values
of less than $500mm
Number of PE M&A
Deals by Size
Value of PE M&A
Deals by Size
Transaction values
ranging $100mm to
$1bn comprise 57%
of total deal value
since 2015
$Bn
$73 , 3%
$238 , 9%
$1,059 , 42%
$346 , 14%
$295 , 12%
$515 , 20%
2015 - 2018
Under $25M
$25M-$100M
$100M-$500M
$500M-$1B
$1B-$2.5B
$2.5B+
$12 , 3%
$54 , 12%
$205 , 47%
$58 , 13%
$33 , 7%
$80 , 18%
2019 YTD*
8,795, 46%
4,639, 25%
4,728, 25%
514, 3%197, 1%
79, 1%
2015 - 2018
Under $25M
$25M-$100M
$100M-$500M
$500M-$1B
$1B-$2.5B
$2.5B+
692, 36%
530, 28%
457, 24%
206, 11%
17, 1% 9, 1%
2019 YTD*

6
$80 , 3%
$479 , 19%
$323 , 13%
$215 , 9%$235 ,
9%
$505 , 20%
$691 , 27%
2015 - 2018
Materials & resources
IT
Healthcare
Financial services
Energy
B2C
B2B
$13 , 3%
$112 , 25%
$54 , 12%
$32 , 7%
$35 , 8%
$69 , 16%
$126 , 29%
2019 YTD*
PE M&A Transactions by Industry
Source: PitchBook, FactSet
* As of 9/30/2019
Private Equity Activity
B2B sector accounts for one-third of all PE
deals, B2B + IT deals comprise nearly half of PE deal value
Industry Sector Activity – Annual Comparison, 2015 – 2019 YTD*
Total Number of Deals by Sector
Total Value of Deals by Sector
The number of private equity
transactions by sector has
remained fairly balanced
over the past five years
Investments in the IT and
B2B sectors from 2015-2018
led all deal activity with 17%
and 34%, respectively; they
continue to be the strong
sectors through 2019 YTD*
at 19% and 37%,
respectively
Total deal values by sector
tend to fluctuate by a greater
degree year-over-year due
to large transactions that
deviate from the norm
Higher valuations in the IT
sector continue to dominate
the landscape and account
for $112bn of total deal value
YTD, up from $78bn YTD in
2018
$Bn
0%
10%
20%
30%
40%
50%
60%
70%
80%
90%
100%
2015 2016 2017 2018 2019*
B2B
B2C
Energy
Financial services
Healthcare
IT
Materials & resources

7
Add-on Activity
Source: PitchBook, FactSet
* As of 9/30/2019
Private Equity Activity
PE backed portfolio companies are increasingly utilizing
tuck-in acquisitions to drive growth and value creation
Buyout Activity - Platform vs. Add-on, 2008 – 2019 YTD*
The percentage of PE acquisitions which comprise add-ons for existing portfolio companies has grown nearly each
of the past 10 years and now comprise two-thirds of all PE transactions
Number of Deals by Add-on Percentage
1,1
48
795
1,2
03
1,4
18
1,6
11
1,5
50
2,0
25
2,1
25
2,2
24
2,3
29
2,7
26
1,7
22
53%57% 56%
58% 57%61% 62% 62%
65% 64%66%
68%
0%
10%
20%
30%
40%
50%
60%
70%
80%
0
500
1,000
1,500
2,000
2,500
3,000
2008 2009 2010 2011 2012 2013 2014 2015 2016 2017 2018 2019*
Add-on Add-on % of buyout

8
$151
$218
$238
$196
$121
$191
265251 249
207
131
0
50
100
150
200
250
300
$0
$50
$100
$150
$200
$250
2015 2016 2017 2018 '18YTD '19YTD
Capital raised ($B) Fund count
Capital Activity
Source: PitchBook, Bloomberg
* As of 9/30/2019
Private Equity Overhang
Given strong overall returns and the amount of capital that
institutional LPs have to deploy, PE fundraising is expected to continue
to be very strong from both middle market and mega PE funds
Capital Raised and PE Fund Count, 2015 – 2019 YTD*
The fundraising
environment remains
robust, with significant
institutional interest in
private equity investing
given strong, consistent
returns
Fundraising in the first
three quarters of 2019
appears to be slightly
declining in terms of the
number of new funds
closed; however, the total
capital raised has almost
surpassed the 2018 full-
year figure of $196bn
For comparison, as of
September 30th, 2018,
there were 143 closed
funds with approximately
$121bn of capital raised
Mega-funds ($5+ billion)
were the driving force in
the first three quarters of
2019. Blackstone closed
the largest PE fund ever
raised at $24.7bn, a title
previously held by Apollo
Global Management
PE Fundraising
Activity
143
0%
10%
20%
30%
40%
50%
60%
70%
80%
90%
100%
2015 2016 2017 2018 2019*
$5B+
$1B-$5B
$500M-$1B
$250M-$500M
$100M-$250M
Under $100M

9
PE Buyout Structure
Source: PitchBook
Note: Due to rounding, the above numbers presented may not add up precisely to the totals indicated
Debt vs Equity
While average debt leverage is near record highs, as a total percentage of enterprise value, it
has slowly tempered vis-à-vis equity in recent years as EV/EBITDA multiples have expanded
Debt Capital / Equity Capital in PE Transactions
With relatively cheap
debt financing available,
in large quantities,
combined with high
multiples being paid, a
perfect storm exists for
deploying both debt and
equity capital to finance
PE transactions, with a
greater percentage
coming from equity, on
average
Sponsors are
increasingly taking only
moderate leverage at
close but will build in
flexibility to take debt
above closing leverage in
order to aggressively
pursue acquisitions
Higher leverage multiples
are an indication of both
strong deal flow quality
and sustained market
optimism
Debt Percentage
of PE Buyouts
42%
44%
46%
48%
50%
52%
54%
56%
58%
1Q 2Q 3Q 4Q 1Q 2Q 3Q 4Q 1Q 2Q 3Q 4Q 1Q 2Q 3Q 4Q 1Q 2Q 3Q
2015 2016 2017 2018 2019*
5.6
x
5.3
x
5.5
x
5.3
x
5.5
x
5.1
x
5.7
x
5.3
x
5.6
x
6.0
x
5.9
x
6.1
x
5.9
x
5.8
x
6.1
x
5.8
x
6.1
x
5.9
x
5.9
x
4.5
x
4.2
x
4.4
x
4.5
x
4.8
x
5.2
x 5.7
x
5.3
x
5.6
x
5.8
x
5.6
x
5.8
x
5.6
x
5.6
x
6.1
x
5.8
x
6.2
x
6.4
x
6.0
x
10.2x9.6x
9.9x 9.8x10.4x 10.3x
11.4x
10.5x11.2x
11.9x
11.4x11.9x 11.5x 11.5x
12.3x11.5x
12.3x12.3x
11.9x
0.x
2.x
4.x
6.x
8.x
10.x
12.x
14.x
1Q 2Q 3Q 4Q 1Q 2Q 3Q 4Q 1Q 2Q 3Q 4Q 1Q 2Q 3Q 4Q 1Q 2Q 3Q
2015 2016 2017 2018 2019*
Debt/EBITDA Equity/EBITDA EV/EBITDA
10
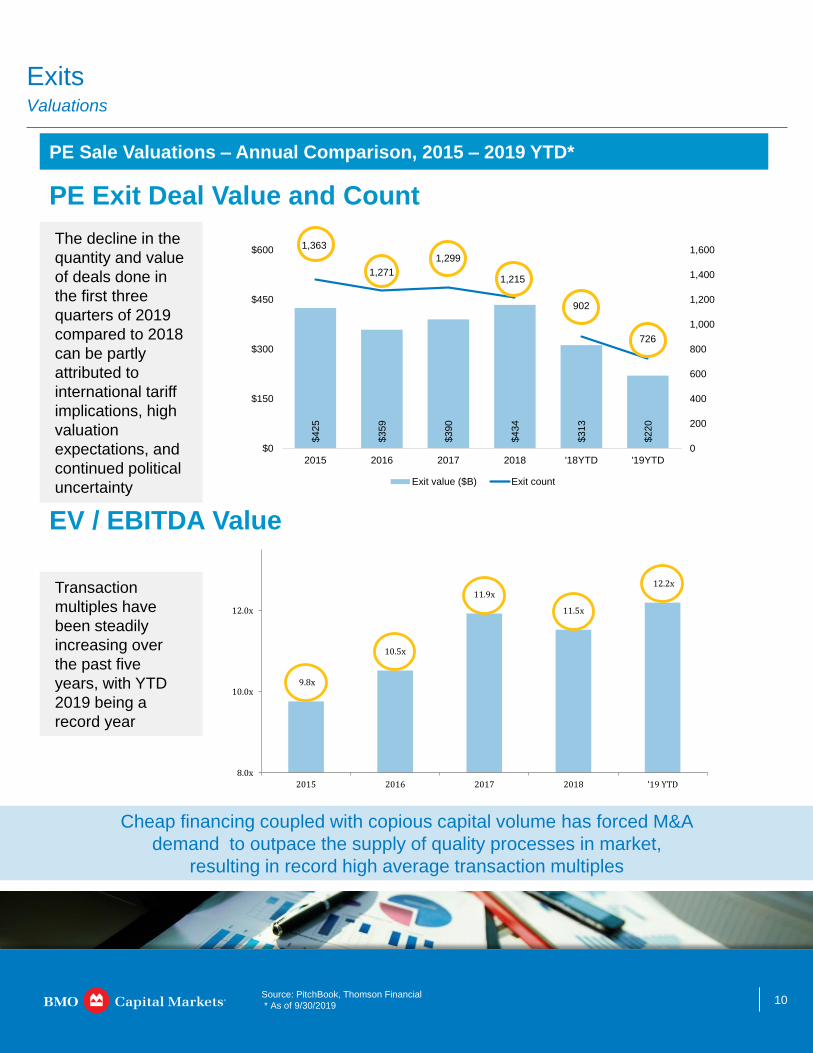
Valuations
Source: PitchBook, Thomson Financial
* As of 9/30/2019
Exits
Cheap financing coupled with copious capital volume has forced M&A
demand to outpace the supply of quality processes in market,
resulting in record high average transaction multiples
PE Sale Valuations – Annual Comparison, 2015 – 2019 YTD*
PE Exit Deal Value and Count
EV / EBITDA Value
The decline in the
quantity and value
of deals done in
the first three
quarters of 2019
compared to 2018
can be partly
attributed to
international tariff
implications, high
valuation
expectations, and
continued political
uncertainty
Transaction
multiples have
been steadily
increasing over
the past five
years, with YTD
2019 being a
record year
$425
$359
$390
$434
$313
$220
1,363
1,271
1,299
1,215
902
726
0
200
400
600
800
1,000
1,200
1,400
1,600
$0
$150
$300
$450
$600
2015 2016 2017 2018 '18YTD '19YTD
Exit value ($B) Exit count
9.8x
10.5x
11.9x
11.5x
12.2x
8.0x
10.0x
12.0x
2015 2016 2017 2018 '19 YTD

11
Who is Buying?
Source: PitchBook, Capital IQ,
* As of 9/30/2019
PE Exits
By measure of both deal value and quantity, the percentage of corporate
acquisitions of PE assets have been diminishing while secondary buyouts
have been steadily rising over the last five years
Purchasers of PE Assets– Annual Comparison, 2015 – 2019 YTD*
Corporations are more attracted to
M&A with increased public market
valuations, cash repatriations and
favorable borrowing conditions
making capital plentiful
Since 2015, the number of PE exits
to corporate buyers slightly favors
the number of sales to other PE
groups; however, in the first three
quarters, the number of SBO’s
(Secondary Buyouts) has outpaced
Corporate acquisitions by
approximately 44%
Number of Deals
by Buyer Type
Value of Deals
by Buyer Type
Considering most businesses that go
public have an enterprise value of at
least $1 billion, the IPO market
consists of a greater share of PE
exits in terms of deal value as
expected; however, the IPO category
is still trumped by corporate buyers
and other PE buyers
Private market valuations in many
sectors have been comparable to
public valuations, without the costs of
public ownership
($Bn)
$110.159%
52% 46%49%
35%
31%
39%44%
41%
48%
$0
$50
$100
$150
$200
$250
$300
$350
$400
$450
$500
2015 2016 2017 2018 2019 YTD
Corporate acquisition IPO SBO
$425
$359
$390
$195
$434
52% 52% 49% 46%
40%
45%45% 48%
51%
57%
0
200
400
600
800
1000
1200
1400
1600
2015 2016 2017 2018 2019 YTD
Corporate acquisition IPO SBO
1,3631,271 1,299
1,215
610

12 Source: Bloomberg, BMO Internal Pipeline(1), calendar YTD as November 4th, 2019.
BMO M&A expertise in Private Equity transactions
A Powerful M&A Practice
Experienced
team
• Global M&A practice with ~105 M&A professionals in nine offices around the world,
with ~80 M&A professionals in the U.S.
• Including over 30 Managing Directors and Directors
Full product
capabilities
• Sell-side, buy-side and cross-border advisory
• Recapitalizations and restructurings
• Fairness opinions
• Takeover defense
• Activism defense
• Leveraged and management buyouts
• Strategic alternatives review
Approach
• Deep sector expertise in close alignment with BMO’s industry groups
• M&A professionals partner with industry experts to drive enhanced insights and execution
• Dedicated capabilities in both large cap and middle market M&A advisory and financing
Proven
results • US$404 billion(1) of transaction value in 500+ deals since 2011
Select recent PE M&A transactions
Financial Advisor
Sale to
August 2019
Portfolio Company of
Financial Advisor
Sale to
August 2019
Portfolio Company of
Portfolio Company of
Financial Advisor
Portfolio Company Of
July 2019
Sale to
Financial Advisor
Portfolio Company of
June 2019
Portfolio Company of
Sale to
Financial Advisor
Sale to
July 2019
Financial Advisor Pending
Portfolio Company of
Acquisition of Maxim’s Homecare
Division
Financial Advisor
Sale to
January 2019
Portfolio Company of
Portfolio Company of
Financial Advisor
March 2019
Sale to
Portfolio Company of
Financial Advisor
May 2019
Portfolio Company of
Sale to
Financial Advisor
January 2019
Recapitalization by
Financial Advisor
Sale to
May 2019
Financial Advisor
January 2019
Acquired by
Portfolio Company of
13
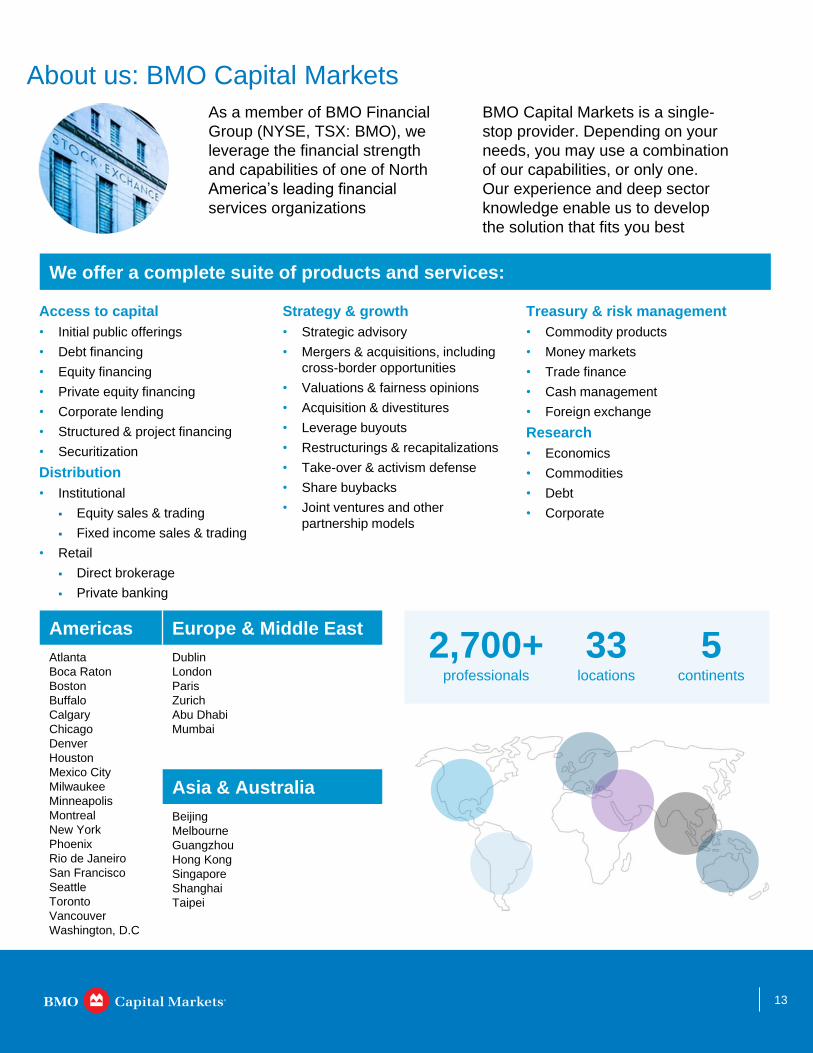
About us: BMO Capital Markets
As a member of BMO Financial
Group (NYSE, TSX: BMO), we
leverage the financial strength
and capabilities of one of North
America’s leading financial
services organizations
Access to capital
• Initial public offerings
• Debt financing
• Equity financing
• Private equity financing
• Corporate lending
• Structured & project financing
• Securitization
Distribution
• Institutional
Equity sales & trading
Fixed income sales & trading
• Retail
Direct brokerage
Private banking
Strategy & growth
• Strategic advisory
• Mergers & acquisitions, including
cross-border opportunities
• Valuations & fairness opinions
• Acquisition & divestitures
• Leverage buyouts
• Restructurings & recapitalizations
• Take-over & activism defense
• Share buybacks
• Joint ventures and other
partnership models
Treasury & risk management
• Commodity products
• Money markets
• Trade finance
• Cash management
• Foreign exchange
Research
• Economics
• Commodities
• Debt
• Corporate
2,700+ professionals
33 locations
5 continents
We offer a complete suite of products and services:
BMO Capital Markets is a single-
stop provider. Depending on your
needs, you may use a combination
of our capabilities, or only one.
Our experience and deep sector
knowledge enable us to develop
the solution that fits you best
Americas Europe & Middle East
Atlanta
Boca Raton
Boston
Buffalo
Calgary
Chicago
Denver
Houston
Mexico City
Milwaukee
Minneapolis
Montreal
New York
Phoenix
Rio de Janeiro
San Francisco
Seattle
Toronto
Vancouver
Washington, D.C
Dublin
London
Paris
Zurich
Abu Dhabi
Mumbai
Asia & Australia
Beijing
Melbourne
Guangzhou
Hong Kong
Singapore
Shanghai
Taipei

14
Contacts
Lyle Wilpon Managing Director
Head of Global Advisory
New York, NY
Tel.: (212) 702-1738
Rob Stewart Managing Director
Co-Head of U.S.
Mergers & Acquisitions
New York, NY
Tel.: (212) 702-1131
Seth Prostic Managing Director
Co-Head of U.S.
Mergers & Acquisitions
Chicago, IL
Tel.: (312) 293-8365
Eric Nicholson Managing Director
Head of Middle Market
Mergers & Acquisitions
Minneapolis, MN
Tel.: (612) 904-5710
This material is prepared by the BMO Capital Markets’ Investment and Corporate Banking Department, for distribution to BMO Capital Markets’ clientele. It is not a product
of BMO Capital Markets’ Research Department. The views of the Investment and Corporate Banking Department may differ from those of the Research Department. No
part of this publication or its contents may be copied, downloaded, stored in a retrieval system, further transmitted, or otherwise reproduced, stored, disseminated,
transferred or used, in any form or by any means by any third parties, except with the prior written permission of BMO Capital Markets.
BMO Capital Markets is a trade name used by BMO Financial Group for the wholesale banking businesses of Bank of Montreal, BMO Harris Bank N.A. (member FDIC),
Bank of Montreal Ireland p.l.c, and Bank of Montreal (China) Co. Ltd and the institutional broker dealer businesses of BMO Capital Markets Corp. (Member FINRA and
SIPC) in the U.S., BMO Nesbitt Burns Inc. (Member Investment Industry Regulatory Organization of Canada and Member Canadian Investor Protection Fund) in Canada
and Asia, Bank of Montreal Ireland p.l.c. (authorised and regulated by the Central bank of Ireland) in Europe and BMO Capital Markets Limited (authorised and regulated by
the Financial Conduct Authority) in the UK and Australia. “Nesbitt Burns” is a registered trademark of BMO Nesbitt Burns Inc., used under license. “BMO Capital Markets” is
a trademark of Bank of Montreal, used under license. "BMO (M-Bar roundel symbol)" is a registered trademark of Bank of Montreal, used under license.
® Registered trademark of Bank of Montreal in the United States, Canada and elsewhere.
™ Trademark of Bank of Montreal in the United States and Canada.
© 2018 BMO Financial Group
Bank of Montreal or its subsidiaries (“BMO Financial Group”) has lending arrangements with, or provide other remunerated services to, many issuers covered by BMO
Capital Markets. The opinions, estimates and projections contained in this report are those of BMO Capital Markets as of the date of this report and are subject to change
without notice. BMO Capital Markets endeavors to ensure that the contents have been compiled or derived from sources that we believe are reliable and contain information
and opinions that are accurate and complete. However, BMO Capital Markets makes no representation or warranty, express or implied, in respect thereof, takes no
responsibility for any errors and omissions contained herein and accepts no liability whatsoever for any loss arising from any use of, or reliance on, this report or its contents.
Information may be available to BMO Capital Markets or its affiliates that is not reflected in this report. The information in this report is not intended to be used as the primary
basis of investment decisions, and because of individual client objectives, should not be construed as advice designed to meet the particular investment needs of any
investor. This material is for information purposes only and is not an offer to sell or the solicitation of an offer to buy any security. BMO Capital Markets or its affiliates will buy
from or sell to customers the securities of issuers mentioned in this report on a principal basis. BMO Capital Markets or its affiliates, officers, directors or employees have a
long or short position in many of the securities discussed herein, related securities or in options, futures or other derivative instruments based thereon. BMO Capital Markets
may act as financial advisor and/or underwriter for the issuers mentioned herein and may receive remuneration for same. The reader should assume that BMO Capital
Markets or its affiliates may have a conflict of interest and should not rely solely on this report in evaluating whether or not to buy or sell securities of issuers discussed
herein. All values in this document are in C$ unless otherwise specified.


![Private equity funds in norway activity report h1 2013[1]](https://static.fdocuments.us/doc/165x107/568bdc1a1a28ab2034b0f746/private-equity-funds-in-norway-activity-report-h1-20131.jpg)


