U.S. Median Household Income After falling for five years, inflation-adjusted median household...
22
U.S. Median Household Income After falling for five years, inflation-adjusted median household income rose 1.1%, to $46,326.
-
date post
21-Dec-2015 -
Category
Documents
-
view
214 -
download
0
Transcript of U.S. Median Household Income After falling for five years, inflation-adjusted median household...
U.S. Median Household IncomeAfter falling for five years, inflation-adjusted median household income rose
1.1%, to $46,326.

Average Income by state

Distribution of Household Income by Race
White Black Hispanic origin1
Income range 1975 1985 1995 2005 1975 1985 1995 2005 1975 1985 1995 2005
Under $5,000 2.40% 2.40% 2.10% 2.60% 5.50% 6.30% 6.20% 6.80% 3.80% 4.10% 4.50% 3.90%
$5,000 to $9,999 6.8 5.8 5.1 4.1 15.4 15.0 12.3 10.3 10.0 9.7 10.1 6.1
$10,000 to $14,999 7.5 7.0 6.4 6.1 13.4 11.0 9.6 8.9 10.2 10.8 9.9 7.4
$15,000 to $24,999 14.2 12.9 13.2 12.0 18.0 17.1 16.4 16.1 20.5 17.9 18.8 16.2
$25,000 to $34,999 13.5 12.8 11.9 11.4 14.7 14.3 13.5 12.6 16.7 14.5 14.9 15.0
$35,000 to $49,999 19.4 16.7 16.0 14.9 15.6 13.8 14.8 15.1 19.0 16.7 15.8 17.1
$50,000 to $74,999 21.4 20.7 19.5 18.9 12.4 13.3 14.7 15.1 14.2 15.6 14.1 17.2
$75,000 to $99,999 9.0 11.0 11.7 11.6 3.5 6.0 7.0 7.3 3.7 6.5 6.5 8.2
$100,000 and over 5.8 10.5 14.2 18.3 1.4 3.1 5.3 7.8 1.9 4.4 5.4 8.8
$39,463 $43,100 $45,496 $48,554 $23,691 $25,642 $28,485 $30,858 $28,350 $30,221 $29,079 $35,967
1. Persons of Hispanic origin may be of any race.
Source: U.S. Bureau of the Census. Income, Poverty, and Health Insurance Coverage in the United States: 2005. Web: www.census.gov .
Median income

US Poverty over time

Poverty Rates by State


Source: U.S. Census Bureau's 2005 American Community Survey
Pockets of Poverty and Wealth

Source: U.S. Census Bureau's Current Population Survey, Annual Social and Economic Supplements
Percentage and Number of UninsuredAround 46.6 million were uninsured in 2005, up from 45.3 million the year before. Note: The Census Bureau changed some of its practices for the data collected in 1999, lowering numbers of the uninsured.

The solid line depicts reality in 2004, with half of U.S. family income going to the top 20%. The Gini coefficient is 0.466
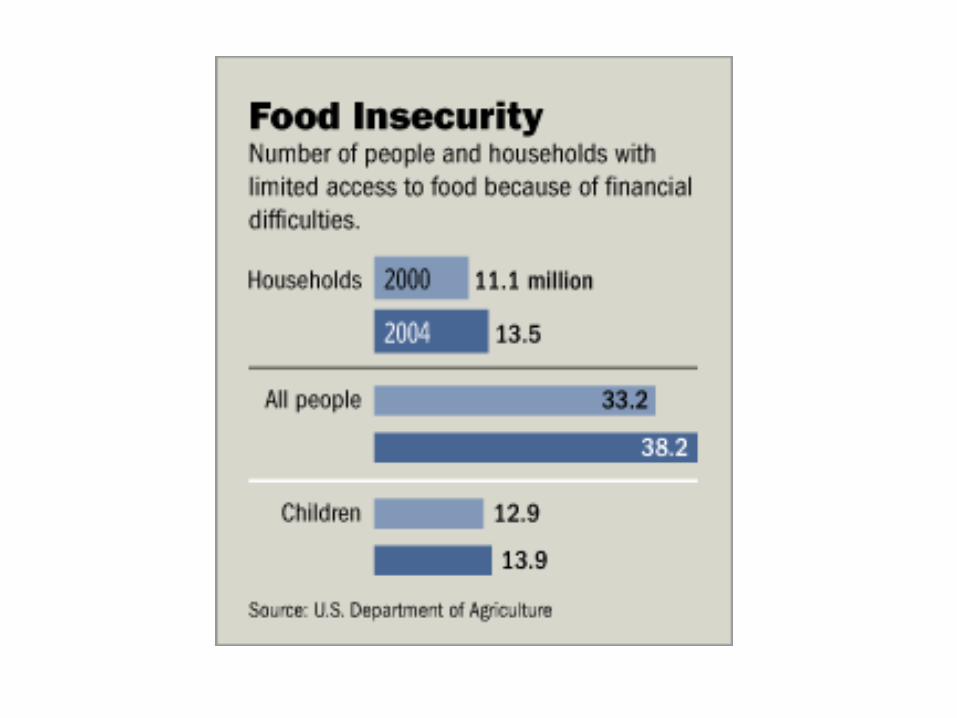
Income cutoffsCurrent 2005 dollarsUpper limit of each fifth (dollars)
lowest 20 second third fourth top 5%19,178 36,000 57,660 91,705 166,000


Brazil China France Germany India IndonesiaRussian Federation Spain
United Kingdom
United States
GINI index 58 45 33 28 38 34 46 35 33 41
GINI index
010203040506070
Bra
zil
Ch
ina
Fra
nce
Ge
rma
ny
Ind
ia
Ind
on
esi
a
Ru
ssia
nF
ed
era
tion
Sp
ain
Un
ited
Kin
gd
om
Un
ited
Sta
tes
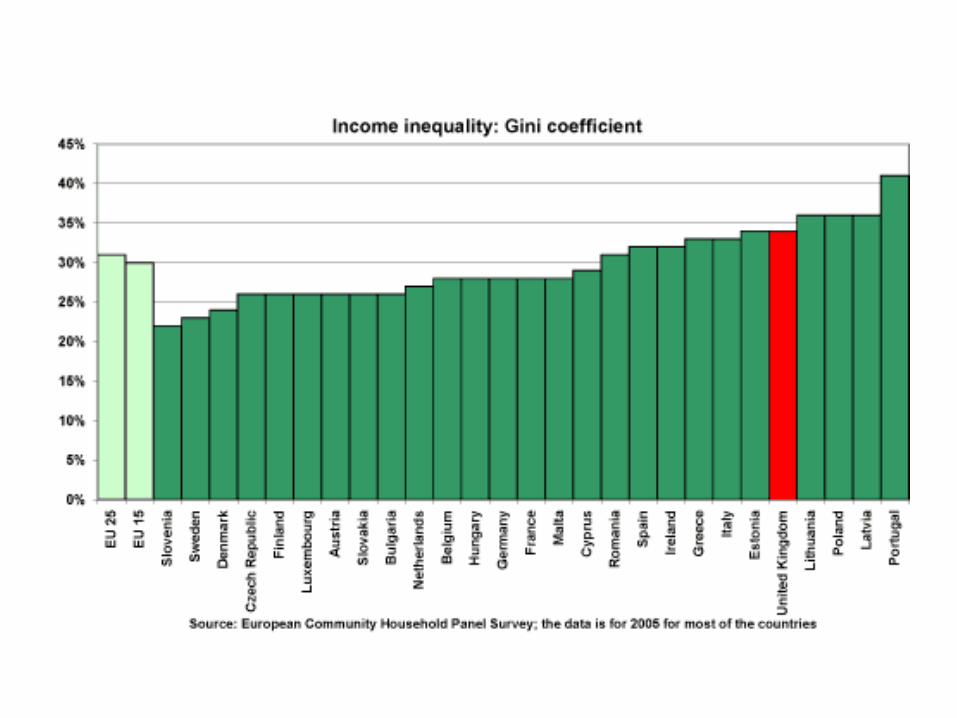

Inequality
Income Going to the Top 20% and Bottom 60% of HouseholdsThe income gap has widened since the late 1970s and didn't shrink in 2005.


Foreign-Born PopulationCalifornia had the largest share of foreign-born population, with 27.2%. New
York was second at 21.4%. At the other end of the scale was West Virginia at 1.1% percent.
Source: U.S. Census Bureau's 2005 American Community Survey


![Market Profile -- Armour Square [34] · Population Density in 2009 14,323 Square Mileage 0.99 Median Household Income 2009 $32,039 Median Household Income 2000 $26,965 Average Household](https://static.fdocuments.us/doc/165x107/5f7c2e99da23b15fb70a4fc2/market-profile-armour-square-34-population-density-in-2009-14323-square-mileage.jpg)