
U.S. Grocery Shopping Trends 2014 Overview
22
1 U.S. Grocery Shopping Trends 2014 Overview 2 © 2014 The Hartman Group, Inc Introduction In 2014, FMI supplemented its year‐over‐year survey research perspective with a cultural lens, interviewing Americans in their homes and while shopping, and drawing upon an accumulation of ethnographic research into US food consumption and consumers. The aim was to better understand why individual food shoppers make the decisions they do, and how their attitudes and piecemeal behaviors translate into large‐scale shifts that affect supermarket revenues and growth. Analysis this year therefore examined a more food‐relevant context, and introduced some new angles for understanding retail industry dynamics. Qualitative: • 5 in‐depth, one‐on‐one interviews with 5 consumers in the Seattle area, with 3‐hour tours of home kitchens, eating and food‐storage areas, and shop‐along interviews in frequented food retail locations • Group interview with 5 participants • 10 additional consumers from around the US, who completed journaling and photo‐collage homework exercises prior to debriefing • 2013‐2014 Hartman Group ethnographic research into eating and shopping. Quantitative: • Survey fielded to n=2,116 US primary shoppers, 18‐74 years old • 25‐minute online questionnaire, with sample obtained via Harris Online research panel • Split sample to cover wider range of topics, with each sub‐sample n>1,050 • Additional analysis was conducted of previous FMI survey data, US Census and USDA data sets on consumer spending, health and eating, and of Hartman Group 2013 Compass data. Methodology
-
Upload
hoangtuong -
Category
Documents
-
view
214 -
download
0
Transcript of U.S. Grocery Shopping Trends 2014 Overview
1
U.S. Grocery Shopping Trends 2014Overview
2
© 2
01
4 T
he
Ha
rtm
an
Gro
up
, In
c
Introduction
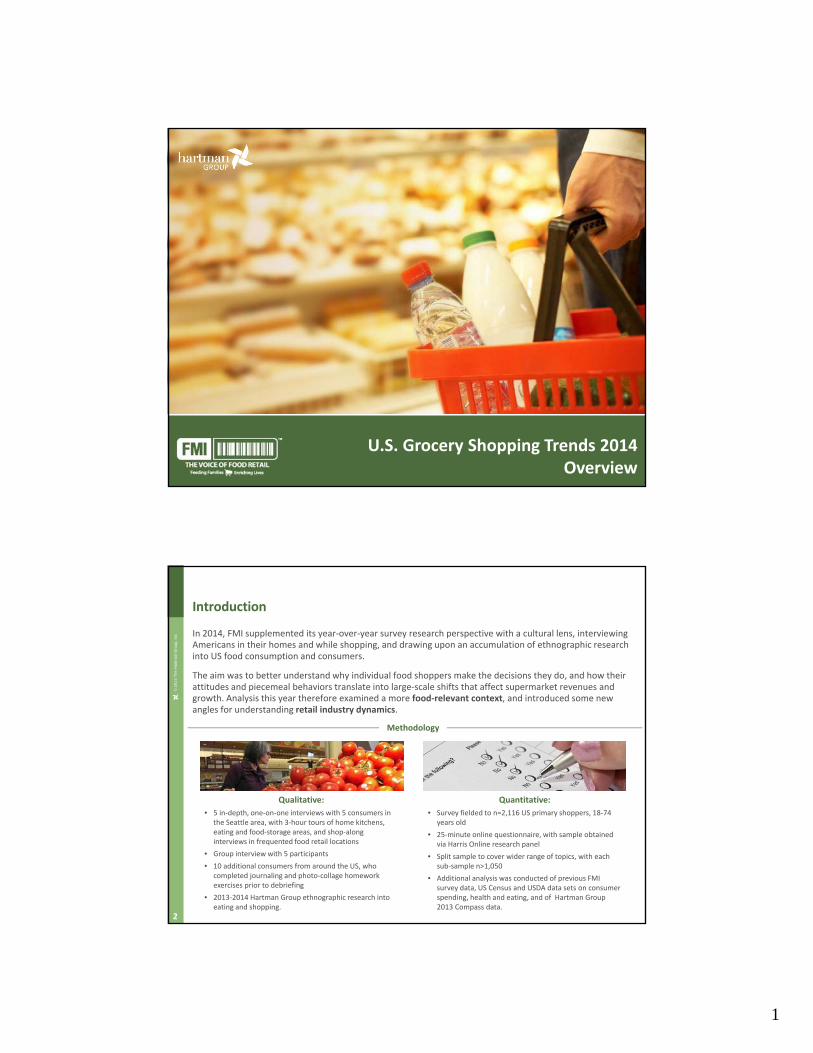
In 2014, FMI supplemented its year‐over‐year survey research perspective with a cultural lens, interviewing Americans in their homes and while shopping, and drawing upon an accumulation of ethnographic research into US food consumption and consumers.
The aim was to better understand why individual food shoppers make the decisions they do, and how their attitudes and piecemeal behaviors translate into large‐scale shifts that affect supermarket revenues and growth. Analysis this year therefore examined a more food‐relevant context, and introduced some new angles for understanding retail industry dynamics.
Qualitative:
• 5 in‐depth, one‐on‐one interviews with 5 consumers in the Seattle area, with 3‐hour tours of home kitchens, eating and food‐storage areas, and shop‐along interviews in frequented food retail locations
• Group interview with 5 participants
• 10 additional consumers from around the US, who completed journaling and photo‐collage homework exercises prior to debriefing
• 2013‐2014 Hartman Group ethnographic research into eating and shopping.
Quantitative:
• Survey fielded to n=2,116 US primary shoppers, 18‐74 years old
• 25‐minute online questionnaire, with sample obtained via Harris Online research panel
• Split sample to cover wider range of topics, with each sub‐sample n>1,050
• Additional analysis was conducted of previous FMI survey data, US Census and USDA data sets on consumer spending, health and eating, and of Hartman Group 2013 Compass data.
Methodology

2
3
© 2
01
4 T
he
Ha
rtm
an
Gro
up
, In
c
INTRODUCING A MORE FOOD‐RELEVANT CONTEXT
From Macro Trends to Eating and Food Shopping Today
The current state of the food retailing sector is a reflection of long‐term fundamental changes in the way Americans eat and procure food.
• Today’s eating and shopping behaviors are inexorably linked and exist within the context of modern food culture
• Modern food culture, which influences and prioritizes when, where, what, and (with) who(m) we eat and drink, in turn is a reflection of long‐term economic, social, and cultural forces shaping America
4
© 2
01
4 T
he
Ha
rtm
an
Gro
up
, In
c
• Consumers are becoming more engaged and more powerful in the world of food than ever before
• Social media has changed consumer food behavior
• Consumers will be expecting more from their food, and from the companies providing it
• Consumers will increasingly shed the constraints of traditional foods and old loyalties
• As consumers become more involved with the food they’re eating, they’ll become less involved in cooking it
• Consumer households are becoming more democratic when it comes to decisions regarding food
INTRODUCING A MORE FOOD‐RELEVANT CONTEXT
Macro Trends Affecting Food Culture Today
Source: Hartman Group Trends Research, 2014.

3
5
© 2
01
4 T
he
Ha
rtm
an
Gro
up
, In
c
Traditional Culture Modern Culture
Modern Eating Culture
clear societal roles | hierarchy | class‐based identity | focus on basic needs | production‐driven economy
|uniformity
social networks | values in flux | malleable identity | creation | co‐design | customization | self‐expression |
design
Traditional Eating Cultureproduct = predictable
cooking = chore
brand interaction = transactional
engagement = low
product = distinct
cooking = discovery
brand interaction = playful
engagement = YOU CHOOSE
INTRODUCING A MORE FOOD‐RELEVANT CONTEXT
Modern Food Culture Today
Source: Hartman Group Trends Research, 2014.
6
© 2
01
4 T
he
Ha
rtm
an
Gro
up
, In
c
Who is present at the proverbial table is up for
grabs
There are fewer rules about what to eat
and drink
We eat on the fly and eat fluidly – based on whims and cravings
Eating is happening anywhere and everywhere
We still “assemble” meals, but we outsource much of our
cooking
INTRODUCING A MORE FOOD‐RELEVANT CONTEXT
The Fragmentation of Food Culture
Source: Hartman Group Modern Eating Report, 2013.
4
7
© 2
01
4 T
he
Ha
rtm
an
Gro
up
, In
c
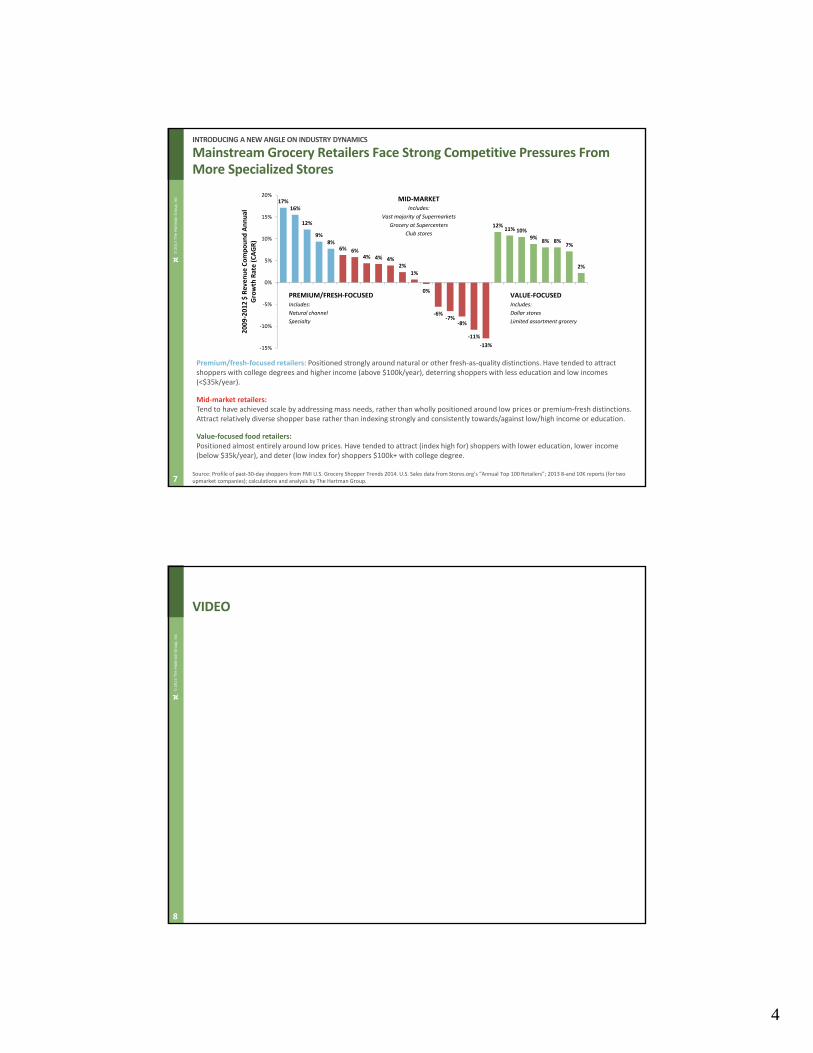
INTRODUCING A NEW ANGLE ON INDUSTRY DYNAMICS
Mainstream Grocery Retailers Face Strong Competitive Pressures From More Specialized Stores
Source: Profile of past‐30‐day shoppers from FMI U.S. Grocery Shopper Trends 2014. U.S. Sales data from Stores.org’s “Annual Top 100 Retailers”; 2013 8‐and 10K reports (for two upmarket companies); calculations and analysis by The Hartman Group.
Premium/fresh‐focused retailers: Positioned strongly around natural or other fresh‐as‐quality distinctions. Have tended to attract shoppers with college degrees and higher income (above $100k/year), deterring shoppers with less education and low incomes (<$35k/year).
Mid‐market retailers: Tend to have achieved scale by addressing mass needs, rather than wholly positioned around low prices or premium‐fresh distinctions. Attract relatively diverse shopper base rather than indexing strongly and consistently towards/against low/high income or education.
Value‐focused food retailers: Positioned almost entirely around low prices. Have tended to attract (index high for) shoppers with lower education, lower income (below $35k/year), and deter (low index for) shoppers $100k+ with college degree.
17%16%
12%
9%8%
6% 6%4% 4% 4%
2%1%
0%
‐6%‐7%
‐8%
‐11%
‐13%
12%11% 10%
9%8% 8%
7%
2%
‐15%
‐10%
‐5%
0%
5%
10%
15%
20%
2009‐2012 $ Reven
ue Compound Annual
Growth Rate (CAGR)
MID‐MARKETIncludes:
Vast majority of Supermarkets
Grocery at Supercenters
Club stores
PREMIUM/FRESH‐FOCUSEDIncludes:
Natural channel
Specialty
VALUE‐FOCUSEDIncludes:
Dollar stores
Limited assortment grocery
8
© 2
01
4 T
he
Ha
rtm
an
Gro
up
, In
c
VIDEO

5
9
© 2
01
4 T
he
Ha
rtm
an
Gro
up
, In
cKey Findings, 2014
This year’s study has illuminated several important shifts in the consumer universe:
1) A diversification of the “primary store” as a touchstone of shopper behavior
2) A fragmentation of the “primary shopper” role within households
3) A generational transformation in what “planning” means to food shoppers
4) A re‐orientation of consumer attitudes around wellness, with fresh taking a center stage
5) An opening for food retailers as shoppers seek trusted allies to help them navigate food and wellness
10
© 2
01
4 T
he
Ha
rtm
an
Gro
up
, In
c
Diversification of the Primary Store
01
6
11
© 2
01
4 T
he
Ha
rtm
an
Gro
up
, In
c
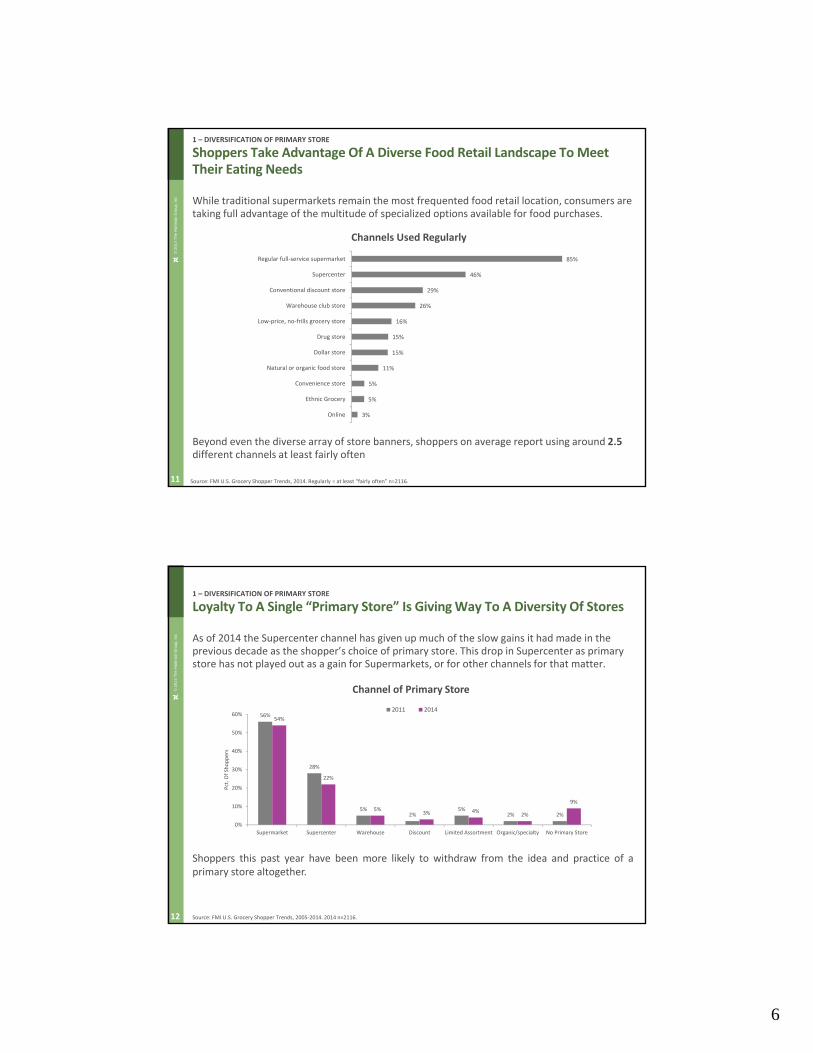
1 – DIVERSIFICATION OF PRIMARY STORE
Shoppers Take Advantage Of A Diverse Food Retail Landscape To Meet Their Eating Needs
While traditional supermarkets remain the most frequented food retail location, consumers are taking full advantage of the multitude of specialized options available for food purchases.
Beyond even the diverse array of store banners, shoppers on average report using around 2.5different channels at least fairly often
85%
46%
29%
26%
16%
15%
15%
11%
5%
5%
3%
Regular full‐service supermarket
Supercenter
Conventional discount store
Warehouse club store
Low‐price, no‐frills grocery store
Drug store
Dollar store
Natural or organic food store
Convenience store
Ethnic Grocery
Online
Channels Used Regularly
Source: FMI U.S. Grocery Shopper Trends, 2014. Regularly = at least “fairly often” n=2116.
12
© 2
01
4 T
he
Ha
rtm
an
Gro
up
, In
c
56%
28%
5%2%
5%2% 2%
54%
22%
5%3% 4%
2%
9%
0%
10%
20%
30%
40%
50%
60%
Supermarket Supercenter Warehouse Discount Limited Assortment Organic/specialty No Primary Store
Pct. O
f Shoppers
2011 2014
1 – DIVERSIFICATION OF PRIMARY STORE
Loyalty To A Single “Primary Store” Is Giving Way To A Diversity Of Stores
As of 2014 the Supercenter channel has given up much of the slow gains it had made in the previous decade as the shopper’s choice of primary store. This drop in Supercenter as primary store has not played out as a gain for Supermarkets, or for other channels for that matter.
Channel of Primary Store
Shoppers this past year have been more likely to withdraw from the idea and practice of aprimary store altogether.
Source: FMI U.S. Grocery Shopper Trends, 2005‐2014. 2014 n=2116.
7
13
© 2
01
4 T
he
Ha
rtm
an
Gro
up
, In
c
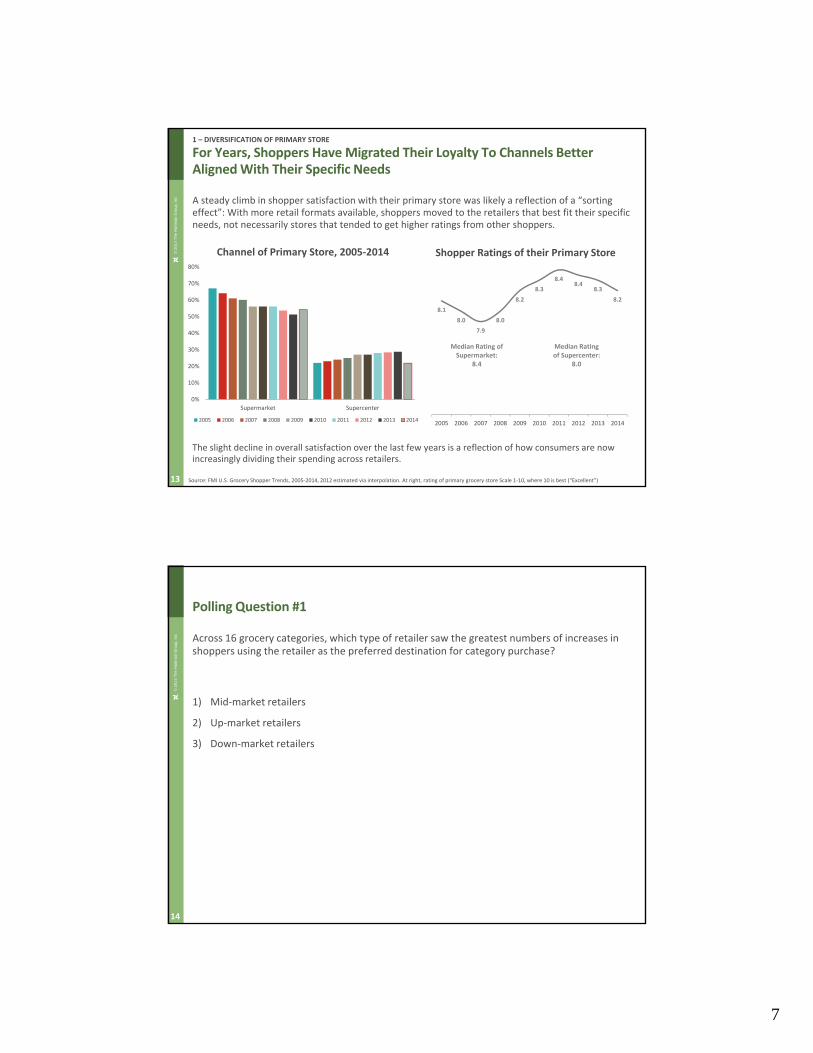
1 – DIVERSIFICATION OF PRIMARY STORE
For Years, Shoppers Have Migrated Their Loyalty To Channels Better Aligned With Their Specific Needs
A steady climb in shopper satisfaction with their primary store was likely a reflection of a “sorting effect”: With more retail formats available, shoppers moved to the retailers that best fit their specific needs, not necessarily stores that tended to get higher ratings from other shoppers.
Shopper Ratings of their Primary Store
Source: FMI U.S. Grocery Shopper Trends, 2005‐2014, 2012 estimated via interpolation. At right, rating of primary grocery store Scale 1‐10, where 10 is best (“Excellent”)
8.1
8.0
7.9
8.0
8.2
8.3
8.48.4
8.3
8.2
2005 2006 2007 2008 2009 2010 2011 2012 2013 2014
0%
10%
20%
30%
40%
50%
60%
70%
80%
Supermarket Supercenter
Channel of Primary Store, 2005‐2014
2005 2006 2007 2008 2009 2010 2011 2012 2013 2014
Median Rating of Supermarket:
8.4
Median Rating of Supercenter:
8.0
The slight decline in overall satisfaction over the last few years is a reflection of how consumers are now increasingly dividing their spending across retailers.
14
© 2
01
4 T
he
Ha
rtm
an
Gro
up
, In
c
Polling Question #1
Across 16 grocery categories, which type of retailer saw the greatest numbers of increases in shoppers using the retailer as the preferred destination for category purchase?
1) Mid‐market retailers
2) Up‐market retailers
3) Down‐market retailers

8
15
© 2
01
4 T
he
Ha
rtm
an
Gro
up
, In
c
1 – DIVERSIFICATION OF PRIMARY STORE
Consumers Are Dividing Their Spending Across Retailers, Choosing Different Favorites In Each Grocery Category
Compared to 2011, in 2014 mid‐market stores are less likely to be named as the primary purchasing venue in all of the 16 grocery categories tracked by FMI. Up‐market retailers have increased their share of consumer loyalty across every category while down‐market focused food retailers are more likely to be named as the go‐to vendor in eight categories.
Gains/Losses in Share of Shopper Preference by Store Category
Category Mid‐Market Retailers Up‐Market Retailers Down‐Market Retailers
Frozen food ↓ ↑ ↑
Breakfast cereals ↓ ↑ ↑
Natural or organic foods ↓ ↑ ↓
Fresh Produce ↓ ↑ ↑
Beverages ↓ ↑ ↑
Paper products ↓ ↑ ↓
Non‐prescription drugs ↓ ↑ ↑
Household cleaning ↓ ↑ ↓
Snacks (chips, crackers, etc.) ↓ ↑ ↑
Pasta & Rice ↓ ↑ ↑
Canned goods ↓ ↑ ↑
Meat or poultry ↓ ↑ ↓
Health & beauty products ↓ ↑ ↓
Pet products ↓ ↑ ↓
Source: FMI U.S. Grocery Shopper Trends, 2011‐2014. 2014 n varies depending on category =340‐2030.
79% of shoppers say they usually get their frozen food from a mid‐market retailer, down 7% since 2011 (86%)
10% of shoppers now say they usually buy their snacks from an up‐market store, 4% more than in 2011 (6%)
16
© 2
01
4 T
he
Ha
rtm
an
Gro
up
, In
c
1 – DIVERSIFICATION OF PRIMARY STORE
This Year, 9% Of Shoppers Indicate That They Have No One Primary Store ‐Triple That Of The Past Few Years
What appears to be driving these shifts is the dynamic of diversification ‐‐ shoppers are becoming less likely to choose any one store to satisfy all their needs. Shoppers are optimizing their satisfaction store by store and by department.
Media reports that shoppers have been “firing” their grocery stores miss the bigger story: shoppers are now less likely to fire or hire whole stores at all.
“I like to be a savvy shopper, and since I live in an area with a lot of places spread out in a small area, I can go to a lot of places. Sometimes I’m just picking up food for that night or the next day. But I don’t do a whole excursion as much as I do smaller trips. I go to different places for different needs.” (Male, 42)0%
2%
4%
6%
8%
10%
2011 2012 2013 2014
Shoppers indicating “no primary store”
Source: FMI U.S. Grocery Shopper Trends, 2005‐2014, 2012 estimated via interpolation.

9
17
© 2
01
4 T
he
Ha
rtm
an
Gro
up
, In
c
Fragmentation of the Primary Shopper
02
18
© 2
01
4 T
he
Ha
rtm
an
Gro
up
, In
c
2 – FRAGMENTATION OF THE PRIMARY SHOPPER
A Shared Role Of “Primary Shopper” Within Households Is Replacing A Singular Focus Of Food Purchases
For decades, the fact that women largely served as the primary shopper meant that retailers and producers had a relatively well‐defined target around which to build product and services attributes. How times have changed….
Narrowing attention only to those adults with full responsibility for shopping would yield a primary‐shopper base more aligned with conventional ideas of the female shopper, but would also entirely exclude a great many households and their new ways of shopping.
Primary Food Shoppers by Gender
Male Primary Shoppers
57% claim to have all or most of
grocery shopping responsibility
43% claim to share at least 50% of
responsibility
Female Primary Shoppers
76% claim to have all or most of
grocery shopping responsibility
24 % claim to share at least 50% of
responsibility
Male43%
Female57%
Source: FMI U.S. Grocery Shopper Trends, 2014 n=2116.

10
19
© 2
01
4 T
he
Ha
rtm
an
Gro
up
, In
c
2 – FRAGMENTATION OF THE PRIMARY SHOPPER
More Diversity In Household Shoppers Leads To Fewer Trips For Any Single Shopper
While grocery visits by primary shoppers may be down, this likely reflects the diversification of shopping among household members, rather than a consolidation of purchases within visits.
Weekly Visits to Grocery Store
2.22.1
1.9 1.92.0
2.1
1.7
2.2
1.71.6
1.7 1.7
1.41.5 1.5
1.41.3
1.4
1.2 1.2
77% 80%73%
79% 75%69%
75%64%
69% 73%
2005 2006 2007 2008 2009 2010 2011 2012 2013 2014
Average weekly trips by primary shopper
Share of primary store trips
Average weekly trips to primary store
Source: FMI U.S. Grocery Shopper Trends, 2005‐2014. n=2116‐2014; n=1548‐2013; n=1401‐2012; n=2046‐2011; n=2003‐2010.
20
© 2
01
4 T
he
Ha
rtm
an
Gro
up
, In
c
2 – FRAGMENTATION OF THE PRIMARY SHOPPER
Shared Shopping Roles Means Any One Shopper Understands Less About The Household’s Total Shopping
The increasing number of men who qualify as shoppers ‐ with their tendency to share, rather than wholly fulfill grocery‐shopping responsibilities ‐means that primary shoppers themselves, if asked to report their own behaviors, each report on a smaller share of all household visits to grocery. Additionally, consideration needs to be given to the fact that men shop differently than women.
32%
28%
33%
35%
42%
41%
49%
52%
29%
41%
43%
50%
48%
57%
57%
69%
Make a mental list
Ask other family/household members what they want
Look for new physical coupons (i.e., pre‐printed coupons)
Think about what I want for certain meals and snacks
Take inventory of what I had to generate a list
Gather up coupons I had already collected
Look at store circulars for sales
Make a list before going shopping
Female
Male
Source: Hartman Group Shopping Topography Study, 2012: When you are shopping at a [insert selected channel], how do you shop? N=1,900;; Male Grocery n=379; Female Grocery n=589

11
21
© 2
01
4 T
he
Ha
rtm
an
Gro
up
, In
c
The Male ShopperAugust 7th @ 2pm EDT
Health and WellnessAugust 12th @ 2pm EDT
The Millennial Shopper August 19th @ 2pm EDT
Upcoming Webinars
22
© 2
01
4 T
he
Ha
rtm
an
Gro
up
, In
c
A Generational Transformation in Planning
03
12
23
© 2
01
4 T
he
Ha
rtm
an
Gro
up
, In
c
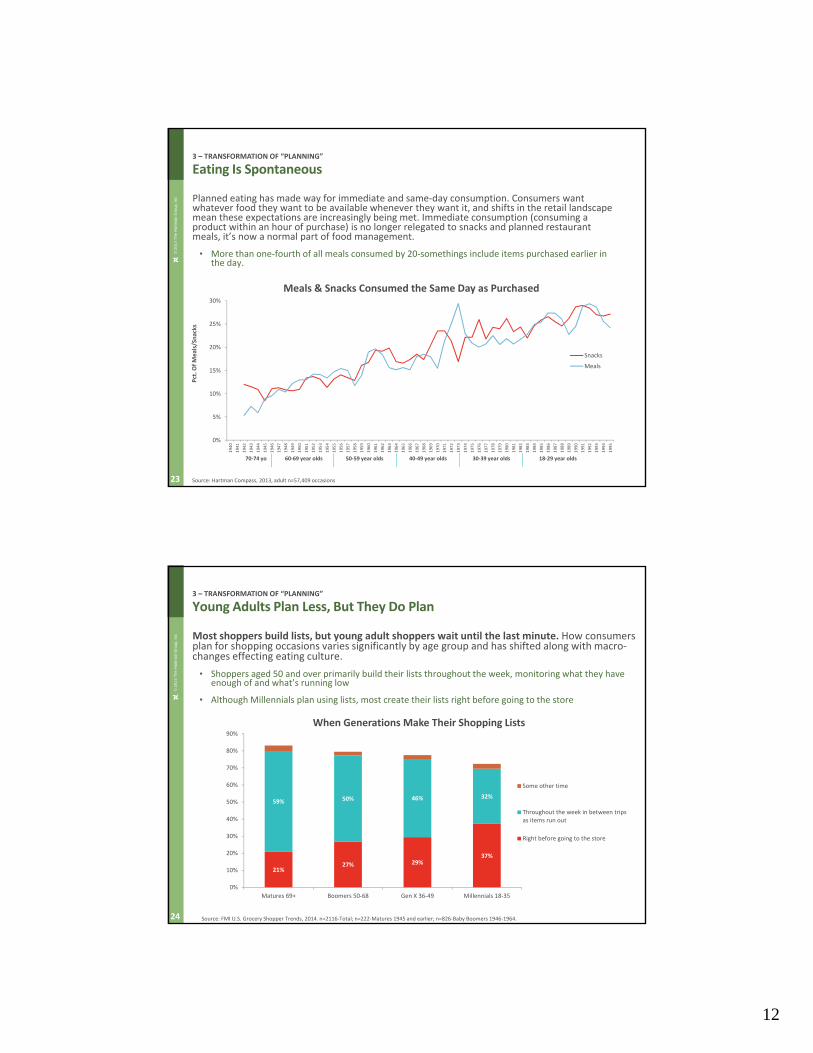
3 – TRANSFORMATION OF “PLANNING”
Eating Is Spontaneous
Planned eating has made way for immediate and same‐day consumption. Consumers want whatever food they want to be available whenever they want it, and shifts in the retail landscape mean these expectations are increasingly being met. Immediate consumption (consuming a product within an hour of purchase) is no longer relegated to snacks and planned restaurant meals, it’s now a normal part of food management.
• More than one‐fourth of all meals consumed by 20‐somethings include items purchased earlier in the day.
Meals & Snacks Consumed the Same Day as Purchased
0%
5%
10%
15%
20%
25%
30%
1940
1941
1942
1943
1944
1945
1946
1947
1948
1949
1950
1951
1952
1953
1954
1955
1956
1957
1958
1959
1960
1961
1962
1963
1964
1965
1966
1967
1968
1969
1970
1971
1972
1973
1974
1975
1976
1977
1978
1979
1980
1981
1982
1983
1984
1985
1986
1987
1988
1989
1990
1991
1992
1993
1994
1995
Snacks
Meals
Source: Hartman Compass, 2013, adult n=57,409 occasions
Pct. O
f Meals/Sn
acks
18‐29 year olds30‐39 year olds40‐49 year olds50‐59 year olds60‐69 year olds70‐74 yo
24
© 2
01
4 T
he
Ha
rtm
an
Gro
up
, In
c
3 – TRANSFORMATION OF “PLANNING”
Young Adults Plan Less, But They Do Plan
Most shoppers build lists, but young adult shoppers wait until the last minute. How consumers plan for shopping occasions varies significantly by age group and has shifted along with macro‐changes effecting eating culture.
• Shoppers aged 50 and over primarily build their lists throughout the week, monitoring what they have enough of and what’s running low
• Although Millennials plan using lists, most create their lists right before going to the store
21%27% 29%
37%
59% 50% 46% 32%
0%
10%
20%
30%
40%
50%
60%
70%
80%
90%
Matures 69+ Boomers 50‐68 Gen X 36‐49 Millennials 18‐35
Some other time
Throughout the week in between tripsas items run out
Right before going to the store
When Generations Make Their Shopping Lists
Source: FMI U.S. Grocery Shopper Trends, 2014. n=2116‐Total; n=222‐Matures 1945 and earlier; n=826‐Baby Boomers 1946‐1964.

13
25
© 2
01
4 T
he
Ha
rtm
an
Gro
up
, In
c
3 – TRANSFORMATION OF “PLANNING”
Millennials Plan Backwards From What They Want To Eat, Not What They Want To Keep In Stock At Home
For younger generations in particular, planning for a shopping trip is much more likely to be about building a meal or other eating occasion rather than stocking up the pantry with a list of basics and trusted items that a meal can be built from later.
68%
50%
18%
31%
70%
47%
21%
34%
67%
42%
31%
35%
66%
37% 36%
43%
Checking stock Checking specials Planning meals Checking recipes
Matures Boomers Gen X Millennials
How Generations Are Inspired to Make Shopping Lists
Source: FMI U.S. Grocery Shopper Trends, 2005‐2014. 2014 n=2116.
26
© 2
01
4 T
he
Ha
rtm
an
Gro
up
, In
c
The Male ShopperAugust 7th @ 2pm EDT
Health and WellnessAugust 12th @ 2pm EDT
The Millennial Shopper August 19th @ 2pm EDT
Upcoming Webinars

14
27
© 2
01
4 T
he
Ha
rtm
an
Gro
up
, In
c
A Re‐orientation of Consumer Attitudes around Wellness
04
28
© 2
01
4 T
he
Ha
rtm
an
Gro
up
, In
c
Polling Question #2
Is your company emphasizing consumer wellness and family health as a competitive strategy?
1.) Yes
2.) No
3.) Don’t know
15
29
© 2
01
4 T
he
Ha
rtm
an
Gro
up
, In
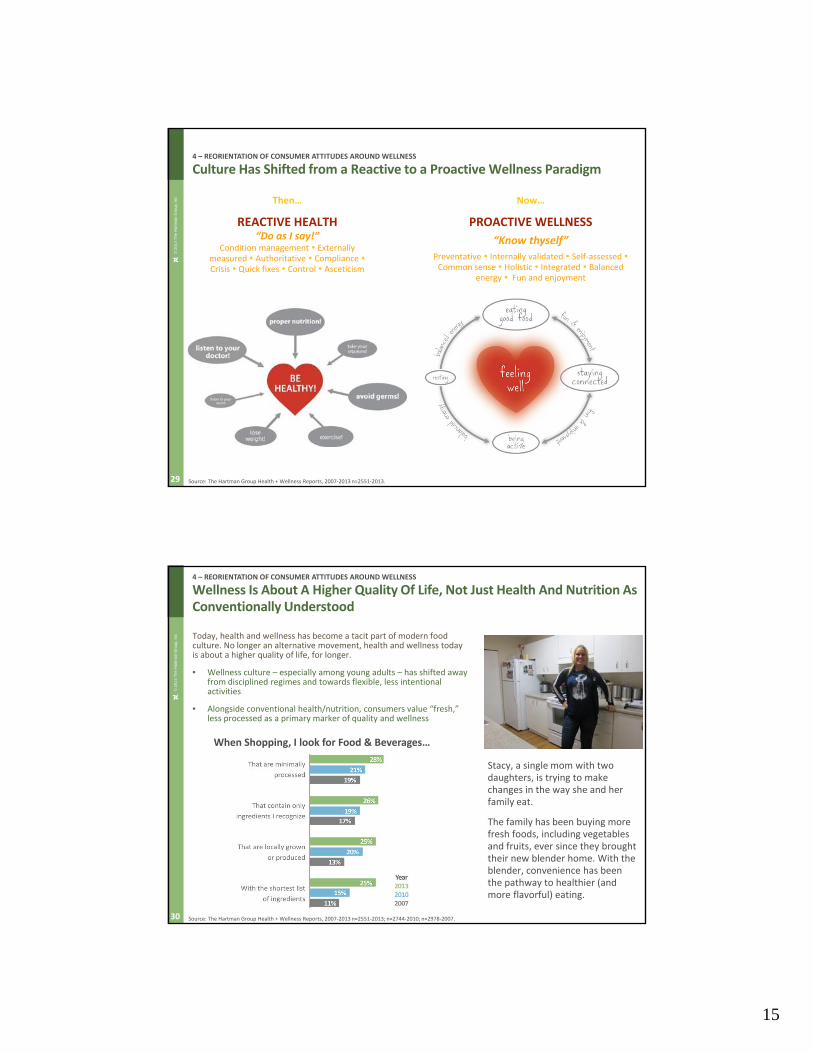
c Then…
REACTIVE HEALTH“Do as I say!”
Condition management Externally measured Authoritative Compliance Crisis Quick fixes Control Asceticism
Now…
PROACTIVE WELLNESS
“Know thyself”
Preventative Internally validated Self‐assessed Common sense Holistic Integrated Balanced
energy Fun and enjoyment
4 – REORIENTATION OF CONSUMER ATTITUDES AROUND WELLNESS
Culture Has Shifted from a Reactive to a Proactive Wellness Paradigm
Source: The Hartman Group Health + Wellness Reports, 2007‐2013 n=2551‐2013.
30
© 2
01
4 T
he
Ha
rtm
an
Gro
up
, In
c
4 – REORIENTATION OF CONSUMER ATTITUDES AROUND WELLNESS
Wellness Is About A Higher Quality Of Life, Not Just Health And Nutrition As Conventionally Understood
Today, health and wellness has become a tacit part of modern food culture. No longer an alternative movement, health and wellness today is about a higher quality of life, for longer.
• Wellness culture – especially among young adults – has shifted away from disciplined regimes and towards flexible, less intentional activities
• Alongside conventional health/nutrition, consumers value “fresh,” less processed as a primary marker of quality and wellness
Stacy, a single mom with two daughters, is trying to make changes in the way she and her family eat.
The family has been buying more fresh foods, including vegetables and fruits, ever since they brought their new blender home. With the blender, convenience has been the pathway to healthier (and more flavorful) eating.
Source: The Hartman Group Health + Wellness Reports, 2007‐2013 n=2551‐2013; n=2744‐2010; n=2978‐2007.
When Shopping, I look for Food & Beverages…

16
31
© 2
01
4 T
he
Ha
rtm
an
Gro
up
, In
c The degree to which eaters incorporate their array of wellness‐related priorities varies across the day.
0
100
Early morningsnack
Breakfast Morningsnack
Lunch Afternoonsnack
Dinner After dinnersnack
Late nightmeal/snack
Avoiding negatives
Seeking nutrients
Have real food
Use best ingredients
Consumer Eating Priorities
4 – REORIENTATION OF CONSUMER ATTITUDES AROUND WELLNESS
Specific Wellness Priorities Vary Throughout The Day
Wellness‐relevant dietary goals throughout the day
Source: Hartman Compass, 2012‐2013, adults n=41,363 occasions. Vertical axis: Portion of each daypart in which priority is important, relative to all occasions throughout the day (index of 100 = average across day).
Relative Im
portan
ce in
Eating
(index of 100=daily average)
Lunch‐time presents an interesting middle‐ground, where conventional health and nutrition maintain their relevance – eaters still attend to their do’s and don’ts – but might be satisfied through assurances of fresh and minimally processed
32
© 2
01
4 T
he
Ha
rtm
an
Gro
up
, In
c Lunchtime is a clear area of opportunity for grocery stores – beyond simply the “packed lunch” crowd. Lunch accounts for more than half of all away‐from‐home meals, and if convenience priorities can be satisfied (e.g. speed, and away‐from‐home meal‐prep), retailers are well‐situated to address the midday mix of wellness needs.
4 – REORIENTATION OF CONSUMER ATTITUDES AROUND WELLNESS
Away‐from‐home Meals Are Typically Sourced From Food Service, Even At Lunchtime Where Retail Is Best Positioned
7% 59% 33%
Breakfast Lunch Dinner
49% AFH breakfast sourced 63% AFH lunch sourced 90% AFH dinner
from foodservice from foodservice from foodservice
Portion of meals eaten away‐from‐home* by daypart:
Source: FMI U.S. Grocery Shopper Trends, 2014 *Away‐from‐home meals include those sourced from home, from foodservice and grocery, but eaten elsewhere
17
33
© 2
01
4 T
he
Ha
rtm
an
Gro
up
, In
c
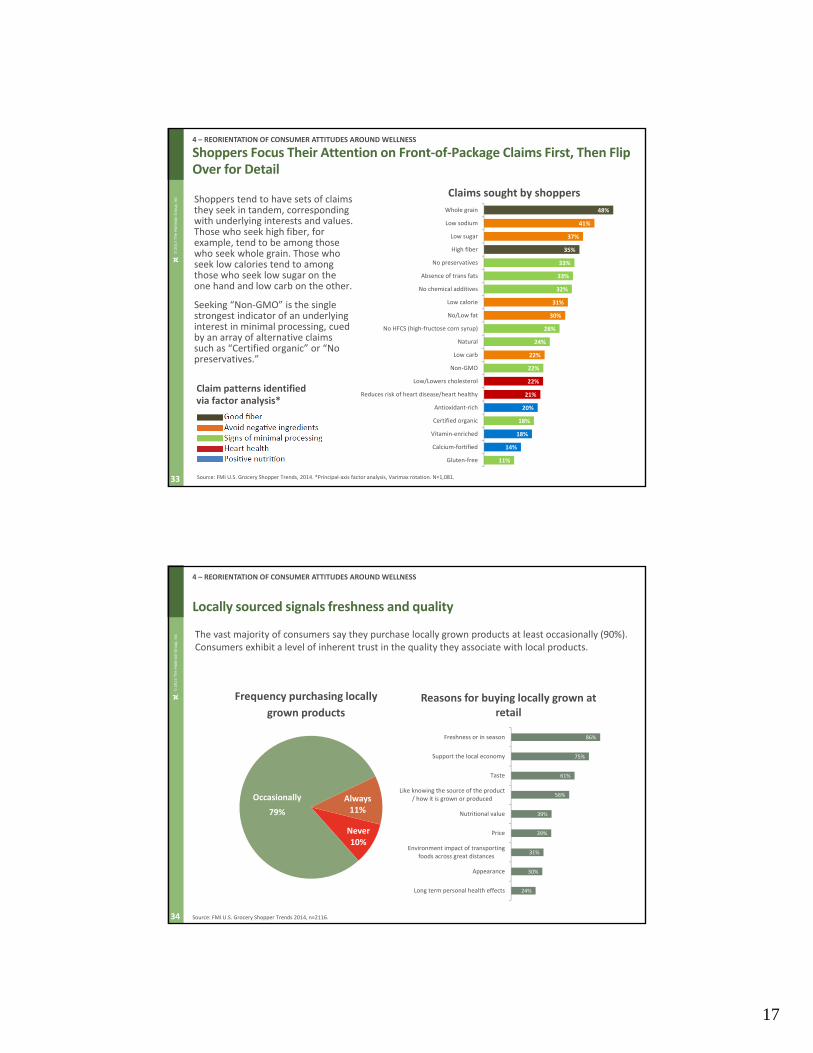
4 – REORIENTATION OF CONSUMER ATTITUDES AROUND WELLNESS
Shoppers Focus Their Attention on Front‐of‐Package Claims First, Then Flip Over for Detail
Claim patterns identified via factor analysis*
Source: FMI U.S. Grocery Shopper Trends, 2014. *Principal‐axis factor analysis, Varimax rotation. N=1,081.
48%
41%
37%
35%
33%
33%
32%
31%
30%
28%
24%
22%
22%
22%
21%
20%
18%
18%
14%
11%
Whole grain
Low sodium
Low sugar
High fiber
No preservatives
Absence of trans fats
No chemical additives
Low calorie
No/Low fat
No HFCS (high‐fructose corn syrup)
Natural
Low carb
Non‐GMO
Low/Lowers cholesterol
Reduces risk of heart disease/heart healthy
Antioxidant‐rich
Certified organic
Vitamin‐enriched
Calcium‐fortified
Gluten‐free
Claims sought by shoppersShoppers tend to have sets of claims they seek in tandem, corresponding with underlying interests and values. Those who seek high fiber, for example, tend to be among those who seek whole grain. Those who seek low calories tend to among those who seek low sugar on the one hand and low carb on the other.
Seeking “Non‐GMO” is the single strongest indicator of an underlying interest in minimal processing, cued by an array of alternative claims such as “Certified organic” or “No preservatives.”
34
© 2
01
4 T
he
Ha
rtm
an
Gro
up
, In
c
4 – REORIENTATION OF CONSUMER ATTITUDES AROUND WELLNESS
Locally sourced signals freshness and quality
Occasionally
79%
86%
75%
61%
56%
39%
39%
31%
30%
24%
Freshness or in season
Support the local economy
Taste
Like knowing the source of the product/ how it is grown or produced
Nutritional value
Price
Environment impact of transportingfoods across great distances
Appearance
Long term personal health effects
Reasons for buying locally grown at retail
Never 10%
Always 11%
Occasionally
79%
Frequency purchasing locally
grown products
The vast majority of consumers say they purchase locally grown products at least occasionally (90%). Consumers exhibit a level of inherent trust in the quality they associate with local products.
Source: FMI U.S. Grocery Shopper Trends 2014, n=2116.

18
35
© 2
01
4 T
he
Ha
rtm
an
Gro
up
, In
c
The Male ShopperAugust 7th @ 2pm EDT
Health and WellnessAugust 12th @ 2pm EDT
The Millennial Shopper August 19th @ 2pm EDT
Upcoming Webinars
36
© 2
01
4 T
he
Ha
rtm
an
Gro
up
, In
c
Building Trust
05

19
37
© 2
01
4 T
he
Ha
rtm
an
Gro
up
, In
c
5 – BUILDING TRUST
Food Retailers are Better Positioned than Government and Other Industry Players to Win and Leverage Consumer Trust Around Health & Wellness
The retailer relationship with consumers rests broadly on a foundation of assurance, or trust. This trust is that the retailer not only shares consumers’ values, but advocates for them.
Food retailers are better positioned than other industry players to win and leverage consumer trust around Health & Wellness. Food retail is far more often considered by shoppers to be a Health and Wellness ally, especially their primary store.
79%
73%
69%
57%
54%
43%
39%
30%
28%
26%
20%
20%
14%
13%
7%
6%
‐6%
‐6%
‐7%
‐6%
‐4%
‐8%
‐12%
‐14%
‐13%
‐35%
‐38%
‐26%
‐19%
‐45%
‐59%
‐39%
My family
My friends
Doctors
Fitness/health clubs
Farmers
My ''primary'' food store
Drug stores
Food stores in general
Local restaurants
Health insurance companies
Gov't institutions
The news media
Celebrity chefs
Food manufacturers
Fast food restaurants
Entertainment industry
On my side
Working against me
Which help you stay healthy, which make it more difficulty for you?
“I think grocery stores should advocate for manufacturers to put things on labels, and for more information. And the stores should do it themselves, too.” (Female, 39)
Source: FMI U.S. Grocery Shopper Trends, 2014, n=1059.
38
© 2
01
4 T
he
Ha
rtm
an
Gro
up
, In
c
5 – BUILDING TRUST
Shopper Trust Around Wellness Hinders Or Amplifies The Effects Of Other Store Benefits
Poorly regarded stores don’t become acceptable through trying to be the shopper’s health or wellness partner. But shoppers credit already acceptable stores they perceive truly to be their ally or curator, elevating them from good to great.
43%
17%
35%
56%
All stores Store is NOT SOGOOD Overall
Store is OKAYOverall
Store is SUPEROverall
Working against me
Neither on my side norworking against me
On my side, helping me to stayhealthy
Source: FMI U.S. Grocery Shopper Trends, 2014. N=1059. Q. "When it comes to helping you stay healthy, which of these people and institutions would you say tend to be on your side
(helping you), and which tend to be working against you (making it more difficult to stay healthy)?" Base: Those who selected my ''primary'' food store

20
39
© 2
01
4 T
he
Ha
rtm
an
Gro
up
, In
c
5 – BUILDING TRUST
Shopper Trust Around Food Safety is a Must Have, But Not an Amplifier
91%
59%
94% 93%
All stores Store is NOT SOGOOD Overall
Store is OKAYOverall
Store is SUPEROverall
Do NOT trust store
Do trust store to ensurethat the food I purchase issafe
Perceptions of food safety are must‐haves. Other benefits fail to gain traction without a baseline trust in safety, though after this baseline is crossed, enhanced safety doesn’t yield further gains in overall ratings.
Source: FMI U.S. Grocery Shopper Trends, 2014. N=1059. Q. "I trust my grocery store to ensure that the food I purchase is safe." Somewhat/Strongly disagree="Do not trust,"
Somewhat/Strongly agree="Do trust…"
40
© 2
01
4 T
he
Ha
rtm
an
Gro
up
, In
c
5 – BUILDING TRUST
Shoppers Generally Trust Food Retailers To Provide Safe Food
Overall, there is relatively high confidence in the food supply found
at grocers. This level of basic confidence has remained consistent
over the past ten years.
Source: FMI U.S. Grocery Shopper Trends, 2014. n=1059‐2014; n=772‐2013; n=1026‐2011; n=1001‐2010.Source: FMI U.S. Grocery Shopper Trends, 2014. H33 Top‐2 Box Agree n=1059
21
41
© 2
01
4 T
he
Ha
rtm
an
Gro
up
, In
cQuestions?
Please type any questions you have into the “Q&A box” of the webinar system
42
© 2
01
4 T
he
Ha
rtm
an
Gro
up
, In
c
THE HARTMAN GROUP, INC3150 RICHARDS ROAD, STE 200 BELLEVUE, WA 98005TEL (425) 452 0818 FAX (425) 452 9092
HARTMAN-GROUP.COM

22
43
© 2
01
4 T
he
Ha
rtm
an
Gro
up
, In
c
Register for upcoming Webinars at: www.fmi.org/forms/MeetingCalendar/
The Male ShopperAugust 7th @ 2pm EDT
Health and WellnessAugust 12th @ 2pm EDT
The Millennial Shopper August 19th @ 2pm EDT
To download the report and access this archived webinar visit: www.fmi.org/trends2014