U.S. GEOLOGICAL SURVEY BULLETIN! 1589-A · U.S. GEOLOGICAL SURVEY BULLETIN! 1589-A Prepared in...
48
U.S. GEOLOGICAL SURVEY BULLETIN! 1589-A Prepared in cooperation with the U.S. Department of Agriculture, Soil Conservation Service
Transcript of U.S. GEOLOGICAL SURVEY BULLETIN! 1589-A · U.S. GEOLOGICAL SURVEY BULLETIN! 1589-A Prepared in...

U.S. GEOLOGICAL SURVEY BULLETIN! 1589-A
Prepared in cooperation with the U.S. Department of Agriculture, Soil Conservation Service


Chapter A
Age Relations Between Soils and Geology in the Coastal Plain of Maryland and Virginia
By H.W. MARKEWICH, M.J. PAVICH, M.J. MAUSBACH, R.L. HALL, R.G. JOHNSON, and P.P. HEARN
Prepared in cooperation with the U.S. Department of Agriculture, Soil Conservation Service
Soils developed from dated parent material ranging in age from 30,000 to about 1.0? million years have been characterized from field descriptions and laboratory analyses; age-related trends are documented from field and laboratory data
U.S. GEOLOGICAL SURVEY BULLETIN 1589
PEDOLOGIC STUDIES IN THE EASTERN UNITED STATES: RELATIONS TO GEOLOGY

DEPARTMENT OF THE INTERIOR
DONALD PAUL MODEL, Secretary
U.S. GEOLOGICAL SURVEY
Dallas L. Peck, Director
UNITED STATES GOVERNMENT PRINTING OFFICE: 1987
For sale by the Books and Open-File Reports Section, U.S. Geological Survey, Federal Center, Box 25425, Denver, CO 80225
The use of brand names is for descriptive purposes only and does not imply endorsement by the U.S. Geological Survey.
Library of Congress Cataloging in Publication DataMain entry under title:
Age relations between soils and geology in the Coastal Plain of Maryland and Virginia.
(U.S. Geological Survey bulletin: 1589-A)(Pedologic studies in the Eastern United States, relations to geol
ogy)Supt. of Docs, no.: I 19.3:1589-A
1. Soils Eastern Shore (Md. and Va.) Age. 2. Soils Vir ginia Rappahannock River Region Age. 3. Soil forma tion Eastern Shore (Md. and Va.) 4. Soil formation Rappa hannock River. 5. Geology Eastern Shore (Md. and Va.)6. Geology Virginia Rappahannock River Region.7. Geology, Stratigraphic Recent. I. Markewich, HelaineW. II. Series. III. Series: U.S. Geological Survey bulletin;1589-A.
QE75.B9 no. 1589-A 557.3s 85-600233 [S599.M3] [552'.5]

PREFACESome geologic investigations of Quaternary deposits, especially in the
conterminous United States, have attempted to use relative degrees of weathering and soil formation to establish chronosequences of glacial and (or) fluvial landforms. Most studies have been in the glacial terrane of the midcontinent and the Western United States. Few such studies have been conducted in the Eastern United States, especially in the unglaciated Middle Atlantic and Southeastern States.
From 1979 to 1984, the U.S. Geological Survey and the U.S. Department of Agriculture's Soil Conservation Service conducted cooperative regional studies of the relations between soils and geology in the Middle Atlantic and Southeastern States. The primary goal of these studies was to determine if soil properties could be used to estimate ages of associated landforms. Coral, wood fragments, and peat were sampled from constructional landforms of fluvial and marine origin in order to estimate ages by isotopic analyses; these ages were then related to regional biostratigraphic and lithostratigraphic correlations. Specific site investigations were conducted on Pliocene to Holocene marine and fluvial terraces in the Atlantic and eastern Gulf Coastal Plains and on constructional landforms and residual soils in the Appalachian Piedmont. Soils on granite, schist, and quartzite parent rocks of the Appalachian Piedmont were sampled to test the use of soil properties as indicators of soil age. Each chapter of this bulletin series examines the relation of soils to geology in a specific geographic area.
The cooperative study involved research scientists from both agencies and field personnel from State offices of the Soil Conservation Service. Responsibility for sample analysis was divided between the Department of Agriculture's National Soil Survey Laboratory in Lincoln, Nebr., and the U.S. Geological Survey in Reston, Va. This report was prepared by scientists from both agencies who participated in specific site investigations or in studies of pedogenic processes.
Preface


CONTENTS
Preface IIIAbstract 1Introduction 1Physiographic and geologic setting 2
Climate 2Physiography 2Geology 2
Field and laboratory methods 4 Results and discussion 5
Data presentation 5Classification of soils 8Physical characteristics 8Chemical characteristics 10Mineralogy of the <2 micron fraction 10The loess problem 12Age relations 15
Conclusions 16 Acknowledgments 17 References cited 17
FIGURES
1. Map of the Coastal Plain of Virginia, Maryland, and Delaware2. Cross sections showing:
A , Geology across the southern Delmarva Peninsula 4 B, Geology at soil sampling sites 6, 7, and 8 on terraces
of the Rappahannock River 5
3-10. Graphs showing:3. Texture (on a clay-free basis) and weight percent of the <2
micron fraction 64. Solum thickness of soil profiles plotted against age 95. Thickness of argillic (Bt) horizons plotted against age 96. Clay mass of solum plotted against age 97. Hue of argillic (Bt) horizons plotted against age 98. Fe2O3+Al 2O3/SiO2 of sola plotted against age 109. Weight percent TiO2 plotted against age 11
10. Weight percent MnO plotted against age 11
11-18. X-ray diffraction patterns for:11. Site 1 1212. Site 2 1213. Site 3 1314. Site 4 1315. Site 5 1416. Site 6 1417. Site 7 1518. Site 8 15
Contents V

19-20. Graphs showing:19. Ratio of peak heights of 14.2A+4.85A/7.2A+4.5A clay peaks plotted
against [horizon depth x percent clay per horizon] for sites 3, 5, 7, and 8 16
20. Variation through time in values of clay, organic carbon, and carbonate in soils 17
TABLES
1. Analytical methods and units of expression for analyses conducted at the Soil Conservation Service, National Soil Survey Laboratory, Lincoln, Nebraska 20
2. Soil horizons at site 1:A , Description of physical characteristics 21B , Textural analyses 21C , Weight percent of oxides 22D, Analyses of extractable Fe, Al, oxalates, and pH 22
3. Soil horizons at site 2:A , Description of physical characteristics 22B, Textural analyses 23C , Weight percent of oxides 23D , Analyses of extractable Fe, Al, and Mn, oxalates, ratio clay, and bulk
density 23E, Analyses of extractable bases, extractable Al, cation exchange capacity
(CEC), Al saturation, and pH 244. Soil horizons at site 3:
A , Description of physical characteristics 24B , Textural analyses 24C , Weight percent of oxides 25D, Analyses of extractable Fe, Al, and Mn, oxalates, ratio clay, and bulk
density 25£, Analyses of extractable bases, extractable Al, cation exchange capacity
(CEC), Al saturation, and pH 25
5. Soil horizons at site 4:A , Description of physical characteristics 26B , Textural analyses 26C , Weight percent of oxides 26D, Analyses of extractable Fe, Al, and Mn, oxalates, ratio clay, and bulk
density 27 £, Analyses of extractable bases, extractable Al, cation exchange capacity
(CEC), Al saturation, and pH 276. Soil horizons at site 5:
A, Description of physical characteristics 28B , Textural analyses 28C , Weight percent of oxides 28D, Analyses of extractable Fe, Al, and Mn, oxalates, ratio clay, and bulk
density 29E, Analyses of extractable bases, extractable Al, cation exchange capacity
(CEC), Al saturation, and pH 29
Vf

7. Soil horizons at site 6:A, Description of physical characteristics 29B , Textural analyses 30C , Weight percent of oxides 30D, Analyses of extractable Fe, Al, and Mn, oxalates, ratio clay, and bulk
density 30 £, Analyses of extractable bases, extractable Al, cation exchange capacity
(CEC), Al saturation, and pH 318. Soil horizons at site 7:
A , Description of physical characteristics 31B , Textural analyses 31C , Weight percent of oxides 32D, Analyses of extractable Fe, Al, and Mn, oxalates, ratio clay, and bulk
density 32E, Analyses of extractable bases, extractable Al, cation exchange capacity
(CEC), and pH 329. Soil horizons at site 8:
A , Description of physical characteristics 33B , Textural analyses 33C , Weight percent of oxides 33D, Analyses of extractable Fe., Al, and Mn, oxalates, ratio clay, and bulk
density 34E, Analyses of extractable bases, cation exchange capacity (CEC),
and pH 34
Contents VH


PEDOLOGIC STUDIES IN THE EASTERN UNITED STATES: RELATIONS TO GEOLOGY
Age Relations Between Soils and Geology in the Coastal Plain of Maryland and Virginia
By H.W. Markewich, MJ. Pavich, M.J. Mausbach, 1 R.L. Hall, 2 R.G. Johnson, and P.P. Hearn
Abstract
Soils and their related surfaces on marine and fluvial deposits of the Maryland and Virginia eastern shore and on similar deposits along the lower reaches of the Rappahannock River provide the basis for comparing soil development to soil age. In this region, soils, if developed in similar parent material on uneroded positions in the landscape, can be used to form a chronosequence of landforms based on relative ages. In a few areas, where a soil is developed in parent material that has been dated by isotopic analysis, a maximum age can be deter mined for the soil and the surface upon which it has developed. Solum thickness, thickness of the argillic horizon, color, and clay mass (g/cm 2 summed through solum), as well as the de gree of Al and Fe enrichment, indicate that significant differ ences exist among soils of early Pleistocene (>1.0? m.y.) to late Pleistocene (30,000 years) age. In this study soils associated with a specific constructional land surface are assumed to be only slightly younger than the parent material associated with the surface, unless pedogenic data indicate that the surface has been eroded and (or) the soil truncated.
Soils that are developed in 25,000- to 35,000-year-old parent material have solum thicknesses of 60 to 100 cm, B horizons that are 20 to 30 cm thick, clay mass values <10 g/cm 2 , and AI + Fe/Si values <10.0. Soils developed on 60,000- to 200,000-year-old parent material have sola that range in thickness from 100 to 200 cm, Bt horizons that range in thick ness from 90 to 175 cm, clay mass values from 23 to 35 g/cm 2 , and AI + Fe/Si values from 13.0 to 19.0. Soils that are developed on primary surfaces considered to be about 500,000? years in age have solum thicknesses greater than 160 cm, Bt horizon thicknesses that are greater than 130 cm, clay mass values >80 g/cm 2 , and AI + Fe/Si values greater than 35.0. Soils developed on materials estimated to be about 1.0? m.y. in age have solum thicknesses >250 cm, Bt horizon thicknesses >220 cm, clay mass values > 140 g/cm 2 , and AI + Fe/Si values of 25.0 to 27.0, somewhat less than the value of 35.0 for soils developed on
500,000-year-old parent material. Soil color varies from 7.5YR 5/8 for the Bt horizon developed in 25,000- to 35,000-year-old parent material to 2.SYR 4/6 for Bt horizons developed in the 1.0?-m.y.-old parent material. The percent sand of total solids decreases with increasing age of soil. Soil structure in the argillic horizon changes with this change in texture. Medium subangular blocky is the dominant structure of the 60,000- to 200,000-year-old soils with >50 percent sand (sandy loam and loam textures); medium and coarse prismatic is the structure of the 500,000?-year- and 1.0?m.y.-old soils with <40 percent sand (silty loam, silty clay loam, and clay textures).
Soils developed on 60,000- to 500,000-year-old parent material are similar and are difficult to distinguish from each other. The Al + Fe/Si value may be the most useful parameter in differentiating these soils, but it does not appear to be useful in differentiating soils >500,000? years in age. Clay mass, thick ness of argillic horizon, and hue may be better indicators of age tor early Pleistocene soils.
Nonexpandable hydroxy-interlayered dioctahedral ver- miculite (HIV) increases relative to kaolinite and mica with increasing age and greater weathering in soils <500,000? years in age. Data suggest that kaolinite may increase relative to HIV in soils >1.0? m.y. in age.
'U.S. Department of Agriculture, Soil Conservation Service, National Soil Survey Laboratory, Lincoln, NE 68508.
2U.S. Department of Agriculture, Soil Conservation Service, Easton, MD 21601.
INTRODUCTION
Despite the large volume of literature on Quaternary soils of North America, relatively little information is avail able on soils developed in Pliocene and Quaternary marine and fluvial deposits in the mid-Atlantic Coastal Plain (Daniels and Gamble, 1978; Daniels and others, 1978; Foss and others, 1978; Douglas, 1977). For this region, unlike the central plain states and portions of the west coast states (Rune, 1969; Follmer, 1978), no systematic study exists that relates properties of soils either to the mineralogy or to the age of the parent materials. This may be attributed in part to the lack of detailed geologic maps of Pliocene and Pleistocene units in this part of the Coastal Plain. Over the
Age Relations between Soils and Geology 1

past 10 years, however, detailed geologic information for specific areas has become available. As a result, the U.S. Geological Survey (USGS) and Soil Conservation Service (SCS) undertook a cooperative study to determine whether soils and associated weathering profiles, developed in Qua ternary marine and fluvial sediments in the Chesapeake Bay area, could be used as indicators of relative and (or) absolute age of the surfaces and (or) sediments. The purpose of this paper is to present data that suggest correlation between soil development and the age of the underlying material. Specif ically we present (1) detailed chemical and physical data for eight soils in the study area; (2) relation of each soil to its position in the landscape and to the known or inferred age of its parent material; (3) physical and chemical characteris tics most useful for pedologic comparison; and (4) for the Maryland-Virginia Coastal Plain, a range for each signifi cant characteristic so that an estimate of the numerical age can be ascertained for the land surface.
PHYSIOGRAPHIC AND GEOLOGIC SETTING
Climate
The Delmarva Peninsula and the lower Rappahan- nock River area lie between 75°36'W. and 77°21'W. long and 36°54'N. and 39°40'N. lat (fig. 1). The present climate is humid continental, with well-defined seasons and mild winters. The maximum mean monthly temperature of the area studied (1892 to 1981) is 28.9°C in July and 2.0°C in January. The mean annual temperature over the period is 15.2°C. The mid-Atlantic Coast Plain climate is commonly less severe than that of regions of the continental interior at the same latitude, due to such modifying factors as proxim ity to the Gulf Stream, Atlantic Ocean, and the Appalachian Mountains. The average annual precipitation is 1,118 mm. Precipitation is distributed fairly uniformly through the year, but parts of the area undergo annual drought and flood. Paleontologic evidence suggests that the present climate is similar to that of interglacial periods during the past 3 m.y.
Physiography
The part of the Delaware, Maryland, and Virginia Coastal Plain east of the Chesapeake Bay is called the Del marva Peninsula. The peninsula, a coastal lowland that sep arates the Chesapeake Bay from the Atlantic Ocean (fig. 1), is 50 km across at its widest point and narrows to the north and the south. It slopes gently from the highest point in the north, 31 m near Elk Neck, to 12 m near Cape Charles. Streams are not deeply incised, but progressively older sur faces are more modified by erosion. Although many of the
streams are free flowing in their upper reaches, their lower reaches are tidal.
The Rappahannock River, Virginia, drains the Pied mont and Coastal Plain west of Chesapeake Bay and south of the Potomac River (fig. 1). Cut and fill fluvial and estu- arine terraces flank the lower reaches of the Rappahannock River where it flows through the Coastal Plain. Terrace morphology changes with terrace age (Colman, 1983) and progressively older terraces show increasing drainage den sity and decreasing preservation of original depositional area.
Geology
Sediments of Quaternary age, chiefly near-shore marine and estuarine beds, constitute the surface deposits of the Delmarva Peninsula. Recent investigations on the Del marva Peninsula indicate that lower Pleistocene sediments are not preserved (Owens and Denny, 1979; Mixon and others, 1982). Mixon (1985) indicated that the oldest Pleis tocene unit is the 200,000-year-old Accomack Member of the Omar Formation (figs. 1, 2A). Mixon (1985) correlated the Omar with similar deposits at the mouth of the Rappa hannock River that have been dated at 184,000± 20,000 years by uranium-series analysis of an included coral (Mixon and others, 1982). The Nassawadox Formation forms the next younger unit on the Delmarva Peninsula (Mixon, 1985). On the basis of several uranium-series ages on corals, this unit is considered to be between 60,000 and 125,000 years in age (Mixon and others, 1982) (fig. 2A). The Kent Island Formation (Owens and Denny, 1979) is the youngest Pleistocene unit (fig. 2A) on the Delmarva Penin sula. A 14C age of 28,450 ±660 years (W^643, U.S. Geological Survey Laboratory, Reston, Va.) was obtained from disseminated carbon in an organic-rich horizon at 3 m depth in the Kent Island Formation 18 m northwest of the Eastern Neck Island study site. Three other 14C ages ranging from 26,000 to 32,000 years have been obtained for the Kent Island Formation (Owens and Denny, 1979). This age of about 30,000 years for the Kent Island is disputed, how ever, because Mixon (oral commun., 1982), on the basis of stratigraphic correlations, considered the surface of the unit to be between 40,000 and 60,000 years in age. This inter pretation implies either that the 14C age is derived from organic material deposited after the Kent Island sediments were exposed to subaerial weathering or that the organic materials are in an active spodic horizon, which would yield a younger 14C age than the age of the parent material. Our data do not resolve the conflict.
The Omar and the Nassawadox Formations are each 6- to 25-m-thick deposits of fossiliferous clay, silt, and quartz sand; each unit was deposited during at least one major marine transgression. The Omar surfaces range in
2 Pedologic Studies in the Eastern United States

PENNSYLVANIA
NEW JERSEY
FREDERICKSBURG V,
0 10 20 30 40 50 60 70 80 90 100 110 120 130 140 KILOMETERS
' | |
Figure 1. Map of the Coastal Plain of Virginia, Maryland, and Delaware showing late Quaternary geology and sample site locations.
Age Relations between Soils and Geology 3

2 3
EXPLANATION
4 MILES
Marine deposits
Kent Island and Sinepuxent Formations
Nassawadox Formation
Omar Formation
Yorktown Formation
Dashed where inferred
Figure 2/4. Cross section showing geology across the southern Delmarva Peninsula (from Mixon, 1985). Location of section shown in figure 1.
altitude from 10 to 18m. The Nassawadox surfaces are only slightly lower, ranging from 4 to 10 m in altitude. The Kent Island Formation is a 12-m-thick unit of thinly bedded sand and silt, with surface altitudes of 3 m in Virginia to more than 7 m at Eastern Neck Island (Owens and Denny, 1979; Mixon, 1985) (figs. 1, 2A).
The terrace at 12 m altitude at the mouth of the Rap- pahannock River (fig. 25) is a planar surface underlain by a transgressive marine sequence of fossiliferous clay and cross-bedded quartz sand that ranges from 3 to 12m thick (Newell, 1985). The fossiliferous marine clay near the base of this unit contained the coral dated at 184,000 ±20,000 years (uranium-series analysis; Mixon and others, 1982). The older 23 m and 45 m altitude terraces along the lower Rappahannock River are underlain by fluvial and (or) estu- arine sand, silt, and clay that contain little or no evidence of marine influence (fig. 2#). Neither terrace contains radio- metrically dated material. The 23 m terrace is tentatively assigned an age of 500,000? years (Newell, 1985). The 45 m terrace is tentatively assigned an age of about 1.0? m.y. These ages are based upon correlations with the Canepatch and Waccamaw Formations, which have been dated in the Carolinas (McCartan and others, 1982). The source areas for the Rappahannock terrace deposits are the crystalline and intrusive rocks of the Piedmont and Blue
Ridge and the mafic intrusives and sedimentary rocks of the Mesozoic basins in Virginia.
FIELD AND LABORATORY METHODS
Except for site 1, all soil pedons were described and sampled by the authors and local SCS personnel. Horizon designations and descriptions follow the Soil Survey Man ual (Soil Survey Staff, 1951) format. Analytically split sam ples were analyzed for standard physical and chemical char acteristics (methods used are listed with their numerical codes in table 1) at the SCS National Soil Survey Laboratory (NSSL). The USGS laboratories conducted additional analyses including X-ray diffraction of the <2 micron frac tion (glycolated, 350°C, SOOT); bulk chemistry by X-ray fluorescence; chemistry of the <63 micron fraction on se lected sites; and oxalate extraction and atomic absorption of iron and aluminum. Only the X-ray diffraction patterns of the untreated <2 micron fraction are presented in the text.
The X-ray fluorescence analyses of the soil samples were performed on a Diano 8600 spectrometer after samples had been fused with lithium tetraborate. Major-element con centrations were then determined comparing unknown in tensities for each element to calibration curves prepared
4 Pedologic Studies in the Eastern United States

SW
Rappahannock River
Site? S79VA 179-001 5 km southeast of Fredericksburg
, ..... : .j Quaternary |.-';Qa>.'^ alluvium
TertiaryKt0cg°| Chesapeake L^-2 d Group
Cretaceous pKp^l Potomac ~ ~ Formation
Contact
KILOMETERS
Rappahannock River Site 8 S80VA 099-001
40 km southeast of Fredericksburg
KILOMETERS
N50 -i
J 40-(0
* 30-v
I 20H <nfio-
^ggS^dar: \Rappahannoclc River
1 KILOMETERS
Site 6 S79VA 103-001 80 km southeast of Fredericksburg
Figure 2B. Cross sections showing geology at soil sampling sites 6, 7', and 8, adjacent to the Rappahannock River south of Fredericksburg, Va. Site locations are shown in figure 1.
from USGS silicate rock standards (Flanagan, 1976). This method usually results in relative errors of <5 percent.
RESULTS AND DISCUSSION
Data Presentation
The exact location of each study site and the field description of the soil and weathering profile described at
the site are given in tables 2A through 9A. Analytical results for samples from the profiles are presented in tables IB-IE through 9B-9E. The data are presented by study site. The study sites are arranged roughly from youngest to oldest. Figure 3 is a graphical presentation of the texture (on a clay-free basis) and weight percent of the <2 micron frac tion for each profile, plotted by horizon. Figures 4 through 7 are graphic summaries of solum thickness, thickness of the argillic horizon, clay mass, and hue of Bt horizon plotted against either the determined or estimated age of the parent
Age Relations between Soils and Geology 5
Eastern Neck: Site 1
PERCENT FINER
Q0 25 50 75
25
50
(J
75
100 O N OC OI
O to
0 25 50 75 100
WEIGHT PERCENT <2 JJL FRACTION OF WHOLE SOIL
Joynes Neck: Site 2
PERCENT FINER
25 50 75
z O N OCOI
O to
IIC4250
"0 25 50 75 100
WEIGHT PERCENT <2 JJL FRACTION OF WHOLE SOIL
Persimmon Point: Site 5
PERCENT FINER
250,
z O Na: OI
O to
Norris Bridge: Site 6
PERCENT FINER
.0 25 50 75
"0 25 50 75 100
WEIGHT PERCENT <2 ^ FRACTION OF WHOLE SOIL
0 25 50 75 100
WEIGHT PERCENT <2 JJL FRACTION OF WHOLE SOIL
Figure 3. Texture (on a clay-free basis) and weight percent of the <2 micron fraction for all sites.
6 Pedologic Studies in the Eastern United States
Oyster: Site 3Nelsonia: Site 4
PERCENT FINER
25 50 75
0 25 50 75 100
WEIGHT PERCENT <2 JJL FRACTION OF WHOLE SOIL
PERCENT FINER
25 50 75 100
0 25 50 75 100
WEIGHT PERCENT <2 ^ FRACTION OF WHOLE SOIL
23 m Terrace: Site 7
PERCENT FINER
25 50 75
0 25 50 75 100
WEIGHT PERCENT <2 JJL FRACTION OF WHOLE SOIL
EXPLANATION GRAIN SIZE IN MICRONS
50-100Very fine sand
100-250 Fine sand
>250 Medium, coarse, and very coarse sand
45 m Terrace: Site 8
PERCENT FINER
25 50 75
B28t
250,0 25 50 75 100
WEIGHT PERCENT <2 JJL FRACTION OF WHOLE SOIL
Figure 3. Continued
Age Relations between Soils and Geology 7

material. Figures 8,9, and 10 show the changes in chemical composition with increase in age of the soil: AliC^ + FeiCV SiO2 ratio, TiO2 , and MnO, respectively. X-ray diffraction patterns of the <2 micron fraction are presented in figures 11 through 18.
Classification of Soils
Most of the soils developed on the Piedmont and Coastal Plain of the middle and southern Atlantic coastal states are in the Ultisol soil order. Ultisols are found in the middle to low latitudes in areas that in some season experi ence greater precipitation than evapotranspiration, which allows water to move through the solum into the underlying parent material (Soil Survey Staff, 1975). In Ultisols, leach ing removes bases at about the same rate as they are released by weathering. Most bases are held in the vegetation and in the upper few centimeters of the soil. Common clay miner als include kaolinite and hydroxy-interlayered vermiculite (HIV). Halloysite and gibbsite are also present in small amounts. Clay-size quartz, goethite, hematite, and mica are also common. Ultisols have a base saturation (by sum of the cations) that is <35 percent in the layer 1.5m below the top of the argillic horizon or 1.8 m below the ground surface, whichever is shallower.
All of the soils described in this study are in the Udult suborder of Ultisols. Each of the soils described is in the fine-loamy, mixed, thermic Typic Hapludult family, with the exception of the fine-loamy, over clayey, mixed, ther mic Typic Paleudult that has developed on the 45 m terrace. Hapludults are well-drained soils with an ochric epipedon and a thin to moderately thick argillic horizon. Hapludults are most numerous in the Piedmont, where the land surface is predominantly in slope, and on only moderately dissected surfaces in the lower Coastal Plain and along the drainages of the Coastal Plain and the Piedmont. Paleudults are commonly less permeable than Hapludults and are present on old stable land surfaces in the upper Coastal Plain and outer Piedmont, and on remnants of river terraces located two and three terraces above the present floodplain along Coastal Plain rivers. Paleudults have thick to very thick argillic horizons with low activity clays, similar to the clays of Oxisols present in tropical climates. Both Hapludults and Paleudults form on acid rocks or sediments that have an almost exclusive forest canopy, except where cultivated. In the 1938 (modified 1949) soil classification (Thorp and Smith, 1949) Hapludults in the thermic temperature regime were classified as Red-Yellow Podzolics, and in the mesic temperature regime were classified as Gray-Brown Pod zolics. Paleudults in the same classification were almost exclusively Red-Yellow Podzolics.
Physical Characteristics
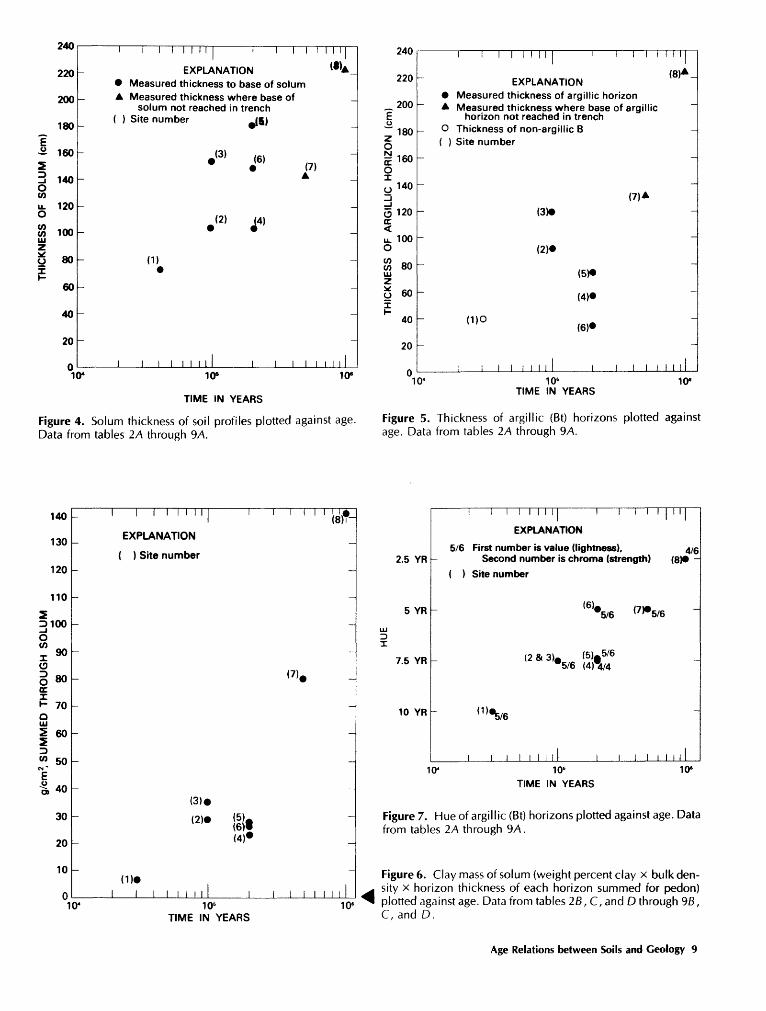
Soil texture of the B horizons is progressively finer in each older soil from sandy loam and silt loam in the 30,000-year-old alluvium at Eastern Neck Island, to loam in the 60,000-120,000-year-old marine sands at Joynes Neck and Oyster, to loam and sandy clay loam in the 200,000- year-old marine sands at Nelsonia, Persimmon Point, and Norris Bridge, to a silty clay loam in the 500,0007-year-old alluvium and (or) estuarine sediments of the 23 m terrace and clay loam of the similar 1.0?-m.y.-old sediments of the 45 m terrace (see tables 2A through 9A for field descriptions of soil profiles). Structure of the B horizons changes with the change in texture from single grain at Eastern Neck, to medium subangular blocky at Joynes Neck, Oyster, and Persimmon Point, to medium and coarse subangular blocky at Norris Bridge, to medium and coarse prismatic at the 23 m site and coarse prismatic at the 45 m terrace site. With the increase in finer grained material and the change in texture from single grain to blocky to prismatic, there is a corre sponding increase in thickness of B horizon, which is an argillic horizon in all but the youngest (Eastern Neck) pro file, from 60 cm for Eastern Neck to >220 cm for the profile on the 45 m site. Clay mass (percent clay x bulk den sity x thickness of horizon integrated over depth of solum) also increases with age of solum. Solum thickness increases similarly from 90 cm for Eastern Neck to >220 cm for the 45 m terrace site. See figures 4 and 5 for plots of solum and B horizon thickness vs. age of soil. Figure 6 presents the plot of clay mass vs. age. A plot of hue of the Bt horizons vs. age of solum shows a trend toward increasing redness with increasing age (fig. 7).
Textural analysis data, by weight percent, for each solum and underlying parent material (where encountered) are presented in tables 2B through 9B. Fine-grained and very fine grained sand are the dominant sand-size fractions. The solum that developed in the 1.0?-m.y.-old 45 m terrace alluvium has the most even distribution of sand-size frac tions. The Norris Bridge site has the largest percentage of medium-size sand distributed through the profile. The silt fraction is most evenly distributed between fine and coarse silt in the Eastern Neck profile, which is of alluvial and (or) estuarine origin. All other profiles on the Delmarva Penin sula have a 2:1 to 3:1 ratio of fine silt to coarse silt in the upper 1 m, below which is an abrupt decrease in silt- and clay-size fractions and a corresponding increase in total percent sand. The profiles of the Delmarva Peninsula all have marine sand as parent material. A similar "silt cap" can be seen in the profile at Norris Bridge, which also has marine sands as parent material. But the profiles in the alluvium of the 23 m and 45 m terraces do not show the sharp contact between the fine and coarse fraction percent ages at 1 m depth; the silt decreases gradually downward through the profile.
8 Pedologic Studies in the Eastern United States
*«tv
220
200
180
? £ 160
S3 140oCOu. 1200
W 100UJZ0 8031
60
40
20
o
i l i l l l f l i i l I f I 1 l
EXPLANATION li)A_ Measured thickness to base of solum
_ A Measured thickness where base of _solum not reached in trench
( ) Site number _i«»
-
_
(1)^
-
~
-
I I l I I I l I
»-' _
/O) _
' J6> (7)A
' (4)» _
1 1 1 1 1 l 1 1
240
220
200E
_o
Z ONE 160 O
y 140
_l0 120oc
u. 100O
M 80LUZ 0 60I
40
20
I I I II I I I I I I I
EXPLANATION Measured thickness of argillic horizon
~ A Measured thickness where base of argillic horizon not reached in trench
_ O Thickness of non-argillic B( ) Site number
(7)A
~~ (3)0
~(2)*
-(5)^
(4)«
(DO (6)^
-
i tit in i ill l i l
k
-
~
~
-
-
-
-
104 1QS 1Q6 % ' ' ' ' " ' 10- 10-TIME
Figure 4. Solum thickness of soil Data from tables 2A through 9A.
140
130
120
110
SD100Ox »-
o0 80ocIH 70 OUJI 60 'w 50
CM *
E-§. An -
1 1 1 1 1 1 1 1 1
EXPLANATION
{ ) Site number
TIME IN YEARSIN YEARS
profiles plotted against age. Figure 5. Thickness of argillic (Bt) horizons plotted against age. Data from tables 2A through 9A.
1 ' ' ! ' ' is1 )*-
_
(7)«
2.5 YR
5 YR
UJ
DX
7.5 YR
10 YR
I I I t I I I ! I I I I II I
EXPLANATION
5/6 First number is value (lightness). Second number is chroma (strength) (8H
( ) Site number
*5/6 (7)*5/6
(2 & 3), (5)^5/6
(1)«5/6
l l l I I I I I I I I I I104 106 1
TIME IN YEARS
4/6
-
-
-
0»
Figure 7. Hue of argillic (Bt) horizons plotted against age. Data from tables 2A through 9A.
10* 105
TIME IN YEARS
10'
Figure 6. Clay mass of solum (weight percent clay x bulk den- sity x horizon thickness of each horizon summed for pedon) plotted against age. Data from tables 28, C,and D through 98, C, and D.
Age Relations between Soils and Geology 9
Chemical Characteristics
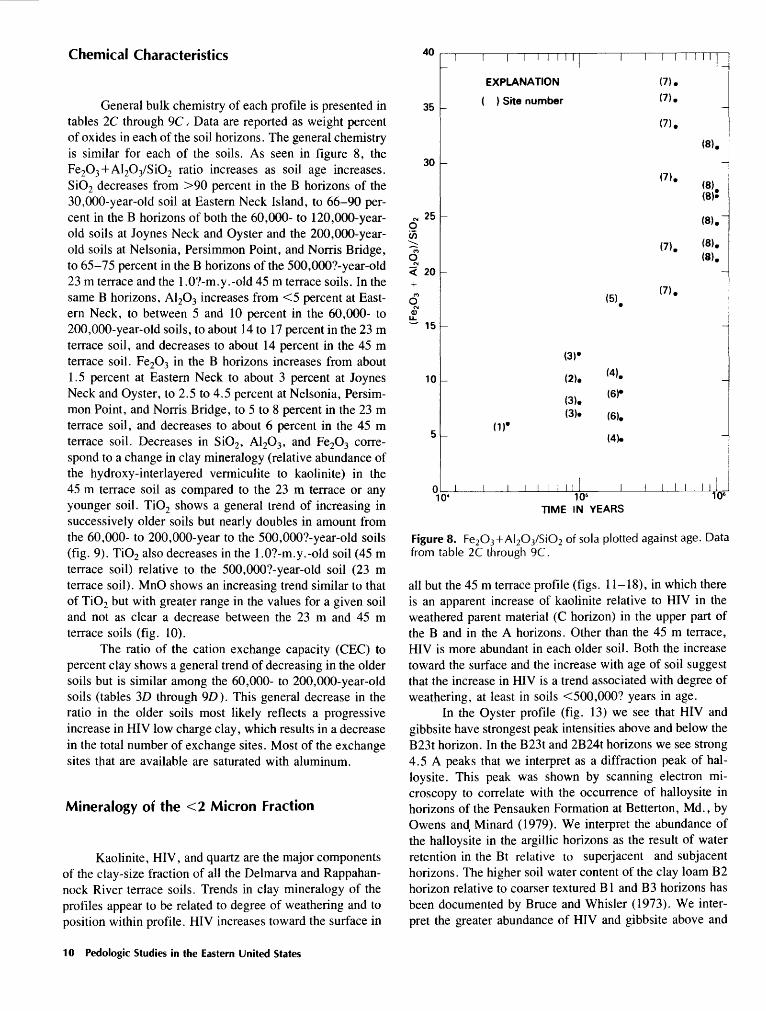
General bulk chemistry of each profile is presented in tables 1C through 9C, Data are reported as weight percent of oxides in each of the soil horizons. The general chemistry is similar for each of the soils. As seen in figure 8, the Fe2O3+Al2O3/SiO2 ratio increases as soil age increases. SiO2 decreases from >90 percent in the B horizons of the 30,000-year-old soil at Eastern Neck Island, to 66-90 per cent in the B horizons of both the 60,000- to 120,000-year- old soils at Joynes Neck and Oyster and the 200,000-year- old soils at Nelsonia, Persimmon Point, and Norris Bridge, to 65-75 percent in the B horizons of the 500,0007-year-old 23 m terrace and the 1.0?-m.y.-old 45 m terrace soils. In the same B horizons, A1 2O3 increases from <5 percent at East ern Neck, to between 5 and 10 percent in the 60,000- to 200,000-year-old soils, to about 14 to 17 percent in the 23 m terrace soil, and decreases to about 14 percent in the 45 m terrace soil. Fe2O3 in the B horizons increases from about 1.5 percent at Eastern Neck to about 3 percent at Joynes Neck and Oyster, to 2.5 to 4.5 percent at Nelsonia, Persim mon Point, and Norris Bridge, to 5 to 8 percent in the 23 m terrace soil, and decreases to about 6 percent in the 45 m terrace soil. Decreases in SiO2 , A12O3 , and Fe2O3 corre spond to a change in clay mineralogy (relative abundance of the hydroxy-interlayered vermiculite to kaolinite) in the 45 m terrace soil as compared to the 23 m terrace or any younger soil. TiO2 shows a general trend of increasing in successively older soils but nearly doubles in amount from the 60,000- to 200,000-year to the 500,0007-year-old soils (fig. 9). TiO2 also decreases in the 1.0?-m.y.-old soil (45 m terrace soil) relative to the 500,0007-year-old soil (23 m terrace soil). MnO shows an increasing trend similar to that of TiO2 but with greater range in the values for a given soil and not as clear a decrease between the 23 m and 45 m terrace soils (fig. 10).
The ratio of the cation exchange capacity (CEC) to percent clay shows a general trend of decreasing in the older soils but is similar among the 60,000- to 200,000-year-old soils (tables 3D through 9D). This general decrease in the ratio in the older soils most likely reflects a progressive increase in HIV low charge clay, which results in a decrease in the total number of exchange sites. Most of the exchange sites that are available are saturated with aluminum.
Mineralogy of the <2 Micron Fraction
Kaolinite, HIV, and quartz are the major components of the clay-size fraction of all the Delmarva and Rappahan- nock River terrace soils. Trends in clay mineralogy of the profiles appear to be related to degree of weathering and to position within profile. HIV increases toward the surface in
40
35 -
30 -
25
O(N
< 20+m
qu
LL.- 15
10
5 -
EXPLANATION
( ) Site number
(5)
(7).
(7).
(7).
(7).
(7).
(7).
(8).
(8). (8)5
(8).
(8).
(3)-
(2).
(3). (3).
(1)' (6).
(4).
104 105
TIME IN YEARS
I I I
Figure 8. Fe2O3+Al 2O3/SiO2 of sola plotted against age. Data from table 2C through 9C.
all but the 45 m terrace profile (figs. 11-18), in which there is an apparent increase of kaolinite relative to HIV in the weathered parent material (C horizon) in the upper part of the B and in the A horizons. Other than the 45 m terrace, HIV is more abundant in each older soil. Both the increase toward the surface and the increase with age of soil suggest that the increase in HIV is a trend associated with degree of weathering, at least in soils <500,000? years in age.
In the Oyster profile (fig. 13) we see that HIV and gibbsite have strongest peak intensities above and below the B23t horizon. In the B23t and 2B24t horizons we see strong 4.5 A peaks that we interpret as a diffraction peak of hal- loysite. This peak was shown by scanning electron mi croscopy to correlate with the occurrence of halloysite in horizons of the Pensauken Formation at Betterton, Md., by Owens and Minard (1979). We interpret the abundance of the halloysite in the argillic horizons as the result of water retention in the Bt relative to superjacent and subjacent horizons. The higher soil water content of the clay loam B2 horizon relative to coarser textured Bl and B3 horizons has been documented by Bruce and Whisler (1973). We inter pret the greater abundance of HIV and gibbsite above and
10 Pedologic Studies in the Eastern United States

*..\j
1.9
1.8
1.7
1.6
1.5
1.4
1.3CN
PERCENT Ti(DON
WEIGHT J 00
.6
.5
.4
.3
.2
.1
0 1
I I I I I M I
EXPLANATION
( ) Site number
-
-
-
-
-
(2).
(2)-
(1).
(D-
(3).
(3)-
-
(3).
(3).
I I I M M I0* 106
TIME IN
I I I I M M
(7). (7).
(7). (7).
(5).
-
-
(8).
(8)-
-
(5).
(6).
(4).
-
(6)- (4)'
-
(4).
-
I I I I M M106
YEARS
Figure 9. Weight percent TiO2 plotted against age. Data from tables 2B through 98.
below the halloysite-rich horizons as reflecting the drier soil microenvironments in these horizons that are different from the relatively wetter microenvironments in horizons B23t and 2B24t. These observations warrant further study in soils in which water movement is well understood.
Increase in HIV relative to kaolinite and gibbsite in the A horizon could be due to inheritance of HIV trans formed from a 10 A precursor or aeolian contribution. How ever, we hypothesize that the HIV is formed in situ and may form preferentially in the A horizons due to chemical pro cesses that attack kaolinite and (or) facilitate in-situ forma tion of vermiculite. HIV is commonly seen to increase up ward into the A horizons of Ultisols (Barnheisel and Rich, 1966; Rich, 1968; Karathanasis and others, 1983). The rel ative increase in kaolinite and decrease in HIV in the soil of the 45 m terrace are associated with increases in total clay, percent clay in the upper horizons, and increase in Fe2O3 and A12O3 relative to SiO2 , as well as an increase in the total
Oc
h- ZLUO CCLUQ_
j_XoLU
*
.33
.32
.31
.30
.29
.28
.27
.26
.25
.24
.23
.22
.21
.20
.19
.18
.17
.16
.15
.14
.13
.12
.11
.10
.09
.08
.07
.06
.05
.04
.03
.02
.01
r>
i I I I I I I I M M I
(6)-
EXPLANATION
_ ( ) Site number _
-
(6)-
-
-
-
(?)
-
-
-
_
_
(8)'
-
(6)- (7).
- (8)» -
(8).
(6).
-
(7)-
-
(2H <8)»
-
(5).
(5)' (8) '-
(8)»
(2) ' (8).(2)-
!?! (4) *< 1 >- /,»(3)- (4);
I II MM I I I M I I I10" 106
TIME IN YEARS
106
Figure 10. Weight percent MnO plotted against age. Data from tables 2B through 9B.
Age Relations between Soils and Geology 11

Eastern Neck: Site 1 Joynes Neck: Site 2
14.2 14.2
3.33DEPTH (cm)ANDHORIZON
13-31 A2
31-43 B21
43-69 B22
69-92 B3
92 4- C
V I GGo K Q
Figure 11. X-ray diffraction patterns for untreated <2 micron fractions from selected soil horizons, Eastern Neck, site 1 (exact location and field description in table 2/4). Traces illustrated are of oriented, untreated clay. Peak spacings are in angstroms (A). Depths to middles of horizons are given in centimeters. V is hydroxyl-interlayered vermiculite, I is illite, K is kaolinite, G is gibbsite, Go is goethite, and Q is quartz. Vermiculite peak intensity increases toward the surface. The illite peak intensity decreases above the B22 horizon.
TiO2 (table 9C and figs. 5, 6, 8, and 9). This decrease in HIV in the 45 m terrace soil may be due to depletion of the source of readily soluble silica. The large percentage of clay in the A horizon of this solum may produce a drainage environment in which the stability of kaolinite is greater than that of HIV and gibbsite (that is, analogous to the B23t in the Oyster profile).
In support of this hypothesis, we have plotted the ratio of peak heights of
HIV (14 A) + gibbsite (4.8 A)
kaolinite (7.2 A) + halloysite (4.5 A)
3.543.33
DEPTH (cm) AND HORIZON
0-28 Ap
28-45 B21t
45-67 B22t
67-86 B23t
86-106 B24t
106-122 B25t
122-146 C1
146-188 C2
188-202 B'h
V I K GHQ KQ
vs. percent clay x horizon thickness (cm)
Figure 12. X-ray diffraction patterns for untreated <2 micron fractions from selected soil horizons, Joynes Neck, site 2 (exact location and field description in table 3/4). Traces illustrated are of oriented, untreated clay. Peak spacings are in angstroms (A). Depths to middles of horizons are given in centimeters. V is hydroxy-interlayered vermiculite, I is illite, K is kaolinite, G is gibbsite, H is halloysite, and Q is quartz. Gibbsite peak intensity increases both above and below the Bt horizon. The ratio of 4.5 A halloysite to 4.85 A gibbsite is a maximum in the B24t horizon.
around the lines connecting the maximum and minimum ratios. We interpret the existence of the trends as showing that the younger, less clay-rich soils have more drainage microenvironments in which the formation of HIV and gibb site occur than do the older soils. We cannot propose a simple mechanism to explain the relative phase abundances but note that the changes in ratios appear to be related to increasing age and decreasing drainage.
for Oyster (site 3), Persimmon Point (site 5), the 23 m terrace (site 6) and the 45 m terrace (site 7). Figure 19 shows the increase in the HIV and gibbsite above the textural B horizons. With increasing depth and clay percentage, the ratio decreases. Moreover, going from the youngest soil to the oldest soil, the slopes of the hand-drawn best-fit lines decrease. For younger soils there is considerable scatter
The Loess Problem
Because the upper 1 m of most soils on the Delmarva Peninsula is generally more silty than the lower part of the sola, the question arises as to whether or not loess is a significant constituent of these soils. The presence of loess
12 Pedologk Studies in the Eastern United States
14.2
3.33
Oyster: Site 3
DEPTH (cm) AND HORIZON
0-27 Ap
27-50 B21t
50-70 B22t
70-117 B23t
117-132 IIB24t
132-147 IIB25t
147-175 IIB3
175-215 IIC
14.2 Nelsonia: Site 4
G HQ K Q
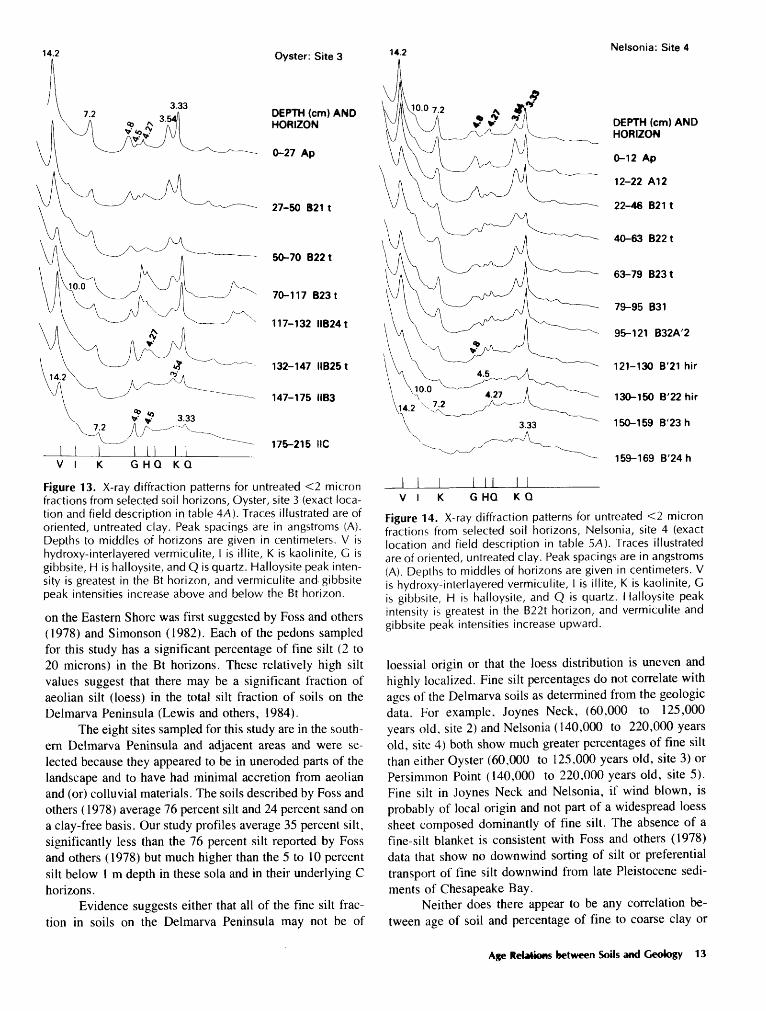
Figure 13. X-ray diffraction patterns for untreated <2 micron fractions from selected soil horizons, Oyster, site 3 (exact loca tion and field description in table 4/4). Traces illustrated are of oriented, untreated clay. Peak spacings are in angstroms (A). Depths to middles of horizons are given in centimeters. V is hydroxy-interlayered vermiculite, I is illite, K is kaolinite, G is gibbsite, H is halloysite, and Q is quartz. Halloysite peak inten sity is greatest in the Bt horizon, and vermiculite and-gibbsite peak intensities increase above and below the Bt horizon.
on the Eastern Shore was first suggested by Foss and others (1978) and Simonson (1982). Each of the pedons sampled for this study has a significant percentage of fine silt (2 to 20 microns) in the Bt horizons. These relatively high silt values suggest that there may be a significant fraction of aeolian silt (loess) in the total silt fraction of soils on the Delmarva Peninsula (Lewis and others, 1984).
The eight sites sampled for this study are in the south ern Delmarva Peninsula and adjacent areas and were se lected because they appeared to be in uneroded parts of the landscape and to have had minimal accretion from aeolian and (or) colluvial materials. The soils described by Foss and others (1978) average 76 percent silt and 24 percent sand on a clay-free basis. Our study profiles average 35 percent silt, significantly less than the 76 percent silt reported by Foss and others (1978) but much higher than the 5 to 10 percent silt below 1 m depth in these sola and in their underlying C horizons.
Evidence suggests either that all of the fine silt frac tion in soils on the Delmarva Peninsula may not be of
DEPTH (cm) AND HORIZON
0-12 Ap
12-22 A12
22-46 B21t
40-63 B22t
63-79 B23t
79-95 B31
95-121 B32A'2
121-130 B'21 hir
130-150 B'22hir
150-159 B'23h
159-169 B'24h
V I K G HQ K Q
Figure 14. X-ray diffraction patterns for untreated <2 micron fractions from selected soil horizons, Nelsonia, site 4 (exact location and field description in table 5/4). Traces illustrated are of oriented, untreated clay. Peak spacings are in angstroms (A). Depths to middles of horizons are given in centimeters. V is hydroxy-interlayered vermiculite, I is illite, K is kaolinite, G is gibbsite, H is halloysite, and Q is quartz. Halloysite peak intensity is greatest in the B22t horizon, and vermiculite and gibbsite peak intensities increase upward.
loessial origin or that the loess distribution is uneven and highly localized. Fine silt percentages do not correlate with ages of the Delmarva soils as determined from the geologic data. For example, Joynes Neck, (60,000 to 125,000 years old, site 2) and Nelsonia (140,000 to 220,000 years old, site 4) both show much greater percentages of fine silt than either Oyster (60,000 to 125,000 years old, site 3) or Persimmon Point (140,000 to 220,000 years old, site 5). Fine silt in Joynes Neck and Nelsonia, if wind blown, is probably of local origin and not part of a widespread loess sheet composed dominantly of fine silt. The absence of a fine-silt blanket is consistent with Foss and others (1978) data that show no downwind sorting of silt or preferential transport of fine silt downwind from late Pleistocene sedi ments of Chesapeake Bay.
Neither does there appear to be any correlation be tween age of soil and percentage of fine to coarse clay or
Age Relations between Soils and Geology 13

3.33
Persimmon Point: Site 5
DEPTH (cm) AND HORIZON
0-24 Ap
24-44 B21t
44-65 B22t
65-84 B23t
84-99 B24t
99-122 MB25 ir
122-150 IIB31
150-173 IIB32
173-200 IIB33
200-232 IIC
Norris Bridge: Site 6
14.2
3.33
VI K GHQ K Q
Figure 15. X-ray diffraction patterns for untreated <2 micron fractions from selected soil horizons, Persimmon Point, site 5 (exact location and field description in table 6/4). Traces illus trated are of oriented, untreated clay. Peak spacings are in angstroms (A). Depths to middles of horizons are given in centimeters. V is hydroxy-interlayered vermiculite, I is illite, K is kaolinite, G is gibbsite, H is halloysite, and Q is quartz. Halloysite peak intensity is greatest below the B21t horizon, and vermiculite and gibbsite peak intensities increase above the B2H horizon.
clay mineralogy in these four pedons. The presence of significant amounts of halloysite in the Bt horizons of the Oyster and Persimmon pedons does suggest that there has been significant in-situ development of clay which, based upon the Norris Bridge pedon, would appear to be contem poraneous with development of fine silt (Pavich, unpub. data). The absence of halloysite does not, however, preclude in-situ development of clay and silt in the Joynes Neck and Nelsonia sites. Since the halloysite structure does not easily survive aeolian transport, the clay in the Oyster and Persimmon Point pedons is considered to be pedogenic in origin (formed in situ).
Aeolian silt and clay are probably significant contrib utors to at least two of the Delmarva sites. The best evidence for an aeolian origin for silt and clay is the correlation of the fine silt bulge with an HIV-rich epipedon in the younger
DEPTH (cm) AND HORIZON
0-25 Ap
25-34 A2
34-48 B21t
48-70 B22t
70-96 B23t
96-138 B31
138-170 B32
170-200 C1
200-230 IIC2
K L GHQGo K Q F
Figure 16. X-ray diffraction patterns for untreated <2 micron fractions from selected soil horizons, Norris Bridge, site 6 (ex act location and field description in table 7A). Traces illus trated are of oriented, untreated clay. Peak spacings are in angstroms (A). Depths to middles of horizons are given in centimeters. V is hydroxy-interlayered vermiculite, I is illite, K is kaolinite, G is gibbsite, H is halloysite, L is lepidocrosite, Go is goethite, F is K-feldspar, and Q is quartz. Vermiculite peak intensity increases toward the surface and kaolinite peak inten sity is strong throughout the profile.
soils. In Nelsonia and Joynes Neck, the strong aeolian input is indicated by fine silt and correlates with a high ratio of HIV/halloysite through the profile. Fine silt is less abundant and the ratio of HIV/halloysite is lower in Oyster and Per simmon Point soils, which also have higher ratios of fine to coarse clay. This complicates the interpretation of the gene sis of those soils and points out the need for further study of the source and distance of transport of the loess.
Sites on the Rappahannock River show an increase of fine silt with age. In site 6, the production of fine quartz silt from the breakdown of coarser grains has been documented
14 Pedologic Studies in the Eastern United States

14.223 m Terrace: Site 7
14.2
3.54
7.2
DEPTH (cm) AND HORIZON
0-23 Ap
23-30 B1
30-44 B21 t
44-67 B22t
67-94 B23t
94-124 B24t
124-148 B25t
148-162 B26t
V I KQ
Figure 17. X-ray diffraction patterns for untreated <2 micron fractions from selected soil horizons, 23 m terrace, site 7 (exact location and field description in table 8/4). Traces illustrated are of oriented, untreated clay. Peak spacings are in angstroms (A). Depths to middles of horizons are given in centimeters. V is hydroxy-interlayered vermiculite, I is illite, K is kaolinite, G is gibbsite, H is halloysite, and Q is quartz. Kaolinite is the dominant clay mineral in all horizons, and vermiculite peak intensity increases in the A horizons.
(Pavich , unpub. data). It appears likely that an in-situ pedogenic origin for fine silt is significant in the Rappahan- nock profiles. The large mass of clay found on the older Rappahannock terraces, the clay mineralogy, and the bulk chemistry cannot be explained by a simple accumulation of aeolian HIV and quartz through time. Addition of highly siliceous aeolian material through time would not produce a trend of increasing Fe2O3 + Al2O3/SiO2, and the observed chemical trend is not consistent with an aeolian origin of silt and clay in these profiles (fig. 8).
From this study it is clear that there are two probable sources of fine silt in the A and B horizons of these pedons. Thus despite evidence for aeolian sediment transport (such as dunes and silt caps) care must be taken not to interpret all silty epipedons as loessial in origin. Scanning electron mi croscopy and oxygen isotope data (such as used by Sayin and Jackson, 1973) may help resolve the origin of the fine silt.
45 m Terrace: Site 8
DEPTH (cm) AND HORIZON
0-12 Ap
12-28 A2
28-43 B21t
60-84 B23t
84-112 B24t
112-146 825t
146-175 826t
175-213 827t
213-250 828t
V I K G HQ KQ
Figure 18. X-ray diffraction patterns for untreated <2 micron fractions from selected soil horizons, 45 m terrace, site 8 (exact location and field description in table 9/4). Traces illustrated are of oriented, untreated clay. Peak spacings are in angstroms (A). Depths to middles of horizons are given in centimeters. V is hydroxy-interlayered vermiculite, I is illite, K is kaolinite, G is gibbsite, H is halloysite, and Q is quartz. Kaolinite is the dominant clay mineral in all horizons, and vermiculite does not show an increase in intensity in the near-surface horizons.
Age Relations
As mapped, the marine deposits on the southern Del- marva Peninsula comprise a chronosequence of barrier, backbarrier, and (or) estuarine sediments deposited at suc cessively lower sea levels. Alternatively, as suggested by Hack (1955), the Piedmont and Coastal Plain of Virginia and Maryland have been undergoing regional uplift since the late Tertiary, thereby resulting in an off-lap sequence of Pleistocene marine sediments. The terraces along the Rap pahannock River also suggest either a progressive lowering of sea level or regional uplift during the Pliocene and Pleis tocene. Preserved soil profiles on marine and fluvial terraces
Age Relations between Soils and Geology 15

tn 6
o 4
P I 3UJ
. O
1°tr
EXPLANATION
Oyster: Site 3A Persimmon Point: Site 5
Y = 301.8-64.8(l« X)2 -0.1(1« X)
200 400 600 800 1000 1200 1400 1600 1800
PERCENTAGE CLAY x DEPTH (cm)
oCO 41-IiTi [flX oq
o! ^u. «- O
o< 3
Csj
1
O
t n
EXPLANATION
23 m Terrace: Site 7
i o 45 m Terrace: Site 8
- o
* a. o. o 0 * I 1 1 1 I
0 1000 2000 3000 4000 5000 6000 PERCENTAGE CLAY x DEPTH (cm)
B
Figure 19. Ratio of peak heights of 14.2 A+4.85 A/7.2 A+4.5 A peaks plotted against [horizon depth x percent clay per hori zon] for (A) sites Sand 5, and (B} sites 7 and 8. Peak heights measured from untreated X-ray diffraction patterns, figures 13, 15, 17, and 18. Textural data from tables 4B, 6B, 8B, and 98.
in this landscape increase in degree of development with increase in altitude. The grossly similar grain-size distributions (tables 2B through 9B and figure 3) for soils on the various surfaces and the common source of parent mate rial yield a chronosequence of soils ranging in age from about 30,000 to >1.0? m.y.
It is difficult to isolate certain physical characteristics such as soil color or thickness of solum (A and B horizons) from the chemical processes that produce them. However, plots of growth curves (changes of property over time) for physical and chemical characteristics (figs. 5 through 10) show similarities and divergences. The physical properties of redness, clay mass, and solum thickness suggest a step, or plateau, in growth curves at about 60,000 to 220,000 years and a subsequent increase in rate of development from 500,000? to > 1.0? m.y.
A third-degree polynomial (least squares) equation fits the data for redness of the Bt horizons better than a linear equation because the standard error of the estimate of a linear regression is 33.7, and this error is 0.8 for the third- degree polynomial. The equation is
whereY is redness andX is the natural log of age.
The inflection point of the curve is between 200,000 and 500,000 years. The data suggest, therefore, that the plateau at 60,000 to 220,000 years defines an upper limit of rapid soil development. Similar results are obtained by fitting equations to the other physical properties. The chemical property Al^C^ + Fe^C^/SiC^ ratio does not have this plateau. These curves indicate that properties change with time but at different rates and that in combination they can be used to determine the age of a soil.
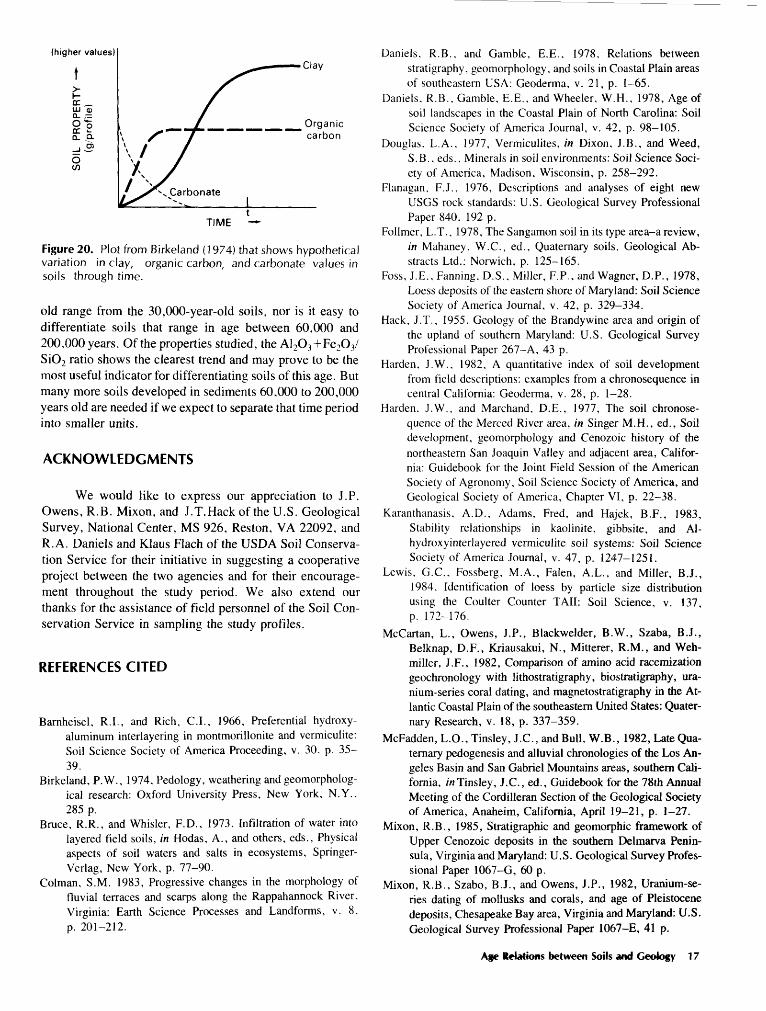
Birkeland (1974, p. 131) suggested hypothetical vari ations in several soil properties with time (fig. 20). His curves representing accumulation of organic carbon and clay are similar in that they both show steep positive slopes of rapid accumulation that level off to zero. The flat slopes represent a hypothetical stage of soil development during which no change in a particular soil property takes place. This can be considered to be a steady-state, or equilibrium, for that particular property. The plateau in the physical properties of the Maryland and Virginia Coastal Plain soils may indicate such steady states. However, after a certain period of little change, the properties again begin to change with time. The contrast of results of this study with those of others (Birkeland, 1974; Simonson, 1978) is possibly due to a lack of measurement of all properties of pedogenic origin in soils 1.0? m.y. old or older. Evidence presented here, that soil properties do continue to change throtigh time, is cor roborated by studies by Harden and Marchand (1977), Mc- Fadden and others (1982), and Harden (1982).
CONCLUSIONS
Soils developed on surfaces ranging in age from 30,000 to 1.0? m.y. and underlain by texturally and miner- alogically similar parent materials provide a means to study change of properties with age of surface. Physical properties of clay mass, redness, and solum thickness increase with time, except for a period of no change (steady state?) be tween 100,000 and several hundred thousand years. All physical properties studied show a dynamic nature, even in soils of ages greater than 1.0? m.y. Chemical properties such as the Al2O3+Fe2O3/SiO2 ratio appear to increase at a constant rate.
It is relatively easy to characterize the differences between the 30,000-year- and the 100,000- to 200,000- year-old sola, the 200,000- and 500,00?-year-old sola, and the 500,000?- and 1.0?-m.y.-old sola. It is not easy to differentiate soils between the 60,000- and 200,000-year-
16 Pedologic Studies in the Eastern United States
(higher values)
t
QC _LU QJQ-
Clay
Organic carbon
TIME
Figure 20. Plot from Birkeland (1974) that shows hypothetical variation in clay, organic carbon, and carbonate values in soils through time.
old range from the 30,000-year-old soils, nor is it easy to differentiate soils that range in age between 60,000 and 200,000 years. Of the properties studied, the Al2O3 +Fe2O3/ SiO2 ratio shows the clearest trend and may prove to be the most useful indicator for differentiating soils of this age. But many more soils developed in sediments 60,000 to 200,000 years old are needed if we expect to separate that time period into smaller units.
ACKNOWLEDGMENTS
We would like to express our appreciation to J.P. Owens, R.B. Mixon, and J.T.Hack of the U.S. Geological Survey, National Center, MS 926, Reston, VA 22092, and R.A. Daniels and Klaus Flach of the USDA Soil Conserva tion Service for their initiative in suggesting a cooperative project between the two agencies and for their encourage ment throughout the study period. We also extend our thanks for the assistance of field personnel of the Soil Con servation Service in sampling the study profiles.
REFERENCES CITED
Barnheisel, R.I., and Rich, C.I., 1966, Preferential hydroxy- aluminum interlayering in montmorillonite and vermiculite: Soil Science Society of America Proceeding, v. 30. p. 35- 39.
Birkeland, P.W., 1974, Pedology, weathering and geomorpholog- ical research: Oxford University Press, New York, N.Y., 285 p.
Bruce, R.R., and Whisler, F.D., 1973, Infiltration of water into layered field soils, in Hodas, A., and others, eds., Physical aspects of soil waters and salts in ecosystems, Springer- Verlag, New York, p. 77-90.
Colman, S.M. 1983, Progressive changes in the morphology of fluvial terraces and scarps along the Rappahannock River, Virginia: Earth Science Processes and Landforms, v. 8, p. 201-212.
Daniels, R.B., and Gamble, E.E., 1978, Relations between stratigraphy, geomorphology, and soils in Coastal Plain areas of southeastern USA: Geoderma, v. 21, p. 1-65.
Daniels. R.B., Gamble, E.E., and Wheeler, W.H., 1978, Age of soil landscapes in the Coastal Plain of North Carolina: Soil Science Society of America Journal, v. 42, p. 98-105.
Douglas, L.A., 1977, Vermiculites, in Dixon, J.B., and Weed, S.B., eds.. Minerals in soil environments: Soil Science Soci ety of America, Madison, Wisconsin, p. 258-292.
Flanagan, F.J., 1976, Descriptions and analyses of eight new USGS rock standards: U.S. Geological Survey Professional Paper 840. 192 p.
Follmer, L.T., 1978, The Sangamon soil in its type area-a review, in Mahaney, W.C., ed.. Quaternary soils, Geological Ab stracts Ltd.: Norwich, p. 125-165.
Foss, J.E., Fanning, D.S., Miller, P.P., and Wagner, D.P., 1978, Loess deposits of the eastern shore of Maryland: Soil Science Society of America Journal, v. 42, p. 329-334.
Hack, J.T., 1955, Geology of the Brandywine area and origin of the upland of southern Maryland: U.S. Geological Survey Professional Paper 267-A, 43 p.
Harden, J.W., 1982, A quantitative index of soil development from field descriptions: examples from a chronosequence in central California: Geoderma, v. 28, p. 1-28.
Harden. J.W., and Marchand, D.E., 1977, The soil chronose quence of the Merced River area, in Singer M.H., ed., Soil development, geomorphology and Cenozoic history of the northeastern San Joaquin Valley and adjacent area, Califor nia: Guidebook for the Joint Field Session of the American Society of Agronomy, Soil Science Society of America, and Geological Society of America, Chapter VI, p. 22-38.
Karanthanasis, A.D., Adams, Fred, and Hajek, B.F., 1983, Stability relationships in kaolinite, gibbsite, and Al- hydroxyinterlayered vermiculite soil systems: Soil Science Society of America Journal, v. 47, p. 1247-1251.
Lewis, G.C., Fossberg, M.A., Falen, A.L., and Miller, B.J., 1984, Identification of loess by particle size distribution using the Coulter Counter TAII: Soil Science, v. 137, p. 172-176.
McCartan, L., Owens, J.P., Blackwelder, B.W., Szaba, B.J., Belknap, D.F., Kriausakui, N., Mitterer, R.M., and Weh- miller, J.F., 1982, Comparison of amino acid racemization geochronology with lithostratigraphy, biostratigraphy, ura nium-series coral dating, and magnetostratigraphy in the At lantic Coastal Plain of the southeastern United States: Quater nary Research, v. 18, p. 337-359.
McFadden, L.O., Tinsley, J.C., and Bull, W.B., 1982, Late Qua ternary pedogenesis and alluvial chronologies of the Los An geles Basin and San Gabriel Mountains areas, southern Cali fornia, in Tinsley, J.C., ed., Guidebook for the 78th Annual Meeting of the Cordilleran Section of the Geological Society of America, Anaheim, California, April 19-21, p. 1-27.
Mixon, R.B., 1985, Stratigraphic and geomorphic framework of Upper Cenozoic deposits in the southern Delmarva Penin sula, Virginia and Maryland: U.S. Geological Survey Profes sional Paper 1067-G, 60 p.
Mixon, R.B., Szabo, B.J., and Owens, J.P., 1982, Uranium-se ries dating of mollusks and corals, and age of Pleistocene deposits, Chesapeake Bay area, Virginia and Maryland: U.S. Geological Survey Professional Paper 1067-E, 41 p.
Age Relations between Soils and Geology 17
Newell, W.L., 1985, Architecture of the Rappahannock Estuary neotectonics in Virginia, in Morisawa, M., and Hack, J.T., eds., Tectonic Geomorphology, proceedings volume of the Fifteenth Annual Geomorphology Symposia Series, held at Binghamton, N.Y., September 28-29, 1984: Alien and Un- win.
Owens, J.P., and Denny, C.S., 1979, Upper Cenozoic deposits of the Delmarva Peninsula, Maryland and Delaware: U.S. Geo logical Survey Professional Paper 1067-A, 28 p.
Owens, J.P., and Minard, J.P., 1979, Upper Cenozoic sediments of the lower Delaware Valley and the northern Delmarva Peninsula, New Jersey, Pennsylvania, Delaware, and Mary land: U.S. Geological Survey Professional Paper 1067-D, 47P-
Rich, C.I., 1968, Hydroxy interlayers in expansable layer sili cates: Clays and Clay Minerals, v. 16, p. 15-30.
Ruhe, R.V., 1969, Quaternary landscapes in Iowa: Iowa Univer sity Press, Ames, Iowa, 255 p.
Sayin, Mahmut, and Jackson, M.L., 1973, Scanning electron mi croscopy of cherts in relation to the oxygen isotopic variation of soil quartz: Clays and Clay Minerals, v. 23, p. 365-368.
Simonson, R.W., 1978, A multiple process model of soil genesis, in Mahaney, W.C., ed., Quaternary soils, Geological Ab stracts Limited: Norwich, p. 1-26.
1982, Loess in soils of Delaware, Maryland and Northeast ern Virginia: Soil Science, v. 133, p. 167-178.
Soil Survey Staff, 1951, Soil Survey Manual, U.S. Department of Agriculture, Bureau of Plant Industry, Soils, and Agricul tural Engineering Handbook No. 18: U.S. Government Print ing Office, Washington, D.C., 503 p.
1972, Soil Survey investigations report no. 1: Soil Survey laboratory methods and procedures for collecting samples: USDA, Soil Conservation Service, U.S. Government Print ing Office, Washington, D.C, 63 p.
1975, Soil taxonomy: USDA Soil Conservation Service,Agriculture Handbook No. 436, U.S. Government Printing Office, Washington, D.C. 754 p.
Thorp, J., and Smith, G.D., 1949, Higher categories of soil clas sification: Soil Science, v. 67, p. 117-126.
18 Pedologic Studies in the Eastern United States

Tables 1-9
Age Relations between Soils and Geology 19

Table 1. Analytical methods and units of expression for analyses conducted at the Soil Conservation Service, Na tional Soil Survey Laboratory, Lincoln, Nebraska
Analysis Method code 1 Unit of expression
Particle size ---------- 3AI weight percent <2 mmmaterial
Organic carbon ------- 6A1C weight percent <2 mmmaterial
Dithionite-citrate ------ 6C2A weight percent <2 mmmaterial
Iron ----------------- 6C2B weight percent <2 mmmaterial
Aluminum ----------- 6G7A weight percent <2 mmmaterial
Manganese ----------- 6D2A weight percent <2 mmmaterial
Bulk density ---------- 4A1D g/cm3 <2 mm materialCOLE2 -------------- 4DI cm/cm whole soil15-bar tension -------- 4B2A weight percent <2 mm
material WRD3 -------------- 4CI cm/cm whole soilExtractable bases ------ 5B5A meq/100 g <2 mm
material CEC
Sum of cations ---- 5A3A meq/100 g <2 mmmaterial
NH4OAC -------- 5A8B meq/100 g <2 mmmaterial
Al+bases4 ------- 5A3B meq/IOOg<2mmmaterial
Base saturationSum of cations - - - - 5C3 percentNH4OAC -------- 5C1 percent
PHCaCI2 ----------- 8C1E negative log 10H2O ------------ 8C1A negative log 10
'Method codes from Soil Survey Staff (1972)Coefficient of linear extensibility3Water-retention difference4Aluminum precipitates from solution at pH 4.5 to 4.8. For pH 2:5,extractable aluminum is not measured.
20 Pedologtc Studies in the Eastern United States

Table 2/4. Description of physical characteristics of soil horizons at site 1, Eastern Neck Island, 28,000 years B.P. [Eastern Neck Island is on the west side of the Delmarva Peninsula, 7 km north of U.S. Highway 50 bridge in Kent County, Maryland (fig. 1). The parent material is quartzose sand and silt of the Kent Island Formation. Surface elevations on Eastern Neck Island range from 3 to 7 m. Our study site on the island is the only study locality without a detailed pedon description. Vegetation at the site is dominantly grass with a mixed hardwood forest only a few meters distant; the pit was approximately 18 m from the shore (39°59'30" N. lat, 75°59'15" W. long, 6 m MSL elevation, Langford Creek 7 1/2 min. topographic quadrangle). The amount of aerosol contribution, if any, at this locality is undetermined, but a loess cap is indicated by textural analysis (Foss and others, 1978) and mineralogy. Further investigations are in progress. Only a general profile description was made at this locality, but it agrees with the mapped series]
Depth (cm)
0 13 -----nil-31 43 -----43 69 -----69 92 -----92+-------
0 25 -----OC f^\
61 97 -----Q7 1 *Ci
Horizon
A 1
A9DO 1
DOT
TJT
----- C
... . . An/\p tj') 1 1
----- B22g ----- C2^&
Moist color 1
10YR5/1 10YR5/1 10YR6/4 10YR5/6 10YR6/4 10YR5/6
Typical pedon
10YR4/3 10YR5/6 10YR6/4 10YR6/4
Texture2
sisi sil sis s
of Woodstown
si 1 si Is
Structure3 Clay skins
SG few bridges SG SG
Imgr 2msbk 2mpl-2msbk MA
Roots4 Boundary5
mf ff as ff
mf as mf cw ff cw
'Color: Munsell notation2Texture: l=loam, sil^silty loam, sl=sandy loam, ls=loamy sand, s=sand, g=gravelStructure: l=weak, 2=moderate, m=medium, gr=granular, sbk=subangular blocky, pl=platy, SG=single grain, MA=massive4Roots: ff=few fine, mf=many fine5 Boundary: cs=clear smooth, as=abrupt smooth, cw=clear wavy, gs=gradual smooth
Table 26. Textural analyses of soil horizons at site 1, Eastern Neck Island[<, less than; F, fine; C, coarse; VF, very fine; VC, very coarse; M, medium; TR, trace; grain sizes in millimeters]
Total Silt Sand
Depth (cm)
0-13 -13-30 -30-43 -43-69 -69-91 -92+ --
Horizon
--- Al--- A2--- B21--- B22--- B3--- C
Clay <.002
5.85.34.46.01.6
10.5
Silt .002-.05
32.534.234.928.412.127.5
Sand .05-2
61.760.560.765.686.362.0
F .002-.02
15.416.817.814.12.87.7
C.02-.05
17.117.417.114.39.3
19.8
VF .05-.10
13.924.815.117.620.818.4
F .10-.25
29.528.430.832.844.228.7
M .25-.50
15.415.113.413.819.613.8
C .5-1
1.82.01.31.41.61.1
VC1-2
0.1.2.1
PR.1
TR
Age Relations between Soils and Geology 21
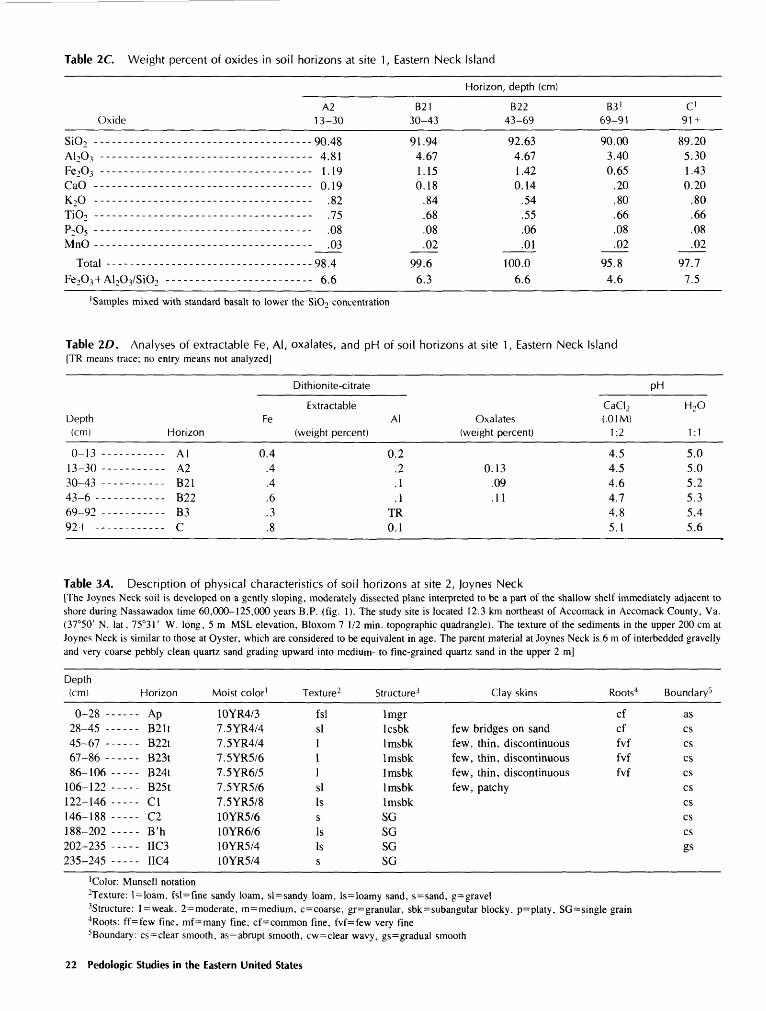
Table 2C Weight percent of oxides in soil horizons at site 1, Eastern Neck Island
Horizon, depth (cm)
Oxide
SiO, ------------------------A1,O, -----------------------Fe2O3 -----------------------PaO
K /~l
TiO2 ------------------------P r\
MnO ------------------------
Total ----------------------Fe^Oj+Al^OySiO-, ------------
A2 13-30
-------------90.48------------- 4.81------------- 1.19............. 0.19
89
---.--..-...- .75no
-...-...-.... .03
.--.--..-...-98.4
............. 6.6
B21 30-43
91.94 4.67 1.15 0.18
.84
.68
.08
.02
99.6 6.3
B22 43-69
92.63 4.67 1.42 0.14
.54
.55
.06
.01
100.0 6.6
B3 1
69-91
90.00 3.40 0.65
.20
.80
.66
.08
.02
95.8 4.6
C 191 +
89.20 5.30 1.43 0.20
.80
.66
.08
.02
97.7 7.5
'Samples mixed with standard basalt to lower the SiO2 concentration
Table 2D. Analyses of extractable Fe, Al, oxalates, and pH of soil horizons at site 1, Eastern Neck Island [TR means trace; no entry means not analyzed]
Depth(cm)
0 13 -----
13 30 -----
30 43 ------
43 6 ------.69 92 -----Cn i
Horizon
A 1
A 9
m i
RT>
B1
------ C
Fe
0.4
.4
.4
.6
.30
Dithionite-citrate
Extractable Al
(weight percent)
0.2.2.1.1
TR
0.1
Oxalates (weight percent)
0.13.09.11
Pi
CaCI 2 (.01 M)
1:2
4 5
4.5
4.6
4.7
4.8
5.1
H
H 20
1:1
5.0
5.0
5.2
5.35 4
5.6
Table 3/4. Description of physical characteristics of soil horizons at site 2, Joynes Neck[The Joynes Neck soil is developed on a gently sloping, moderately dissected plane interpreted to be a part of the shallow shelf immediately adjacent to shore during Nassawadox time 60,000-125,000 years B.P. (fig. 1). The study site is located 12.3 km northeast of Accomack in Accomack County, Va. (37°50' N. lat, 75°31' W. long, 5 m MSL elevation, Bloxom 7 1/2 min. topographic quadrangle). The texture of the sediments in the upper 200 cm at Joynes Neck is similar to those at Oyster, which are considered to be equivalent in age. The parent material at Joynes Neck is 6 m of interbedded gravelly and very coarse pebbly clean quartz sand grading upward into medium- to fine-grained quartz sand in the upper 2 m]
Depth(cm)
O TO
28 45 -45 67 -f~] O/i
86-106106-122 122 1461 A £ 1 OO
1 88 9O9
202 235235 ?45
Horizon
An----- Ap
mi t
T3TH
RO^t
----- B24t----- B25t ----- Cl----- C2----- B'h
. ... nc3... . HC4
Moist color1
10YR4/37.5YR4/47.5YR4/47 C"VD C !£.
1 <VD/i/C
7.5YR5/61 <VR^/8
i nvD c /^
i nvD f* if*
10YR5/410YR5/4
Texture2
fslsi111si Iss IsIs
Structure3
ImgrIrshlflUsUK
ImsbkImsbkImsbk ImsbkGA"1
GA"1
OA"1
OA"1
few
fewfew
Clay skins
, thin, discontinuous
, patchy
Roots4
cfcffvffvffvf
Boundary5
cs
5
'Color: Munsell notation2Texture: l=loam, fsl=fine sandy loam, sl=sandy loam, ls=loamy sand, s=sand, g=gravel3Structure: l=weak, 2=moderate, m=medium, c=coarse, gr=granular, sbk=subangular blocky, p=platy, SG=single grain4Roots: ff=few fine, mf=many fine, cf=common fine, fvf=few very fine5Boundary: cs=clear smooth, as=abrupt smooth, cw=clear wavy, gs=gradual smooth
22 Pedologic Studies in the Eastern United States

Table 36. Textural Analyses of soil horizons at site 2, Joynes Neck [Sampled as: fine-loamy, mixed, thermic Typic Hapludult; <, less than; F, fine; , not detected; grain sizes in millimeters]
C, coarse; VF, very fine; VC, very coarse; M, medium;
Depth (cm)
0-28 -28-45 -45-67 -67-86 -
86-106106-122122-146146-188188-202202-235235-245
Horizon
--- Ap--- B21t--- B22t--- B23t--- B24t--- B25t--- Cl--- C2--- B'h- - - IIC3- - - IIC4
Clay <.002
8.615.917.117.516.312.16.42.42.00.4
Total
Silt .002-.05
31.238.940.140.335.315.44.33.41.10.71.0
Sand .05-2
60.245.242.842.248.472.589.394.296.998.999.0
Clay
F <.0002
2.05.75.33.75.75.32.0
0.4
Sil
F .002-.02
22.929.830.929.725.612.13.22.40.4
.4
.4
t
C .02-.05
8.39.19.2
10.69.73.31.11.00.7
.3
.6
VF .05-. 10
2.92.32.22.12.43.45.93.72.79.11.2
S,
F .10-.25
21.615.414.614.316.725.331.324.044.257.5
8.9
and
M .25-.50
28.020.119.219.421.933.738.444.241.021.320.0
C VC .5-1 1-2
7.1 0.66.1 1.35.8 1.05.6 0.86.4 1.07.8 2.3
10.5 3.217.9 4.48.0 1.06.0 5.0
35.3 33.6
Table 3C. Weight percent of oxides in soil horizons at site 2, loynes Neck [TR means trace]
Horizon, depth (cm)
Oxide
SiO, ------------A1 76, -----------
C^Q 3
K /~i
TiO2 ------------
P oMnO ------------
Total ----------
Fe2O3 +Al2O3/SiO2
Ap 0-28
--87.04 - 5 47-- 1.79-- 0.36-- 1.09
S7
- .13
055
% Q
- 8.3
B21t 28-45
82.81 7.75 2.94 0.25 1.21 .97 .039 .099
96.112.9
B22t 45-67
82.10 9.14 2.77 0.28 1.07 .87 .091 .080
96.4 14.5
B23t 67-86
82.16 8.26 3.24 0.25 1.32 1.01 .046 .051
96.3 14.0
B24t 86-106
82.46 7.88 3.44 0.25 1.29 1.00 .039 .039
96.413.7
B25t 106-122
87.40 5.79 2.87 0.26
.98 1.10 .034 .046
98.48 9.9
C1 122-146
93.92 3.75 1.78 0.24
.70 1.24 .068 .039
101.7 5.9
C2 146-188
95.97 2.15 1.05 0.18
.59 1.14 .032 .036
101.1 3.3
B'h
188-202
93.75 3.82 0.35
.33 1.09
.39
.016
.020
99.84.5
IIC3 202-235
92.37 3.56 0.12
.39 1.18 0.31
TR TR
97.9 4.0
IIC4 235-245
97.32 2.07 0.27
.28
.88
.15 TR TR
101.02.3
Table 3D. Analyses of extractable Fe, Al, and Mn, oxalates, ratio clay, and bulk density of soil horizons at site 2, Joynes Neck [TR means trace; * means estimated; means not detected]
Depth(cm)
n os28 45 ----45 67 ----f^-l Or
86 106 ---1 C\£. 1 O^>
122-146 ---1 A £* 1 OO
i ss ono202 235 ---235 245 ---
Horizon
AnAp m 1 1
DTH
DTJt
--- B24tRO^t
--- Cl--- C2--- B'h--- IIC3. . . nc4
Fe
0.6
1.1
1.2
1.2
1.2
1.1
.5
.2
.2
.1
.2
Dithionite-citrate
ExtractableAl
(weight percent)
0.2.3.3.2.2.2.1
TR
.2
.1
.1
Mn
TR
0.1TD
TR
TD
TR
TD
TD
TD
TD
TD
(weight percent)
0.12
.15
.10
Ratio
CEC
0.53OS
OS
.30
.32
.3023
.21
.40
.25
clay
15 bar
0.47
.41
.39
.40
.41
.44
.44
54
.90~> on
Bulk density1/3 bar
1.651 /iO
1.481.611.721.671.501.60*1.70*1.70*1.70*
Age Relations between Soils and Geology 23
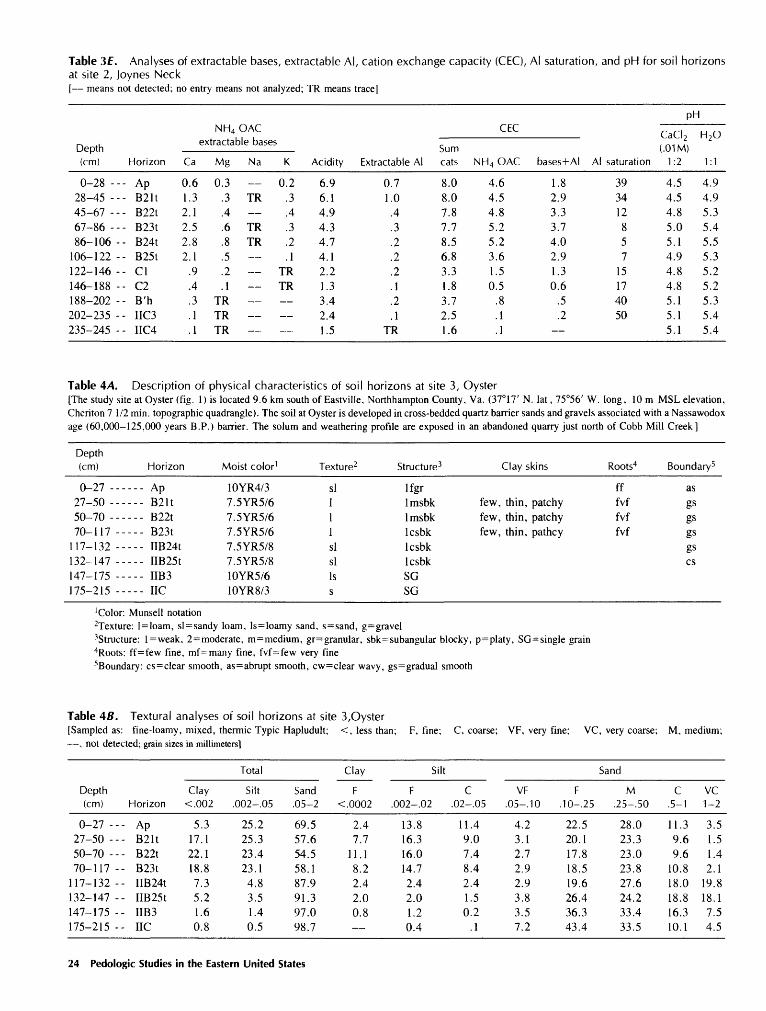
Table 3f. Analyses of extractable bases, extractable Al, cation exchange capacity (CEC), Al saturation, and pH for soil horizonsat site 2, Joynes Neck[ means not detected; no entry means not analyzed; TR means trace]
Depth(cm)
0-28 ---28-45 ---45-67 ---67-86 - - -86-106 --
106-122 --122-146 --146-188 --188-202 --202-235 --235-245 --
NH 4 OACextractable bases
Horizon
ApB21tB22tB23tB24tB25tClC2B'h
IIC3IIC4
Ca
0.61.32.12.52.82.1
.9
.4
.3
.1
.1
Mg
0.3.3.4.6.8.5.2.1
TRTRTR
Na
TR TRTR
K
0.2.3.4.3.2.1
TRTR
Acidity
6.96.14.94.34.74.12.21.33.42.41.5
Extractable Al
0.71.0
.4
.3
.2
.2
.2
.1
.2
.1TR
Sumcats
8.08.07.87.78.56.83.31.83.72.51.6
CEC
NH 4 OAC
4.64.54.85.25.23.61.50.5
.8
.1
.1
pH
bases+AI
1.82.93.33.74.02.91.30.6
.5
.2
Al saturation
393412
857
15174050
CaCI 2(.01 M)
1:2
4.54.54.85.05.14.94.84.85.15.15.1
H 2 O
1:1
4.94.95.35.45.55.35.25.25.35.45.4
Table 4/4. Description of physical characteristics of soil horizons at site 3, Oyster[The study site at Oyster (fig. 1) is located 9.6 km south of Eastville, Northampton County, Va. (37°17' N. lat, 75°56' W. long, 10 m MSL elevation, Cheriton 7 1/2 min. topographic quadrangle). The soil at Oyster is developed in cross-bedded quartz barrier sands and gravels associated with a Nassawodox age (60,000-125,000 years B.P.) barrier. The solum and weathering profile are exposed in an abandoned quarry just north of Cobb Mill Creek]
Depth (cm)
n 0727 50 ----50 70 ----70 117 ---
m i ~\i132 147 ---147 175 -- 175 215 ---
Horizon
An/\p m 1 1
RT)t
mi*
--- IIB24tTTRO^t
TTD1
--- IIC
Moist color 1
10YR4/3 7.5YR5/6 7.5YR5/6 7.5YR5/6 7.5YR5/8 7.5YR5/8 10YR5/6 10YR8/3
Texture2
si 1 1 1 si si Is s
Structure 3
Ifgr Imsbk 1ms bk Icsbk Icsbk Icsbk SG SG
Clay skins
few, thin, patchy few, thin, patchy few, thin, pathcy
Roots4
ff fvf fvf fvf
Boundary5
asgs gs gs gs cs
'Color: Munsell notation2Texture: l=loam, sl=sandy loam, ls=loamy sand, s=sand, g=gravel3Structure: l = weak, 2=moderate, m=medium, gr=granular, sbk=subangular blocky, p=platy, SG=single grain4Roots: ff=few fine, mf=many fine, fvf=few very fine5Boundary: cs=clear smooth, as=abrupt smooth, cw=clear wavy, gs=gradual smooth
Table 46. Textural analyses of soil horizons at site 3,Oyster [Sampled as: fine-loamy, mixed, thermic Typic Hapludult; <, less than; , not detected; grain sizes in millimeters]
F, fine; C, coarse; VF, very fine; VC, very coarse; M, medium;
Depth(cm)
0-27 ---27-50 ---50-70 ---70-117 --
117-132 --132-147 --147-175 --175-215 --
Horizon
ApB21tB22tB23tIIB24tIIB25tIIB3IIC
Clay <.002
5.317.122.118.87.35.21.60.8
Total
Silt .002-.05
25.225.323.423.14.83.51.40.5
Sand .05-2
69.557.654.558.187.991.397.098.7
Clay
F <.0002
2.47.7
11.18.22.42.00.8
Silt
F .002-.02
13.816.316.014.72.42.01.20.4
C .02-.05
11.49.07.48.42.41.50.2
.1
VF .05-.10
4.23.12.72.92.93.83.57.2
Sand
F .10-.25
22.520.117.818.519.626.436.343.4
M .25-.50
28.023.323.023.827.624.233.433.5
C.5-1
11.39.69.6
10.818.018.816.310.1
VC 1-2
3.51.51.42.1
19.818.17.54.5
24 Pedologic Studies in the Eastern United States

Table 4C. Weight percent of oxides in soil horizons at site 3, Oyster [TR means trace]
Horizon, depth (cm)
Oxide
SiO2 --------
Fe203 -------PaO
K O
TiO2 -------- Po2(J5 -------- MnO --------
Total ------
Ap0-27
-------- 93.67 3 00
0 81
-------- .31QC
.-.--_--. 55-------- .10
ro
......... 100.2
>iO 2 ---- 4.9
B21t 27-50
84.91 8.11 2.28 0.28 1.05 .64 .027 .026
97.3
12.2
B22t 50-70
77.31 10.47 3.53 0.28 1.03
.62
.05
.02
93.3
18.1
B23t 70-1 1 7
86.25 7.45 3.26 0.23 1.11 0.61 0.039 0.023
99.0
12.4
IIB24t 117-132
92.22 4.97 1.08 0.27
.84
.55
.016
.024
99.9
6.6
B25t 132-147
90.17 6.19 0.61
.30
.91
.28
.031
.017
98.5
7.5
IIB3147-175
95.45 3.33 0.02
.24
.97
.11 TR TR
100.1
3.5
IIC175-215
88.95 4.17 0.01
.35 .96 .19
TR TR
94.6
4.7
Table 4D. Analyses of extractable Fe, Al, and Mn, oxalates, ratio clay, and bulk density of soil horizons at site 3, Oyster [TR means trace; * means estimated; means not detected]
Depth(cm)
0 27 ----27 50 ----
50 70 ----70 117 ---
117 132 ---132 147 ---147 175 ---175 215 ---
Horizon
- - An/\pRO 1 1
ROOt
Ro^t--- IIB24t
TTRTCf
IID1
--- IIC
Fe
0.41.21 Q
1.6.6.5.1.1
Dithionite-citrate
Extractable Al Mn
(weight percent)
0.1"> TP
1 TP
3 Tp
1
\
.1Tp
Oxalates(weight percent)
0.07
.13
.17
.04
CEC
0.47.27.293225
.21
.19TP
Ratio clay
15 bar
0.49.39.40.42.42.48
1 251 ^8
Bulk density1/3 bar
1 0-3
1.791.571.671.80*1 S 1
1.80*1.80*
Table 4f. Analyses of extractable bases, extractable Al, cation exchange capacity (CEC), Al saturation, and pH for soil horizonsat site 3, Oyster[ means not detected; TR means trace]
Depth(cm)
0-27 --27-50 --50-70 --70-117 -
117-132 -132-147 -147-175 -175-215 -
NH4 OACextractable bases
Horizon
-Ap
-B21t-B22t-B23t- IIB24t- IIB25t- IIB3-IIC
Ca
1.71.92.72.61.10.8
.4
.6
Mg
0.7.7
1.11.1.5.4.2.1
Na K
0.4 0.4 0.4TR 0.1 0.1 0.1 TR TR
PH
Acidity Al
2.43.55.5 0.35.93.02.40.2
.8
Sum cats
5.26.59.79.74.73.70.81.5
«C
NH 4 OAC bases +AI saturation
2.54.76.4 4.5 76.01.81.10.3TR
CaCI 2(.01 M)
1:2
5.85.45.05.05.15.25.45.4
H 2 O
1:1
6.26.05.45.65.65.75.85.9
Age Relations between Soils and Geology 25

Table 5/4. Description of physical characteristics of soil horizons at site 4, Nelsonia[The soil developed in medium to coarse barrier sands of the Omar Formation, 140,000-220,000 years in age. The site is 1.6 km south-southwest of Nelsonia near the junction of County Rd. 681 and U.S. Highway 13 (37°46' N. lat, 75°36' W. long, 15 m MSL elevation, Bloxom 7 1/2 min. topographic quadrangle) (fig. 1). It is possible that the Nelsonia site is on the rim of a Carolina Bay, which would make the land surface somewhat younger than that of the stratigraphically younger Nassawadox beds that also have well developed bays. The water table was intercepted at 167 cm]
Depth(cm)
A 1 T
12 22 -22 40 -40 63 -63 79 -79 95 -
95-121121-130130-150 150 159159 169
Horizon
An
A 19R"71 1
RT)t
DTJt
D7 1
-----B32A'2-----B'21hir-----B'22hir -----B'23h-----B'24h
Moist color 1
10YR4/310YR4/37 5YR4/47.5YR4/47.5YR5/67.5YR5/610YR5/610YR5/67.5YR4/4 7.5YR4/4^VR'V)
Texture2
fslfsl11sisiIfsIfss IsIs
Structure3 Clay skins
Imgr ImsbkImsbkImsbk few, thin, discontinuous
ImsbkImsbk few, thin, discontinuousGA"1
MAMA MAivl/\
MA
Roots4
cfm££ ***
ffmffmffffffff
Boundary5
a5&st> s
cs
'Color: Munsell notation2Texture: l=loam, sl=sandy loam, fsl=fine sandy loam, ls=loamy sand, s=sand, g-gravel3Structure: l=weak, 2=moderate, m=medium, gr=granular, sbk=subangular blocky, p=platy, SG=single grain, MA=massive4Roots: ff=few fine, mf=many fine, cfm=common fine and medium, ffm=few fine and medium5 Boundary: cs=clear smooth, as=abrupt smooth, cw=clear wavy, gs=gradual smooth
Table 5B. Textural analyses of soil horizons at site 4, Nelsonia[Sampled as: fine-loamy, mixed, thermic Typic Hapludult; <, less than; F, fine; C, coarse; VF, very fine; VC, very coarse; M, medium; TR, trace; , not detected; grain sizes in millimeters]
Depth (cm)
0-12 ---12-22 ---22-40 ---40-63 ---63-79 ---79-95 ---95-121 --
121-130 --130-150 --150-159 --159-169 --
Horizon
ApA12B21tB22tB23tB31B32A'2B'21hirB'22hirB'23hB'24h
Table 5C. Weight [ means not detected;
Oxide
SiO, -----Al,6, -----
CaO 3
K nTib, ------
P r\
MnO -----
Total
Fe 2O3 +Al2O3/SiO2 --
Total Clay Silt
Clay Silt Sand F F <.002 .002-.05 .05-2 <.0002 .002-.02
6.8 8.2
22.923.413.46.43.63.30.8
.8
.4
26.9 31.938.939.423.610.76.54.84.21.32.4
percent of oxides TR means trace]
Ap 0-12
86.27 4.15 1.11 0.34
.91
.57
.06
.03
93.7 6.1
A12 12-22
88.66 5.28 1.58 0.22 1.02 .67 .02 .03
97.5 7.7
66.3 59.938.237.263.082.989.991.995.097.997.2
in soil horizons
B21t B22t 22-40 40-63
80.66 78.42 9.42 10.43 3.70 4.21 0.20 0.16 1.30 1.39 .81 .87 .04 .054 .03 .036
96.2 95.6 16.3 18.7
0.92.59.49.84.91.2
.81.2
.8 -
at site 4,
B23t 63-79
85.49 6.41 2.42 0.14
.94
.66
.032
.029
96.1 10.3
18.7 22.529.528.717.07.25.23.32.90.81.2
Nelsonia
Horizon,
B3179-95
94.91 3.38 1.05 0.14
.61
.52
.073
.017
100.74.7
Sand
C.02-.05
8.2 9.49.4
10.76.63.51.31.51.30.51.2
depth (cm)
B32A'2 95-121
100.04 2.13 0.33
.14
.62
.31
.01
103.62.5
VF .05-.10
2.8 2.41.41.42.22.72.44.68.04.33.4
B'21hir 121-130
91.06 3.64 0.89
.21
.75
.40
.015
.014
97.0 5.0
F .10-.25
25.923.214.814.724.934.141.546.738.834.041.5
B'22hir 130-150
93.17 3.27 0.33
.22
.77
.35 TR TR
98.1 3.9
M .25-.50
32.9 29.419.118.631.940.442.338.343.649.448.4
B'23h 150-159
97.52 1.81 0.002
.18
.72
.24 TR TR
100.5 1.9
C VC.5-1 1-2
4.5 0.2 4.5 .42.8 .12.5 TR3.9 .15.3 .43.4 .32.2 .14.3 .38.3 1.93.3 .6
B'24h 159-169
98.10 1.90
TR 0.18
.63
.13 TR TR
100.9 1.8
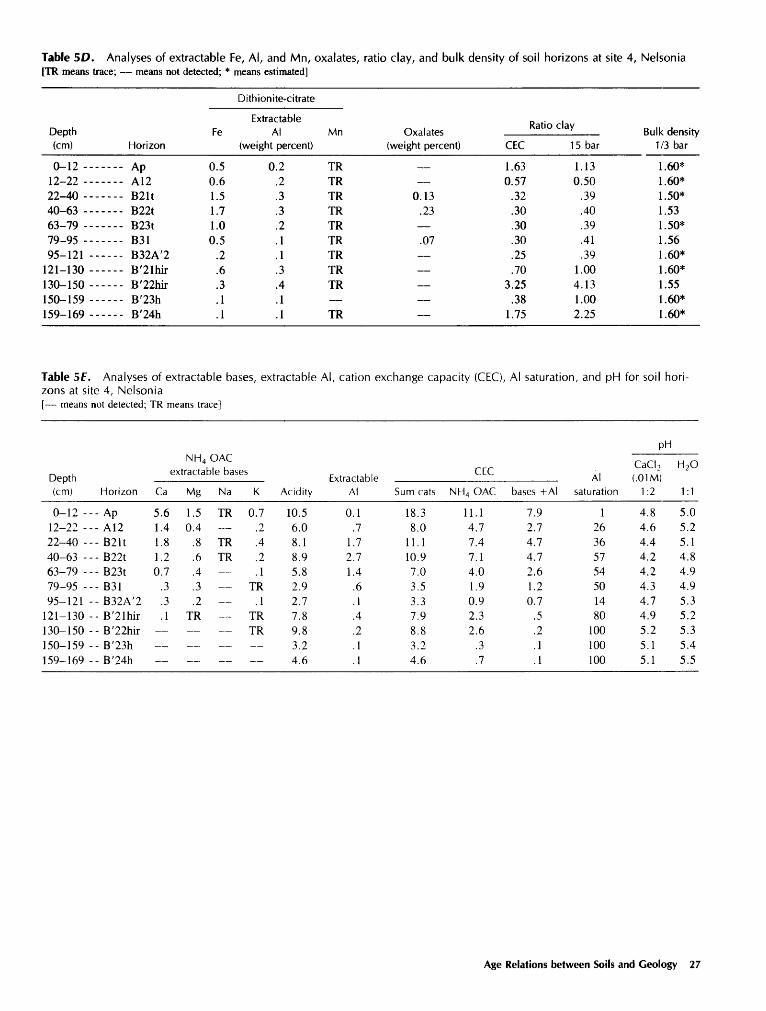
Table 5D. Analyses of extractable Fe, Al, and Mn, oxalates, ratio clay, and bulk density of soil horizons at site 4, Nelsonia [TR means trace; means not detected; * means estimated]
Depth (cm)
0-12 ----12 22 ----22-40 ----40 63 ----63-79 ----79 95 ----95 121 ---
121 130 ---130-150 ---150 159 ---159 169 ---
Horizon
--- An/\p... A19
T3T1 *
T3T)f
noitTJ-JI
... Ftt?A'2
--- B'21hir--- B'22hir--- B'23h--- B'24h
Fe
0.5 0.6 1.5 1.7 1.0 0.5
.2
.6
.3
.1
.1
Dithionite-citrate
Extractable Al
(weight percent)
0.2 .2 .3 .3 .2 .1 .1 .3 .4 .1 .1
Mn Oxalates (weight percent)
TR
TR 0.13 TR .23 TR TR .07 TR TR TR
TR
Ratio clay
CEC
1.63 0.57
.32
.30
.30
.30
.25
.70 3.25
.38 1.75
15 bar
1.13 0.50
.39
.40
.39
.41
.39 1.00 4.13 1.00 2.25
Bulk density 1/3 bar
1.60* 1.60* 1.50*
1.53 1.50*
1.56 1.60* 1.60*
1.55 1.60*
1.60*
Table 5f. Analyses of extractable bases, extractable Al, cation exchange capacity (CEC), Al saturation, and pH for soil hori zons at site 4, Nelsonia [ means not detected; TR means trace]
pH
Depth(cm)
0-12 -12-22 -22-40 -40-63 -63-79 -79-95 -95-121
121-130130-150150-159159-169
NH 4 OACextractable bases
Horizon
--AP-- A12--B21t--B22t--B23t--B31--B32A'2--B'21hir--B'22hir--B'23h-- B'24h
Ca
5.61.41.81.20.7
.3
.3
.1
Mg
1.50.4
.8
.6
.4
.3
.2TR
Na K
TR 0.7_ _2TR .4TR .2
.1 TR
.1 TR TR
Acidity
10.56.08.18.95.82.92.77.89.83.24.6
ExtractableAl
0.1.7
1.72.71.4
.6
.1
.4
.2
.1
.1
Sum cats
18.38.0
11.110.97.03.53.37.98.83.24.6
CEC
NH4 OAC
11.14.77.47.14.01.90.92.32.6
.3
.7
bases +AI
7.92.74.74.72.61.20.7
.5
.2
.1
.1
Alsaturation
126365754501480
100100100
CaCI 2(.01 M)
1:2
4.84.64.44.24.24.34.74.95.25.15.1
H 2 O
1:1
5.05.25.14.84.94.95.35.25.35.45.5
Age Relations between Soils and Geology 27

Table 6/4. Description of physical characteristics of soil horizons at site 5, Persimmon Point[The Persimmon Point site (fig. 1) is about 16 km west-northwest of the Joynes Neck locality in Accomack County, Va. (37°50' N. lat, 75°32' W. long , Bloxom 7 1/2 min. topographic quadrangle). It is 12 m MSL and like the Nelsonia site the soil is developed in the 200,000 year Omar Formation. The unweathered parent material of cross-bedded quartz sand and pebble gravel also shows marine influence by the presence of borings, flasier structure, and ophiomora burrows. The best exposure of the parent material is in the sand pit about 0.8 km to the east of the study site. The water table was intercepted at 290 cm]
Depth(cm)
0 24 -----JA. 44 -----
44_65 -----65 84 -----84 99 -----99-122 ----
122-150 ----150-173 ----173-200 ----200-232 ----
Horizon
AnA.pm 1 <-D2.lt
B22tDTJtDZjt
B24tIIB25irIIB31IIB32IIB33IIC
Moist color 1
10YR4/37 C"VD C If.. .JlKj/O
7.5YR5/67.5YR5/67.5YR5/62.5YR3/62.5YR3/67.5YR5/87.5YR5/62.5YR7/6
Texture2
fslsclsclsclfslsssss
Structure3
ImgrImsbkImsbkImsbkImsbkMASGSGSGSG
Clay skins
few, thin, patchy
few, thin, patchyfew, thin, patchy
Roots4
fvfmvffvffvffvffvffvf
Boundary5
ascscsawcscscscscs
'Color: Munsell notation2Texture: l=loam, sl=sandy loam, fsl=fine sandy loam, scl=sandy clay loam, ls=loamy sand, s=sand, g=gravelStructure: l=weak, 2=moderate, m=medium, gr=granular, sbk=subangular blocky, p=platy, SG=single grain, MA=massive4Roots: ff=few fine, mf=many fine, fvf=few very fine, mvf=many very fine5Boundary: cs=clear smooth, as=abrupt smooth, cw=clear wavy, gs=gradual smooth, aw=abrupt wavy
Table 65. Textural analyses of soil horizons at site 5, Persimmon Point[Sampled as: fine-loamy, mixed, thermic Typic Hapludult; <, less than; F, fine; C, coarse; VF, very fine; VC, very coarse; M, medium; , not detected; grain sizes in millimeters]
Depth(cm)
0-24 ---24-44 ---44-65 ---65-84 ---84-99 ---99-122 --
122-150 --150-173 --173-200 --200-232 - -
Table 6C.
Horizon
ApB21tB22tB23tB24tIIB25irIIB31IIB32IIB33IIC
Weight
Clay
Total
Silt Sand<.002 .002-.05 .05-2
8.221.722.117.115.12.41.6 0.4
35.831.730.822.415.52.10.61.2.7.6
56.046.647.160.569.495.597.898.898.999.4
Clay
F<.0002
2.914.310.69.87.31.20.8
percent of oxides in soil horizons at site
Silt
F
Sand
C.002-.02 .02-.05
26.222.122.516.310.2
1.20.4
.4
.7
.4
5, Persimmon
9.69.68.36.15.30.9
.2
.8
.2
Point
VF F.05-.10 .10-.25
.5
.3
.3
.4
.61.10.2
.3
.6
.3
7.85.66.36.87.4
15.03.43.92.89.0
M.25-.50
33.231.432.441.148.573.756.454.931.765.3
C VC.5-1 1-2
12.3 1.27.3 1.06.3 0.89.9 1.3
10.2 1.75.3 .4
35.0 2.836.8 2.943.8 20.024.3 .5
[TR means trace]
Oxide
SiO2 -----A1->O 3 ----Fe2O3 ----(~"aO
\f r\
TiO2 -----P205 -----MnO -----
Total ---
VSi02
Ap0-24
01 «Q
6 OC
---- 2.24---- 0.21
oo
---- 1 32---- 23---- .067
CO 8
---- 10.4
B21t24-44
79.909.054.230.161.021.66.084.072
96.216.6
B23t65-84
75.287.883.790.21
.791.69.10.071
on o
15.5
Horizon,
B24t84-99
82.447.983.660.21
.641.69
.11
.070
96.6
11.7
depth (cm)
IIB25ir99-122
82.944.992.520.35
.51
.94
.11
.07792.4
9.1
IIB31122-150
81.212.130.50
.12
.57
.13
.041
.01684.73.2
IIB32183-200
100.420.88
.15
.10
.49
.22TR
.010102.3
1.0
IIC200-232
82.018.123.06
O ^f
1.28.98.051C\f\~).uo^
95.813.6
28 Pedologic Studies in the Eastern United States

Table 6D. Analyses of extractable Fe, Al, and Mn, oxalates, ratio clay, and bulk density of soil horizons at site 5, Persimmon Point [TR means trace; means not detected; * means estimated]
Depth(cm)
0 94 - - -
'M M
AA M
65 84 ----84_99 ---.99 122 ---
m l 50 ---150-173 ---17^ 9ftfl
9ftO_9^9
Horizon
--- AnJ\pR01 1
tm*T3T1*
--- B24t--- HB25ir
jrtjai
TTTJIT
TTT311
... nc
Fe
0.71.51.51.31.4
.4
.2
.2
.1
Dithionite-citrate
Extractable Al
(weight percent)
0.233
.3
.3
.4
.2
.1
.1
.1
Mn
T*D
T*D
TT3
T*l?
T*l?
TT3
TT3
TT3
T*l?
Oxalates(weight percent)
0.07.21.17
.34
.50
.01
CEC
0.57.29o/;
.27
.27
.50
.63
.50
Ratio clay
15 bar
0.50.393740
4300
.69
1.25
Bulk density1/3 bar
1.691.691.511.50*1.511 87
1.80*1.80*1.80*1.80*
Table 6f. Analyses of extractable bases, extractable Al, cation exchange capacity (CEC), Al saturation, and pH for soil horizonsat site 5, Persimmon Point[ means not detected; TR means trace]
Depth(cm)
0-24 -24-44 -44-65 -65-84 -84-99 -99-122
122-150150-173173-200200-232
NH 4 OACpH
extractable bases
Horizon
--Ap--B21t- - B22t--B23t--B24t- - IIB25ir--IIB31--IIB32-- IIB33--IIC
Ca
0.60.81.11.61.5
.3
.4
.2
.2
.1
Mg
0.20.40.50.50.4TRTRTRTR
Na K
0.3.4.4.4.4
TR TR
Acidity
7.75.46.84.85.36.73.32.32.20.8
ExtractableAl
1.32.41.90.81.0
Sum cats
8.810.08.87.37.67.03.72.52.40.9
CEC
NH 4 OAC
4.76.25.74.74.01.21.00.2
.2
bases +AI
2.44.03.93.33.3
Alsaturation
5460492430
CaCI 2(.01 M)
1:2
4.24.14.24.54.55.25.45.45.35.4
H 2O
1:1
4.54.64.74.95.05.65.85.85.85.8
Table 7/4. Description of physical characteristics of soil horizons at site 6, Morris Bridge[The Norris Bridge study site (fig. 1) is located near the mouth of the Rappahannock River immediately to the east of Route 3 on the north side of the river in Lancaster County, Va. (37°38' N. lat, 76°24' W. long ,12m MSL elevation, Irvington 7 1/2 min. topographic quadrangle). The soil at the Norris Bridge locality is developed in massive quartz sand that constitutes the upper 4 m of sediment in a 12-m-thick transgressive marine unit of fossiliferous clay and cross-bedded and massive quartz sand. The age and location of this undesignated unit suggest that the surface has been influenced by aeolian processes. This is corroborated by the fact that the Omar Formation, the unit to which the Norris Bridge sediments are correlated, is dotted by Carolina Bays]
Depth (cm)
0-25 -----25 34 -----34 48 -----48 70 -----70 96 -----96-138 ----
138-170 ----170-200 ----200-230 ----
Horizon
ApA9in 1 1
B23tB31B32ClIIC2
Moist color 1
10YR4/310YR4/67.5YR5/65YR5/65YR5/67.5YR5/67.5YR5/610YR5/810YR5/8
Texture2
IssisisclIsssss
Structure3 Clay skins
Ifgr
1m and csbk few, thin, patchyIcsbk few bridgesSGSGSGSG
Roots4
ffmffffffff
Boundary5
as
csgsgsgs
'Color: Munsell notation2Texture: l=loam, sl=sandy loam, ls=loamy sand, scl=sand clay loam, s=sand, g=gravelStructure: l=weak, 2=moderate, m=medium, f=fine, c=coarse, gr=granular, sbk=subangular blocky, p=platy, SG=single grain4Roots: ff=few fine, mf=many fine, ffm=few fine and medium5Boundary: cs=clear smooth, as=abrupt smooth, cw=clear wavy, gs=gradual smooth
Age Relations between Soils and Geology 29

Table IB. Textural analyses of soil horizons at site 6, Morris Bridge[Sampled as: fine-loamy, mixed, thermic Typic Hapludult; <, less than; F, fine; C, coarse; VF, very fine; VC, very coarse; M, medium; TR, trace; , not detected; grain sizes in millimeters]
Depth (cm)
0-25 -25-34 -34-48 -48-70 -70-96 -96-138
138-170170-200200-230
Ap ---A2---B21t---B22t---B23t---B31---B32---Cl---IIC2
Clay <.002
6.9 8.9
15.317.810.57.25.64.32.7
Total
Silt .002-.05
12.3 18.819.817.55.22.90.3TRTR
Sand .05-2
80.872.364.964.784.389.994.195.797.3
Clay
F <.0002
1.62.05.76.16.43.62.0
Sil
F .002-.02
8.1 13.714.912.12.42.0 TRTR
t
C .02-.05
4.2 5.13.95.42.80.9
.3TRTR
VF .05-.10
10.4 6.61.65.57.48.51.89.05.1
Sa
F .10-.25
40.132.734.930.440.744.555.248.514.1
nd
M .25-.50
24.9 26.724.223.929.630.828.428.514.9
C.5-1
4.3 5.43.94.35.55.06.07.3
23.8
VC 1-2
1.1 0.9
.3.6
1.11.12.72.4
39.4
Table 7C. Weight percent of oxides in soil horizons at site 6, Morris Bridge
Oxide
SiO^ ----------------Al-,0, ---------------Fe2O3 ---------------Pa<~l
K nTiO - - -P oMriO ----------------
Total --------------
Fe2O3 +Al2O3/SiO2 ----
Ap 0-25
---- 93.01---- 2.60---- 1 52---- 0.13---- .24
"78
---- .057---- .15
no <
---- 4.4
A2 25-34
91.52 3.71 2.23 0.12
.24
.77
.048
.14
98.8
6.5
B21t 34-48
87.34 5.71 2.51 0.10
.23
.76
.065
.14
96.9
9.4
B22t 48-70
87.61 5.51 3.49 0.13
.26 .55 .06 .16
97.8 10.3
Horizon,
B23t 70-96
92.02 3.42 2.52 0.14
.49
.51
.127
.3399.6
6.5
depth (cm)
B31 96-138
95.012.43 2.10 0.15
.43
.57
.083
.29101.06
4.8
B32 138-170
93.98 1.95 2.93 0.10
.24
.55
.042
.17100.0
5.2
C1170-200
100.00 0.86 1.01 .09 .19 .66 .029 .14
103.0 1.9
IIC2 200-230
97.53 1.98 1.02 0.08
.19
.50
.024
.13101.5
3.1
Table 7D. Analyses of extractable Fe, Al, and Mn, oxalates, ratio clay, and bulk density of soil horizons at site 6, Morris Bridge [TR means trace; * means estimated; means not detected]
Depth(cm)
0-2525-34 34-4848 7070-96 96-138
138-17017ft 9OO
900 9 3ft
Horizon
........ A2rni *
........ B23t ....... B31 ....... B32 - Cl
.
Fe
0.4.6
1.01.3.8 .6 .5 .4.4
Dithionite-citrate
Extractable Al
(weight percent)
0.1.1.2.2.1 .1 .1 .1.1
Mn Oxalates(weight percent)
TT?
TR 0.03TR (V\
T*D no
.08
CEC
O i£.
.27 ^fi
.29
.25
.25
.23o/;
33
Ratio clay
15 bar
0 33.3132
.35
.33
.32
.32
.303 T<£
Bulk density1/3 bar
1.711.82 1.71
I fil
1.63 1.58 1.70* 1.70*1.70*
30 Pedologic Studies in the Eastern United States

Table 7f. Analyses of extractable bases, extractable Al, cation exchange capacity (CEC), Al saturation, and pH for soil horizonsat site 6, Morris Bridge[TR means trace; means not detected]
Depth(cm)
0-25 -25-34 -34-48 -48-70 -70-96 -96-138
138-170170-200200-230
NH 4 OAC extractable bases
Horizon
-Ap-- A2-- B21t-- B22t-- B23t-- B31-- B32-- Cl-- IIC2
Ca
1.00.5
.81.61.11.0.8.8.7
Mg
0.2.2.4.6.4.3.2.2.1
Na
TR
TRTRTR
K
0.4.2.2.3
Fxtrartahlp
Acidity
2.93.14.45.82.81.91.61.21.1
Al
0.2.6.7.6_22
TR
Sum cats
4.54.05.88.24.33.22.62.21.9
CEC
NH 4 OAC
2.52.43.95.12.61.81.31.10.9
bases +AI
1.81.52.13.11.71.4
Alsaturation
11403319127
PH
CaCI 2(.01 M)
1:2
4.64.34.34.44.64.85.05.45.3
H 2 O
1:1
5.14.94.95.05.15.35.55.95.9
Table 8/4. Description of physical characteristics of soil horizons at site 7, 23 m terrace[The 23 m terrace locality is on the north side of the Rappahannock River, several hundred meters east of the junction of Routes 601 and 3, Stafford County, Va. (38°16' N. lat, 77°24' W. long, 21 m MSL elevation, Fredericksburg 7 1/2 min. topographic quadrangle) (fig. 1). Although parent material was not reached, mineralogic evidence from the horizons sampled and the mineralogy and sedimentary structures from nearby outcrops indicate a fluvial origin. The alluvium is predominantly a quartz sand containing minor amounts of feldspar and rock fragments ]
Depth(cm)
0-23 --23-30 --30-44 --44-67 --67-94 --94-124 -
124-148 -148-162 -
Horizon
-- Ap-- Bl
-- B21t-- B22t-- B23t-- B24t-- B25t-- B26t
Moist color1
10YR4/310YR4/37.5YR4/410YR5/65YR4/65YR5/65YR5/65YR5/6
Texture2
silsilsilsiclsiclsiclsiclsicl
Structure3 Clay skins
If and mgrImsbkIcpr-lf and msbkIcpr-lf and msbklcpr-2msbkIcpr-lf and msbk1m and cpr-lf and msbk few, thin, discontinuous1m and cpr-lf and msbk few, thin, discontinuous
Roots4
mfcfcfcfffffff
Boundary5
ascscscscsgsgs
'Color: Munsell notation2Texture: l=loam, si=sandy loam, sil = silty loam, sicl=silty clay loam. Is=loamy sand, s=sand, g=gravelStructure: l=weak, 2=moderate, f=fine, c=coarse, g=granular, sbk=subangular blocky, p=platy, pr=prismatic, SG=single grain4Roots: ff-few fine, mf=many fine, cf= common fine5Boundary: cs=clear smooth, as=abrupt smooth, cw=clear wavy, gs=gradual smooth
Table 8B. Textural analyses of soil horizons at site 7, 23 m terrace[Sampled as: fine-loamy, mixed, thermic Typic Hapludult; <, less than; F, fine; C, course; VF, very fine; VC, very coarse; M, medium; TR, trace;grain sizes in millimeters]
Depth(cm)
0-23 23-30 30-44 44-67 67-94
94-124 124-148 148-162
Horizon
ApBlB21tB22tB23tB24tB25tB26t
Clay < .002
16.018.826.634.535.334.834.532.4
Total
Silt .002-.05
46.246.744.235.828.126.926.224.4
Sand .05-2
37.834.529.229.736.638.339.343.2
Clay
F < .0002
5.36.6
11.015.217.318.017.315.6
Silt
F .002-.02
30.430.430.223.016.415.215.613.1
C.02-.05
15.816.414.012.811.711.710.611.3
VF .05-.10
21.519.616.416.921.523.323.725.8
Sand
F .10-25
9.88.98.18.09.7
10.011.212.7
M .25-.50
5.34.84.03.94.14.03.94.4
C .5-1
1.01.00.6
.8
.7
.6
.4
.3
VC 1-2
0.2.2.1.1.6.4.1
TR
Age Relations between Soils and Geology 31
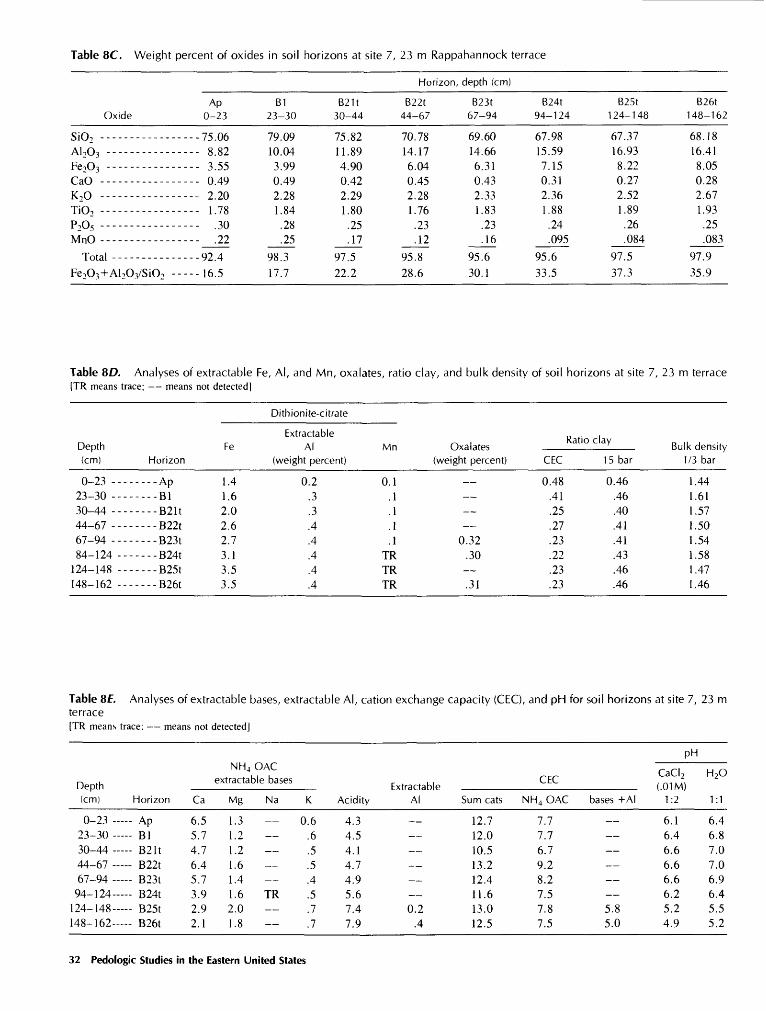
Table 8C. Weight percent of oxides in soil horizons at site 7, 23 m Rappahannock terrace
Horizon, depth (cm)
Oxide
SiO, --------------Al^Os -------------Fe,O3 -------------PaD
K f~\
TiO, --------------P r\
MnO --------------Total ------------
Fe->O,+Al->O3/SiO-, --
Ap 0-23
---75.06
8 89
--- 3.55--- 0.49--- 2.20
1 78
--- .30--- .22
---92.4---16.5
B1 23-30
79.09 10.04 3.99 0.492.28 1.84 .28 .25
98.3 17.7
B21t 30-44
75.82 11.89 4.90 0.42 2.29 1.80 .25 .17
97.522.2
B22t 44-67
70.78 14.17 6.04 0.45 2.28 1.76 .23 .12
95.8
28.6
B23t 67-94
69.60 14.66 6.31 0.43 2.33 1.83 .23 .16
95.6
30.1
B24t 94-124
67.98 15.59 7.15 0.31 2.36 1.88 .24 .095
95.633.5
B25t 124-148
67.37 16.93 8.22 0.27 2.52 1.89 .26 .084
97.5 37.3
B26t 148-162
68.18 16.41 8.05 0.28 2.67 1.93 .25 .083
97.9
35.9
Table 8D. Analyses of extractable Fe, Al, and Mn, oxalates, ratio clay, and bulk density of soil horizons at site 7, 23 m terrace [TR means trace; means not detected]
Depth(cm)
0 23 ---23 30 ---30 44 ---44 67 ---67 94 ---84 124 --
124 148 --148 162 --
Horizon
An-----Ap
R91 1
r>')')»
RTlt
--..-B24tD'Xt
DIAt
Fe
1.4
1.6
2.0
2.6
2.7 3.1 3.5 3.5
Dithionite-citrate
Extractable Al
(weight percent)
0.2
.3
.3
.4
.4
.4
.4
.4
Mn
0.1
.1
.1
.1
.1
TR
TR
TR
Oxalates (weight percent)
0.32
.30
.31
CEC
0.48
.41
.25
.27
.23
.22
.23
.23
Ratio clay .. 7 Rnlk15 bar M
0.46
.46
.40
.41
.41
.43
.46
.46
density 3 bar
.44
.61
.57
.50
.54
.58
.47
.46
Table 8f. Analyses of extractable bases, extractable Al, cation exchange capacity (CEC), and pH for soil horizons at site 7, 23 mterrace[TR means trace; means not detected]
Depth(cm)
0-23 -----
23-3030-4444-67 - 67-94 -94-124-
124-148-- 148-162
NH 4 OAC extractable bases
Horizon
ApBlB21tB22tB23tB24tB25tB26t
Ca
6.55.74.76.45.73.92.92.1
Mg
1.31.21.21.61.41.62.01.8
Na K
0.6.6.5.5.4
TR .5.7.7
PH
Acidity Al
4.34.54.14.74.95.67.4 0.27.9 .4
Sum cats
12.712.010.513.212.411.613.012.5
CEC
NH 4 OAC bases +AI
7.77.76.79.28.27.57.8 5.87.5 5.0
CaCI 2 (.01 M)
1:2
6.16.46.66.66.66.25.24.9
H 2O
1:1
6.46.87.07.06.96.45.55.2
32 Pedologic Studies in the Eastern United States

Table 9/4. Description of physical characteristics of soil horizons at site 8, 45 m terrace[The 45 m terrace soil locality (fig. 1) is on the north side of the river, 0.4 km west of Welcome, Va., in King George County (38°11' N. lat, 77°9' W. long , 45 m MSL elevation. Port Royal 7 1/2 min. topographic quadrangle). Like the 23 m terrace, the sediments are fluvial in origin and consist of quartz sands containing minor amounts of feldspar and rock fragments]
Depth (cm) Horizon
0-12 ---- 12-28 ----28-43 ----43-60 ----60-84 ----84-112 ---
112-146 ---146-175 ---175-213 ---213-250 ---
ApA2B21tB22tB23tB24tB25tB26tB27tB28t
Moist color 1 Texture2
10YR4/2 1 10YR4/3 110YR4/3 15YR4/62.2.2.2.2.2.
5YR4/65YR4/65YR4/65YR4/65YR4/65YR4/6
clccccclcl
Structure3
Ifgr Imsbk-lfgrIvf and msbkIcpr-lmsbklcpr-2f and msbkIcpr-lfsbkIcpr-lfsbkIcpr-lfsbkIcpr-lfsbkIcpr-lfsbk
Clay skins
few,few,few.few,
thin,thin.thin,thin,
discontinuousdiscontinuousdiscontinuousdiscontinuous
Roots4
mfm mfmmfmcfmcfmcfmffffffff
Boundary 5
cs ascscscsgsgsgsgsgs
'Color: Munsell notation2Texture: l=loam, sl=sandy loam, ls=loamy sand, cl=clay loam, c=clay. s=sand, g=gravelStructure: l=weak, 2=moderate, f=fine, vf=very fine, c=coarse, m=medium, gr=granular, sbk=subangular blocky, pl=platy, pr=prismatic,SG=single grain4Roots: ff=few fine, mf=many fine, mfm=many fine and medium, cfm=common fine and medium5Boundary: cs=clear smooth, as=abrupt smooth, cw=clear wavy, gs=gradual smooth
Table 96. Textural analyses of soil horizons at site 8, 45 m terrace[Sampled as: fine-loamy, over clayey, mixed, thermic Typic Paleudult; <, less than; F, fine; C, coarse; VF, very fine; VC, very coarse; M, medium;grain sizes in millimeters]
Depth(cm)
0-12 --12-28 --28-43 --43-60 --60-84 --84-112 -
112-146 -146-175 -175-213 -213-250 -
Table 9C.[Sampled as
Horizon
-- Ap-- A2
-- B21t-- B22t-- B23t-- B24t-- B25t-- B26t-- B27t-- B28t
Weight
Clay<.002
19.823.229.433.637.444.042.347.846.443.5
Total
Silt Sand.002-.05 .05-2
44.749.047.542.034.526.125.020.720.316.9
percent of oxides in: fine-loamy, mixed, thermic Typic
35.530.823.124.428.129.932.731.533.339.6
Clay
F<.0002
6.57.0
11.917.621.826.726.333.031.629.1
soil horizons at sitePaleudult]
Silt
F.002-.02
33.537.036.032.026.718.918.515.214.011.1
C.02-.05
11.212.011.510.07.87.26.55.56.35.8
VF.05-.10
7.36.55.25.26.16.76.67.67.06.9
Sand
F.10-25
7.25.74.44.35.05.65.85.96.16.5
M.25-.50
9.88.46.46.26.28.07.98.78.6
10.5
C VC.5-1 1-2
8.4 2.87.9 2.35.7 1.46.0 2.77.3 3.57.4 2.28.2 4.26.6 2.77.5 4.1
10.5 5.2
8, 45 m terrace
Horizon, depth (cm)
Oxide
SiO, ----A1,O3 ---p OCaQ 3
K f^\
TiO2 ----
P /~»
MnO ----
Total
Fe2O3 +Al2O3/SiO2 -
Ap0-12
- 77.27
- 7.42- 3.33- 0.74- 1.15- 1.33
- .26- .20
-91.7- 13.9
B112-28
89 ^7
8.123.420.301 25
1.39.20.24
97 5
14.0
B21t28-43
75 3211.004.940 <^s
1.431.41.082.15
94.621.2
B22t43-60
if. 10
11.795.320 25
1 0 f
1.36.072.16
96.722.4
B23t60-94
74 5112.625.60O IA
1.131.36.075.19
95 7
24.5
B24t84-112 1
72.4014.426 1 o
0.26.84
1.42.078.10
95 6
28.4
B25t12-146
71.0913.466.050.24
sn
1.39.06.07
93.227.4
B26t146-175
70.9414.376 100 25
.721.39.07.04
94.229.3
B27t175-213
AC *7O
14.516 OO
0.22.64
1.34.12052
OO Q
31.5
B28t213-250_,. ,p
13.816.290.19
1.41.094.042
96.127.3
Age Relations between Soils and Geology 33

Table 9D. Analyses of extractable Fe, Al, and Mn, oxalates, ratio clay, and bulk density of soil horizons at site 8, 45 m terrace [Sampled as: fine-loamy, over clayey, mixed, thermic Typic Paleudult; TR means trace; means not analyzed; * means estimated]
Depth (cm)
n 1 919 98
28 43 -
43 60 -
60 84 -
84 112
112 146
146 175
175 213
213 250
Horizon
AnAPA9
R91 f
R99tR9"U
...... B24tRT^t
D O£*
R97t
R98t
Fe
1.5
1.5
2.3
2.6
2.8
3.2
3.2
3.5
3.3
3.5
Dithionite-citrate
Extractable Al
(weight percent)
0.2
.2
.3
.3
.3
.3
.2
.2
.2
.2
Table 9f. Analyses of extractable bases, cation exchan^
[ means not detected]
Depth (cm)
0 12 --
1 9 98
28 43 --
43 60 --60 84 --
84 112 -
112 146 -
146 175 -
175 213 -
213 250 -
Horizon
...... Ap
A9
R1 1 1
R99t
R9"U
...... B24tR9*\t
------ B26tDT7»
RIOt
NH 4
Ca
16.5
4.7
4.4
4.9
5.5 5.7
5.6
6.1
5.6
4.7
Mn Oxalates (weight percent)
0.1 0.23
.2 j _
.1 j _
.1 .23
TR .26
TR
TR TR .21
*e capacity (CEC), and pH for
OAC extractable bases
Ratio clay
CEC 15 bar
0.76 0.55
.43 .41
.26 .39
.26 .38
.23 .27
.19 .35
.19 .34
.19 .34
.18 .33
.18 .34
soil horizons at site 8,
CEC
Mg K Acidity Sum cats NH4 OAC
2.4 1
1.4 0
1.0
1.0
1.1 1.1
1.0
1.2
1.5
2.0
.4 15.0
.6 6.0 12.7
.5 3.9 9.8
.5 4.6 11.0
.4 5.3 12.3
.2 5.4 12.4
.2 5.1 11.9
.2 5.2 12.7
.2 5.0 12.3
.2 4.9 11.8
8.6
7.6
8.6
8.6
8.5
8.2
8.9
8.4
7.8
45 m
CaCI 2 (.01 M)
1:2
7.2
5.6
5.7
5.7
5.7
5.9
6.1
6.2
6.1
6.4
Bulk density 1/3 bar
1.18 1.67 1.55 1.52 1.49 1.53 1.50*
1.48 1.50*
1.53
terrace
pH
H 2O
1:1
7.5
6.1
5.1
6.1
6.1
6.3
6.5
6.4
6.5
6.5
34 Pedologic Studies in the Eastern United States


LO
AS
i AL H
LA
ir', Mb A
Pb
VA
U.S
. Geolo
gica
l Su
rvey b
ulle
tin