U.S. Fish & Wildlife Service · 9 | P a g e Basemaps There are several options for basemaps,...
19
1 | Page Wetlands Mapper Documentation and Instructions Manual U.S. Fish and Wildlife Service Ecological Services National Standards and Support Team Madison, WI 53711-1061 April 2019 U.S. Fish & Wildlife Service
Transcript of U.S. Fish & Wildlife Service · 9 | P a g e Basemaps There are several options for basemaps,...

1 | P a g e
Wetlands Mapper
Documentation and Instructions
Manual
U.S. Fish and Wildlife Service
Ecological Services
National Standards and Support Team
Madison, WI 53711-1061
April 2019
U.S. Fish & Wildlife Service

2 | P a g e
Contents
Introduction ............................................................................................................................................ 3
A Note to Users ................................................................................................................................... 3
About the Wetlands Mapper ............................................................................................................... 3
About Our Wetlands Data .................................................................................................................... 4
Wetlands Mapper Display Categories .................................................................................................. 6
Technical Information and Tips ................................................................................................................ 7
The Wetlands Mapper Interface .......................................................................................................... 7
Zoom Control ................................................................................................................................... 7
Panning ........................................................................................................................................... 8
Extent Buttons ................................................................................................................................. 8
Find Location ................................................................................................................................... 8
Basemaps ........................................................................................................................................ 9
Map Layers .................................................................................................................................... 10
Layer Descriptions: ........................................................................................................................ 10
Legends ......................................................................................................................................... 11
Displaying Feature Information ...................................................................................................... 12
Measurements .............................................................................................................................. 15
Print Maps ..................................................................................................................................... 16
Download Data .............................................................................................................................. 17
Data Limitations and Uses ..................................................................................................................... 18
Exclusions ...................................................................................................................................... 18
Wetland Data Updates .......................................................................................................................... 19
Contact Information .............................................................................................................................. 19

3 | P a g e
Introduction The U.S. Fish and Wildlife Service (hereafter Service) is the principal Federal agency that provides the
citizens of the United States and its Trust Territories with current geospatially referenced information on
the status, extent, characteristics and functions of wetlands, riparian, deepwater and related aquatic
habitats. The Service provides stewardship for the wetlands data that comprise the Wetlands Layer of
The National Spatial Data Infrastructure and makes these data available to the public via the Wetlands
Mapper. This information is intended to promote the understanding and conservation of wetland
resources through discovery and education as well as to aid in resource management, research and
decision making.
The wetlands mapper fulfills the Service’s strategic plan for the development, revision and
dissemination of wetlands data and information to resource managers and the public. By integrating
digital wetlands data with other resource information, the wetlands mapper is designed to deliver easy-
to-use, map-like views of America’s wetland resources.
A Note to Users The wetlands displayed on the Wetlands Mapper show wetland type and extent using a biological
definition of a wetland. Federal, state, and local regulatory agencies with jurisdiction over wetlands may
define and describe wetlands in a different manner than that used in this inventory. There is no
attempt, in either the design or products of this inventory, to define the limits of proprietary
jurisdiction of any Federal, state, or local government or to establish the geographical scope of the
regulatory programs of government agencies.
For information about regulations that may affect wetlands or development on your property, contact
the U.S. Army Corps of Engineers office nearest you: http://www.usace.army.mil/Locations.aspx
About the Wetlands Mapper The Wetlands Mapper is a direct response to the need to integrate digital map data with other resource
information to produce timely and relevant management and decision support tools. The Wetlands
Mapper is designed to promote greater awareness and use of the versatility of wetlands geospatial data
and to deliver easy-to-use, map-like views of America's wetland resources in a digital format. It has been
developed in collaboration with the U.S. Geological Survey (USGS). This Federal partnership has yielded
tremendous benefits in ongoing efforts to configure, improve and distribute the wetlands information
using newer technologies in digital mapping and web-serving capabilities.
The Wetlands Mapper interface was developed using JavaScript, which allows users to access it on their
desktop as well as on mobile devices. The Wetlands Mapper integrates a robust geosearch engine which
allows users to search by place names, addresses and geographic coordinates, and it can leverage the
GPS functionality of your device to zoom to your location.

4 | P a g e
Users of the mapper have seamless access to suite of basemap information including ESRI1 Maps and
imagery, Open Street Map, National Geographic, USGS Topographical maps and the USGS National Map.
These basemaps provide a platform for the wetlands data, which brings location data to life by making it
easier to visualize, understand and analyze. The detailed imagery used in the Wetlands Mapper
application is provided by ESRI and originates from a variety of sources at various scales.
About Our Wetlands Data The Service's topical wetland and riparian data are graphic representations of the type, size and location
of the wetlands, deepwater or riparian habitats in the United States. These data have been prepared
from the analysis of high altitude imagery in conjunction with collateral data sources and field work. A
margin of error is inherent in the use of imagery; thus, detailed on-the-ground inspection of any
particular site, may result in revision of the wetland boundaries or classification established through
image analysis. The Service uses the Cowardin et al. 2nd Edition (2013) definition of wetland. This
definition is the standard for the agency and is the National Standard for wetland mapping, monitoring,
and data reporting as determined by the Federal Geographic Data Committee in 2013.
For the purposes of adapting the wetland classification system to map form, a series of letter and
number codes has been developed. These alpha-numeric codes2 are used in the Wetlands Mapper and
correspond to the classification nomenclature that best describes the habitat. The Wetlands Mapper
integrates a wetland code interpreter that translates the wetland code to the Cowardin wetland types
with full descriptions.
1 Environmental Systems Research Institute, Inc. (ESRI): https://livingatlas.arcgis.com/en/browse 2 Wetland Codes information available at: http://www.fws.gov/wetlands/Data/Wetland-Codes.html

5 | P a g e
Examples of how these mapping codes work are shown below:
Forested Wetland, Deciduous NWI Map Classification Code: PFO1C Palustrine (P) Forested (FO) Broad leaved deciduous (1) Seasonally flooded (C) Other Names/Identifiers: Hardwood Swamp
Lacustrine Aquatic Bed NWI Map Classification Code: L2ABG Lacustrine (L) 2 Aquatic Bed (AB) Intermittently exposed (G) Other Names/Identifiers: Lake Edge, Aquatic Bed

6 | P a g e
Wetlands Mapper Display Categories For ease of viewing the wetlands data, wetland types are displayed in groups of similar classifications
(e.g. all freshwater emergent wetlands are displayed as a single color category). The display categories
are shown in Table 1 below.
The Service provides extensive documentation of the Cowardin Classification System. The Wetlands and
Deepwater Habitats Classification chart is a map code legend that shows the relationship of wetland
systems (e.g. estuarine), subsystems (e.g. intertidal), and classes (e.g. emergent wetland).
Wetland habitat type definitions, descriptions and use of the classification system can be found in
Classification of Wetlands and Deepwater Habitats of the United States (Cowardin, et al. 2013)
Display Color
Wetland Type Map Code
Cowardin General Description
R 0 G 136 B 55
Freshwater- Forested and Shrub wetland
PFO, PSS
Palustrine forested and/or Palustrine shrub
Forested swamp or wetland shrub bog or wetland
R 127 G 195 B 28
Freshwater Emergent wetland
PEM Palustrine emergent Herbaceous marsh, fen, swale and wet meadow
R 104 G 140 B 192
Freshwater pond PUB, PAB
Palustrine unconsolidated bottom, Palustrine aquatic bed
Pond
R 102 G 194 B 165
Estuarine and Marine wetland
E2, M2 Estuarine intertidal and Marine intertidal wetland
Vegetated and non-vegetated brackish and saltwater marsh, shrubs, beach, bar, shoal or flat
R 1 G 144 B 191
Riverine R Riverine wetland and deepwater River or stream channel
R 19 G 0 B 124
Lakes L Lacustrine wetland and deepwater Lake or reservoir basin
R 0 G 124 B 136
Estuarine and Marine Deepwater
E1, M1 Estuarine and Marine subtidal deepwater
Open water estuary, bay, sound, open ocean
R 178 G 134 B 83
Other Freshwater wetland Misc. types
Palustrine wetland Farmed wetland, saline seep or other miscellaneous wetland types
Table 1. The Wetlands Mapper uses multiple display categories corresponding to different wetland types.

7 | P a g e
Technical Information and Tips
The Wetlands Mapper Interface Clicking on the Wetlands Mapper link from the National Wetlands Inventory website will launch the Wetlands
Mapper viewer in its default extent mode (lower 48 states; Figure 1). A minimum screen resolution of 1024 x
768 pixels or higher is recommended3 to properly display the map and controls.
Zoom Control
Figure 1. The Wetlands Mapper interface launches with a full extent view of the U.S. The zoom button is located in the upper left hand corner of the map.
Use the zoom buttons in the upper left hand side of the window to zoom in or out (+ to zoom in, - to zoom out).
Other zoom control functions available are:
Double-click to zoom - Double click on left mouse button to zoom in.
Scroll wheel zooming - Use the scroll wheel on your mouse to zoom in and out of the maps.
Keyboard zoom - Press the keyboard plus (+) key to zoom in, and the minus (-) key to zoom out.
Area zooms - While holding the keyboard shift key, mouse left-click and hold to draw a box of the extent
of an area to zoom to.
Center - While holding the keyboard shift key, mouse left-click a location to center the map to it.
3 The Wetlands Mapper will best display with a 1280 x 960 or 1280 x 1024 pixel screen resolution, depending on your display ratio.

8 | P a g e
Panning
Users can pan across the map to view different areas by clicking (left-click and hold) and dragging in the viewer
area to move the map. After panning to an area, a short load time is necessary to render the image. The arrow
keys on your keyboard can also be used to pan around the map.
Extent Buttons
Contiguous U.S. Extent –Use this function to zoom out to the full extent of the lower 48
States (CONUS).
Find my Location – Geolocates and centers map on user. Requires users to enable location
services by selecting “allow”. This feature is designed to work with geo-enabled mobile
devices and may not work correctly in a desktop environment.
Find Location
Use the ‘Find Location’ button (Figure 2) to enter a location to zoom to (Figure 3).
Figure 2. The Find Location button in the wetlands mapper allows users to find and zoom to a specific geographic location.
Some options are:
Address
City, State
State
Zip Code
Coordinates – (Examples in Longitude, Latitude format)
o 81.2W, 31.9N
o -81.2, 31.9
o -81 10 02, 31 55 10.7
Geographic feature (ex. Lake Michigan, Potomac River, Appalachian mountains)
Figure 3. The ‘Find Location’ function allows users to find specific locations by entering an address, city, state, zip codes, coordinates, or geographic features.

9 | P a g e
Basemaps
There are several options for basemaps, including aerial and satellite imagery, street maps that show
transportation routes, topographic maps provided by ESRI and U.S. Geological Survey digital raster graphics of
topographic mapping. Click on the desired basemap type button to switch views. Please allow a few seconds for
the view to refresh.
Figure 4. The Basemaps control panel in the wetlands mapper allows users to select the display of background information.
The following basemap types are currently available on the Wetlands Mapper4:
Streets - displays the road map view with labels.
Satellite - displays satellite and aerial images.
Hybrid - displays a mixture of satellite and aerial images, and roads with labels.
Topo - displays a topographic base map4.
Terrain - displays a shaded relief map
Gray - displays neutral background to highlight thematic features
Open Street Map – displays open source OpenStreetMap
NatGeo – displays general reference map in the style of National Geographic cartography
USGS Topo - displays the detailed USGS topographic base map
Nat’l Map – displays the combined USGS National Map
4 Basemaps developed by ESRI.

10 | P a g e
A list of basemap contributors can be found at: http://livingatlas.arcgis.com/en/browse/
Metadata for the imagery service can be found at:
http://www.arcgis.com/home/item.html?id=10df2279f9684e4a9f6a7f08febac2a9
Map Layers
The Map Layers control panel (Figure 5) allows users to select one or more data layers to be displayed over the
basemap5 by checking the box to the left of a layer. Multiple layers can be displayed concurrently.
Figure 5. The Map Layers control panel allows users to select which data layers are displayed over the basemap.
Other functions in the Map Layers control panel are as follows:
- Opens the Product Summary web page with information about the layer.
- Controls the layer’s opacity.
Layer Descriptions:
Wetlands - This data layer represents the extent, approximate location and type of wetlands and deepwater
habitats in the United States. These data delineate the areal extent of wetlands and surface waters as defined by
Cowardin et al. (2013).
5 Streets, Imagery, Imagery/Labels, or Topo.

11 | P a g e
Riparian - This data layer represents the extent, approximate location and type of riparian habitats in the
western United States. Riparian data are available for some areas in the western states of the contiguous U.S.
where annual evaporation exceeds annual precipitation by 10 or more inches. Riparian habitats are defined by
A System for Mapping Riparian Areas in the United States (USFWS 2009).
Riparian Status - This information provides the extent, status, and location of current riparian mapping projects.
Data Source – This layer displays the types, scales and years of images used to map the wetlands, deepwater
and riparian habitats in a given area.
Areas of Interest - This layer highlights selected wetlands throughout the U.S. that exhibit unique or important
ecological characteristics. It includes Wetlands of International Importance (Ramsar sites) as well as selected
State Natural Areas, National Parks and National Wildlife Refuges. Each site is denoted by a location marker and
includes a link to additional information about that particular wetland. Additional sites and information may be
added in the future.
Legends
Clicking on the legend box (Figure 6) toggles a legend corresponding to the selected map layer(s). Additional
legends will be appended as more layers are selected. Use the scroll bar to move up and down the list of
legends, if necessary.
Figure 6. The legend button in the wetlands mapper toggles a legend corresponding to the selected map layers.

12 | P a g e
Displaying Feature Information
Clicking on a wetlands or riparian polygon or point will display a pop-up box containing information about that
feature (Figure 7). This box also provides links to various metadata documents. Please note that only visible
layers use this function. Clicking on the [X] at the top-right side of the pop-up will close it. Tabs shown in the
dialog box (Figure 7) are arranged as follows:
Figure 7. Clicking on a wetlands or riparian polygon in the mapper will display a dialog box with links to additional information about the data layer and its project area. The general tab shows information about the selected polygon and imagery used for photointerpretation.
General – This tab displays the size of the polygon in acres and the habitat type associated with the
identified polygon. Also shown is information about image source, scale, and year pertaining to that
polygon.
o ‘Zoom to Wetland’ – Zooms to the extent of the selected polygon
o ‘Zoom to Project Area’ – Mapping is conducted in defined geographic areas called projects. For
each project, specific imagery is used as the base information to define the type, extent and
location of each wetland in a process called photointerpretation. This link zooms to the extent of
the project area containing the selected polygon.
A link to specific project metadata, if available, will also be shown in this section. Project metadata is
created by photointerpreters for a specific project area by recording information on the source imagery
(date, emulsion and scale), collateral data, inventory method, data limitations, geographic features,
landforms, wetland types and other specifics. However, not all project areas will have a project
metadata document.
13 | P a g e
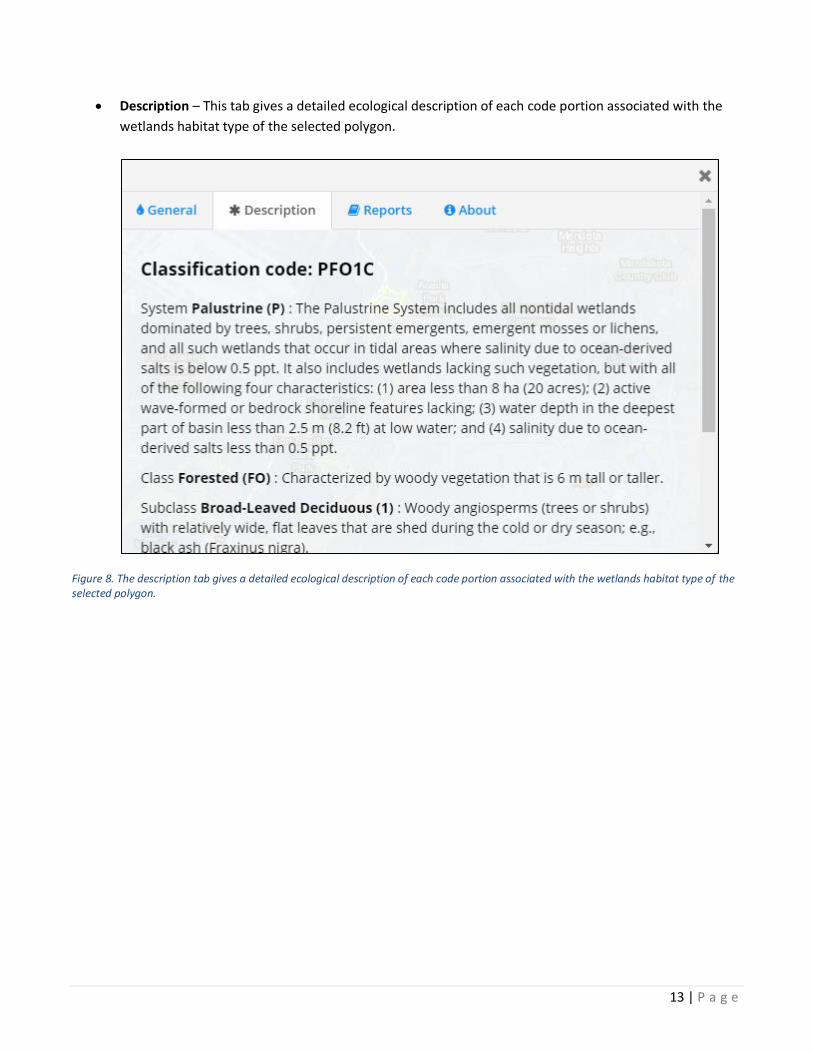
Description – This tab gives a detailed ecological description of each code portion associated with the
wetlands habitat type of the selected polygon.
Figure 8. The description tab gives a detailed ecological description of each code portion associated with the wetlands habitat type of the selected polygon.

14 | P a g e
Reports – This tab shows links to individual reports and documents associated with the geographic area
containing the selected polygon. There may be multiple reports associated with a single polygon, which
are organized according to geographic extent, from local to nationwide. This tab also includes a ‘Historic
Map Information’ section which includes project reports for previous NWI mapping efforts at that
location.
Figure 9. The reports tab shows links to individual reports and documents associated with the geographic area containing the selected polygon.

15 | P a g e
About – This tab includes the data use limitations, as well as links to general information found on the
NWI website.
Figure 10. This about tab includes the data use limitations, as well as links to general information found on the NWI website.
Measurements
There are three measurement tools available when clicking the measure button (Figure 11): Area, Distance, and
Location.
Figure 11. The measure button in the wetlands mapper allows users to measure features in the mapper by area, distance, or location identification.
Area - To measure a polygon, select the tool and start measuring by left clicking on your mouse one or more
times, and finish the measurement by double-clicking. To clear the measurement polygon and disable
measuring, unselect the area button.
Distance - Use the same procedure as above to measure a polyline, double-clicking to finish the measurement.
To clear the measurement line and disable measuring, unselect the area button.

16 | P a g e
Location – Click on a location, this tool shows the latitude and longitude of the selected location in addition to
the moving cursor.
Print Maps
The print button (Figure 12) allows users to print the current map view. Use the Panning and Zoom controls
described above to center map to desired extent. After entering a title, selecting the print button will add the
map to the print jobs queue.
Figure 12. The print button in the wetlands mapper allows users to create .pdfs of maps for printing or saving.
Selecting an individual print job will open an Adobe PDF document with a rendition of the previously displayed
map (Figure 13). The generated map will be up to approximately 4MB. The generated PDF document can be
saved and/or printed.
Example of generated PDF map:
Figure 13. Using the Wetlands Mapper layout template, maps can be exported to Adobe .pdf and then saved and/or printed.

17 | P a g e
Download Data
The Wetlands Mapper provides access to wetlands data with the capability to download geospatial wetland
map data by state and watershed (HUC8) in shapefile and file geodatabase format, as well as the ability to
connect to the wetlands dataset via web services (WMS, KMZ and REST). The ‘Get Data’ button (Figure 14) will
open a new dialog box with options for downloading seamless wetlands data as viewed on the Wetlands
Mapper. Connecting to web services allows users to dynamically interact with the data on their desktop and
web-based applications. Users can also view the shapefiles by using ESRI's ArcGIS Explorer free software6,
among others. Geodatabases require a full ESRI ArcDesktop license.
Figure 14. The 'Get Data' button allows users to download spatial wetlands data by state or watershed.
By Watershed - The ‘Download by Watershed’ option allows users to select individual watersheds in the mapper
for data download. This tool gives you the option of downloading a shapefile or file geodatabase.
By State - Users can also download data by state. Each state dataset is downloadable as either a compressed file
geodatabase or a shapefile.
Web Services – The web services option allows direct connection to the NWI web map service, for either
wetlands data, wetlands status, or riparian data. For detailed information on how to connect to these services
please visit our website at: https://www.fws.gov/wetlands/Data/Web-Map-Services.html
6 http://www.esri.com/software/arcgis/explorer

18 | P a g e
Data Limitations and Uses The Service's objective of mapping wetlands and deepwater habitats is to produce information on the location,
type and size of these resources. The data are prepared from the analysis of high altitude imagery. Wetlands are
identified based on vegetation, visible hydrology and geography. A margin of error is inherent in the use of
imagery; thus, detailed on-the-ground inspection of any particular site may result in revision of the wetland
boundaries or classification established through image analysis.
The accuracy of image interpretation depends on the quality of the imagery, the experience of the image
analysts, the amount and quality of the collateral data and the amount of ground truth verification work
conducted. Metadata should be consulted to determine the date of the source imagery used and any mapping
conventions or issues that may have been identified.
Wetlands or other mapped features may have changed since the date of the imagery and/or field work due to
natural processes or human related activity. Therefore, there may be differences in polygon boundaries or
classifications between the information depicted on the map and the actual conditions on the ground.
Exclusions
Certain wetland habitats are excluded from the National mapping program because of the limitations of aerial
imagery used as the primary data source to detect wetlands. These habitats include seagrasses or submerged
aquatic vegetation that are found in the intertidal and subtidal zones of estuaries and nearshore coastal waters.
Some deepwater reef communities (coral or tuberficid worm reefs) have also been excluded from the inventory.
These habitats, because of their depth, can go undetected by aerial imagery.
By policy, the Service also excludes certain types of "farmed wetlands" as may be defined by the Food Security
Act or that do not coincide with the Cowardin et al. (1979) definition. Contact the Service's Regional Wetland
Coordinator for additional information on what types of farmed wetlands are included on wetland maps.

19 | P a g e
Wetland Data Updates The Wetlands Geodatabase is an ongoing effort consisting of data additions, updates, and other data
modifications. All data layers utilized outside of the Wetlands Geodatabase or the Wetlands Mapper and
supporting web services are only effective as of the date of extraction or delivery by the Wetlands Geodatabase
Administrator. The Wetlands Mapper (http://www.fws.gov/wetlands/Data/Mapper.html) displays the current
status of wetlands data available from the Service. Updates to the data posted on the mapper are typically
completed every 6 months. Please refer to the date posted on the Wetlands Mapper launch page as well as
date stamps on data downloads to ensure you have the most up to date data for your area.
Users are also encouraged to view our Projects Mapper to see where recent wetlands data additions have been
made as well as where there are active wetland mapping projects currently in progress.
Contact Information Please send any questions to the Wetlands Team ([email protected]).
Comments regarding the interpretation or classification of wetlands or deepwater habitats can be directed to
the U.S. Fish and Wildlife Service, Ecological Services or by following the feedback mechanism in the Information
Quality Guidelines7. In addition, “A Request for Entry of Corrected Map Data” (see forms here:
http://www.fws.gov/wetlands/Data/Tools-Forms.html) may also be submitted.
For additional information please visit our website: https://www.fws.gov/wetlands
7 http://www.fws.gov/wetlands/Documents/Wetlands-Master-Geodatabase-Addressing-Information-Quality-Guidelines.pdf