
US EPA's Characterization of Coal Combustion Residues … · EPA/600/R-08/077 July 2008 ....
113
EPA-600/R-08/077 July 2008 Characterization of Coal Combustion Residues from Electric Utilities Using Wet Scrubbers for Multi-Pollutant Control
-
Upload
nguyendien -
Category
Documents
-
view
216 -
download
0
Transcript of US EPA's Characterization of Coal Combustion Residues … · EPA/600/R-08/077 July 2008 ....

EPA-600/R-08/077 July 2008
Characterization ofCoal Combustion Residues from Electric Utilities Using Wet Scrubbers for Multi-Pollutant Control

EPA/600/R-08/077 July 2008
Characterization of Coal Combustion Residues from Electric Utilities Using Wet Scrubbers for
Multi-Pollutant Control
F. Sanchez1, D. Kosson1, R. Keeney2, R. Delapp1, L. Turner3, and P. Kariher2
1Vanderbilt University Department of Civil and Environmental Engineering
Nashville, TN 37235
2ARCADIS 4915 Prospectus Drive, Suite F
Durham, NC 27713
3Turner Technology Nashville, TN 37235
Category III / Applied Research
Contract No. EP-C-04-023 Work Assignment No. 4-26
Project No. RN990234.0026
U.S. Environmental Protection Agency Office of Research and Development
National Risk Management Research Laboratory Air Pollution Prevention and Control Division
Cincinnati, Ohio
Notice
The U.S. Environmental Protection Agency (EPA) through its Office of Research and Development funded the research described here under Work Assignment No. 4-26 of Contract Number EP-C-04-023 to Vanderbilt University. It has been subjected to the Agency’s peer and administrative review and has been cleared for publicationas an EPA document. Reference herein to any specific commercial product, process, or service by trade name, trademark, manufacturer, or otherwise, does not necessarily constitute or imply its endorsement or recommendation. The views and opinions of authors expressed herein do not necessarily state or reflect those of EPA or any agency thereof.
ii
Foreword
The U.S. Environmental Protection Agency (EPA) is charged by Congress with protecting the Nation's land, air, and water resources. Under a mandate of national environmental laws, the Agency strives to formulate and implement actions leading to a compatible balance between human activities and the ability of natural systems to support and nurture life. To meet this mandate, EPA's research program is providing data and technical support for solving environmental problems today and building a science knowledge base necessary to manage our ecological resources wisely, understand how pollutants affect our health, and prevent or reduce environmental risks in the future.
The National Risk Management Research Laboratory (NRMRL) is the Agency's center for investigation of technological and management approaches for preventing and reducing risks from pollution that threaten human health and the environment. The focus of the Laboratory's research program is on methods and their cost-effectiveness for prevention and control of pollution to air, land, water, and subsurface resources; protection of water quality in public water systems; remediation of contaminated sites, sediments and ground water; prevention and control of indoor air pollution; and restoration of ecosystems. NRMRL collaborates with both public and private sector partners to foster technologies that reduce the cost of compliance and to anticipate emerging problems. NRMRL's research provides solutions to environmental problems by: developing and promoting technologies that protect and improve the environment; advancing scientific and engineering information to support regulatory and policy decisions; and providing the technical support and information transfer to ensure implementation of environmental regulations and strategies at the national, state, and community levels.
This publication has been produced as part of the Laboratory's strategic long-term research plan. It is published and made available by EPA's Office of Research and Development to assist the user community and to link researchers with their clients.
Sally Gutierrez, Director National Risk Management Research Laboratory
iii

Characterization of Coal Combustion Residues II
ACKNOWLEDGMENTS
Extensive input on the research program design was provided by G. Helms, U.S. EPA, Office of Solid Waste (Washington, D.C.).
Laboratory testing described herein was carried out by ARCADIS with technical support from Vanderbilt University. R. Delapp was responsible for the chemical analyses carried out at Vanderbilt University. Technical assistance also was provided by A. Garrabrants.
K. Ladwig and the Electric Power Research Institute (EPRI) are gratefully acknowledged for assistance in obtaining coal combustion residue samples and providing information from the EPRI database on coal combustion residues.
S. Thorneloe is the U.S. EPA project officer for this research.
Note: R. Keeney substantially participated in the work reported here and the preparation of this report but left employment of ARCADIS prior to the completion of this study and report.
iv

Characterization of Coal Combustion Residues II
TABLE OF CONTENTS
Acknowledgments.......................................................................................................................... iv
Abstract ........................................................................................................................................... v
Glossary of terms ........................................................................................................................... vi
Executive Summary ....................................................................................................................... ix
Table of Contents.......................................................................................................................... xii
List of Tables ................................................................................................................................ xv
List of Figures .............................................................................................................................. xvi
1. Introduction................................................................................................................................. 1
1.1. Regulatory Context ...............................................................................................................6
1.1.1. Waste Management....................................................................................................... 6
1.1.2. Air Pollution Control .................................................................................................... 6
1.2. Configurations of U.S. Coal Fired Power Plants and Multi-pollutant Control Technologies ................................................................................................................................7
1.2.1. Current Air Pollution Control Technologies................................................................. 8
1.2.2. Wet Scrubbers, NOx Controls and Multi-pollutant Controls ..................................... 11
1.3. Coal Combustion Residues .................................................................................................12
1.4. Residue Management Practices ..........................................................................................13
1.4.1. Beneficial Use............................................................................................................. 13
1.4.2. Land Disposal ............................................................................................................. 14
1.5. Leaching Protocol ...............................................................................................................16
2. Materials and Methods.............................................................................................................. 20
2.1. CCR Materials for Evaluation ............................................................................................20
2.1.1. Facilities Using Inhibited or Natural Oxidation of Scrubber Residues (Producing Scrubber Sludge or Fixated Scrubber Sludge)...................................................................... 24
2.1.1.1. Facility A (Natural Oxidation and SNCR)........................................................... 24
2.1.1.2. Facility B (Natural Oxidation and SCR).............................................................. 24
2.1.1.3. Facility K (Natural Oxidation and SCR) ............................................................. 25
2.1.1.4. Facility M (Inhibited Oxidation and SCR) .......................................................... 25
2.1.2. Facilities Using Forced Oxidation of Scrubber Residues (Producing FGD Gypsum) 26
2.1.2.1. Facility N (Forced Oxidation).............................................................................. 26
2.1.2.2. Facility O (Forced Oxidation and SCR) .............................................................. 26
2.1.2.3. Facility P (Forced Oxidation and SCR and SNCR)............................................. 26
2.1.2.4. Facility Q (Forced Oxidation and SCR) .............................................................. 27 v

Characterization of Coal Cumbustion Residues II
2.2. Leaching Assessment Protocols..........................................................................................27
2.2.1. Alkalinity, Solubility and Release as a Function of pH (SR002.1) ............................ 27
2.2.2. Solubility and Release as a Function of LS Ratio (SR003.1) ..................................... 28
2.3. Analytical Methods.............................................................................................................28
2.3.1. Surface Area and Pore Size Distribution .................................................................... 28
2.3.2. pH and Conductivity ................................................................................................... 28
2.3.3. Moisture Content ........................................................................................................ 28
2.3.4. Carbon Content Organic Carbon/Elemental Carbon Analyzer................................... 28
2.3.5. Dissolved Inorganic Carbon (DIC) and Dissolved Organic Carbon (DOC) .............. 29
2.3.6. Mercury (CVAA, Method 3052, and Method 7473) .................................................. 29
2.3.7. Other Metals (ICP-MS, Method 3052, and Method 6020)......................................... 30
2.3.7.1. ICP-MS Analysis ................................................................................................. 30
2.3.8. X-Ray Fluorescence (XRF) ........................................................................................ 32
2.3.9. MDL and ML for Analytical Results......................................................................... 32
2.4. Quality Assurance ASSESSMENT ....................................................................................33
2.4.1. Homogenization of Individual CCR Samples and Aliquots for Analyses.................. 33
2.4.2. Leaching Test Methods and Analytical QA/QC......................................................... 33
2.4.3. Improving QA/QC efficiency ..................................................................................... 34
2.5. Interpretation and Presentation of Laboratory Leaching Data............................................35
2.5.1. Interpretation of Mechanisms Controlling Constituent Leaching .............................. 36
2.6. Field pH probability distribution ........................................................................................38
2.7. Estimated leachate concentration as a function of pH ........................................................41
3. Results and Discussion ............................................................................................................. 43
3.1. Total elemental content by digestion ..................................................................................43
3.2. total elemental content by xrf .............................................................................................51
3.3. Laboratory Leaching Test Results ......................................................................................57
3.3.1. Typical Characteristic Leaching Behavior as a Function of pH and LS..................... 58
3.3.2. Comparisons of the Ranges of Constituent Concentrations from Laboratory Testing with Measurements of Field Samples and the EPA Risk Report Database.......................... 77
4. Summary of Results, Conclusions and Recommendations....................................................... 87
5. References................................................................................................................................. 94
Appendices.................................................................................................................................... 97
A. Quality Assurance Project Plan ..................................................................................... A-1
B. Total Elemental Content by Digestion.............................................................................B-1 vi

Characterization of Coal Combustion Residues II
C. Elemental Total Content (by XRF), Carbon, Loss on Ignition and Specific Surface Area ......................................................................................................C-1
D. pH Titration and Constituent Leaching as a Function of pH (SR002 test results) ......... D-1 E. pH and Constituent Leaching as a Function of LS (SR003 test results)..........................E-1 F. Curve Fits.........................................................................................................................F-1 G. Additional Facility Information ..................................................................................... G-1
vii

Characterization of Coal Cumbustion Residues II
LIST OF TABLES
Table 1. Summary of facility configurations and sample identification contained in this report. Facilities are identified by code letter only (e.g., “Facility A”) to preserve the confidentiality of the CCR source. All fly ash samples are ASTM Class F. .................................................... 5
(EPA, 2005). CCR samples evaluated in this report are from configurations indicated by shaded (light gray) rows. Current capacity reflects date of data collection for EPA report
Table 4. Beneficial uses of CCRs (ACAA, 2007). Total production of CCRs during 2006 was
Table 6. Method detection limits (MDLs) and minimum level of quantification (ML) for ICP-
Table 7. Comparison of summary statistics for field pH data and pH probability distributions
Table 2. General Characteristics of Coals Burned in U. S. Power Plants (EPA, 2005). ............... 7
Table 3. Projected Coal-Fired Capacity by APC Configuration as per data collection in 1999
(EPA, 2005). ........................................................................................................................... 10
124,795,124 short tons............................................................................................................ 15
Table 5. MDL and ML of analysis of DIC and DOC. ................................................................. 29
MS analysis on liquid samples................................................................................................ 31
used in Report 1 and this report. ............................................................................................. 41
Table 8. Fly Ash. Summary of results. ....................................................................................... 90
Table 9. FGD Gypsum. Summary of results............................................................................... 91
Table 10. Scrubber Sludge. Summary of results......................................................................... 92
Table 11. Fixated Scrubber Sludge. Summary of results............................................................ 93
viii

Characterization of Coal Combustion Residues II
LIST OF FIGURES
Figure 1. Flow diagram describing processing and nomenclature of FGD scrubber residues and samples included in this study. ................................................................................................. 2
Figure 5. Fly ash (FA) comparisons (CFA, AFA, DFA, etc refer to sample identification codes;
Figure 6. Gypsum (Gyp-U, Gyp-W) comparisons (NAU, NAW, OAU, etc. are sample
Figure 7. Scrubber sludge (ScS) comparisons (CGD, AGD, DGD, etc. are sample identification
Figure 8. Fixated scrubber sludge (FSS) and fixated scrubber sludge with lime (FSSL)
Figure 9. Coefficient of variation (C.V.) from XRF elemental analysis of 10 subsamples of
Figure 2. Multi-pollutant control systems in coal fired power plants.......................................... 12
Figure 3. Life-cycle evaluation of coal combustion residues (EPA, 2002). ................................ 13
Figure 4. Uses of CCRs based on 2006 Industry Statistics (ACAA, 2007)................................. 16
see Table 1). Shorthand is used for when SCR is in use (“on”) or not in use (“off”)............ 20
identification codes; see Table 1). .......................................................................................... 21
codes; see Table 1). Shorthand is used for when SCR is in use (“on”) or not in (“off”)....... 22
comparisons (DCC, BCC, KCC, etc. are sample identification codes; see Table 1).............. 23
FSSL sample MAD after mixing by coning and quartering. .................................................. 33
Figure 10. An example of extract concentrations as a function of pH from SR002.1................. 38
Figure 11. Probability distributions for field pH used in Report 1 (LogLogistic) and this report (BetaGeneral). Summary statistics for the field data and the probability distribution used in this report (BetaGeneral) are provided to the right of the graph............................................. 40
Figure 12. Example of regression fit and corresponding coefficients for a 5th order polynomial equation used to represent solubility and release as a function of pH (antimony for fly ash from Facility B with SCR bypassed (DFA)). ......................................................................... 42
Figure 13 and Figure 14. Mercury and Aluminum. Comparison of total elemental content by digestion.................................................................................................................................. 45
Figure 15 and Figure 16. Antimony and Arsenic. Comparison of total elemental content by
Figure 17 and Figure 18. Barium and Cadmium. Comparison of total elemental content by
Figure 19 and Figure 20. Chromium and Cobalt. Comparison of total elemental content by
Figure 21 and Figure 22. Lead and Molybdenum. Comparison of total elemental content by
Figure 23 and Figure 24. Selenium and Thallium. Comparison of total elemental content by
digestion.................................................................................................................................. 46
digestion.................................................................................................................................. 47
digestion.................................................................................................................................. 48
digestion.................................................................................................................................. 49
digestion.................................................................................................................................. 50
Figure 25. Fly Ash - Total content by XRF. ................................................................................ 52
Figure 26. Gypsum – Total content by XRF................................................................................ 53
Figure 27. Scrubber Sludge – Total content by XRF................................................................... 54
ix
Characterization of Coal Cumbustion Residues II
Figure 28. Fixated Scrubber Sludge – Total content by XRF...................................................... 55
Figure 30. Mercury - Examples of characteristic leaching behavior as a function of pH (SR002.1
Figure 47 and Figure 48. Mercury and Aluminum. Comparison of maximum, minimum and natural pH concentrations observed in SR02 and SR03 extracts over the pH domain 5.4≤
Figure 49 and Figure 50. Antimony and Arsenic. Comparison of maximum, minimum and natural pH concentrations observed in SR02 and SR03 extracts over the pH domain 5.4≤
Figure 51 and Figure 52. Barium and Boron. Comparison of maximum, minimum and natural pH concentrations observed in SR02 and SR03 extracts over the pH domain 5.4≤ pH≤ 12.4.
Figure 53 and Figure 54. Cadmium and Chromium. Comparison of maximum, minimum and natural pH concentrations observed in SR02 and SR03 extracts over the pH domain 5.4≤
Figure 55 and Figure 56. Cobalt and Lead. Comparison of maximum, minimum and natural pH
Figure 57 and Figure 58. Molybdenum and Selenium. Comparison of maximum, minimum and natural pH concentrations observed in SR02 and SR03 extracts over the pH domain 5.4≤
Figure 29. Fixated Scrubber Sludge with Lime – Total content by XRF. ................................... 56
results)..................................................................................................................................... 61
Figure 31. Aluminum. Examples of characteristic leaching behavior as a function of pH. ....... 62
Figure 32. Antimony. Examples of characteristic leaching behavior as a function of pH. ........ 63
Figure 33. Arsenic. Examples of characteristic leaching behavior as a function of pH. ............ 64
Figure 34. Barium. Examples of characteristic leaching behavior as a function of pH. ............ 65
Figure 35. Boron. Examples of characteristic leaching behavior as a function of pH. .............. 66
Figure 36. Cadmium. Examples of characteristic leaching behavior as a function of pH.......... 67
Figure 37. Chromium. Examples of characteristic leaching behavior as a function of pH. ....... 68
Figure 38. Chromium. Examples of characteristic leaching behavior as a function of pH. ....... 69
Figure 39. Cobalt. Examples of characteristic leaching behavior as a function of pH............... 70
Figure 40. Lead. Examples of characteristic leaching behavior as a function of pH. ................ 71
Figure 41. Molybdenum. Examples of characteristic leaching behavior as a function of pH. ... 72
Figure 42. Molybdenum. Examples of characteristic leaching behavior as a function of pH. ... 73
Figure 43. Selenium. Examples of characteristic leaching behavior as a function of pH. ......... 74
Figure 44. Selenium. Examples of characteristic leaching behavior as a function of pH. ......... 75
Figure 45. Thallium. Examples of characteristic leaching behavior as a function of pH........... 76
Figure 46. Natural pH (pH in distilled water at LS=10) observed in SR02 extracts. .................. 79
pH≤ 12.4.. ............................................................................................................................... 80
pH≤ 12.4.. ............................................................................................................................... 81
................................................................................................................................................. 82
pH≤ 12.4.. ............................................................................................................................... 83
concentrations observed in SR02 and SR03 extracts over the pH domain 5.4≤ pH≤ 12.4. . 84
pH≤ 12.4.. ............................................................................................................................... 85
x
Characterization of Coal Combustion Residues II
Figure 59. Thallium. Comparison of maximum, minimum and natural pH concentrations observed in SR02 and SR03 extracts over the pH domain 5.4≤ pH≤ 12.4............................. 86
xi

Characterization of Coal Cumbustion Residues II
ABSTRACT
This report evaluates leaching characteristics of air pollution control residues from coal-fired power plants that use acid gas scrubbers, which may also reduce air emissions of mercury and other pollutants. Leaching of mercury and other constituents of potential concern (COPCs) during land disposal of coal combustion residues (CCRs)1 is evaluated in this report. The data presented in this report will be used in a future report to evaluate the fate of mercury and other COPCs from the management of CCRs resulting from the use of multi-pollutant control technologies. This research is part of an on-going effort by U.S. Environmental Protection Agency (EPA) to use a holistic approach to account for the fate of mercury and other metals in coal throughout the life-cycle stages of CCR management including disposal and beneficial use.
The specific objectives of the research reported here are to:
1. Evaluate the potential for leaching to groundwater of mercury and other COPCs (i.e., aluminum, antimony, arsenic, barium, boron, cadmium, chromium, cobalt, lead, molybdenum, selenium, and thallium) removed from the flue gas of coal-fired power plants by facilities that use wet scrubbers as part of a multi-pollutant control strategy to reduce air emissions.
2. Provide the foundation for assessing the impact of enhanced mercury and multi-pollutant control technology on leaching of mercury and other COPCs from CCR management including storage, beneficial use, and disposal; and,
3. Perform these assessments using the most appropriate evaluation methods currently available. The laboratory leach testing followed the approach developed by Kosson, et al. (2002), which considers the effects of varying environmental conditions on waste constituent leaching.
Air pollution control residues (fly ash, gypsum, and scrubber sludge samples) were obtained from coal combustion electric utility facilities using wet scrubbers. A range of facility configurations was selected representing differences in air pollution control technology configurations and coal rank. Each of the residues sampled has been analyzed for selected physical properties, and for total content and leaching characteristics of selected COPCs. Results of laboratory leaching tests were used to develop estimates of constituent release under field management scenarios. Laboratory leaching test results also were compared to field observations of leaching.
This report includes results for 23 CCRs (5 fly ashes, 6 gypsum samples, 5 scrubber sludges, 7 fixated scrubber sludges) sampled from eight facilities. Each CCR sampled was evaluated in the laboratory for leaching as a function of pH and liquid-to-solid ratio. Results are presented for mercury, aluminum, antimony, arsenic, barium, boron, cadmium, chromium, cobalt, lead, molybdenum, selenium and thallium.
1 Coal combustion residues (CCRs) refer collectively to fly ash, scrubber residues and other air pollution control solid residues generated during the combustion of coal collected through the associated air pollution control system. Resultant CCRs may be managed as separate or combined residue streams, depending on individual facility configuration.
xii

Characterization of Coal Combustion Residues II
GLOSSARY OF TERMS
ACI Activated Carbon Injection
Al Aluminum
APC Air Pollution Control
APPCD Air Pollution Prevention and Control Division
As Arsenic
ASTM American Society for Testing and Materials
B Boron
Ba Barium
BET Brunauer, Emmett and Teller (method for quantification of surface area)
BML Below Method Limit
CAIR Clean Air Interstate Rule
CAMR Clean Air Mercury Rule
Cd Cadmium
CCRs Coal Combustion Residues
CCV Continuing Calibration Verification
Co Cobalt
COPCs Constituents of Potential Concern
Cr Chromium
C.V. Coefficient of Variation
CVAA Cold Vapor Atomic Adsorption
DIC Dissolved Inorganic Carbon
DOC Dissolved Organic Carbon
DOE United States Department of Energy
DI Deionized (i.e., deionized water)
DRC Dynamic Reaction Chamber
dw dry weight basis
DWEL Drinking Water Equivalent Level
EPA United States Environmental Protection Agency
EPRI Electric Power Research Institute
ESP Electrostatic Precipitator
ESP-CS Cold-side Electrostatic Precipitator
ESP-HS Hot-side Electrostatic Precipitator
xiii
Characterization of Coal Cumbustion Residues II
FF Fabric Filter (bag house)
FGD Flue Gas Desulfurization
FID Flame Ionization Detector
FO Forced Oxidation
FSS Fixated Scrubber Sludge
FSSL Fixated Scrubber Sludge with Lime
Gyp-U Unwashed Gypsum
Gyp-W Washed Gypsum
Hg Mercury
HHV Higher Heating Value
Ho Holmium
ICP-MS Inductively Coupled Plasma-Mass Spectrometry
ICV Initial Calibration Verification
In Indium
IO Inhibited Oxidation
I.Ox. Inhibited Oxidation (this abbreviation used in some figures to improve clarity)
LOI Loss On Ignition
LS Liquid-to-Solid Ratio (LS ratio)
M Molar
Max Maximum
MCL Maximum Contaminant Level (for drinking water)
MDL Method Detection Limit
Mg Lime Magnesium Enriched Lime (often also referred to as “mag-lime”)
Min Minimum
ML Minimum Level of Quantification
Mo Molybdenum
NETL National Energy Technology Laboratory (DOE)
NIOSH National Institute of Occupational Safety and Health
NO Natural Oxidation
NOx Nitrogen Oxides
NSPS New Source Performance Standards
OC/EC Organic Carbon/Elemental Carbon
ORD Office of Research and Development (EPA) xiv
Characterization of Coal Combustion Residues II
OSWER Office of Solid Waste and Emergency Response
PAC Powdered Activated Carbon
Pb Lead
PM Particulate Matter
PRB Sub-bituminous coal mined in Wyoming’s Powder River Basin
PS Particulate Scrubber
QA/QC Quality Assurance/Quality Control
RCRA Resource Conservation and Recovery Act
RFA Reference Fly Ash
SAB U.S. EPA Science Advisory Board
SCA Specific Collection Area
Sb Antimony
ScS Scrubber Sludge
SCR Selective Catalytic Reduction
SNCR Selective Non-Catalytic Reduction
SDA Spray Dryer Absorber
Se Selenium
SO2 Sulfur Dioxide
SPLP Synthetic Precipitation Leaching Procedure
SRM Standard Reference Material
S/S Stabilization/Solidification
SWDA Solid Waste Disposal Act
TC Toxicity Characteristic
TCLP Toxicity Characteristic Leaching Procedure
Tl Thallium
XRF X-Ray Fluorescence
xv

Characterization of Coal Cumbustion Residues II
EXECUTIVE SUMMARY
This report evaluates changes that may occur to coal combustion residues (CCRs)2 in response to changes in air pollution control technology at coal-fired power plants, which will reduce emissions from the flue gas stack by transferring pollutants to fly ash and other air pollution control residues. Congress has directed EPA to document that the Clean Air Act regulations do not have the net effect of trading one environmental burden for another. The Air Pollution Prevention and Control Division (APPCD) of EPA’s Office of Research and Development (ORD) is conducting research to evaluate potential leaching and cross media transfers of mercury and other constituents of potential concern (COPCs) resulting from land disposal or beneficial use of CCRs. The focus of this report is to present data that will be used to evaluate the fate of mercury and other metals from the use of wet scrubbers at coal-fired power plants. Leaching tests are being conducted on the residues to determine the potential transfer of pollutants from the residues to water resources or other environmental systems (e.g., soils, sediments).
The specific objectives of the research reported here are to:
1. Evaluate the potential for leaching to groundwater of mercury and other COPCs (i.e., aluminum, antimony, arsenic, barium, boron, cadmium, chromium, cobalt, lead, molybdenum, selenium, and thallium) removed from the flue gas of coal-fired power plants by facilities that use wet scrubbers as part of a multi-pollutant control strategy to reduce air emissions.
2. Provide the foundation for assessing the impact of enhanced mercury and multi-pollutant control technology on leaching of mercury and other COPCs from CCR management including storage, beneficial use, and disposal; and,
3. Perform these assessments using the most appropriate evaluation methods currently available. The laboratory leach testing followed the approach developed by Kosson, et al. (2002), which considers the effects of varying environmental conditions on waste constituent leaching.
Air pollution control residues were obtained from coal combustion electric utility facilities using wet scrubbers. A range of facility configurations was selected representing differences in air pollution control technology configurations and coal rank. Each of the residues sampled has been analyzed for selected physical properties, and for total content and leaching characteristics. Results of laboratory leaching tests were used to develop estimates of constituent release under field management scenarios. Laboratory leaching test results also were compared to field observations of leaching.
2 Coal combustion residues (CCRs) refer collectively to fly ash and other air pollution control solid residues generated during the combustion of coal collected through the associated air pollution control system. Resultant CCRs may be managed as separate or combined residue streams, depending on individual facility configuration.
xvi
Characterization of Coal Combustion Residues II
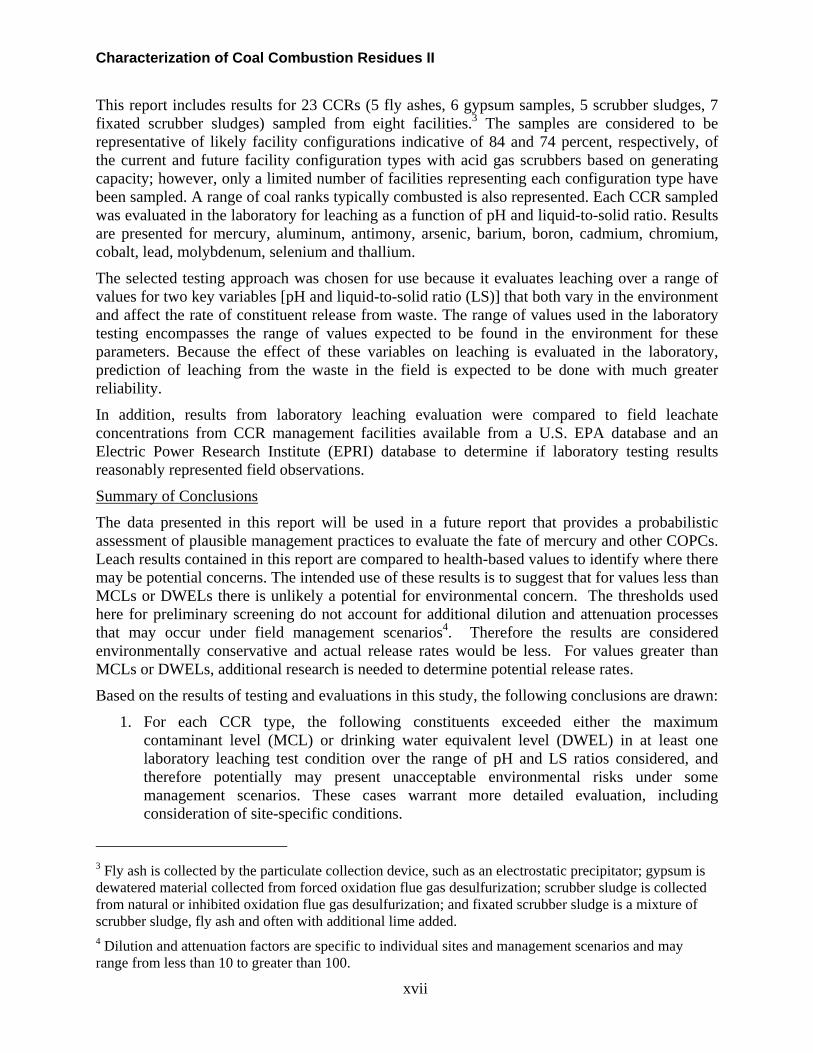
This report includes results for 23 CCRs (5 fly ashes, 6 gypsum samples, 5 scrubber sludges, 7 fixated scrubber sludges) sampled from eight facilities.3 The samples are considered to be representative of likely facility configurations indicative of 84 and 74 percent, respectively, of the current and future facility configuration types with acid gas scrubbers based on generating capacity; however, only a limited number of facilities representing each configuration type have been sampled. A range of coal ranks typically combusted is also represented. Each CCR sampled was evaluated in the laboratory for leaching as a function of pH and liquid-to-solid ratio. Results are presented for mercury, aluminum, antimony, arsenic, barium, boron, cadmium, chromium, cobalt, lead, molybdenum, selenium and thallium.
The selected testing approach was chosen for use because it evaluates leaching over a range of values for two key variables [pH and liquid-to-solid ratio (LS)] that both vary in the environment and affect the rate of constituent release from waste. The range of values used in the laboratory testing encompasses the range of values expected to be found in the environment for these parameters. Because the effect of these variables on leaching is evaluated in the laboratory, prediction of leaching from the waste in the field is expected to be done with much greater reliability.
In addition, results from laboratory leaching evaluation were compared to field leachate concentrations from CCR management facilities available from a U.S. EPA database and an Electric Power Research Institute (EPRI) database to determine if laboratory testing results reasonably represented field observations.
Summary of Conclusions
The data presented in this report will be used in a future report that provides a probabilistic assessment of plausible management practices to evaluate the fate of mercury and other COPCs. Leach results contained in this report are compared to health-based values to identify where there may be potential concerns. The intended use of these results is to suggest that for values less than MCLs or DWELs there is unlikely a potential for environmental concern. The thresholds used here for preliminary screening do not account for additional dilution and attenuation processes that may occur under field management scenarios4. Therefore the results are considered environmentally conservative and actual release rates would be less. For values greater than MCLs or DWELs, additional research is needed to determine potential release rates.
Based on the results of testing and evaluations in this study, the following conclusions are drawn:
1. For each CCR type, the following constituents exceeded either the maximum contaminant level (MCL) or drinking water equivalent level (DWEL) in at least one laboratory leaching test condition over the range of pH and LS ratios considered, and therefore potentially may present unacceptable environmental risks under some management scenarios. These cases warrant more detailed evaluation, including consideration of site-specific conditions.
3 Fly ash is collected by the particulate collection device, such as an electrostatic precipitator; gypsum is dewatered material collected from forced oxidation flue gas desulfurization; scrubber sludge is collected from natural or inhibited oxidation flue gas desulfurization; and fixated scrubber sludge is a mixture of scrubber sludge, fly ash and often with additional lime added. 4 Dilution and attenuation factors are specific to individual sites and management scenarios and may range from less than 10 to greater than 100.
xvii
Characterization of Coal Cumbustion Residues II
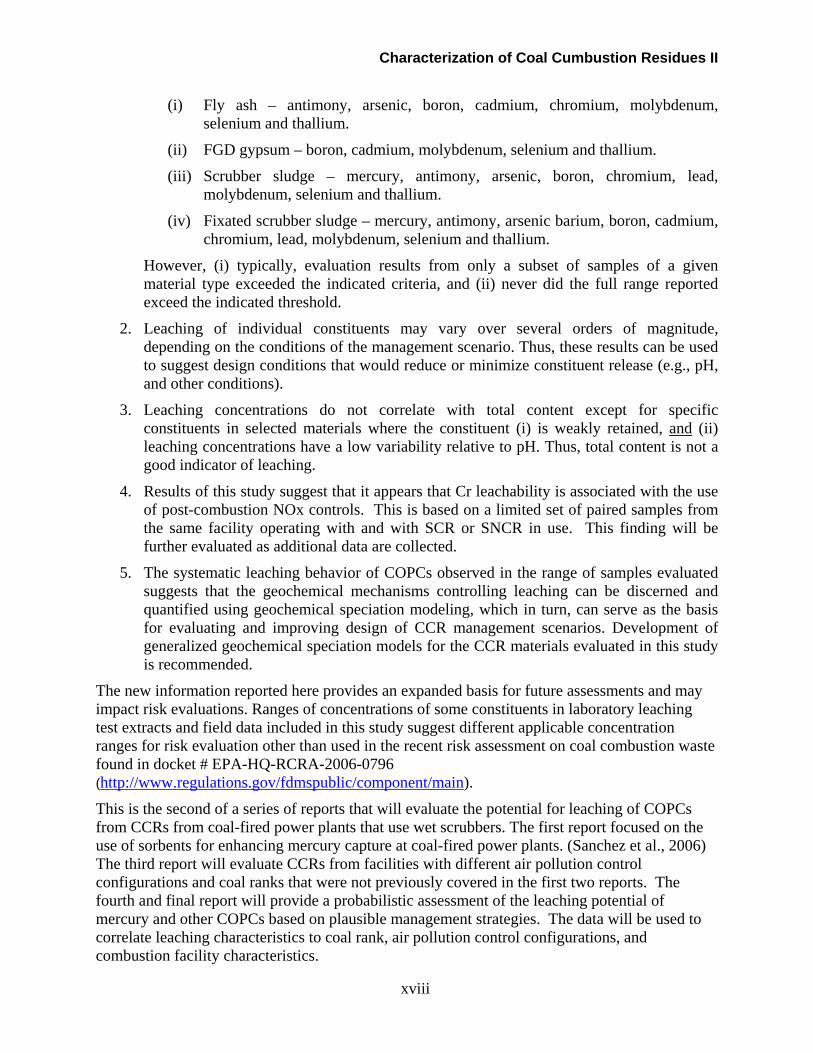
(i) Fly ash – antimony, arsenic, boron, cadmium, chromium, molybdenum, selenium and thallium.
(ii) FGD gypsum – boron, cadmium, molybdenum, selenium and thallium.
(iii) Scrubber sludge – mercury, antimony, arsenic, boron, chromium, lead, molybdenum, selenium and thallium.
(iv) Fixated scrubber sludge – mercury, antimony, arsenic barium, boron, cadmium, chromium, lead, molybdenum, selenium and thallium.
However, (i) typically, evaluation results from only a subset of samples of a given material type exceeded the indicated criteria, and (ii) never did the full range reported exceed the indicated threshold.
2. Leaching of individual constituents may vary over several orders of magnitude, depending on the conditions of the management scenario. Thus, these results can be used to suggest design conditions that would reduce or minimize constituent release (e.g., pH, and other conditions).
3. Leaching concentrations do not correlate with total content except for specific constituents in selected materials where the constituent (i) is weakly retained, and (ii) leaching concentrations have a low variability relative to pH. Thus, total content is not a good indicator of leaching.
4. Results of this study suggest that it appears that Cr leachability is associated with the use of post-combustion NOx controls. This is based on a limited set of paired samples from the same facility operating with and with SCR or SNCR in use. This finding will be further evaluated as additional data are collected.
5. The systematic leaching behavior of COPCs observed in the range of samples evaluated suggests that the geochemical mechanisms controlling leaching can be discerned and quantified using geochemical speciation modeling, which in turn, can serve as the basis for evaluating and improving design of CCR management scenarios. Development of generalized geochemical speciation models for the CCR materials evaluated in this study is recommended.
The new information reported here provides an expanded basis for future assessments and may impact risk evaluations. Ranges of concentrations of some constituents in laboratory leaching test extracts and field data included in this study suggest different applicable concentration ranges for risk evaluation other than used in the recent risk assessment on coal combustion waste found in docket # EPA-HQ-RCRA-2006-0796 (http://www.regulations.gov/fdmspublic/component/main).
This is the second of a series of reports that will evaluate the potential for leaching of COPCs from CCRs from coal-fired power plants that use wet scrubbers. The first report focused on the use of sorbents for enhancing mercury capture at coal-fired power plants. (Sanchez et al., 2006) The third report will evaluate CCRs from facilities with different air pollution control configurations and coal ranks that were not previously covered in the first two reports. The fourth and final report will provide a probabilistic assessment of the leaching potential of mercury and other COPCs based on plausible management strategies. The data will be used to correlate leaching characteristics to coal rank, air pollution control configurations, and combustion facility characteristics.
xviii
Characterization of Coal Cumbustion Residues II
1. INTRODUCTION
Changes are occurring to air pollution control technology at coal-fired power plants which will reduce emissions from the flue gas stack by transferring pollutants to fly ash and other air pollution control residues. Congress has directed EPA to document that the Clean Air Act regulations do not have the net effect of trading one environmental burden for another. The Air Pollution Prevention and Control Division (APPCD) of EPA’s Office of Research and Development (ORD) is conducting research to evaluate potential leaching and cross media transfers of Constituents of Potential Concern (COPCs) resulting from land disposal or beneficial use of coal combustion residues (CCRs). This report is part of a series of reports being prepared to document the fate of mercury and other metals found in coal that are being controlled at the power plant stack through implementation of multi-pollutant control technology.
The focus of this report is to present an evaluation of air pollution control residues that may result from the use of SO2 scrubbers as mercury control technology at coal-fired power plants, and the potential for transfer of pollutants from the resulting residues to water resources or other environmental systems (e.g., soils, sediments). The residues studied for this report were unwashed and washed flue gas desulfurization (FGD) gypsum, scrubber sludge, fixated scrubber sludge, and fly ashes generated from power plants that have SO2 scrubbers. This report compares the impact of NOx control technology [selective catalytic reduction (SCR) and selective non-catalytic reduction (SNCR)] on characteristics of CCRs obtained from the same facilities during periods when the NOx control was and was not in use.
The potential for leaching of mercury and other COPCs during land disposal or beneficial use of the CCRs is the more narrow focus of this assessment. This research is part of an on-going effort by EPA to use an integrated, comprehensive approach to account for the fate of mercury and other metals in coal throughout the life-cycle stages of CCR management (Thorneloe et al., 2008; Sanchez et al., 2006). Related research and assessment on environmental fate of constituents during CCR management includes conducting thermal stability studies, leach testing, and probabilistic assessment modeling to determine fate of mercury and other metals that are in coal combustion residues resulting from implementation of multi-pollutant control technology (Kilgroe et al., 2001; EPA, 2002).
CCRs include bottom ash, boiler slag, fly ash, scrubber residues and other miscellaneous solids generated during the combustion of coal. Air pollution control can concentrate or partition metals to fly ash and scrubber residues. The boiler slag and bottom ash are not of interest in this study because enhanced mercury emission controls are not expected to change their composition. Use of multi-pollutant controls minimizes air emissions of mercury and other metals by the transfer of the metals to the fly ash and other CCRs. This research will help determine the fate of mercury and other COPCs from the management of CCRs through either disposal or reuse. Fly ash may include unburned carbonaceous materials and inorganic materials in coal that do not burn, such as oxides of silicon, aluminum, iron, and calcium. Fly ash is light enough to be entrained in the flue gas stream and captured in the air pollution control equipment.
The type and characteristics of FGD scrubber residue produced is primarily a function of (i) the scrubber sorbent used (i.e., limestone, lime, magnesium enriched lime referred to as Mg lime, or alkaline fly ash), (ii) the extent of oxidation during scrubbing (i.e., forced oxidation, natural oxidation, or inhibited oxidation), (iii) post-scrubber processing, including possibly dewatering or thickening, drying, water rinsing, or blending with other materials, and (iv) coal rank
1

Characterization of Coal Combustion Residues II
combusted. The presence and leaching characteristics of the constituents of potential concern in scrubber residues is a consequence of the coal combusted, process sequence employed, process conditions, process additives and use or disposal scenario. Figure 1 illustrates the processes used in the production of materials that were sampled for this study, sample nomenclature, and the typical management pathways for each material. FGD gypsum is defined here as the by-product of the SO2 wet scrubbing process when the scrubber residue is subjected to forced oxidation. In forced oxidation systems, nearly all of the by-product is calcium sulfate dihydrate (CaSO4•H2O). The resulting wet gypsum is partially dewatered and then either disposed in a landfill (unwashed gypsum; Gyp-U) or water rinsed (in some cases) and dried to produce washed gypsum (washed gypsum; Gyp-W) that then potentially can be used in wallboard manufacturing or agricultural applications. Scrubber sludge (ScS) is the by-product of the SO2 wet scrubbing process resulting from neutralization of acid gases at facilities that use either inhibited oxidation or natural oxidation of scrubber residue. In inhibited oxidation systems, nearly all of the by-product is calcium sulfite hemihydrates (CaSO3•½H2O). In natural oxidation systems, the by-product is a mixture of CaSO3•½H2O and CaSO4•H2O. Scrubber sludge typically will be either partially dewatered in a thickener and then disposed in a surface impoundment, or after thickening, further dewatered and mixed with fly ash to form fixated scrubber sludge (FSS). In most cases, additional lime is also blended with the scrubber sludge and fly ash to form fixated scrubber sludge with lime (FSSL). The blend of fly ash and scrubber sludge is typically between 0.5 to 1.5 parts fly ash to 1 part scrubber sludge on a dry weight basis, with 0 or 2-4% additional lime added (FSS or FSSL, respectively). Fixated scrubber sludge typically is either disposed in a landfill or supplied to a beneficial use (e.g., fill in mining applications). This report evaluates the characteristics of fly ash, FGD gypsum, scrubber sludge, and fixated scrubber sludge (as produced with or without lime) from several coal combustion facilities.
Absorber (Forced Oxidation) Facilities N, O, P, Q Facilities A, B, K, M
Wet Gypsum
Absorber (Inhibited Oxidation or Natural Oxidation)
Thickener Impoundment Dewatering (Scrubber Sludge; ScS)
Landfill (Agriculture?)(Unwashed Gypsum; Gyp‐U) Drying
Rinsing Mixing of Scrubber Sludge & Drying Fly Ash and Lime
(Fixated Scrubber Sludge) (Washed Gypsum; Gyp‐W) (FA+ScS; FSS)
(FA+ScS+lime; FSSL)
Wallboard Landfill orBeneficial Use
Figure 1. Flow diagram describing processing and nomenclature of FGD scrubber residues and samples included in this study.
2
Characterization of Coal Cumbustion Residues II
When coal is burned in an electric utility boiler, the resulting high combustion temperatures vaporize the Hg in the coal to form gaseous elemental mercury (Hg0). Subsequent cooling of the combustion gases and interaction of the gaseous Hg0 with other combustion products result in a portion of the Hg being converted to gaseous oxidized forms of mercury (Hg2+) and particle-bound mercury. The specific chemical form — known as the speciation — has a strong impact on the capture of mercury and other metals by boiler air pollution control (APC) equipment. (EPA, 2001)
Mercury and other elements partition between the combustion gas, fly ash and scrubber residues. Depending upon the gas conditioning, presence or absence of NOx control and other air pollution control technology in use, there may be changes occurring to the fly ash that may affect the stability and mobility of mercury and other metals in the CCRs. Similarly, NOx control and SO2 scrubber technology may affect the content, stability and mobility of mercury and other metals in scrubber residues.
In response to wider use of multi-pollutant control, changes are occurring in air pollution control at coal-fired power plants to reduce emissions of nitrogen oxides, sulfur oxides, and mercury. How these changes in air pollution control is the focus of this research. The fate of mercury and other COPCs in fly ash and scrubber residues is of interest as part of the overall lifecycle evaluation of impact of air pollution control technology and the management of CCRs either through disposal or beneficial use. This research is evaluating changes to air pollution control residues as a result of more widespread implementation of these multi-pollutant technologies, and the impacts of land disposal or commercial use of the residues.
The specific objectives of the research reported here are to:
1. Evaluate the potential for leaching of mercury and other COPCs removed from coal-fired power plant air emissions by different types of air pollution control technology that includes acid gas scrubbers, particulate, and sorbents;
2. Provide information to be used in separate reports to assess the fate of mercury and other COPCs from enhanced or expanded use multi-pollutant control technologies. This will include consideration of potential leaching of mercury and other COPCs during the life-cycle management of CCRs during storage, beneficial use and disposal; and
3. Perform these assessments using the most appropriate evaluation methods currently available. The laboratory leach testing followed the approach developed by Kosson, et al. (2002), which considers the effects of varying environmental conditions on waste constituent leaching.
This is the second of a series of reports that will address the potential for cross-media transfer of COPCs from CCRs. The first report focused on the use of sorbent injection (activated carbon and brominated activated carbon) for enhanced mercury control (Sanchez et al., 2006). Subsequent reports will address:
� CCRs from coal-fired power plants that use air pollution control technologies other than evaluated in earlier reports necessary to span the range of coal-types and air pollution control technology configurations (report 3);
� Assessment of leaching for COPCs under additional management scenarios, including impoundments and beneficial use on the land (report 4); and,
3

Characterization of Coal Combustion Residues II
� Broader correlation of CCR leaching characteristics to coal rank, combustion facility characteristics and geochemical speciation within CCRs supported by information and analysis on additional trace elements and primary constituents (report 4).
Table 1 provides a summary of facility configurations, including samples and sample identification for testing, described in this report. For simplicity in presentation, the use of NOx controls is indicated as either “off” or “on” (i.e., SNCR Off, SNCR On, SCR Off, SCR On), recognizing that SCR not in use (SCR Off) reflects that either the system was bypassed or ammonia was not added, and SNCR not in use (SNCR Off) indicates that urea was not added.
Sampled CCRs were subjected to multiple leaching conditions according to the designated leaching assessment approach. Leaching conditions included batch equilibrium5 extractions at acidic, neutral and alkaline conditions at an LS of 10 mL/g, and LS from 0.5 to 10 mL/g using distilled water as the leachant. The leach testing results are used to evaluate the likely range of leaching characteristics during land disposal (i.e., landfill or surface impoundment). Results of the laboratory leaching tests carried out in this study were compared to the range of observed constituent concentrations in field leachates reported in a U.S. EPA database (EPA, 2007) and an Electric Power Research Institute (EPRI) database (EPRI, 2006). The testing results presented here will be used for evaluating disposal and beneficial use scenarios in subsequent reports.
As part of this research program, a QA/QC plan consistent with EPA requirements was developed for the leaching assessment approach and reported earlier (Sanchez et al., 2006). The QA/QC methodology included initial verification of acceptable mercury retention during laboratory testing through evaluation of a mass balance around testing procedures (Sanchez et al., 2006). Modifications to the QA/QC program to reduce the experimental and analytical burden while maintaining confidence in the resulting data, based on program results to date, are presented in this report.
Laboratory testing for leaching assessment was carried out at the EPA National Risk Management Research Laboratory (Research Triangle Park, North Carolina) with technical assistance from Vanderbilt University and ARCADIS.
5 In the context of leaching tests, the term “equilibrium” is used to indicate that the test method result is a reasonable approximation of chemical equilibrium conditions even though thermodynamic equilibrium may not be approached for all constituents.
4

Characterization of Coal Cumbustion Residues II
5
Table 1. Summary of facility configurations and sample identification contained in this report. Facilities are identified by code letter only (e.g., “Facility A”) to preserve the confidentiality of the CCR source. All fly ash samples are ASTM Class F.
1Bit – bituminous; Sub-Bit – sub-bituminous 2SNCR – selective non-catalytic reduction; SNCR-BP – SNCR by-passed during winter months; SCR & SNCR – residues combined from facility with both SCR and SNCR
3ESP-CS – cold-side electrostatic precipitator; ESP-HS – hot-side electrostatic precipitator. 4FA – fly ash; Gyp-U – unwashed gypsum; Gyp-W – washed gypsum; ScS – scrubber sludge; FSS – fixated scrubber sludge (a mixture of fly ash and scrubber sludge); FSSL – fixated scrubber sludge with lime (a mixture of fly ash and scrubber sludge with additional lime added). The three-letter identification codes are shown for each facility and sample type (e.g., CFA, CGD).
FGD Scrubber Type Sample Types and Identification4
Facility Code
Coal Rank1
Post-Combustion NOx Control2
Particulate Control3
Lime or Mg Lime
Oxidation
FA
Gyp-U
Gyp-W
ScS
FSS
FSSL
A Bit SNCR-BP (off) Fabric Filter Limestone Natural CFA CGD CCC
A Bit SNCR (on) Fabric Filter Limestone Natural AFA AGD ACC
B Bit SCR-BP (off) ESP-CS Mg Lime Natural DFA DGD DCC
B Bit SCR (on) ESP-CS Mg Lime Natural BFA BGD BCC
K Sub-Bit SCR (on) ESP-CS Mg Lime Natural KFA KGD KCC
M Bit SCR-BP (off) ESP-CS Limestone Inhibited MAD
M Bit SCR (on) ESP-CS Limestone Inhibited MAS
N Bit None ESP-CS Limestone Forced NAU NAW
O Bit SCR (on) ESP-CS Limestone Forced OAU OAW
P Bit SCR & SNCR ESP-CS Limestone Forced PAD
Q Sub-Bit none ESP-HS Limestone Forced QAU

Characterization of Coal Combustion Residues II
1.1. REGULATORY CONTEXT
1.1.1. Waste Management The management of coal combustion residues is subject to the Resource Conservation and Recovery Act (RCRA), which is the federal law regulating both solid and hazardous wastes, as well as state regulatory requirements. Subtitle C of RCRA pertains to hazardous waste; other solid, non-hazardous wastes fall under RCRA Subtitle D. Subtitle C wastes are federally regulated while Subtitle D wastes are regulated primarily at the state level. The original version of RCRA did not specify whether CCRs were Subtitle C or D wastes. In 1980, the Solid Waste Disposal Act (SWDA) amendments to RCRA conditionally excluded CCRs from Subtitle C regulation pending completion of a study of CCR hazards. Since that time, CCRs have been regulated at the state level under Subtitle D.
The SWDA amendments to RCRA required EPA to prepare a report to Congress identifying CCR hazards and recommending a regulatory approach for CCRs. In this report (EPA, 1988) and the subsequent regulatory determination, EPA recommended that CCRs generated by electric utilities continue to be regulated under RCRA Subtitle D (See 58 FR 42466, August 9, 1993).
Other residues generated at coal-fired electric utilities were not included in this 1993 decision. EPA conducted a follow-up study specifically aimed at low-volume, co-managed wastes6 and issued another Report to Congress (EPA, 1999) with a similar recommendation. In April 2000, EPA issued a regulatory determination exempting these wastes from hazardous waste regulations (see 65 FR 32214, May 22, 2000). However, concern was expressed over the use of CCRs as backfill for mine reclamation operations, and it was determined that this practice should be regulated under a federal Subtitle D rule. It was also decided by EPA that federal regulations under Subtitle D are needed for CCR when they are disposed in surface impoundments and landfills. Currently, the agency is in the process of developing these regulations (http://www.epa.gov/epaoswer/other/fossil/noda07.htm). The results presented in this report, and subsequent reports, will help provide the information needed to identify the release potential of mercury and other metals that have been removed from stack gases into air pollution control residues, over a range of plausible management options. These data will help identify those conditions that will either reduce or enhance releases to the land so that the effects of different management conditions can be factored into any controls developed under the regulations.
1.1.2. Air Pollution Control On March 10, 2005, EPA announced the CAIR (FR 25612, May 2005) which is expected to increase the use of wet scrubbers and selective catalytic reduction (SCR) units to help reduce sulfur dioxide and nitrogen oxides emissions from coal-fired power plants. On March 15, 2005, EPA announced the CAMR (FR 28606, May 2005) for reducing mercury emissions through the use of a cap and trade program. Power plants are the largest remaining source of anthropogenic mercury emissions in the county. The CAMR established “standards of performance” that limit mercury emissions from new [through new source performance standards (NSPSs)] and existing (through emission guidelines) coal-fired power plants through the creation of a market-based cap-and-trade program that will reduce mercury emissions in two phases. The first phase caps
6 Co-managed wastes are low-volume wastes that are co-managed with the high-volume CCRs.
6

Characterization of Coal Cumbustion Residues II
national annual mercury emissions at 38 tons through co-benefit reductions achieved through controlling sulfur dioxide (SO2) and nitrogen oxides (NOx) emissions under CAIR. In the second phase, due in 2018, coal-fired power plants will be subject to a second cap, which will reduce mercury emissions to 15 tons per year upon full implementation. On February 8, 2008, the D.C. Circuit vacated EPA's rule removing power plants from the Clean Air Act list of sources of hazardous air pollutants. At the same time, the court vacated the CAMR. EPA is reviewing the court's decisions and evaluating its impacts. (http://www.epa.gov/mercuryrule/) On July 11, 2008, the D.C. Circuit vacated EPA’s Clean Air Interstate Rule. EPA is reviewing the court’s decisions and evaluating its impacts.
Congress has directed EPA to document that the Clean Air Act regulations are not trading one environmental burden for another. The Air Pollution Prevention and Control Division (APPCD) of EPA’s Office of Research and Development (ORD) is conducting the current research to help identify any potential pollutant transfers resulting from land disposal or beneficial use of mercury-enriched CCRs. The research results presented in this report are part of that effort.
In response to the evolving implementation of advanced air pollution control technology for coal-fired power plants, this research is directed towards understanding changes in CCR characteristics that may increase environmental burdens from land disposal of CCRs or impact CCR usage in commercial applications.
1.2. CONFIGURATIONS OF U.S. COAL FIRED POWER PLANTS AND MULTI-POLLUTANT CONTROL TECHNOLOGIES
In the U.S., there are approximately 1,100 units at approximately 500 coal-fired electricity generating facilities. These facilities represent a range of coal ranks, boiler types, and air pollution control technologies. The current combined capacity of U.S. coal-fired power plants is 307 GW (DOE-EIA, 2007). The coal rank burned and facility design characteristics affect the effectiveness of multi-pollutant control technologies that are or could be used at these plants. The U.S. coal-fired power plants typically burn one of three types of fuel: (1) bituminous coal (also referred to as “high rank” coal), (2) sub-bituminous coal, and (3) and lignite (sub-bituminous coal and lignite are referred to as “low rank” coals). Some of the characteristics of interest related to the possible environmental impacts of burning these different coal ranks are given in Table 2 (EPA, 2005).
Table 2. General Characteristics of Coals Burned in U. S. Power Plants (EPA, 2005).
Mercury Chlorine Sulfur Ash HHVa
ppm (dry) ppm (dry) % (dry) % (dry) BTU/lb (dry) Coal Range Avg Range Avg Range Avg Range Avg Range Avg Bitu 0.036 - 0.113 48 - 1033 0.55 - 1.69 5.4 - 11.1 8646 - 13203 minous 0.279 2730 4.10 27.3 14014 Sub 0.025 - 0.071 51 - 158 0.22 - 0.50 4.7 - 8.0 8606 - 12005 bitu 0.136 1143 1.16 26.7 13168 minous Lignite 0.080 -
0.127 0.107 133 -
233 188 0.8 -
1.42 1.30 12.2 -
24.6 19.4 9487 -
10702 10028
a Higher Heating Value.
7
Characterization of Coal Combustion Residues II
1.2.1. Current Air Pollution Control Technologies The key air pollutants of concern released by coal fired power plants include particulates, SO2, NOx, mercury and other metals7. A range of pollution control technologies is used to reduce particulate, SO2, and NOx and these technologies also impact the emission of mercury and other metals. The pollution control technology type and configurations vary across facilities.
7 Concerns regarding carbon dioxide emissions from coal fired power plants are beyond the scope of this report.
8

Characterization of Coal Cumbustion Residues II
Table 3 shows the current and projected coal-fired capacity by air pollution control technology configuration. This report emphasizes wet scrubbers since their use is expected to double or triple in response to implementation of CAIR. Post-combustion particulate matter controls used at coal-fired utility boilers in the United States can include electrostatic precipitators (ESPs), fabric filters (FFs), particulate scrubbers (PSs), or mechanical collectors (MCs). Post-combustion SO2 controls can consist of a wet scrubber (WS), spray dryer adsorber (SDA), or duct injection.
Post-combustion NOx controls can involve selective catalytic reduction (SCR) or selective noncatalytic reduction (SNCR).
In response to current and proposed NOx and SO2 control requirements, additional NOx control and flue gas desulfurization (FGD) systems for SO2 control are expected to be installed and more widely used in the future. Some estimates project a doubling or tripling of the number of wet scrubbers as a result of CAIR implementation. Over half of the U.S. coal-fired capacity is projected to be equipped with SCR and, or, FGD technology by 2020.
The mercury capture efficiency of existing ESPs and FFs appears to be heavily dependent on the partitioning of mercury between the particulate and vapor phases and the distribution of mercury species (e.g., elemental or oxidized) in the vapor phase. In general, ESPs and FFs which are designed for particulate control are quite efficient at removing mercury in the particulate phase; however, the overall mercury removal efficiency in these devices may be low if most of the mercury entering the device is in the vapor phase (MTI, 2001). Many factors contribute to the observed differences in mercury removal efficiency, such as the mercury oxidation state. Differences in mercury contents of U.S. coals also result in a range of mercury concentrations in the flue gas from the boiler. In general, it is easier to achieve higher mercury percent removal with higher mercury inlet concentrations (MTI, 2001). Further, the chlorine content of the coal may have an impact on mercury removal because the oxidation state of mercury is strongly affected by the presence of halides in the flue gas. In general, the higher the chlorine content of the coal, the more likely the mercury will be present in its oxidized state, enhancing the likelihood of its removal from the gas stream. The addition of NOx controls may improve the mercury capture efficiency of particulate collection devices for some cases. (EPA, 2001)
9

Characterization of Coal Combustion Residues II
Table 3. Projected Coal-Fired Capacity by APC Configuration as per data collection in 1999 (EPA, 2005). CCR samples evaluated in this report are from configurations indicated by shaded (light gray) rows. Current capacity reflects date of data collection for EPA report (EPA, 2005).
Air Pollution Control Configuration Current Capacity, MW
2010 Capacity, MW
2020 Capacity, MW
Cold-side ESP 111,616 75,732 48,915 Cold-side ESP + Wet Scrubber 41,745 34,570 33,117 Cold-side ESP + Wet Scrubber + ACI - 379 379 Cold-side ESP + Dry Scrubber 2,515 3,161 5,403 Cold-side ESP + SCR 45,984 35,312 22,528 Cold-side ESP + SCR + Wet Scrubber 27,775 62,663 98,138 Cold-side ESP + SCR + Dry Scrubber - 11,979 13,153 Cold-side ESP + SNCR 7,019 4,576 2,534 Cold-side ESP + SNCR + Wet Scrubber 317 2,830 6,088 Fabric Filter 11,969 10,885 7,646 Fabric Filter + Dry Scrubber 8,832 8,037 9,163 Fabric Filter + Wet Scrubber 4,960 4,960 4,960 Fabric Filter + Dry Scrubber + ACI - 195 195 Fabric Filter + SCR 2,210 2,950 1,330 Fabric Filter + SCR + Dry Scrubber 2,002 2,601 4,422 Fabric Filter + SCR + Wet Scrubber 805 805 2,363 Fabric Filter + SNCR 267 267 345 Fabric Filter + SNCR + Dry Scrubber 559 557 557 Fabric Filter + SNCR + Wet Scrubber 932 932 1,108 Hot-side ESP 18,929 11,763 10,160 Hot-side ESP + Wet Scrubber 8,724 10,509 10,398 Hot-side ESP + Dry Scrubber - 538 538 Hot-side ESP + SCR 5,952 3,233 1,847 Hot-side ESP + SCR + Wet Scrubber 688 6,864 9,912 Hot-side ESP + SNCR 684 1,490 1,334 Hot-side ESP + SNCR + Wet Scrubber 474 474 627 Existing or Planned Retrofit Units 304,955 298,263 297,161
New Builds of Coal Steam Units Current Capacity, MW
2010 Capacity, MW
2020 Capacity, MW
Fabric Filter + SCR + Wet Scrubber - 221 17,292
Total All Units 304,955 298,484 314,453 Note: IGCC units are not included as part of this list. Note: Current capacity includes some SCR and FGD projected to be built in 2005 and 2006. Note: 2010 and 2020 is capacity projected for final CAIR rule. Note: IPM projects some coal retirements and new coal in 2010 and 2020.
10

Characterization of Coal Cumbustion Residues II
1.2.2. Wet Scrubbers, NOx Controls and Multi-pollutant Controls Wet FGD scrubbers are the most widely used technology for SO2 control. Scrubbers are typically installed downstream of particulate control (i.e., ESP or FF). Removal of PM from the flue gas before it enters the wet scrubber reduces solids in the scrubbing solution and minimizes impacts to the fly ash that might affect its beneficial use.
FGD technology uses sorbents and chemical reactants such as limestone (calcium carbonate) or lime (hydrated to form calcium hydroxide) to remove sulfur dioxide from the flue gas created from coal combustion. Limestone is ground into a fine powder and then combined with water to spray the slurry into combustion gases as they pass through a scrubber vessel. The residues are collected primarily as calcium sulfite (a chemically reduced material produced in natural oxidation or inhibited oxidation scrubbers), or can be oxidized to form calcium sulfate or FGD gypsum (using forced oxidation). The most widely used FGD systems use either forced oxidation scrubbers with limestone addition, or natural/inhibited oxidation scrubbers with lime or Mg-lime addition8. Wet scrubbers that use forced oxidation produce calcium sulfate (gypsum) and are expected to be the most prevalent technology because of the potential beneficial use of gypsum and easier management and handling of the residues. There are also dry FGD systems that include spray dryer absorbers, usually in combination with a FF (EPA, 2001; Srivastava et al., 2001).
NOx emissions are controlled through the use of low NOx producing burners and use of a selective catalytic reduction (SCR) system in the flue gas that is capable of a 90% reduction of flue gas NOx emissions. SCR is typically installed upstream of the PM control device. Sometimes selective non-catalytic reduction (SNCR) is used for NOx control, although use of SNCR is less frequent.
Figure 2 illustrates options for multi-pollutant control at power plants.
8 As of 1999: Total FGD units – 151; limestone forced oxidation (FO) - 38 units (25%); limestone natural/inhibited oxidation - 65 (43%); lime FO (all forms other than Mg-Lime) - 1 (<1%); lime natural/inhibited oxidation (all forms other than Mg-lime) - 23 (15%); Mg-lime FO - 0 (0%); Mg-lime natural/inhibited oxidation - 25 (17%) It is estimated that the numbers of natural/inhibited systems has remained nearly the same since 1999, and the limestone FO units have increased significantly. In the future, limestone FO units will increase significantly, and all types of natural/inhibited units will likely decrease (Ladwig, 2007).
11

Characterization of Coal Combustion Residues II
OxidizingOxidizing Wet Scrubber StackWet Scrubber Stack
Coal & Air
Oxidizing Chemicals
SCR
Catalysts
Residue Ash
PM Control
Coal & Air
OxidizingChemicals
SCR
Catalysts
ResidueAsh
PM Control
Figure 2. Multi-pollutant control systems in coal fired power plants.
Improvements in wet scrubber performance to enhance mercury capture depend on oxidizing elemental mercury (Hg0) to Hg2+ by using additives to the flue gas or scrubber. A DOE-funded study found that wet scrubbers remove about 90% of the oxidized gaseous mercury (Hg2+) in the flue gas but none of the elemental mercury (Pavlish et al., 2003). The percentage of total Hg removed by multi-pollutant controls (particulate and scrubber devices) is influenced by coal chlorine content, which determines the Hg oxidation status exiting the particulate control and entering the scrubber. Mercury removal efficiency by wet scrubbers ranges from 30 to 60% for cold-side ESPs as coal chlorine content is increased from 50 to 1000 mg kg-1. Mercury removal efficiency for hot-side ESPs is less effective ranging from 20 to 50% as coal chlorine content is increased from 200 to 1000 mg kg-1 (Pavlish et al., 2003). Other factors that influence mercury capture are the amount of carbon and chlorine in the fly ash. Fuel blending, addition of oxidizing chemicals, controlling unburned carbon content in the fly ash, and addition of a mercury-specific oxidizing catalyst downstream of the particulate matter control can help improve mercury capture (Thorneloe, 2006; EPA, 2005).
1.3. COAL COMBUSTION RESIDUES The range of air pollution control technologies and configurations determines the characteristics of the coal combustion residues. In 2006, 125 million tons of coal combustion residues were produced with ~53 million tons being used in commercial, engineering, and agricultural applications. (ACAA, 2007). CCRs result from unburned carbon and inorganic materials in coals that do not burn, such as oxides of silicon, aluminum, iron, and calcium. Fly ash is the unburned material from coal combustion that is light enough to be entrained in the flue gas stream, carried out of the process, and collected as a dry material in the APC equipment. APC can concentrate or partition metals in fly ash and scrubber sludge. Bottom ash and boiler slag are not affected by APC technology and, therefore, these materials are not being evaluated as part of this study. Bottom ash is the unburned material that is too heavy to be entrained in the flue gas
12
Characterization of Coal Cumbustion Residues II
stream and drops out in the furnace. Boiler slag, unburned carbon or inorganic material in coal that does not burn, falls to the bottom of the furnace and melts.
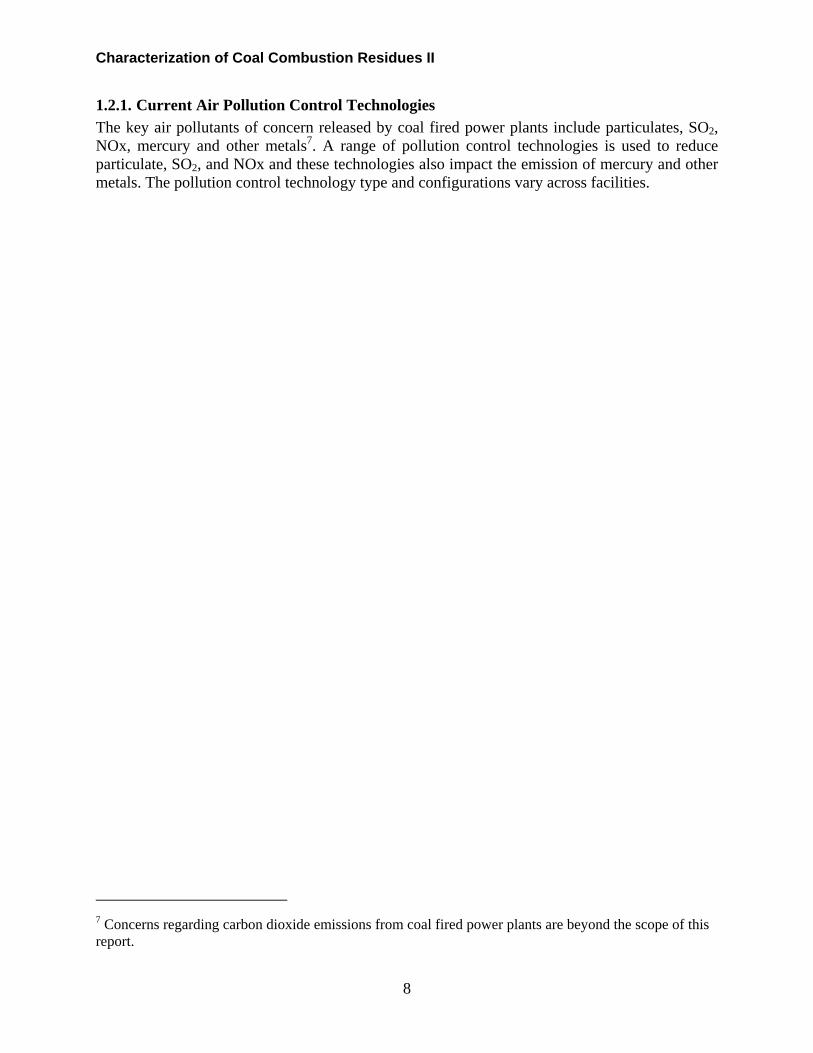
Changes in multi-pollutant control in response to CAIR implementation, voluntary improvements by facilities, and changes in state requirements, will reduce air emissions of mercury and other pollutants that will be transferred from the flue gas to the APC residues. The purpose of this research is to evaluate the impact of these changes on CCRs, with a focus on changes in metals concentrations in CCRs, and the potential for subsequent release of these metals to the environment under different plausible management (disposal or reuse) conditions (Figure 3). The properties of fly ash and scrubber residues are likely to change as a result of changes in air pollution control to reduce emissions of concern from coal-fired power plants. Changes in CCRs that may occur include increased content of mercury and other metals (e.g., arsenic, selenium, chromium) The chemical and physical properties may also change as a results of sorbents and other additives being used to improve air pollution control.
Figure 3. Life-cycle evaluation of coal combustion residues (EPA, 2002).
1.4. RESIDUE MANAGEMENT PRACTICES CCRs can be disposed in landfills or surface impoundments or used in commercial applications to produce concrete and gypsum wallboard, among other products. The major pathway of concern for release from land disposal and some beneficial use applications is leaching to groundwater. Research on the impact of CCR disposal on the environment has been conducted by many researchers and has been summarized by the EPA (1988, 1999). However, most of the existing CCR data are for CCRs prior to implementation of mercury or multi-pollutant controls.
1.4.1. Beneficial Use In the United States, approximately 40% percent (49.6 million tons) of all CCRs produced are reused in commercial applications or other uses that are considered beneficial and avoid
13

Characterization of Coal Combustion Residues II
landfilling. Forty-eight percent (23.8 million tons) of CCRs is fly ash which is used in commercial applications such as making concrete/grout, cement, structural fill, and highway construction (ACAA, 2005; Thorneloe, 2003). Eight million tons of the FGD gypsum that was produced (or 68%) was used in making wall board (ACAA, 2005). Table 4 and Figure 4 present the primary commercial uses of CCRs, and a breakdown of U.S. production and usage by CCR type.
Some of the beneficial uses may have the potential to release mercury from the CCRs by several pathways. Of particular concern are high-temperature processes. In cement manufacturing, for example, CCRs are inputs to the cement kiln. Virtually all mercury will be volatilized from CCRs when CCRs are used as feedstock to cement kilns. Even where mercury can be captured by the controls on cement kilns, approximately two-thirds of cement kiln dust captured by the control devices is reintroduced into the kiln. Therefore, a significant fraction of the mercury in CCRs introduced into cement kilns may be emitted to the air at the cement plant. Some mercury may also be revolatilized when CCRs are used as filler for asphalt, or when FGD material is used in wallboard manufacturing. A separate report is being prepared to document the finding on the thermal stability of Hg and other metals when used in high-temperature processes.
The fate of mercury and other metals is also a potential concern when CCRs are used on the land (mine reclamation, building highways, soil amendments, agriculture and in making concrete, cement) or to make products that are subsequently disposed (e.g., disposal of wallboard in unlined landfill).
For several commercial uses, it appears less likely that mercury in CCRs will be reintroduced into the environment, at least during the lifetime of the product. However, the impact of advanced mercury emissions control technology (e.g., activated carbon injection) on beneficial use applications is uncertain. There is concern that the presence of increased concentrations of mercury, certain other metals, or high carbon content may reduce the suitability of CCRs for use in some applications (e.g., carbon content can limit use in Portland cement concrete).
1.4.2. Land Disposal There are approximately 600 land-based CCR waste disposal units (landfills or surface impoundments) being used by the approximately 500 coal-fired power plants in the United States (EPA, 1999). About 60% of the 122 million tons of CCRs generated annually are land disposed. Landfills may be located either on-site or off-site while surface impoundments are almost always located on-site with the combustion operations. Although the distribution of units is about equal between landfills and surface impoundments, there is a trend toward increased use of landfills as the primary disposal method.
14

Characterization of Coal Cumbustion Residues
Report
Table 4. Beneficial uses of CCRs (ACAA, 2007). Total production of CCRs during 2006 was 124,795,124 short tons.
CCR Categories (Short Tons) Fly Ash
Bottom Ash
FGD Gypsum
FGD Wet Scrubbers
Boiler Slag1
FGD Dry Scrubbers1
FGD Other
CCR Production Category Totals2 72,400,000 18,600,000 12,100,000 16,300,000 2,026,066 1,488,951 299,195 CCR Used Category Totals3 32,423,569 8,378,494 9,561,489 904,348 1,690,999 136,639 29,341
CCR Use By Application4 Fly Ash
Bottom Ash
FGD Gypsum
FGD Wet Scrubbers
Boiler Slag
1 FGD Dry Scrubbers1
FGD Other
1. Concrete/Concrete Products/Grout 15,041,335 597,387 1,541,930 0 0 9,660 0 2. Cement/Raw Feed for Clinker 4,150,228 925,888 264,568 0 17,773 0 0 3. Flowable Fill 109,357 0 0 0 0 9,843 0 4. Structural Fills/Embankments 7,175,784 3,908,561 0 131,821 126,280 0 0 5. Road Base/Sub-base/Pavement 379,020 815,520 0 0 60 249 0 6. Soil Modification/Stabilization 648,551 189,587 0 0 0 299 1,503 7. Mineral Filler in Asphalt 26,720 19,250 0 0 45,000 0 0 8. Snow and Ice Control 0 331,107 0 0 41,549 0 0 9. Blasting Grit/Roofing Granules 0 81,242 0 232,765 1,445,933 0 0 10. Mining Applications 942,048 79,636 0 201,011 0 115,696 0 11. Wallboard 0 0 7,579,187 0 0 0 0 12. Waste Stabilization/Solidification 2,582,125 105,052 0 0 0 0 27,838 13. Agriculture 81,212 1,527 168,190 0 0 846 846 14. Aggregate 271,098 647,274 0 0 416 0 0 15. Miscellaneous/Other 1,016,091 676,463 7,614 338,751 13,988 46 46 CCR Category Use Tools 32,423,569 8,378,494 9,561,489 904,348 1,690,999 136,639 29,341
Application Use to Production Rate 44.8% 45.0% 79.0% 5.5% 83.5% 9.2% 9.8% 1 As submitted based on 54 percent coal burn. 2 CCR Production totals for Fly Ash, Bottom Ash, FGD Gypsum, and Wet FGD are extrapolated estimates rounded off to nearest 50,000 tons. 3 CCR Used totals for Fly Ash, Bottom Ash, FGD Gypsum, and Wet FGD are per extrapolation calculations (not rounded off). 4 CCR Uses by application for Fly Ash, Bottom Ash, FGD Gypsum, and Wet FGD are calculated per proportioning the CCR Used CategoryTotals by the same percentage as each of the individual application types' raw data contributions to the as-submitted raw data submittal total(not rounded off).
15

Characterization of Coal Combustion Residues II
0
2
4
6
8
10
12
14
16
18
Concrete/Grout
Structural Fill
Wallboard
Cement
WasteStabilization/Solidification
Miscellaneous/Other
Blasting Grit/Roofing Granules
Road Base/Pavement
Mining
Applications
Soil M
odification/Stabilization
Aggregate
Snow
and Ice Control
Agriculture
Mineral Filler in Asphalt
Flowable
Fill
Q u a
n ti ty of
CCR
s ( m
illio
n tons
)
FG D Dr y Sc r u b b e r s
Bo i l e r Sla g
FG D We t Sc r u b b e r s
FG D G y ps um
Bo t t o m As h
Fl y As h
Figure 4. Uses of CCRs based on 2006 Industry Statistics (ACAA, 2007).
1.5. LEACHING PROTOCOL One of the major challenges initially facing this research was identification of an appropriate test protocol for evaluating the leaching potential of CCRs that may have increased levels of several metals, particularly mercury. The goal of this research is to develop the most accurate estimates of likely constituent leaching when CCRs are land disposed. These estimates of leaching need to be appropriate for assessing at a national level the likely impacts through leaching of pollutants from CCRs that is a consequence of installation of enhanced mercury and, or, multi-pollutant controls. To achieve this goal requires that U.S. EPA evaluate leaching potential for CCRs as managed (to the degree this is known), and that the leach testing results can be appropriately extrapolated to a national assessment. A large part of the approach to achieving this goal has been to identify and evaluate CCR samples collected from the most prevalent combinations of power plant design (with a focus on air pollution control technology configurations) and coal rank used. In addition, the resulting data set is expected to serve as foundation for evaluation of CCR management options for different types of CCRs at specific sites.
Data have been collected on the disposal conditions for CCRs. The conditions will vary over time which need to be considered when evaluating leaching. (EPA, 1999, 202, 2007). When
16
Characterization of Coal Cumbustion Residues II
disposed, CCRs are typically monofilled or disposed with other CCRs. However, CCR composition can change over time, due to reactions with the atmosphere (e.g., carbonation and oxidation), changes in the source of coal or coal rank burned, or due to installation of additional pollution control equipment.
Many leaching tests have been developed by regulatory agencies, researchers, or third-party technical standards organizations, and are described in the published literature. States and others have expressed concern with the variety of leaching protocols in use, the lack of correlation of test results with field conditions and actual leaching, and lack of comparability of available data because of incomplete reporting of test conditions. There is also limited or no quality assurance (QA) information for many of these tests. Leaching tests such as the Toxicity Characterization Leaching Procedure (TCLP)9 (which reflects municipal solid waste co-disposal conditions) or the synthetic precipitation leaching procedure (SPLP), or any number of deionized water based tests may be inappropriate, or are at least not optimal for evaluating the leaching potential of CCRs as they are actually managed (i.e., monofilled or codisposed with other CCRs). These tests either presume a set of prevailing landfill conditions (which may or may not exist at CCR disposal sites; e.g., TCLP), try to account for an environmental factor considered to be important in leaching (e.g., SPLP), or presume that the waste as tested in the laboratory will define the disposal conditions (such as deionized (DI) water tests). Most existing leaching tests are empirical, in that results are presented simply as the contaminant concentrations leached when using the test, and without measuring or reporting values for factors that may affect waste leaching, or that provide insight into the chemistry that is occurring in leaching. Most tests are performed as a single batch test, and so do not consider the effect of variations in conditions on waste constituent leaching10.
In searching for a reliable procedure to characterize the leaching potential of metals from the management of CCRs, EPA sought an approach that (i) considers key aspects of the range of known CCR chemistry and management conditions (including re-use); and (ii) permits development of data that are comparable across U.S. coal and CCR types. Because the data resulting from this research will be used to support regulations, scrutiny of the data is expected.
9 The Toxicity Characterization Leaching Procedure (TCLP) was not included as part of this study for two reasons. First, EPA previously made a waste status determination under RCRA that coal combustion residues are non-hazardous (65 FR 32214, May 22, 2000). Therefore, use of TCLP was not required as indicated under the RCRA toxicity characteristic regulation for determination of whether or not CCRs were hazardous. Second, TCLP was developed to simulate co-disposal of industrial waste with municipal solid waste as a mismanagement scenario, and to reflect conditions specific to this scenario. However, the vast majority of CCRs are not being managed through co-disposal with municipal solid waste, and the test conditions for TCLP are different from the actual management practices for most CCRs. In seeking a tailored, “best-estimate” of CCR leaching, the leaching framework provides the flexibility to consider the effects of actual management conditions on these wastes, and so will be more accurate in this case.
10 Many factors are known or may reasonably be expected to affect waste constituent leaching. The solubility of many metal salts is well known to vary with pH; adsorption of metals to the waste matrix varies with pH; redox conditions may determine which metal salts are present in wastes; temperature may affect reaction rates; water infiltration can affect the leaching rate, and also affect leaching chemistry and equilibrium.
17

Characterization of Coal Combustion Residues II
Therefore, the use of a published, peer-reviewed protocol is also considered to be an essential element of this work.
EPA ORD has worked closely with EPA’s Office of Solid Waste and Emergency Response (OSWER) to identify an appropriate leaching protocol for evaluating CCRs. The protocol that has been adopted is the “Integrated Framework for Evaluating Leaching in Waste Management and Utilization of Secondary Materials” (Kosson et al., 2002) and referred to here as the “leaching framework.” The leaching framework consists of a tiered approach to leaching assessment. The general approach under the leaching framework is to use laboratory testing to measure intrinsic leaching characteristics of a material (i.e., liquid-solid equilibrium partitioning as a function of pH and LS ratio, mass transfer rates) and then use this information in conjunction with mass transfer models to estimate constituent release by leaching under specific management scenarios (e.g., landfilling). Unlike other laboratory leaching tests, under this approach, laboratory testing is not intended to directly simulate or mimic field conditions. Development work to-date on the leaching framework has focused on assessing metals leaching, and this work includes equilibrium batch testing (over a range of pH and LS ratio values), diffusion-controlled mass transfer, and percolation-controlled (column) laboratory test methods in conjunction with mass transfer models, to estimate release for specific management scenarios based on testing results from a common set of leaching conditions. EPA OSWER and ORD believe that this approach successfully addresses the concerns identified above, in that it seeks to consider the effect of key disposal conditions on constituent leaching, and to understand the leaching chemistry of wastes tested.
The following attributes of the leaching framework were considered as part of the selection process:
� The leaching framework will permit development of data that are comparable across U.S. coal and CCR types;
� The leaching framework will permit comparison with existing laboratory and field leaching data on CCRs;
� The leaching framework was published in the peer-reviewed scientific literature (Kosson et al., 2002);
� On consultation with EPA’s OSWER, it was recommended as the appropriate protocol based on review of the range of available test methods and assessment approaches; and
� On consultation with the Environmental Engineering Committee of the Science Advisory Board (June 2003), the committee considered the leaching framework responsive to earlier SAB criticisms of EPA’s approach to leaching evaluation, and also was considered broadly applicable and appropriate for this study
For this study, the primary leaching tests used from the leaching framework were Solubility and Release as a Function of pH (SR002.1) and Solubility and Release as a Function of the Liquid-Solid Ratio (LS) (SR003.1)11. These tests represent equilibrium-based leaching characterization
11 LS refers to liquid to solid ratio (mL water/g CCR or L water/kg CCR) occurring during laboratory leaching tests or under field conditions. SR002.1 is carried out at LS=10 with several parallel batch extractions over a range of pH, while SR003.1 is carried out using several parallel batch extractions with
18

Characterization of Coal Cumbustion Residues II
(Kosson et al., 2002). The range of pH and LS ratio used in the leaching tests includes the range of conditions (pH and LS ratio) observed for current CCR management practices. Results of these tests provide insights into the physical-chemical mechanisms controlling constituent leaching. When used in conjunction with mass transfer and geochemical speciation modeling, the results can provide conservative12 but realistic estimates of constituent leaching under a variety of environmental conditions (pH, redox, salinity, carbonation) and management scenarios.
Laboratory testing for leaching assessment was carried out at the U.S. EPA National Risk Management Research Laboratory (Research Triangle Park, NC) with technical assistance from Vanderbilt University.
deionized water at LS= 0.5, 1, 2, 5 and 10. Under field conditions, LS refers to the cumulative amount of water passing through the total mass of CCR subject to leaching. 12 In this report, “conservative” implies that the constituent release estimates are equal to or greater than actual expected release under field conditions.
19
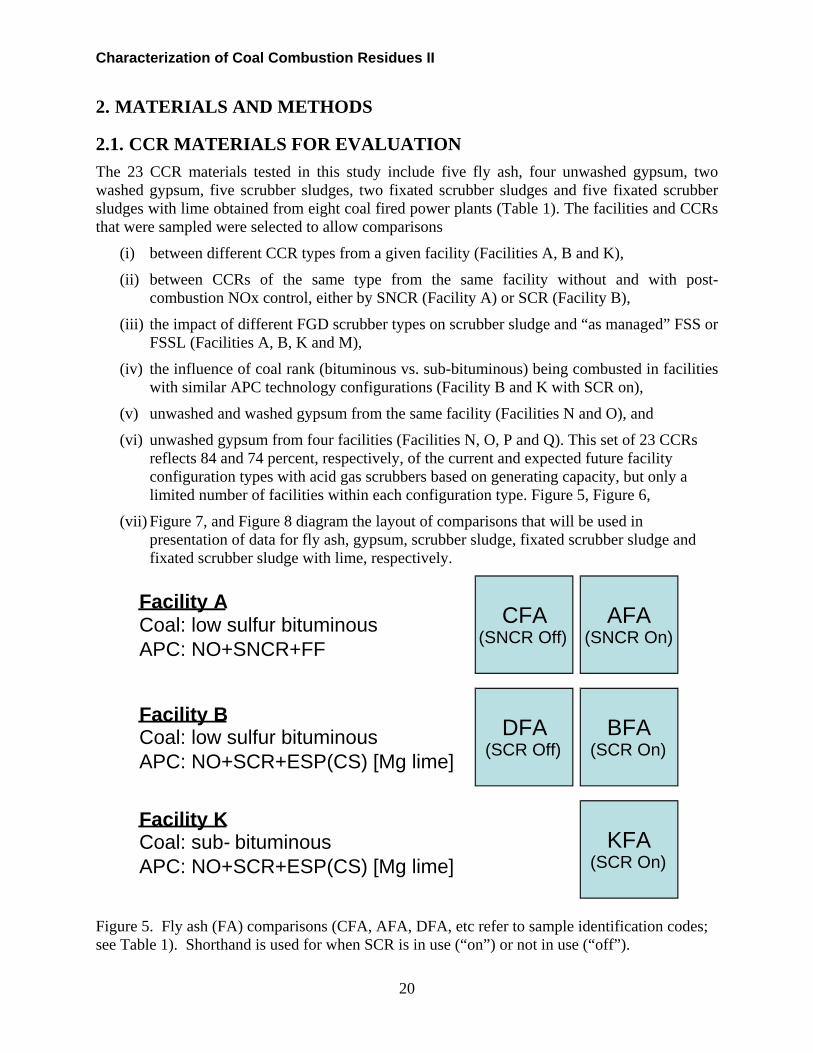
Characterization of Coal Combustion Residues II
2. MATERIALS AND METHODS
2.1. CCR MATERIALS FOR EVALUATION The 23 CCR materials tested in this study include five fly ash, four unwashed gypsum, two washed gypsum, five scrubber sludges, two fixated scrubber sludges and five fixated scrubber sludges with lime obtained from eight coal fired power plants (Table 1). The facilities and CCRs that were sampled were selected to allow comparisons
(i) between different CCR types from a given facility (Facilities A, B and K),
(ii) between CCRs of the same type from the same facility without and with post-combustion NOx control, either by SNCR (Facility A) or SCR (Facility B),
(iii) the impact of different FGD scrubber types on scrubber sludge and “as managed” FSS or FSSL (Facilities A, B, K and M),
(iv) the influence of coal rank (bituminous vs. sub-bituminous) being combusted in facilities with similar APC technology configurations (Facility B and K with SCR on),
(v) unwashed and washed gypsum from the same facility (Facilities N and O), and
(vi) unwashed gypsum from four facilities (Facilities N, O, P and Q). This set of 23 CCRs reflects 84 and 74 percent, respectively, of the current and expected future facility configuration types with acid gas scrubbers based on generating capacity, but only a limited number of facilities within each configuration type. Figure 5, Figure 6,
(vii) Figure 7, and Figure 8 diagram the layout of comparisons that will be used in presentation of data for fly ash, gypsum, scrubber sludge, fixated scrubber sludge and fixated scrubber sludge with lime, respectively.
Facility A Coal: low sulfur bituminous APC: NO+SNCR+FF
Facility B Coal: low sulfur bituminousAPC: NO+SCR+ESP(CS) [Mg lime]
Facility K Coal: sub- bituminousAPC: NO+SCR+ESP(CS) [Mg lime]
BFA (SCR On)
DFA (SCR Off)
AFA (SNCR On)
CFA (SNCR Off)
KFA (SCR On)
Figure 5. Fly ash (FA) comparisons (CFA, AFA, DFA, etc refer to sample identification codes; see Table 1). Shorthand is used for when SCR is in use (“on”) or not in use (“off”).
20

Facility N Coal: bituminous APC: FO+ESP(CS)
Facility O Coal: bituminous APC: FO+SCR+ESP(CS)
Gyp-U
OAU (unwashed)
NAU (unwashed)
Gyp-W
OAW (washed)
NAW (washed)
Facility P Coal: bituminousAPC: FO+ SCR & SNCR +ESP(CS)
PAD (U) (unwashed)
QAU (unwashed)
Facility Q Coal: sub-bituminousAPC: FO+SCR+ESP(CS)
Characterization of Coal Cumbustion Residues II
Figure 6. Gypsum (Gyp-U, Gyp-W) comparisons (NAU, NAW, OAU, etc. are sample identification codes; see Table 1).
Errata: Subsequent tables and figures indicate the Facility N has SCR in use. That is not correct. This will be corrected in Report 4 and does not change the leach testing results.
21

Facility A Coal: low sulfur bituminousAPC: NO+SNCR+FF
Facility B Coal: low sulfur bituminousAPC: NO+SCR+ESP(CS) [Mg lime]
BGD (SCR On)
DGD (SCR Off)
AGD (SNCR On)
CGD (SNCR Off)
KGD (SCR On)
Facility K Coal: sub- bituminousAPC: NO+SCR+ESP(CS) [Mg lime]
Characterization of Coal Combustion Residues II
Figure 7. Scrubber sludge (ScS) comparisons (CGD, AGD, DGD, etc. are sample identification codes; see Table 1). Shorthand is used for when SCR is in use (“on”) or not in (“off”).
22

FSS: Fly Ash + Scrubber Sludge (FA+ScS)
Facility A (FSS) Coal: low sulfur bituminousAPC: NO+SNCR+FF
ACC (SNCR On)
CCC (SNCR Off)
FSSL: Fly Ash + Scrubber Sludge + Lime (FA+ScS+lime)
Facility B (FSSL) Coal: low sulfur bituminousAPC: NO+SCR+ESP(CS) [Mg lime]
Facility K (FSSL) Coal: sub-bituminousAPC: NO+SCR+ESP(CS) [Mg lime]
Facility M (FSSL) Coal: bituminous MAD MAS APC: IO+SCR+ESP(CS) (SCR Off) (SCR On)
BCC (SCR On)
DCC (SCR Off)
KCC (SCR On)
Characterization of Coal Cumbustion Residues II
Figure 8. Fixated scrubber sludge (FSS) and fixated scrubber sludge with lime (FSSL) comparisons (DCC, BCC, KCC, etc. are sample identification codes; see Table 1).
23

Characterization of Coal Combustion Residues II
2.1.1. Facilities Using Inhibited or Natural Oxidation of Scrubber Residues (Producing Scrubber Sludge or Fixated Scrubber Sludge)
2.1.1.1. Facility A (Natural Oxidation and SNCR) Facility A is a 440-MW coal-fired power plant with a reverse-air fabric filter followed by a wet FGD system. The unit burns ~1 percent sulfur eastern bituminous coal. The unit operated at nominally full load for the duration of the test program. The unit is equipped with a pulverized-coal boiler and in-furnace selective SNCR; urea was injected into the boiler during the course of operations within the duration of the initial part of this test program. However, urea was not injected into the boiler for the final comparison test (“SNCR off”). Gas exiting the furnace is split between two flues equipped with comparable control equipment. Particulate is removed with a reverse-air fabric filter. Flue gas is then scrubbed through a multiple tower wet FGD unit; FGD is a limestone natural-oxidation design. The two flues are joined prior to exhausting to a common stack. The annular stack rises 308 feet above the top of the incoming flue. The stack is operated in a saturated condition with no reheat. The fly ash and FGD waste are combined and then dewatered before landfill disposal.
Facility A was sampled in September 2003. Three samples were collected in September 2003 when the SCR was operating: one fresh fly ash sample collected from the ash hopper (sample AFA), one scrubber sludge filter cake sample collected after the centrifuge but before mixing with other materials in the pug mill (sample AGD), and one fixated scrubber sludge sample collected after mixing the scrubber sludge with fly ash and magnesium-enhanced lime in the pug mill (sample ACC). Three additional samples were collected from the same locations in February 2004 when the SCR was not in use (samples CFA, CGD and CCC, respectively). Each sample consisted of two 5-gallon pails of the material, and all were collected by plant personnel.
2.1.1.2. Facility B (Natural Oxidation and SCR) Facility B is a 640 MW coal-fired power plant with cold side ESP followed by a wet FGD system with Mg-lime. The unit burns medium to high sulfur eastern bituminous coals. The unit is equipped with a pulverized coal boiler and selective catalytic reduction composed of vanadium pentoxide (V2O5) and tungsten trioxide (WO3), on titanium dioxide (TiO2) supporting matrix. One set of samples was collected during the season of elevated ozone, when ammonia is injected into the ductwork in front of the SCR catalyst, resulting in a flue gas mixture with a concentration of 320 ppm ammonia as it enters the catalyst. Samples were also collected during the winter when ammonia was not being injected (“SCR off”). Particulate is removed with a cold-side ESP. Flue gas is then scrubbed through a wet FGD unit; FGD is an inhibited mag-lime design. The FGD sludge is thickened and then mixed with fly ash and magnesium-enhanced lime before landfill disposal in a clay-lined site. Refer to appendix G for a process flow-diagram for facility A.
Three samples were collected in September, 2003 when the SCR was operating: one give gallon bucket of the fly ash (BFA) from the hoppers, partially dewatered scrubber sludge by centrifuging (BGD), and centrate cake (BCC) or scrubber sludge fixated with fly ash and Mg lime (MgO). Three additional samples were collected from the same locations in February, 2004 when the SCR was not in use (samples DFA, DGD, and DCC, respectively). Each sample consisted of one 5-gallon bucket of the material, and all were collected a Natural Resource Technology contractor to EPRI.
24
Characterization of Coal Cumbustion Residues II
Coal analysis information for facility B was provided by EPRI. Results of the analysis on the medium to high sulfur bituminous coal for sulfur was 3.24% by weight, ash was 12.4%, moisture was 6.1%, heat of combustion was 12,000 BTU/lb, chloride was 615 ug/g, and mercury was 0.08 ug/g.
2.1.1.3. Facility K (Natural Oxidation and SCR) Facility K is two tangentially fired 400 MW coal-fired boilers with cold side ESP followed by a wet flue gas desulfurization system with wet Mg-lime natural oxidation. These units burn medium sulfur eastern bituminous coals from Ohio, Pennsylvania and West Virginia. Flue gas is scrubbed through a common wet FGD unit; FGD is a wet Mg-lime natural oxidation design. FGD sludge is mixed with fly ash and quicklime for stabilization prior to disposal.
Two samples were collected on November 29, 2004: one scrubber sludge filter cake before mixing in the pug mill (sample KGD), and one fixated scrubber sludge collected after mixing the scrubber sludge with fly ash and 2-3% lime in the pugmill (sample KCC). On January 12, 2005, one fly ash sample was collected directly from the ESP before the ash storage silo (sample KFA). Each sample consisted of four 5-gallon pails of the material, and all were collected by plant personnel.
2.1.1.4. Facility M (Inhibited Oxidation and SCR) Facility M is a 1,000+ MW power plant. The plant burns bituminous coal in a dry-bottom pulverizer boiler. Cold-side ESPs are used on all units for particulate control, and wet FGD systems are used to reduce SO2 emissions on two units. The wet FGD systems utilize limestone slurry and an inhibited oxidation process. The FGD sludge, consisting primarily of calcium sulfite, is pumped from the absorber to a thickener. Liquid overflow from the thickener is recycled back into the FGD system, and the thickened sludge is pumped to a series of drum vacuum filters for further dewatering. Water removed by the drum vacuum filters is recycled back into the FGD system, and the filter cake is taken by conveyor belt to a pug mill, where it is mixed with dry fly ash and dry quicklime for stabilization. The resulting scrubber FGD solids are taken by conveyor to a temporary outdoor stockpile, and then transported by truck either to a utilization site or to an on-site landfill. The currently active portion of the landfill is lined and includes leachate collection. An older inactive portion of the landfill is clay-lined but does not have leachate collection.
Three samples were obtained from the Pug Mill Area by the EPRI contractor during the week of March 6, 2006 when the SCR was not operating: fly ash, vacuum drum filter cake, and fixated scrubber sludge with lime (only FSSL was evaluated as part of this study, sample MAD). In each case, the samples were collected daily during the four day sample collection (four daily samples of each), for compositing in the laboratory. All of the samples were collected into clean 5 gallon plastic pails. Excess sample was containerized and discharged back into the appropriate system. The drum filter cake was sampled daily from the conveyor belt leading into the pug mill. Two of the three drum filters were running simultaneously; both were feeding the conveyor belt. The same drums were running each day of sampling. Each 5 gallon bucket was sealed immediately after collection and the lid secured with duct tape. The dry fly ash sample was obtained directly from the day tank via a hose connected to a sampling port. Each 5 gallon bucket was sealed immediately after collection and the lid secured with duct tape. FSS was
25

Characterization of Coal Combustion Residues II
sampled from the conveyor belt on the outlet side of the pug mill on the first, third and fourth days. A clean, short handled spade was used to collect sample from the conveyor belt into a 2 gallon bucket. The sample in the bucket was placed on a clean piece of 3 mm plastic sheeting; then more sample was collected from the conveyor belt into the bucket and added to the sheet until at least 6 gallons of sample was collected. Each sample was homogenized on the sheet using the spade and placed into a 5 gallon bucket, sealed immediately, and the lid secured with duct tape. A similar process was used to collect three more samples the week of May 9 when the SCR was in use (FSSL sample MAS).
2.1.2. Facilities Using Forced Oxidation of Scrubber Residues (Producing FGD Gypsum)
2.1.2.1. Facility N (Forced Oxidation) Facility N is a wall fired 715 MW coal-fired power plant with cold side ESP followed by a wet FGD system with wet limestone forced oxidation. The unit burns medium to high sulfur eastern bituminous coals approximately 3% sulfur. The gypsum is washed, dried and then sold to the wallboard industry.
Facility N was sampled on June 1, 2006. Five gallon buckets of the washed and unwashed gypsum were collected by RMB Consulting & Research Inc. (Raleigh, NC) personnel and provided for analysis.
2.1.2.2. Facility O (Forced Oxidation and SCR) Facility O is a tangentially fired 500 MW coal-fired plant with cold side ESP followed by a wet FGD system with wet limestone forced oxidation. The unit is equipped with a pulverized coal boiler and ammonia based SCR. This unit burns high sulfur eastern bituminous coals. Slurry from the absorber goes to a primary hydrocyclone for initial dewatering. The gypsum (hydrocyclone underflow) is dried on a vacuum belt and washed to remove chlorides, before use in wallboard.
Two samples were collected from the FGD gypsum drying facility by compositing samples collected on June 10, 11, and 12, 2006 when the SCR was operating. On each day, two gallon pails of unwashed gypsum and washed/dried gypsum were collected. The unwashed gypsum was collected from the vacuum belt prior to the chloride spray wash. The washed/dried gypsum was collected from the end of the vacuum belt. The three daily samples were sent to Arcadis for compositing to form sample OAU (unwashed gypsum) and sample OAW (washed gypsum). All samples were collected by plant personnel.
2.1.2.3. Facility P (Forced Oxidation and SCR and SNCR) Facility P is two wall fired 200 MW coal-fired boilers with cold side ESP followed by a wet FGD system with wet limestone forced oxidation. Unit 1 is equipped with SNCR and Unit 2 is equipped with SCR. These units burn medium sulfur eastern bituminous coals. Particulate is removed with a cold-side ESP. Flue gas is then scrubbed through a common wet FGD unit; FGD is a wet limestone forced oxidation design. The gypsum provided was not washed.
Facility P was sampled in October 2006 when both SCR and SNCR were operating and the residues from Unit 1 and Unit 2 were commingled during collection. A five gallon bucket of the washed gypsum was collected by plant personnel.
26

Characterization of Coal Cumbustion Residues II
2.1.2.4. Facility Q (Forced Oxidation and SCR) Facility Q is a 1800 MW coal fired plant with hot side ESP followed by a wet flue gas desulfurization system with wet limestone forced oxidation. This unit burns sub-bituminous coals. Particulate is removed with a hot-side ESP. Flue gas is then scrubbed through a wet FGD unit; FGD is a wet limestone forced oxidation design that includes the addition of dibasic acid to the absorber13. The gypsum provided was not washed and was sampled on Oct. 30, 2006 by an EPRI contractor (Natural Resource Technology). A five gall bucket of the unwashed gypsum was shipped to ARCADIS for analysis on May 4, 2007.
2.2. LEACHING ASSESSMENT PROTOCOLS Laboratory testing for this study focused on leaching as a function of pH and LS ratio as defined by the leaching framework. This test set is considered Tier 2 testing (equilibrium-based) for detailed characterization, which was selected to develop a comprehensive data set of CCR characteristics. Mass transfer rate testing (Tier 3, detailed characterization) may be carried out in the future for specific cases where results from equilibrium-based characterization indicate a need for detailed assessment.
2.2.1. Alkalinity, Solubility and Release as a Function of pH (SR002.1) Alkalinity, solubility and release as a function of pH were determined according to method SR002.1 (Kosson et al., 2002). This protocol consists of 11 parallel extractions of particle size reduced material, at a LS ratio of 10 mL extractant/g dry sample. In this method, particle-size reduction is used to prepare large-grained samples for extraction so that the approach toward liquid-solid equilibrium is enhanced and mass transport through large particles is minimized. For the samples evaluated in this study, minimal size reduction was required. Each extraction condition was carried out in triplicate using 40 g of material for each material evaluated. In addition, three method blanks were included, consisting of the DI water, nitric acid and potassium hydroxide used for extractions. Typical particle size of the tested materials was less than 300 µm using standard sieves according to ASTM E-11-70(1995). An acid or base addition schedule is formulated based on initial screening for eleven extracts with final solution pH values between 3 and 12, through addition of aliquots of nitric acid or potassium hydroxide as needed. The exact schedule is adjusted based on the nature of the material; however, the range of pH values includes the natural pH of the matrix that may extend the pH domain (e.g., for very alkaline or acidic materials). The final LS ratio is 10 mL extractant/g dry sample which includes DI water, the added acid or base, and the amount of moisture that is inherent to the waste matrix as determined by moisture content analysis. The eleven extractions were tumbled in an end-overend fashion at 28 ± 2 rpm for 24 hours followed by filtration separation of the solid phase from the extract using a 0.45 µm polypropylene filter. Each extract then was analyzed for constituents of interest. The acid and base neutralization behavior of the materials is evaluated by plotting the pH of each extract as a function of equivalents of acid or base added per gram of dry solid. Concentration of constituents of interest for each extract is plotted as a function of extract final pH to provide liquid-solid partitioning equilibrium as a function of pH. Initially, the SR002.1 test was carried out in triplicate; however, replication was reduced to two replicates of the test
13 Dibasic acid (DBA) is a commercial mixture of glutaric, succinic, and adipic acids: HOOC(CH2)2-4COOH.
27
Characterization of Coal Combustion Residues II
method for later samples based on good replication and consistency amongst the early results (Sanchez et al., 2006).
2.2.2. Solubility and Release as a Function of LS Ratio (SR003.1) Solubility and release as a function of LS ratio was determined according to method SR003.1 (Kosson et al., 2002). This protocol consists of five parallel batch extractions over a range of LS ratios (i.e., 10, 5, 2, 1, and 0.5 mL/g dry material), using DI water as the extractant with aliquots of material that has been particle size reduced. Typical particle size of the material tested was less than 300 µm. Between 40 and 200 g of material were used for each extraction, based on the desired LS ratio. All extractions are conducted at room temperature (20 ± 2 °C) in leak-proof vessels that are tumbled in an end-over-end fashion at 28 ± 2 rpm for 24 hours. Following gross separation of the solid and liquid phases by centrifuge or settling, leachate pH and conductivity measurements are taken and the phases are separated by pressure filtration using 0.45-µm polypropylene filter membrane. The five leachates are collected, and preserved as appropriate for chemical analysis. Initially, the SR003.1 test was carried out in triplicate; however, replication was reduced to two replicates of the test method for later samples based on good replication and consistency amongst the early results.
2.3. ANALYTICAL METHODS
2.3.1. Surface Area and Pore Size Distribution A Quantachrome Autosorb-1 C-MS chemisorption mass spectrometer was used to perform 5point Brunauer, Emmett, and Teller (BET) method surface area, pore volume, and pore size distribution analysis on each as-received and size-reduced CCR. A 200 mg sample was degassed under vacuum at 200 ºC for at least one hour in the sample preparation manifold prior to analysis with N2 as the analysis gas. Standard materials with known surface area were routinely run as a QC check.
2.3.2. pH and Conductivity pH and conductivity were measured for all aqueous extracts using an Accumet 925 pH/ion meter. The pH of the leachates was measured using a combined pH electrode accurate to 0.1 pH units. A 3-point calibration was performed daily using pH buffer solutions at pH 4.0, 7.0 and 10.0. Conductivity of the leachates was measured using a standard conductivity probe. The conductivity probe was calibrated using appropriate standard conductivity solutions for the conductivity range of concern. Conductivity meters typically are accurate to ± 1% and have a precision of ± 1%.
2.3.3. Moisture Content Moisture content of the “as received” CCRs was determined using American Society for Testing and Materials (ASTM) D 2216-92. This procedure supersedes the method indicated in the version of the leaching procedure published by Kosson et al. (2002).
2.3.4. Carbon Content Organic Carbon/Elemental Carbon Analyzer Organic carbon (OC) and elemental carbon (EC) content of each CCR tested was measured using a Sunset Lab thermal-optical EC/OC analyzer using the thermal/optical method (NIOSH Method 5040). The sample collected on quartz fiber filters is heated under a completely oxygen-free
28

Characterization of Coal Cumbustion Residues II
helium atmosphere in a quartz oven in four increasing temperature steps (375 °C, 540 °C, 670 °C and 870 °C) at 60 second ramp times for the first three temperatures and a ramp time of 90 seconds for the final temperature. The heating process removes all organic carbon on the filter. As the organic compounds are vaporized, they are immediately oxidized to carbon dioxide in an oxidizer oven which follows the sample oven. The flow of helium containing the produced carbon dioxide then flows to a quartz methanator oven where the carbon dioxide is reduced to methane. The methane is then detected by a flame ionization detector (FID). After the sample oven is cooled to 525 ºC, the pure helium eluent is switched to an oxygen/helium mixture in the sample oven. At that time, the sample oven temperature is stepped up to 850 ºC. During this phase, both the original elemental carbon and the residual carbon produced by the pyrolysis of organic compounds during the first phase are oxidized to carbon dioxide due to the presence of oxygen in the eluent. The carbon dioxide is then converted to methane and detected by the FID. After all carbon has been oxidized from the sample, a known volume and concentration of methane is injected into the sample oven. Thus, each sample is calibrated to a known quantity of carbon as a means of checking the operation of the instrument.
The calibration range for these analyses was from 10 to 200 µg/cm2 of carbon using a sucrose solution as the standard. The detection limit of this instrument is approximately 100 ng/cm2 with a linear dynamic range from 100 ng/cm2 to 1 g/cm2.
2.3.5. Dissolved Inorganic Carbon (DIC) and Dissolved Organic Carbon (DOC) Analyses of total organic carbon and inorganic carbon were performed on a Shimadzu model TOC-V CPH/CPN. Five-point calibration curves, for both dissolved inorganic carbon (DIC) and non-purgeable dissolved organic carbon (DOC) analyses, were generated for an analytical range between 5 ppm and 100 ppm and are accepted with a correlation coefficient of at least 0.995. An analytical blank and check standard at approximately 10 ppm were run every 10 samples. The standard was required to be within 15% of the specified value. A volume of approximately 16 mL of undiluted sample is loaded for analysis. DIC analysis is performed first for the analytical blank and standard and then the samples. DOC analysis is carried out separately after completion of DIC analysis. DOC analysis begins with addition of 2 M (mole/L) of hydrochloric acid to achieve a pH of 2 along with a sparge gas flow rate of 50 mL/min to purge inorganic carbon prior to analysis. Method detection limit (MDL) and minimum level of quantification (ML) are shown in Table 5.
Table 5. MDL and ML of analysis of DIC and DOC.
MDL (µg/L) ML (µg/L)
DIC 70 200
DOC 90 200
2.3.6. Mercury (CVAA, Method 3052, and Method 7473) Liquid samples were preserved for mercury analysis by additions of nitric acid and potassium permanganate and then prepared prior to analysis according to the following method. For each 87 mL of sample, 3 mL of concentrated nitric acid and 5 mL of 5 wt% aqueous potassium permanganate solution were added prior to storage. Immediately before cold vapor atomic absorption (CVAA) analysis, 5 mL of hydroxylamine were added to clear the sample and then the sample was digested according to ASTM Method D6784-02 (Ontario Hydro) as described for
29

Characterization of Coal Combustion Residues II
the permanganate fraction (ASTM, 2002). On completion of the digestion, the sample was analyzed for mercury by CVAA. Samples with known additions of mercury for matrix analytical spikes also were digested as described above prior to CVAA analysis.
Sample preparation of the solids and filters was carried out by HF/HNO3 microwave digestion according to Method 3052 (EPA, 1996) followed by CVAA analysis as indicated above. No additional preservation or digestion was carried out prior to CVAA analysis.
Mercury analysis of each digest, extract and leachate was carried out by CVAA according to EPA SW846 Method 7470A “Mercury in Liquid Waste (Manual Cold Vapor Technique)” (EPA, 1998a). A Perkin Elmer FIMS 100 Flow Injection Mercury System was used for this analysis. The instrument was calibrated with known standards ranging from 0.025 to 1 μg/L mercury.
Solids also were analyzed by Method 7473 “Mercury in Solids and Solutions by Thermal Decomposition, Amalgamation, and Atomic Absorption Spectrophotometry” (EPA, 1998b). A Nippon MD-1 mercury system was used for this analysis. The instrument was calibrated with known standards ranging from 1 to 20 ng of mercury. The method detection limit for mercury in solids is 0.145 µg/kg.
2.3.7. Other Metals (ICP-MS, Method 3052, and Method 6020) Liquid samples for ICP-MS analysis were preserved through addition of 3 mL of concentrated nitric acid (trace metal grade) per 97 mL of sample. Known quantities of each analyte were also added to sample aliquots for analytical matrix spikes. Solid samples were digested by EPA Method 3052 (EPA, 1996) prior to ICP-MS analysis.
2.3.7.1. ICP-MS Analysis ICP-MS analyses of aqueous samples from laboratory leaching tests were carried out at Vanderbilt University (Department of Civil and Environmental Engineering) using a Perkin Elmer model ELAN DRC II in both standard and dynamic reaction chamber (DRC) modes. Standard analysis mode was used for all analytes except for As and Se, which were run in DRC mode with 0.5 mL/min of oxygen as the reaction gas. Seven-point standard curves were used for an analytical range between approximately 0.5 µg/L and 500 µg/L and completed before each analysis. Analytical blanks and analytical check standards at approximately 50 µg/L were run every 10 samples and required to be within 15% of the specified value. Samples for analysis were diluted gravimetrically to within the targeted analytical range using 1% v/v Optima grade nitric acid (Fisher Scientific). Initially, analyses for 10:1 dilutions were performed to minimize total dissolved loading to the instrument. Additional dilutions at 100:1 and 1000:1 were analyzed if the calibration range was exceeded with the 10:1 dilution. 50 µL of a 10 mg/L internal standard consisting of indium (In) (for mass range below 150) and holmium (Ho) (for mass range over 150) was added to 10 mL of sample aliquot prior to analysis. Analytical matrix spikes were completed for one of each of the replicate extracts from SR002.1. For each analytical matrix spike, a volume between 10 µL and 100 µL of a 10 mg/L standard solution was added to 10 mL of sample aliquot. Table 6 provides the element analyzed, method detection limit (MDL) and minimum level of quantification (ML). Analyte concentrations measured that are less than the ML and greater than the MDL are reported as estimated value using the instrument response. The values reflect the initial 10:1 dilution used for samples from laboratory leaching tests.
30
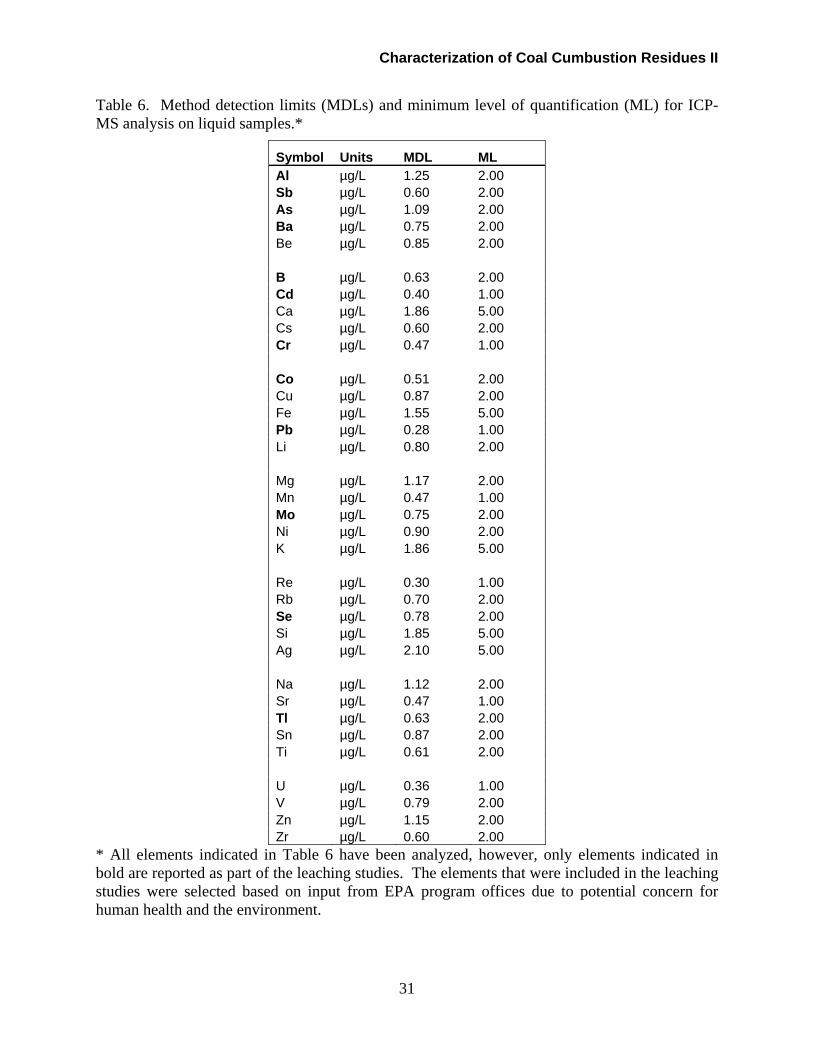
Characterization of Coal Cumbustion Residues II
Table 6. Method detection limits (MDLs) and minimum level of quantification (ML) for ICPMS analysis on liquid samples.*
Symbol Units MDL ML Al µg/L 1.25 2.00 Sb µg/L 0.60 2.00 As µg/L 1.09 2.00 Ba µg/L 0.75 2.00 Be µg/L 0.85 2.00
B µg/L 0.63 2.00 Cd µg/L 0.40 1.00 Ca µg/L 1.86 5.00 Cs µg/L 0.60 2.00 Cr µg/L 0.47 1.00
Co µg/L 0.51 2.00 Cu µg/L 0.87 2.00 Fe µg/L 1.55 5.00 Pb µg/L 0.28 1.00 Li µg/L 0.80 2.00
Mg µg/L 1.17 2.00 Mn µg/L 0.47 1.00 Mo µg/L 0.75 2.00 Ni µg/L 0.90 2.00 K µg/L 1.86 5.00
Re µg/L 0.30 1.00 Rb µg/L 0.70 2.00 Se µg/L 0.78 2.00 Si µg/L 1.85 5.00 Ag µg/L 2.10 5.00
Na µg/L 1.12 2.00 Sr µg/L 0.47 1.00 Tl µg/L 0.63 2.00 Sn µg/L 0.87 2.00 Ti µg/L 0.61 2.00
U µg/L 0.36 1.00 V µg/L 0.79 2.00 Zn µg/L 1.15 2.00 Zr µg/L 0.60 2.00
* All elements indicated in Table 6 have been analyzed, however, only elements indicated in bold are reported as part of the leaching studies. The elements that were included in the leaching studies were selected based on input from EPA program offices due to potential concern for human health and the environment.
31

Characterization of Coal Combustion Residues II
2.3.8. X-Ray Fluorescence (XRF) XRF analysis was performed on each CCR to provide additional information on each CCR total elemental composition. For each CCR two pellets were prepared as follows. 3000 mg of material was weighed and mixed with 1.5 mL (100 mg dry solids) of liquid binder to give a 32 mm diameter pellet weighing 3150 mg with a material-to-diluent ratio of 0.05. For high carbon content samples 3.0 ml (100 mg dry solids) of liquid binder was used to give a 32 mm diameter pellet weighing 3300 mg with a material to diluent ratio of 0.1. XRF intensities were collected on each side of each pellet using Philips SuperQ data collection software and evaluated using Omega Data System’s UniQuant 4 XRF “standardless” data analysis software. The UQ/Fly ash calibration was used to analyze the samples. The pellets were evaluated as oxides. Known fly ash Standard Reference Materials (SRMs) were also run to assess the accuracy of the analysis. This information is useful in supplementing CVAA and ICP results.
2.3.9. MDL and ML for Analytical Results The MDL is defined by 40 CFR Part 136, Appendix B, July 1, 1995, Revision 1.11 as “the minimum concentration of a substance that can be measured and reported with 99% confidence that the analyte concentration is greater than zero and is determined from analysis of a sample in a given matrix containing the analyte.”
The MDL was determined statistically from data generated by the analysis of seven or more aliquots of a spiked reagent matrix14 and verified by the analysis of calibration standards near the calculated MDL according to EPA (2003). The MDL then was determined by multiplying the standard deviation of the replicate measurements by the appropriate Students t value for a 99% confidence level (two tailed) and n-1 (six) degrees of freedom and also multiplying by the minimum dilution factor required for matrix preservation and analysis.
The ML is defined by 40 CFR Part 136, 1994 as “the lowest level at which the entire analytical system must give a recognizable signal and acceptable calibration point for the analyte.” According to EPA (2003), the ML is intended to be the nearest integer value (i.e., 1, 2 or 5x10n, where n is an integer) to 10 times the standard deviation observed for determination of the MDL. This value is also multiplied by the minimum dilution factor required for preservation and analysis of the sample matrix to obtain the ML reported here.
Mercury, as measured by CVAA, required modification of the calculation of the MDL and ML because very consistent replication resulted in calculation of a MDL lower than the instrument detection limit. For this case, the standard deviation of seven replicate analyses of 0.025 µg/L was 0.00069. Therefore, the MDL was set equal to the instrument detection limit of 0.001 µg/L times the minimum dilution factor from sample preparation (3.59) to result in an MDL of 0.0036 µg/L. The ML was set to 10 times the instrument detection limit and rounded to the nearest integer value as above. The resulting ML was 0.01 µg/L.
14 Establishing spikes in an actual leaching extract matrix is not possible because the sample being extracted dictates the matrix composition by virtue of the constituents that partition into the resulting aqueous extract, which varies by test position and material being tested. However, the extract aliquots are diluted at least 10:1 with 1% nitric acid (prepared from Optima grade nitric acid, Fisher Scientific), and the COPCs are dilute in the resulting analytical sample. Therefore, the 1% nitric acid solution was used as the matrix for MDL and ML determinations.
32

Characterization of Coal Cumbustion Residues II
2.4. QUALITY ASSURANCE ASSESSMENT
2.4.1. Homogenization of Individual CCR Samples and Aliquots for Analyses To ensure sample homogeneity the fly ashes were mixed using a Morse single can tumbler model 1-305 as described in Sanchez et al. (2006). Scrubber sludges that were flowable slurries were mixed using a paddle mixer. Gypsum and fixated scrubber sludge samples were mixed by repetitively coning 15 and quartering while passing through a mesh screen. After mixing, ten Subsamples were taken from FSSL sample MAD and analyzed by XRF to evaluate the homogeneity of the resultant material; Figure 9 presents the coefficient of variation for the XRF results. These results indicate that total content variability for primary and most trace constituents is less than 20% for this set of samples.
0
5
10
15
20
25
30
35
40
C.V. (%)
K P S V Y
F Si Ti Al Cl Ni Sr Zr
As Br Cr Fe La Sc Se W ZnBa Ca Cd Ce Co Cu Ga Ge Na Nb
Pb Rb
Mg Mn Mo
Fac. M, SCR off, FSSL (MAD)
Figure 9. Coefficient of variation (C.V.) from XRF elemental analysis of 10 subsamples of FSSL sample MAD after mixing by coning and quartering.
2.4.2. Leaching Test Methods and Analytical QA/QC One of the requirements of this project was to establish a QA/QC framework for the leaching assessment approach developed by Kosson et al. (2002). The developed QA/QC framework incorporates the use of blanks, spiked samples, and replicates. Appendix A provides the complete Quality Assurance Project Plan, as updated for this phase of the study. For each designated leaching test condition (i.e., acid or base addition to establish end-point pH values and LS value), triplicate leaching test extractions were completed (i.e., three separate aliquots of CCR were each extracted at the designated test condition) for early samples, while duplicate extractions were used after evaluation of initial results. The three types of method blanks were the deionized water case, the most concentrated nitric acid addition case, and the most
15 "Coning and quartering" is a term used to describe how the material is mixed. The approach is to pass the material through a screen so that a "cone" forms in the collection container. Then the cone is bisected twice into quarters (quarter sections of the cone) and each section then is passed sequentially through the screen again to form a new cone. This sequence is repeated several times to achieve desired mixing.
33

Characterization of Coal Combustion Residues II
concentrated potassium hydroxide addition case. Each method blank was carried through the entire protocol, including tumbling and filtration, except an aliquot of CCR was not added.
During analysis for mercury and elemental species by ICP-MS, analytical spikes for the constituents of interest were carried out for one replicate of each test case to assess analytical recoveries over the complete range of pH and liquid matrix conditions. Multipoint calibration curves using at least seven standards and an initial calibration verification (ICV) using a standard obtained from a different source than the calibration standards were completed daily or after every 50 samples, whichever was more frequent. In addition, instrument blanks and continuing calibration verification (CCV) standards were analyzed after every 10 analytical samples and required to be within 10 percent of the expected value. Samples are rerun if they are not within 10 percent of the expected value. CCV standards and instrument blanks also were run at the end of each batch of samples.
For both ICP-MS and CVAA analyses, each sample was analyzed along with a matrix spike, which is an aliquot of the sample plus a known spike concentration of the element of interest. The “spike recovery” was required to be within 80 – 120% of the expected value for an acceptable analytical result.
2.4.3. Improving QA/QC efficiency Throughout the study, the approach to QA/QC was regularly reviewed to seek out opportunities for increased evaluation efficiency without unacceptable degradation of precision or accuracy in results. Based on evaluation of results from the first several facilities (Sanchez et al, 2006), the number of replicates for Method SR002.1 (solubility as a function of pH) and Method SR003.1 (solubility as a function of liquid/solid ratio) was reduced from three to two. Results from this study (Sanchez et al., 2006 and this report) show that the precision between duplicate analyses is acceptable and that the triplicate set does not significantly increase the quality of the data set. This finding follows from recognition that (i) the data sets generated by Method SR002.1 and SR003.1 must provide both consistency between replicate extractions and analyses, and internal consistency between results at different pH and LS ratio, and (ii) precision is controlled primarily by the degree of homogeneity of the CCR under evaluation and representative sub-sampling, rather than by the intrinsic variability of the leaching test methods. There were a total of 11,743 observations for the 14 parameters evaluated in detail in this report (pH and 13 constituents of interest). Review of the resulting data sets indicated 15 outlier pH values of 846 measurements16
and an additional 19 outliers out of 10,897 measurements of specific constituents. Thus, the overall error rate was less than 2%. Implementation of a reduction in the number of replicates has greatly improved laboratory efficiency without compromising data quality.
Data were screened for outliers based on comparison of individual data points (i) relative to replicate extractions (i.e., parallel extractions of aliquots of the same material under the same extraction conditions), and (ii) relative to the other data points in the extraction series (i.e., parallel extractions of aliquots of the same material at different pH (SR02) and LS conditions
16 When a pH measurement is determined to be an outlier, then all constituent measurements associated with the particular extract sample are also considered outliers because they would be incorrectly evaluated as release as a function of pH. This resulted in excluding (15)×(13)=195 individual constituent measurements.
34
Characterization of Coal Cumbustion Residues II
(SR03)) because of the expected systematic response behavior. The pH was considered an outlier when the final pH of the extract deviated from the other replicates by more than 0.5 pH units and corresponding constituent analyses did not follow systematic behavior indicated by other extracts across multiple constituents. Individual constituents were considered outliers when results of constituent analyses deviated from the systematic behavior indicated by results in the extraction series (as a function of pH or as a function of LS) by more than one-half to one order of magnitude. Results were screened through inspection of the appropriately plotted results.
Data quality indicators (DQIs) were measured for all parameters continuously during the leaching experiments and during analytical tasks. Chemical (ICP, CVAA, XRF, IC, EC/OC) and physical (surface area, pore size distribution and density) characterization data were reduced and reports were generated automatically by the instrument software. The primary analyst reviewed 100% of the report data for completeness to ensure that quality control checks met established criteria. Sample analysis was repeated for any results not meeting acceptance criteria. A secondary review was performed by the Inorganic Laboratory Manager to validate the analytical report. A data quality report for the CCR leach testing results will be provided in the fourth and final report of this research. The data quality report will cover the leach test results documented in Report 1 (Sanchez et al., 2006), Report 2 (this report), and a third report (in preparation). The fourth report summarizes the data from the first three reports and provides probabilistic assessment of the potential release rates of mercury and other metals based on plausible management practices.
2.5. INTERPRETATION AND PRESENTATION OF LABORATORY LEACHING DATA Complete laboratory leaching results for each CCR type and test method are presented in Appendices D and E. Appendix D presents results for Solubility and Release as a Function of pH (SR002.1). Appendix E presents results for Solubility and Release as a Function of LS ratio (SR003.1). Results are organized by CCR type (fly ash, gypsum, scrubber sludge, fixated scrubber sludge), with pH results followed by mercury and then other constituents of interest (aluminum, antimony, arsenic, barium, boron, cadmium, chromium, cobalt, lead, molybdenum, selenium and thallium). For SR002.1, pH results are a titration curve of pH as a function of milliequivalents of acid or base, with acid additions considered positive (+) and base additions considered negative (-). For SR003.1, pH results are a curve of pH as a function of LS ratio.
For Solubility and Release as a Function of pH (SR002.1), results for each CCR type are grouped as described in Figure 5 through Figure 8. Results are presented as extract concentrations as a function of pH. The “natural” pH17 of the system is indicated as a vertical line to the average pH and a horizontal line to the y-axis indicating the corresponding extract concentration. Included with each figure are horizontal lines at the drinking water maximum concentration level (MCL) or drinking water equivalent level (DWEL)18, and analytical limits (ML and MDL) to provide a frame of reference for the results. Also included with each figure are the 5 and 95 percentile for pH (vertical lines) from field observations of leachate from landfills and surface impoundments
17 “Natural pH” or “own pH” of a material refers to the equilibrium pH when the material is placed in deionized water at a ratio of 10 g CCR per 100 mL of water. 18 MCL and DWEL values used are as reported in (EPA, 2006).
35

Characterization of Coal Combustion Residues II
for combustion residues (see Section 2.5.1). An annotated example of the results is provided as Figure 10.
For Solubility and Release as a Function of LS ratio (SR003.1), results are presented as extract concentrations as a function of LS ratio. Also indicated are the relevant MCL, ML and MDL or DWEL.
2.5.1. Interpretation of Mechanisms Controlling Constituent Leaching Constituent (e.g., mercury, arsenic, and selenium) concentrations observed in laboratory leach test extracts and in field leachate samples may be the result of several mechanisms and factors. The discussion presented here focuses on constituent leaching and source term modeling approaches. Source term is defined here as the flux or amount of constituent released from the waste or secondary material (e.g., CCRs). Factors controlling constituent release and transport in and within the near field of the CCRs are often distinctly different from the factors and mechanisms which are important for subsequent vadose zone or groundwater transport outside of the near field area.
In general, constituents are present in the waste or secondary material either as adsorbed species, co-precipitated as amorphous or crystalline solid phases, or incorporated as trace components in solid phases. If chemical equilibrium conditions are approached (as is the approximate case for the laboratory and field sample conditions discussed in this report), then the functional behavior of the aqueous solution concentration reflects the nature of the constituent species in the waste or secondary material, the presence of any co-constituents in the aqueous phase influencing aqueous solution speciation (e.g., effects of high ionic strength, chelating or complexing constituents), and the presence of species in the solution that may compete for adsorption sites if adsorption is the controlling solid phase mechanism. If the constituent is present in the waste or secondary material as an adsorbed species, many different adsorption/desorption characteristic patterns are possible (Ruthven, 1984; Duong, 1998).
The simplest case is when the constituent of interest is present at very low concentration in the waste or secondary material, relatively weakly adsorbed, and the presence of complexing and, or, competing species in solution is at a constant concentration. For this case, leaching test results will indicate a constant concentration as a function of pH at a fixed LS ratio, and linearly increasing concentration as LS ratio decreases at constant pH. This case is represented mathematically as a linear equilibrium partitioning function, where the critical constant of proportionality is the partitioning coefficient, commonly known as Kd. Linear partitioning and use of Kd values is a common approach for mathematically modeling contaminant transport at low contaminant concentrations in soils. Assumption of linear partitioning is a valid and useful approach when the necessary conditions (discussed above) are fulfilled19.
For mercury adsorbed on activated carbon or char particles in fly ash, a complex combination of adsorption mechanisms is indicated. During laboratory leaching tests, mercury concentrations in the leaching test extracts are relatively constant over the pH range and LS ratio of interest, and
19 Often specific Kd values are a function of pH because of competition for adsorption sites by hydrogen ions. However, often a single Kd or range of Kd values are used in contaminant fate and transport models, without specific relationship between pH and Kd which can result in misrepresentation of actual contaminant behavior.
36

MDLML
10.3
46.8
MCL
0.1
1
10
100
1000
10000
2 4 6 8 10 12 14
As
[µg/
L]
pH
SR2 DFA A SR2 DFA - B
SR2 DFA C
SR2-DFA-A
SR2=SR002.1Sample name
Replicate A
Characterization of Coal Cumbustion Residues II
independent of total mercury content in the CCR. In addition, the total mercury content in the CCR is very low. These results are indicative of adsorption phenomena where, in the adsorbed state, interactions between adsorbed mercury species are stronger (thermodynamically) than the interactions between the adsorbed mercury species and carbon surface20. This observation has been supported by the observation of mercury dimer formation during sorption (Munro et al, 2001) and the occurrence of chemisorption as the dominant adsorption mechanism at temperatures above 75 ºC (consistent with conditions in air pollution control devices; Vidic, 2002). In other studies, this phenomenon has been observed as the formation of molecular clusters on the adsorbent surface (Ruthven, 1984; Duong, 1998; Rudzinski et al., 1997). For this case, use of a Kd approach would underestimate release because desorption is best represented as a constant aqueous concentration until depletion occurs.
A third case is encountered when the constituent of interest is present in the waste or secondary material (e.g., CCR) as a primary or trace constituent in either an amorphous or crystalline solid phase and there may be complexing or chelating co-constituents in the aqueous phase. Observed aqueous concentrations are a non-linear function of pH and LS ratio, and reflect aqueous saturation with respect to the species of interest under the given conditions (pH, co-constituents). For these cases, an approximation of field conditions can be made empirically based on laboratory testing and observed saturation over the relevant domain (as applied in this report) or geochemical speciation modeling coupled with mass transfer modeling can be used to assess release under specific field scenarios (the subject of a future report). Use of a Kd approach would not be appropriate for these cases because constituent concentrations will remain relatively constant at a given pH until the controlling solid phase is depleted and control is shifted to a new solid phase or mechanism.
- -
-
95th %tile for field pH 5th %tile for field pH
Own pH
Concentration at own pH
MCL
MDL
ML
20 For this case, the first mercury molecule is adsorbed more weakly than subsequent mercury molecules because the adsorbed mercury-mercury interaction is stronger than the adsorbed mercury-carbon surface interaction [see Sanchez et al. (2006) for further discussion].
37
Figure 10. An example of extract concentrations as a function of pH from SR002.1.
Characterization of Coal Combustion Residues II
38
2.6. FIELD pH PROBABILITY DISTRIBUTION A probability distribution of field leachate pH values from coal combustion waste landfills was derived, as described below, from the set of field pH observations included in the EPA Risk Report (EPA, 2007). The pH probability distribution used in this report considers additional data beyond the pH probability distribution used in Report 1 (Sanchez et al, 2006), which was based solely on relevant data from the EPA Office of Solid Waste database (EPA, 2000) and included 158 observations from six CCR disposal facilities. The data set developed for the EPA Risk Report included (i) observations from the comprehensive database of landfill leachate characteristics developed by the EPA’s Office of Solid Waste (EPA, 2000), (ii) field observations from literature, primarily from EPRI reports, (iii) additional data reported to EPA, and (vi) pH observations from laboratory leaching tests. Only pH measurements from field samples (i.e., leachate, pore water) were selected for use in development of the resulting pH probability distribution. The resulting data set included 580 observations from 42 CCR landfill disposal facilities and was highly unbalanced, with some sites having only a few (e.g., less than five) observations and some sites having many observations (e.g., greater than 20). To prevent the unbalanced data from skewing the resulting probability distribution, the minimum, 25th, 50th, 75th percentile, and maximum values of observations for each individual facility were compiled into a single data set. For facilities with fewer than five observations, all observations for that facility were included. This data set then served as the basis for fitting a statistical distribution function. For each data set, different distribution functions were used to fit the data and the one providing the best data fit based on the chi-square test was selected. The resulting field pH probability distribution was truncated and normalized to the pH range of the field data.
The resulting pH probability distribution developed in this report is compared in Figure 11 and Table 7 to the pH probability distribution used in Report 1. The new pH probability distribution reflects a similar range of pH, but has a more alkaline median value, and in general, has greater weighting in the pH range between 8 and 12. The probability distribution used in this report is considered more representative than what was used in Report 1 because of a larger dataset using results from recent studies by EPA and EPRI. (EPA, 2006; EPRI, 2006)
Field pH observations were also evaluated for surface impoundments receiving CCRs from coal combustion facilities with FGD scrubbers in use. Pore water pH values measured in samples obtained from within the settled CCRs were selected from the EPRI database. Resulting pH observations were across the same range as the landfill field pH observations, but were insufficient to develop an independent pH probability distribution. Therefore, the same pH probability distribution was used for landfill and surface impoundment facilities in this report.

Characterization of Coal Cumbustion Residues II
39
0
0.2
0.4
0.6
0.8
1
2 3 4 5 6 7 8 9 10 11 12 13 pH
Pro
babi
lity
EPA leach 2000Fitted distribution (LogLogistic, (1))EPA Risk database & EPA leach 2000Fitted distribution (BetaGeneral, (2))
(1)
(2)
DistributionsLogLogistic(4.7386, 2.9538, 3.4815)BetaGeneral(9.0369, 1.5076, -7.4214, 12.814)
pH Field dataFitted distribution Simulated
Min 2.75 -7.42 2.765th percentile 5.40 5.84 5.8550th percentile 10.53 10.38 10.2490th percentile 12.20 12.18 11.9495th percentile 12.40 12.43 12.43Max 12.80 12.81 12.43
Figure 11. Probability distributions for field pH used in Report 1 (LogLogistic) and this report (BetaGeneral). Summary statistics for the field data and the probability distribution used in this report (BetaGeneral) are provided to the right of the graph..
Table 7. Comparison of summary statistics for field pH data and pH probability distributions used in Report 1 and this report.
Field Data DistributionEstimates
Used in Release
Report 1 This Report Report 1 This Report
Minimum 5.40 2.75 4.92 2.76
5th percentile 5.80 5.40 5.97 5.85
50th percentile 7.70 10.53 7.63 10.24
90th percentile NR 12.20 NR 11.94
95th percentile 12.09 12.40 10.63 12.43
Maximum 12.80 12.80 12.50 12.43
NR=not reported.
2.7. ESTIMATED LEACHATE CONCENTRATION AS A FUNCTION OF pH
For each CCR tested, results from SR002.1 (Alkalinity, Solubility and Release as a Function of pH) were used to develop an empirical functional relationship between solution pH and expected concentration for each constituent of interest. For each constituent within each CCR case, a polynomial function was regressed to the results from SR002.1 (Alkalinity, Solubility and

Characterization of Coal Combustion Residues II
40
Release as a Function of pH) to provide the expected leachate concentration as a function of solution pH. Up to a fifth order polynomial was used for the regression. An example of a regression fit and corresponding equation for solubility and release as a function of pH is presented in Figure 12. The coefficients provided in the table reflect the order of the polynomial used. For all cases, the lowest order polynomial possible based on the R-square (no further increase for higher order) was used. Also included with each figure of regression fit is the 5th and 95th percentile for pH (vertical line) from field observations of leachate from landfills and surface impoundments for combustion residues. Regression fit results are provided in Appendix F for each case examined (i.e., for each constituent in each CCR tested). Antimony
log (µg/L) Number of points
pH range of validity
0.0000 pH5 33 2.2-12.40.0008 pH4
-0.0399 pH3
0.5519 pH2
-2.7978 pH6.031866 pH0
0.97 R2
5% 95%0.001
0.010.1
110
1001000
10000100000
2 4 6 8 10 12 14pH
Sb [µ
g/L]
SR2-DFA - A SR2-DFA - BSR2-DFA - C Fit curve
Figure 12. Example of regression fit and corresponding coefficients for a 5th order polynomial equation used to represent solubility and release as a function of pH (antimony for fly ash from Facility B with SCR bypassed (DFA)).

Characterization of Coal Cumbustion Residues II
3. RESULTS AND DISCUSSION
The EPA Risk Report (EPA, 2007) identified the following COPCs based on the potential for either human health or ecological impacts using a screening risk assessment: aluminum (Al), arsenic (As), antimony (Sb), barium (Ba), boron (B), cadmium (Cd), cobalt (Co), chromium (Cr), lead (Pb), mercury (Hg), molybdenum (Mo), selenium (Se), and thallium (Tl).21 Thus, the evaluation provided here focuses on the same thirteen constituents and can be used in future risk and environmental assessments.
3.1. TOTAL ELEMENTAL CONTENT BY DIGESTION Total elemental compositions using digestion22, on a dry weight basis, for COPCs for the CCRs evaluated are compared by constituent in Figures 13 through 24; tabular results are provided in Appendix B. Boron was not analyzed because it is used in the digestion process and therefore analysis would not yield meaningful results.
Mercury. Mercury content exhibited a similar range (0.01 to 1.0 μg/g) for all CCR types. Use of SNCR (Facility A) resulted in increased mercury content in the fly ash and decreased mercury content in the scrubber sludge, compared to when the SNCR was not in use. In contrast, use of SCR (Facility B) resulted in decreased mercury content in the fly ash and increased mercury content in the scrubber sludge, compared to when the SCR was bypassed. For all three comparative cases (Facilities A, B and M) use of the NOx control increased the total mercury content in the fixated scrubber sludge. Mercury content in gypsum was significantly lower in the washed gypsum than in the unwashed gypsum for comparative cases (Facilities N and O).
Aluminum. Aluminum content was approximately an order of magnitude greater in the fly ash samples than in the scrubber sludge samples from facilities without SCR and than in gypsum samples with and without SCR. Facilities with SCR operating (samples BGD, KGD) had greater aluminum content in scrubber sludge than the other scrubber sludges, likely because of the addition of aluminum with the SCR catalyst. Fixated scrubber sludge samples had intermediate Al content, reflective of the blending of fly ash with scrubber sludge.
Antimony. Antimony content ranged over similar levels for fly ash, scrubber sludge and fixated scrubber sludge; gypsum had lower antimony content except for the sample from Facility Q. Samples from both Facilities K and Q had greater antimony content than comparative FGD residues from other facilities (scrubber sludges and fixated scrubber sludges for Facility K, gypsum for Facility Q) perhaps as a consequence of greater antimony content in sub-bituminous coal burned by these facilities than bituminous coal burned by the other facilities. The SNCR samples had higher antimony contents in the fly ash, scrubber sludge and fixated scrubber sludge for Facility A than the samples collected with SNCR off. The SCR samples had higher antimony contents in the fly ash from Facility B and the fixated scrubber sludges from Facilities A, B and
21 The database used in the EPA Risk Report (EPA, 2007) for the assessment was based on both measurements of field samples (e.g., leachate, pore water) and single point laboratory leaching tests (e.g., TCLP, SPLP). The database was sparse with respect to measurements of field samples for many constituents. 22 Digestion Method 3052 and ICP-MS analysis by Method 6020; see Section 2.3.7.
41
Characterization of Coal Combustion Residues II
M, although the reason for the high level of antimony in sample BCC cannot be explained by the relative antimony content in samples BFA and BGD.
Arsenic. Gypsum had very low arsenic content (<5 µg/g) compared to the other residue types. Arsenic content in scrubber sludge was significantly less than in fly ash for residue from the same facility. Use of NOx controls resulted in decreased arsenic content in the fly ash, increased content in the scrubber sludge (Facilities A and B) and decreased content in the fixated scrubber sludge (Facilities A, B and M; reflecting the relative contributions of fly ash and scrubber sludge in fixated scrubber sludge) for comparative samples.
Barium. Barium content was similar in scrubber sludge and gypsum for all facilities except for sample BGD (unexplained), and lower than barium content in fly ash by approximately an order of magnitude. The relatively low barium content in unwashed gypsum from Facility O is also unexplained.
Cadmium. Cadmium content was low in the gypsum (<0.69 ng/g) and scrubber sludges (<1.72 ug/g) and generally total content of the gypsum was half that in fly ash (<1.51 ng/g). The greater cadmium content in sample BGD relative to sample DGD may be a consequence of the use of post-combustion NOx control using SCR.
Chromium. Chromium content in gypsum (< 19.3 ng/g) and scrubber sludges (< 139 ng/g) was low and approximately an order of magnitude less than in fly ash samples (<194). Scrubber sludge samples without SCR in operation also had chromium content similar to that of gypsum. Scrubber sludge samples without SCR in use also had chromium content similar to that of gypsum. Elevated chromium content in scrubber sludge samples BGD and KGD may be associated with the use of post-combustion NOx control using SCR.
Cobalt. Cobalt content in gypsum was low and approximately an order of magnitude less than in fly ash samples. Scrubber sludge samples without SCR in operation also had cobalt content similar to that of gypsum. Elevated cobalt content in scrubber sludge samples BGD and KGD may be associated with SCR catalyst addition. The relatively low cobalt content in fixated scrubber sludge samples BCC and KCC relative to corresponding fly ash and scrubber sludge samples is unexplained.
Lead. Lead content in gypsum was low and less than one third of the lead content in fly ash samples. Scrubber sludge samples without SCR in operation also had lead content similar to that of gypsum. The relatively low lead content in fixated scrubber sludge samples BCC and KCC in relationship to corresponding fly ash and scrubber sludge samples is unexplained.
Molybdenum. A similar range in molybdenum content was found in fly ash, scrubber sludge and fixated scrubber sludge samples, with lower content by approximately one third in gypsum samples, with the exception of gypsum sample QAU.
Selenium. All samples were less than 5 µg/g, except for samples for fly ash and fixated scrubber sludge from Facility A and unwashed gypsum from Facilities P and Q. The upper bound for these samples was less than 30 µg/g.
Thallium. All gypsum samples had thallium content less than 3 µg/g. Fly ash, scrubber sludge, and fixated scrubber sludge samples all had a similar range of thallium content between 2 and 5 µg/g, except scrubber sludge and fixated scrubber sludge from Facility B with SCR and fly ash and fixated scrubber sludge from Facility K. Both of these observations of greater thallium content (between 5 and 13 µg/g) may result from the SCR catalyst addition.
42

Characterization of Coal Cumbustion Residues II
43
0.001
0.01
0.1
1
Fac. A (CFA) ‐
Fac. A (A
FA) +
Fac. B (D
FA) ‐
Fac. B (B
FA) +
Fac. K (KFA
) +
Fac. A (CGD) ‐
Fac. A (A
GD) +
Fac. B (D
GD) ‐
Fac. B (B
GD) +
Fac. K (KGD) +
Fac. N (N
AU) +U
Fac. N (N
AW) +
W
Fac. O (O
AU) +U
Fac. O (O
AW) +
W
Fac. P (PAD) +
U
Fac. Q (Q
AU) +
U
Fac. A (CCC
) ‐
Fac. A (A
CC) +
Fac. B (D
CC) ‐
Fac. B (B
CC) +
Fac. K (KCC
) +
Fac. M
(MAD) ‐
Fac. M
(MAS) +
µg/g
Mercury (Hg)
I. Ox.Nat.Ox. ForcedOx. Nat.Ox.Nat.Ox.
Fly Ash | ScrubberSludge | Gypsum | FixatedScrubber Sludge
100
1,000
10,000
100,000
1,000,000
Fac. A (CFA) ‐
Fac. A (A
FA) +
Fac. B (D
FA) ‐
Fac. B (B
FA) +
Fac. K (KFA
) +
Fac. A (CGD) ‐
Fac. A (A
GD) +
Fac. B (D
GD) ‐
Fac. B (B
GD) +
Fac. K (KGD) +
Fac. N (N
AU) +U
Fac. N (N
AW) +
WFac. O (O
AU) +U
Fac. O (O
AW) +
WFac. P (PAD) +
UFac. Q (Q
AU) +
U
Fac. A (CCC
) ‐
Fac. A (A
CC) +
Fac. B (D
CC) ‐
Fac. B (B
CC) +
Fac. K (KCC
) +
Fac. M
(MAD) ‐
Fac. M
(MAS) +
µg/g
Aluminum (Al)
I. Ox.Nat.Ox. ForcedOx. Nat.Ox.Nat.Ox.
Fly Ash | ScrubberSludge | Gypsum | FixatedScrubber Sludge
Figure 13 and Figure 14. Mercury and Aluminum. Comparison of total elemental content by digestion (key: - = NOx control off; + = NOx control on; U = unwashed gypsum; W = washed gypsum; Nat. Ox. = natural oxidation; Forced Ox. = forced oxidation; I.Ox. = inhibited oxidation).

Characterization of Coal Combustion Residues II
0
5
10
15
20
Fac. A (CFA) ‐
Fac. A (A
FA) +
Fac. B (D
FA) ‐
Fac. B (B
FA) +
Fac. K (KFA
) +
Fac. A (CGD) ‐
Fac. A (A
GD) +
Fac. B (D
GD) ‐
Fac. B (B
GD) +
Fac. K (KGD) +
Fac. N (N
AU) +U
Fac. N (N
AW) +
WFac. O (O
AU) +U
Fac. O (O
AW) +
WFac. P (PAD) +
UFac. Q (Q
AU) +
U
Fac. A (CCC
) ‐
Fac. A (A
CC) +
Fac. B (D
CC) ‐
Fac. B (B
CC) +
Fac. K (KCC
) +
Fac. M
(MAD) ‐
Fac. M
(MAS) +
µg/g
Antimony (Sb)
Fly Ash | ScrubberSludge | Gypsum | Fixated Scrubber Sludge
I. Ox.Nat.Ox. ForcedOx. Nat.Ox.Nat.Ox.
0
20
40
60
80
100
Fac. A (CFA) ‐
Fac. A (A
FA) +
Fac. B (D
FA) ‐
Fac. B (B
FA) +
Fac. K (KFA
) +
Fac. A (CGD) ‐
Fac. A (A
GD) +
Fac. B (D
GD) ‐
Fac. B (B
GD) +
Fac. K (KGD) +
Fac. N (N
AU) +U
Fac. N (N
AW) +
W
Fac. O (O
AU) +U
Fac. O (O
AW) +
W
Fac. P (PAD) +
U
Fac. Q (Q
AU) +
U
Fac. A (CCC
) ‐
Fac. A (A
CC) +
Fac. B (D
CC) ‐
Fac. B (B
CC) +
Fac. K (KCC
) +
Fac. M
(MAD) ‐
Fac. M
(MAS) +
µg/g
Arsenic (As)
Fly Ash | ScrubberSludge | Gypsum | FixatedScrubber Sludge
I. Ox.Nat.Ox. ForcedOx. Nat.Ox.Nat.Ox.
44
Figure 15 and Figure 16. Antimony and Arsenic. Comparison of total elemental content by digestion (key: - = NOx control off; + = NOx control on; U = unwashed gypsum; W = washed gypsum; Nat. Ox. = natural oxidation; Forced Ox. = forced oxidation; I.Ox. = inhibited oxidation).
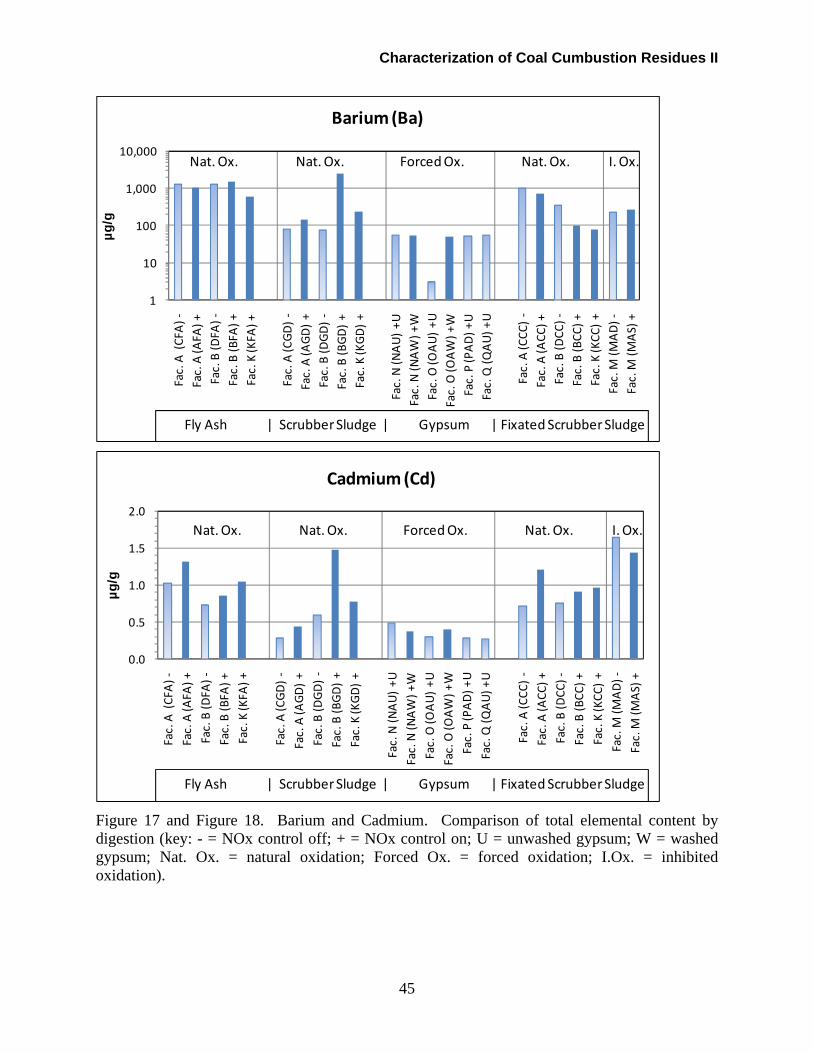
Characterization of Coal Cumbustion Residues II
45
1
10
100
1,000
10,000
Fac. A (CFA) ‐
Fac. A (A
FA) +
Fac. B (D
FA) ‐
Fac. B (B
FA) +
Fac. K (KFA
) +
Fac. A (CGD) ‐
Fac. A (A
GD) +
Fac. B (D
GD) ‐
Fac. B (B
GD) +
Fac. K (KGD) +
Fac. N (N
AU) +U
Fac. N (N
AW) +
WFac. O (O
AU) +U
Fac. O (O
AW) +
WFac. P (PAD) +
UFac. Q (Q
AU) +
U
Fac. A (CCC
) ‐
Fac. A (A
CC) +
Fac. B (D
CC) ‐
Fac. B (B
CC) +
Fac. K (KCC
) +
Fac. M
(MAD) ‐
Fac. M
(MAS) +
µg/g
Barium (Ba)
I. Ox.Nat.Ox. ForcedOx. Nat.Ox.Nat.Ox.
Fly Ash | ScrubberSludge | Gypsum | FixatedScrubber Sludge
0.0
0.5
1.0
1.5
2.0
Fac. A (CFA) ‐
Fac. A (A
FA) +
Fac. B (D
FA) ‐
Fac. B (B
FA) +
Fac. K (KFA
) +
Fac. A (CGD) ‐
Fac. A (A
GD) +
Fac. B (D
GD) ‐
Fac. B (B
GD) +
Fac. K (KGD) +
Fac. N (N
AU) +U
Fac. N (N
AW) +
W
Fac. O (O
AU) +U
Fac. O (O
AW) +
W
Fac. P (PAD) +
U
Fac. Q (Q
AU) +
U
Fac. A (CCC
) ‐
Fac. A (A
CC) +
Fac. B (D
CC) ‐
Fac. B (B
CC) +
Fac. K (KCC
) +
Fac. M
(MAD) ‐
Fac. M
(MAS) +
µg/g
Cadmium (Cd)
Fly Ash | ScrubberSludge | Gypsum | FixatedScrubber Sludge
I. Ox.Nat.Ox. ForcedOx. Nat.Ox.Nat.Ox.
Figure 17 and Figure 18. Barium and Cadmium. Comparison of total elemental content by digestion (key: - = NOx control off; + = NOx control on; U = unwashed gypsum; W = washed gypsum; Nat. Ox. = natural oxidation; Forced Ox. = forced oxidation; I.Ox. = inhibited oxidation).

Characterization of Coal Combustion Residues II
46
0
100
200
300
400
Fac. A (CFA) ‐
Fac. A (A
FA) +
Fac. B (D
FA) ‐
Fac. B (B
FA) +
Fac. K (KFA
) +
Fac. A (CGD) ‐
Fac. A (A
GD) +
Fac. B (D
GD) ‐
Fac. B (B
GD) +
Fac. K (KGD) +
Fac. N (N
AU) +U
Fac. N (N
AW) +
WFac. O (O
AU) +U
Fac. O (O
AW) +
WFac. P (PAD) +
UFac. Q (Q
AU) +
U
Fac. A (CCC
) ‐
Fac. A (A
CC) +
Fac. B (D
CC) ‐
Fac. B (B
CC) +
Fac. K (KCC
) +
Fac. M
(MAD) ‐
Fac. M
(MAS) +
µg/g
Chromium (Cr)
Fly Ash | ScrubberSludge | Gypsum | FixatedScrubber Sludge
I. Ox.Nat.Ox. ForcedOx. Nat.Ox.Nat.Ox.
0
20
40
60
80
Fac. A (CFA) ‐
Fac. A (A
FA) +
Fac. B (D
FA) ‐
Fac. B (B
FA) +
Fac. K (KFA
) +
Fac. A (CGD) ‐
Fac. A (A
GD) +
Fac. B (D
GD) ‐
Fac. B (B
GD) +
Fac. K (KGD) +
Fac. N (N
AU) +U
Fac. N (N
AW) +
WFac. O (O
AU) +U
Fac. O (O
AW) +
WFac. P (PAD) +
UFac. Q (Q
AU) +
U
Fac. A (CCC
) ‐
Fac. A (A
CC) +
Fac. B (D
CC) ‐
Fac. B (B
CC) +
Fac. K (KCC
) +
Fac. M
(MAD) ‐
Fac. M
(MAS) +
µg/g
Cobalt (Co)
Fly Ash | ScrubberSludge | Gypsum | Fixated Scrubber Sludge
I. Ox.Nat.Ox. ForcedOx. Nat.Ox.Nat.Ox.
Figure 19 and Figure 20. Chromium and Cobalt. Comparison of total elemental content by digestion (key: - = NOx control off; + = NOx control on; U = unwashed gypsum; W = washed gypsum; Nat. Ox. = natural oxidation; Forced Ox. = forced oxidation; I.Ox. = inhibited oxidation).

Characterization of Coal Cumbustion Residues II
47
0
20
40
60
80
100
120Fac. A (CFA) ‐
Fac. A (A
FA) +
Fac. B (D
FA) ‐
Fac. B (B
FA) +
Fac. K (KFA
) +
Fac. A (CGD) ‐
Fac. A (A
GD) +
Fac. B (D
GD) ‐
Fac. B (B
GD) +
Fac. K (KGD) +
Fac. N (N
AU) +U
Fac. N (N
AW) +
WFac. O (O
AU) +U
Fac. O (O
AW) +
WFac. P (PAD) +
UFac. Q (Q
AU) +
U
Fac. A (CCC
) ‐
Fac. A (A
CC) +
Fac. B (D
CC) ‐
Fac. B (B
CC) +
Fac. K (KCC
) +
Fac. M
(MAD) ‐
Fac. M
(MAS) +
µg/g
Lead (Pb)
Fly Ash | ScrubberSludge | Gypsum | Fixated Scrubber Sludge
I. Ox.Nat.Ox. ForcedOx. Nat.Ox.Nat.Ox.
0
10
20
30
40
Fac. A (CFA) ‐
Fac. A (A
FA) +
Fac. B (D
FA) ‐
Fac. B (B
FA) +
Fac. K (KFA
) +
Fac. A (CGD) ‐
Fac. A (A
GD) +
Fac. B (D
GD) ‐
Fac. B (B
GD) +
Fac. K (KGD) +
Fac. N (N
AU) +U
Fac. N (N
AW) +
WFac. O (O
AU) +U
Fac. O (O
AW) +
WFac. P (PAD) +
UFac. Q (Q
AU) +
U
Fac. A (CCC
) ‐
Fac. A (A
CC) +
Fac. B (D
CC) ‐
Fac. B (B
CC) +
Fac. K (KCC
) +
Fac. M
(MAD) ‐
Fac. M
(MAS) +
µg/g
Molybdenum (Mo)
Fly Ash | ScrubberSludge | Gypsum | FixatedScrubber Sludge
I. Ox.Nat.Ox. ForcedOx. Nat.Ox.Nat.Ox.
Figure 21 and Figure 22. Lead and Molybdenum. Comparison of total elemental content by digestion (key: - = NOx control off; + = NOx control on; U = unwashed gypsum; W = washed gypsum; Nat. Ox. = natural oxidation; Forced Ox. = forced oxidation; I.Ox. = inhibited oxidation).

Characterization of Coal Combustion Residues II
48
0
5
10
15
20
25
30Fac. A (CFA) ‐
Fac. A (A
FA) +
Fac. B (D
FA) ‐
Fac. B (B
FA) +
Fac. K (KFA
) +
Fac. A (CGD) ‐
Fac. A (A
GD) +
Fac. B (D
GD) ‐
Fac. B (B
GD) +
Fac. K (KGD) +
Fac. N (N
AU) +U
Fac. N (N
AW) +
WFac. O (O
AU) +U
Fac. O (O
AW) +
WFac. P (PAD) +
UFac. Q (Q
AU) +
U
Fac. A (CCC
) ‐
Fac. A (A
CC) +
Fac. B (D
CC) ‐
Fac. B (B
CC) +
Fac. K (KCC
) +
Fac. M
(MAD) ‐
Fac. M
(MAS) +
µg/g
Selenium (Se)
I. Ox.Nat.Ox. ForcedOx. Nat.Ox.Nat.Ox.
Fly Ash | ScrubberSludge | Gypsum | FixatedScrubber Sludge
0
5
10
15
Fac. A (CFA) ‐
Fac. A (A
FA) +
Fac. B (D
FA) ‐
Fac. B (B
FA) +
Fac. K (KFA
) +
Fac. A (CGD) ‐
Fac. A (A
GD) +
Fac. B (D
GD) ‐
Fac. B (B
GD) +
Fac. K (KGD) +
Fac. N (N
AU) +U
Fac. N (N
AW) +
W
Fac. O (O
AU) +U
Fac. O (O
AW) +
W
Fac. P (PAD) +
U
Fac. Q (Q
AU) +
U
Fac. A (CCC
) ‐
Fac. A (A
CC) +
Fac. B (D
CC) ‐
Fac. B (B
CC) +
Fac. K (KCC
) +
Fac. M
(MAD) ‐
Fac. M
(MAS) +
µg/g
Thallium (Tl)
I. Ox.Nat.Ox. ForcedOx. Nat.Ox.Nat.Ox.
Fly Ash | ScrubberSludge | Gypsum | Fixated Scrubber Sludge
Figure 23 and Figure 24. Selenium and Thallium. Comparison of total elemental content by digestion (key: - = NOx control off; + = NOx control on; U = unwashed gypsum; W = washed gypsum; Nat. Ox. = natural oxidation; Forced Ox. = forced oxidation; I.Ox. = inhibited oxidation).

Characterization of Coal Cumbustion Residues II
3.2. TOTAL ELEMENTAL CONTENT BY XRF Total elemental compositions, on a dry weight basis, for major and some trace constituents in each of the CCRs evaluated are compared in grouping by CCR type (i.e., fly ash, gypsum, scrubber sludge, fixated scrubber sludge) in Figure 25 through Figure 29; tabular results are provided in Appendix C. Major elemental constituents present in CCRs but not detected by XRF analysis include oxygen and carbon. Elements that may be analyzed by XRF but were below the detection limit are indicated in the figures on the x-axis but without any reported value represented. Separate analyses were carried out for carbon and are also included in Appendix C.
Fly Ash. Elemental constituents typically present in fly ash at concentrations greater than 1 percent (10,000 mg/kg) are aluminum, calcium, iron, potassium, and silicon. Elemental constituents typically present at concentrations between 0.1 and 1 percent are barium, chloride, magnesium, sodium, phosphorus, strontium, sulfur, and titanium.
Gypsum. Elemental constituents typically present in gypsum at concentrations greater than 1 percent (10,000 mg/kg) are calcium and sulfur. Elemental constituents typically present at concentrations between 0.1 and 1 percent are chloride (unwashed gypsum), fluoride (unwashed gypsum), iron, magnesium, sodium (unwashed gypsum) and silicon.
Scrubber Residue. Elemental constituents typically present in scrubber residue at concentrations greater than 1 percent (10,000 mg/kg) are aluminum (SCR on), calcium, iron (SCR on), magnesium, silicon (SCR on) and sulfur. Elemental constituents typically present at concentrations between 0.1 and 1 percent are aluminum (except with SCR on), chloride, fluoride, iron (except with SCR on), potassium, sodium (SCR on), silicon (except with SCR on), and titanium (SCR on).
Fixated Scrubber Sludge. Elemental constituents typically present in fixated scrubber sludge at concentrations greater than 1 percent (10,000 mg/kg) are aluminum, calcium, iron, potassium, silicon and sulfur. Elemental constituents typically present at concentrations between 0.1 and 1 percent are barium, chloride, sodium, phosphorus and strontium.
Fixated Scrubber Sludge with Lime. Elemental constituents typically present in fixated scrubber sludge with lime at concentrations greater than 1 percent (10,000 mg/kg) are aluminum, calcium, iron, magnesium (Mg lime scrubbers), silicon, and sulfur. Elemental constituents typically present at concentrations between 0.1 and 1 percent are chloride, potassium, magnesium (non-Mg lime scrubbers), sodium, and titanium.
49

Characterization of Coal Combustion Residues II
50
1
10
100
1,000
10,000
100,000
1,000,000
Al
As
Ba Br Ca Cd Ce Cl Co Cr Cu F Fe Ga
Ge K La Mg
Mn
Mo Na
Nb Ni P Pb Rb Sc Se Si Sr S Ti V W Y Zn Zr
µg/g
CFA (SNCR Off) AFA (SNCR On)Fac. A. (NO+SNCR+FF) ‐ Fly Ash
1
10
100
1,000
10,000
100,000
1,000,000
Al
As
Ba Br Ca Cd Ce Cl Co Cr Cu F Fe Ga
Ge K La Mg
Mn
Mo Na
Nb Ni P
Pb Rb Sc Se Si Sr S Ti V W Y Zn Zr
µg/g
DFA (SCR Off) BFA (SCR On)Fac. B. (NO+SCR+ESP,Mg lime) ‐ Fly Ash
1
10
100
1,000
10,000
100,000
1,000,000
Al
As
Ba Br Ca Cd Ce Cl Co Cr Cu F Fe Ga
Ge K La Mg
Mn
Mo Na
Nb Ni P
Pb Rb Sc Se Si Sr S Ti V W Y Zn Zr
µg/g
KFA (SCR On)Fac. K. (NO+SCR+ESP,Mg lime) ‐ Fly Ash
a)
b)
c)
Figure 25. Fly Ash - Total content by XRF.
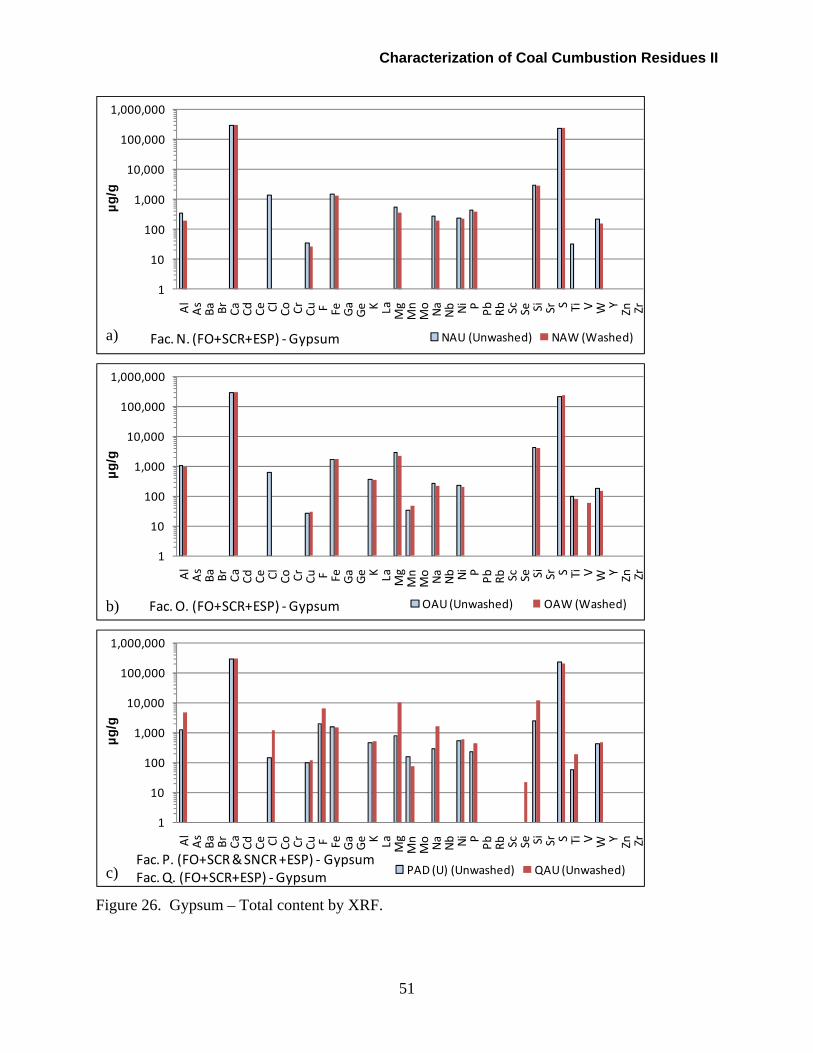
Characterization of Coal Cumbustion Residues II
51
1
10
100
1,000
10,000
100,000
1,000,000
Al
As
Ba Br Ca Cd Ce Cl Co Cr Cu F Fe Ga
Ge K La Mg
Mn
Mo Na
Nb Ni P Pb Rb Sc Se Si Sr S Ti V W Y Zn Zr
µg/g
NAU (Unwashed) NAW (Washed)Fac. N. (FO+SCR+ESP) ‐Gypsum
1
10
100
1,000
10,000
100,000
1,000,000
Al
As
Ba Br Ca Cd Ce Cl Co Cr Cu F Fe Ga
Ge K La Mg
Mn
Mo Na
Nb Ni P
Pb Rb Sc Se Si Sr S Ti V W Y Zn Zr
µg/g
OAU (Unwashed) OAW (Washed)Fac. O. (FO+SCR+ESP) ‐Gypsum
1
10
100
1,000
10,000
100,000
1,000,000
Al
As
Ba Br Ca Cd Ce Cl Co Cr Cu F Fe Ga
Ge K La Mg
Mn
Mo Na
Nb Ni P
Pb Rb Sc Se Si Sr S Ti V W Y Zn Zr
µg/g
PAD (U) (Unwashed) QAU (Unwashed)Fac. P. (FO+SCR & SNCR +ESP) ‐ GypsumFac. Q. (FO+SCR+ESP) ‐Gypsum
a)
b)
c)
Figure 26. Gypsum – Total content by XRF.

Characterization of Coal Combustion Residues II
52
1
10
100
1,000
10,000
100,000
1,000,000
Al
As
Ba Br Ca Cd Ce Cl Co Cr Cu F Fe Ga
Ge K La Mg
Mn
Mo Na
Nb Ni P
Pb Rb Sc Se Si Sr S Ti V W Y Zn Zr
µg/g
CGD (SNCR Off) AGD (SNCR On)Fac. A. (NO+SNCR+FF) ‐ Scrubber Sludge
1
10
100
1,000
10,000
100,000
1,000,000
Al
As
Ba Br Ca Cd Ce Cl Co Cr Cu F Fe Ga
Ge K La Mg
Mn
Mo Na
Nb Ni P Pb Rb Sc Se Si Sr S Ti V W Y Zn Zr
µg/g
DGD (SCR Off) BGD (SCR On)Fac. B. (NO+SCR+ESP,Mg lime) ‐ Scrubber Sludge
1
10
100
1,000
10,000
100,000
1,000,000
Al
As
Ba Br Ca Cd Ce Cl Co Cr Cu F Fe Ga
Ge K La Mg
Mn
Mo Na
Nb Ni P
Pb Rb Sc Se Si Sr S Ti V W Y Zn Zr
µg/g
KGD (SCR On)Fac. K. (NO+SCR+ESP,Mg lime) ‐ Scrubber Sludge
a)
b)
c)
Figure 27. Scrubber Sludge – Total content by XRF.

Characterization of Coal Cumbustion Residues II
53
1
10
100
1,000
10,000
100,000
1,000,000
Al
As
Ba Br Ca Cd Ce Cl Co Cr Cu F Fe Ga
Ge K La Mg
Mn
Mo Na
Nb Ni P
Pb Rb Sc Se Si Sr S Ti V W Y Zn Zr
µg/g
CCC (SNCR Off) ACC (SNCR On)Fac. A. (NO+SNCR+FF) ‐ Fixated Scrubber Sludge Figure 28. Fixated Scrubber Sludge – Total content by XRF.

Characterization of Coal Combustion Residues II
54
1
10
100
1,000
10,000
100,000
1,000,000
Al
As
Ba Br Ca Cd Ce Cl Co Cr Cu F Fe Ga
Ge K La Mg
Mn
Mo Na
Nb Ni P Pb Rb Sc Se Si Sr S Ti V W Y Zn Zr
µg/g
DCC (SCR Off) BCC (SCR On)Fac. B. (NO+SCR+ESP,Mg lime) ‐ FSSL
1
10
100
1,000
10,000
100,000
1,000,000
Al
As
Ba Br Ca Cd Ce Cl Co Cr Cu F Fe Ga
Ge K La Mg
Mn
Mo Na
Nb Ni P
Pb Rb Sc Se Si Sr S Ti V W Y Zn Zr
µg/g
KCC (SCR On)Fac. K. (NO+SCR+ESP,Mg lime) ‐ FSSL
1
10
100
1,000
10,000
100,000
1,000,000
Al
As
Ba Br Ca Cd Ce Cl Co Cr Cu F Fe Ga
Ge K La Mg
Mn
Mo Na
Nb Ni P
Pb Rb Sc Se Si Sr S Ti V W Y Zn Zr
µg/g
MAD (SCR Off) MAS (SCR On)Fac. M. (IO+SCR+ESP)‐ FSSL
a)
b)
c)
Figure 29. Fixated Scrubber Sludge with Lime – Total content by XRF.

Characterization of Coal Cumbustion Residues II
3.3. LABORATORY LEACHING TEST RESULTS Appendix D and Appendix E provide graphical presentation of the results of Solubility and Release as a Function of pH (SR002.1) and Solubility and Release as a Function of LS (SR003.1), respectively, for the 13 constituents of interest in this report. Within each appendix, results are grouped by CCR type (fly ash, gypsum, scrubber sludge, FSS, FSSL) and with each CCR type grouping, comparisons are made by constituent of interest. First discussed below are typical characteristic results for pH and each of the 13 constituents of interest (Section 3.3.1) followed by a discussion (Section 3.3.2) comparing the ranges of observed constituent concentrations (from both test methods) with measurements reported elsewhere on field leachate and pore water samples for CCR disposal sites and the database used in the EPA Risk Report (EPA, 2007). Complete data also have been developed for other constituents to facilitate evaluation of geochemical speciation of constituents of concern and provide more thorough evaluation of leaching under alternative management scenarios in the future if warranted.
For each CCR evaluated, results of the leaching tests provide the following information:
� Leachate concentrations for the constituents of interest as a function of pH over the range of reported field management conditions (from test method SR002.1);
� pH titration curves (from test method SR002.1). This information is useful in characterizing the CCR and assessing how it will respond to environmental stresses and material aging (e.g., carbon dioxide uptake, acid precipitation, co-disposal, mixing with other materials); and,
� Leachate concentrations for the constituents of interest, pH and electrical conductivity as a function of LS ratio when contacted with distilled water (from test method SR003.1). This information provides insight into the initial leachate concentrations expected during land disposal and effects of pH and ionic strength at low LS ratio. Often these concentrations can be either greater than or less than concentrations observed at higher LS ratio (i.e., LS=10 mL/g as used in SR002.1) because of ionic strength and co-constituent concentration effects.
The MCL is used as a reference threshold for the constituent of interest. However, releases identified here are estimates of concentrations potentially leaching from landfills. Any assessment of the environmental impact of these releases needs to consider the dilution and attenuation of these constituents in ground water, and the plausibility of drinking water well contamination resulting from the release. Dilution and attenuation factors for metals (DAFs) have been estimated to be potentially as low as 2 to 10 on a national basis or as high as 8,000 at a particular site with hydrogeology that indicated low transport potential23. Therefore, comparison with thresholds greater than the MCL and developed for specific scenarios may be appropriate.
23 See 60 FR 66372, Dec. 21, 1995, for a discussion of model parameters leading to low DAFs, particularly the assumption of a continuous source landfill. Implied DAFs for the metals of interest here can be found at 60 FR 66432-66438 in Table C-2. Site specific high-end DAFs are discussed in 65 FR 55703, September 14, 2000.
55

Characterization of Coal Combustion Residues II
3.3.1. Typical Characteristic Leaching Behavior as a Function of pH and LS Figure 30 through Figure 45 provide comparisons of typical leaching behavior as a function of pH for each constituent, as examples reproduced from Appendix D. These comparisons illustrate on an empirical basis some of the differences in leaching behavior for different CCRs that result from the combination of the coal rank combusted, combustion conditions and specific combustion facility design and operation. Also noted but not shown is the observed behavior for each constituent as a function of LS at the material’s natural pH (see Appendix E). Elements with predominantly oxyanionic species (e.g., boron, molybdenum, selenium, etc.) typically exhibited non-linearly increasing extract concentrations as LS was decreased from 10 mL/g to 0.5 mL/g, in many cases increasing by a factor of 5 or 10 or greater.
These figures illustrate that for a particular constituent, the chemistry controlling release or aqueous-solid equilibrium may be similar within a material type (i.e., mercury behavior for fly ash or scrubber sludge) or across material types (i.e., the same behavior for aluminum in fly ash and fixated scrubber sludge) but that there are not necessarily generalized behaviors present for each constituent across all samples within a material type or between material types. The most robust groupings of leaching behavior will result from the development of geochemical speciation models of the materials that account for the underlying solid phase speciation (e.g., solid phases, adsorption behavior) and modifying solution characteristics (e.g., dissolved organic matter, pH, ionic strength, co-dissolved constituents). Development of the needed geochemical speciation models, and associated leaching behavior groupings as a function of coal rank, combustion facility design, and CCR type, will be the basis of a subsequent report. The resulting models and groupings, in turn, are expected to allow for more detailed constituent release predictions based on limited testing for a broader set of facilities.
Mercury. Figure 30 (a, b) compares the impact of SNCR usage (Facility A) on the release behavior of mercury from fly ash. The increased mercury release, reaching a maximum at pH~8, when SNCR is in use, is likely a consequence of additional ammonium present and consequent formation of an ammonium mercury complex in solution (Wang, 2007). For all fly ash samples except AFA (Facility A, SNCR[+]), the mercury release indicated apparently random scatter with solution concentrations ranging from 0.01 to 0.1 µg/L. This behavior is similar to that reported earlier in this study (Sanchez et al., 2006) and is indicative of adsorption of elemental mercury as the primary release mechanism. For gypsum samples, mercury release was either (i) similar to that observed for fly ash (Figure 30d, Facility P), (ii) at very low concentration near or below the MDL (Facility O, unwashed and washed; Facility N washed) potentially indicative of adsorption onto carbon char, or (iii) had increased release at pH<6 potentially indicative of adsorbed ionic mercury being displaced by hydrogen ions at acidic pH (Facility A, unwashed; Facility Q). For scrubber sludge, mercury release was either (i) similar to that observed for fly ash, (ii) had increasing release concurrent with decreasing pH at pH<8 (Facility B, Figure 30c), or (iii) had increased release at pH~8 (local peak, indicative of ammonium complexation) and then increasing release with decreasing pH at pH<6 (Facility K). For FSS, behavior was either (i) analogous to that observed for fly ash (Facility A), or (ii) analogous to that observed for scrubber sludge illustrated in Figure 30c (Facilities B, K, M). Mercury extract concentrations were not significantly affected by LS.
Aluminum. Figure 31 (a, b) compares the impact of SNCR usage (Facility A) on the release behavior of aluminum from fly ash and illustrates one of the three types of aluminum behavior observed across the CCR types. One type of observed aluminum behavior was amphoteric
56

Characterization of Coal Cumbustion Residues II
behavior (minimum release at pH~6-8, with increasing release as pH decreases and increases outside of this range) with a local maximum of approximately 10,000 µg/L at pH~12 and a maximum of ca. 100,000 to 1,000,000 µg/L at pH~3. The concentration of the minimum at 6<pH<8 is typically influenced by the amount of DOC complexing aluminum in solution (increased complexation increases dissolved aluminum). This behavior was present for fly ash from Facilities A and K. Other samples exhibited increasing aluminum release with decreasing pH at pH<8 but without substantially increased release at pH>8 (fly ash from facility B; scrubber sludge from facilities B, K). Several samples exhibited increasing release with decreasing pH for pH<6 and a local maximum at pH~10 (Figure 31c, scrubber sludge from Facility A; FSS from Facility B). In addition, several samples exhibited relatively constant release (ca. 100 µg/L) at pH>8 with increasing release with decreasing pH at pH<8 (Figure 31d, scrubber sludge for facility B with SCR[-]; FSS from facilities A, B, K). Aluminum extract concentrations typically were either relatively constant or decreasing (salting out) with decreasing LS. The notable exception was the scrubber sludge from facility B with SCR off (DGD) and FSS from facility M with SCR on (MAS), where aluminum concentration increased with decreasing LS.
Antimony. Figure 32a illustrates antimony behavior with local maxima at pH~8 and pH<3, which was observed for fly ash from facilities A and B, and FSS from facility A. Figure 32b illustrates behavior that was observed for gypsum from Facility Q and scrubber sludge from Facility A. For gypsum samples other than from Facility Q, antimony release appeared random at concentrations of <MDL to 3 µg/L at pH>4 with a general slight increase in concentration at pH<4. Figure 32c and d illustrates behavior that was observed for the remaining CCR samples. For some samples, antimony concentrations in extracts increased by up to a factor of 5 with decreasing LS, while it remained constant or decreased for other samples.
Arsenic. Figure 33 illustrates the four typical release behaviors observed for arsenic release as a function of pH. Each of these four behaviors was observed for a least one of the samples from each material type (fly ash, gypsum, scrubber sludge, FSS). Leaching from gypsum generally was less than 10 µg/L for pH>6 and reached a maximum of approximately 30-100 µg/L at pH<5. Arsenic concentrations in extracts were either constant or increased by up to a factor of 2 with decreasing LS.
Barium. Figure 34 illustrates the four typical release behaviors observed for barium. For fly ash, barium was either relatively constant at approximately 100 µg/L as a function of pH or exhibited increases at pH< 4 (Figure 34a) and pH>9 to approximately 1000 µg/L (i.e., facility K). For gypsum, Figure 35d illustrates the typical behavior. Behaviors illustrated by Figure 34b and c are typical of that observed for scrubber sludge and FSS, with both behaviors observed for both material types. Barium extract concentrations remained constant with decreasing LS, with the exception of fly ash from facility A, where barium concentrations increased by up to a factor of 5 with decreasing LS.
Boron. Figure 35 (a, b, c) illustrates the three typical release behaviors for boron: (i) decreasing concentration with increasing pH for pH>8 (Figure 35a, fly ash from facilities A, B; scrubber sludge from facility K; FSS from facilities A, M), (ii) relatively constant concentration with a slight decrease at 8<pH<10 (Figure 35b, scrubber sludge from facility B, FSS from facility K), (iii) relatively constant or with a slight increase at pH>10 (Figure 35d). Comparison of Figure 35c and d illustrates the reduction in leachable boron achieved through the washing step (facility N, unwashed and washed). Boron concentrations in extracts were either constant or increased by up to a factor of 10 with decreasing LS.
57

Characterization of Coal Combustion Residues II
Cadmium. Figure 36 illustrates typical release behavior for cadmium, which is similar for all cases. The maximum concentration at pH<4 reflects the total content in the sample, and the slope and pH shift in the increasing cadmium concentration with decreasing pH typically reflects the presence or absence of complexants in solution (e.g., chloride or DOC). Cadmium concentrations in extracts were either constant or increasing with decreasing LS.
Chromium. Figure 37 and Figure 38 illustrate typical release behavior for chromium. Comparison of the pairs Figure 37a and b, Figure 37c and d, and Figure 38a and b illustrate the effect of NOx control on chromium release from fly ash, scrubber sludge, and FSS respectively for Facility B. Use of SCR at this facility appears to result in a larger fraction of the chromium in the residue being oxidized (Cr+6), forming chromate, which is more soluble at neutral pH. The SCR catalyst used for Facility B may have contributed to increased overall total chromium present in the CCRs from that facility when SCR was in use. Increased leachability of chromium as a consequence of NOx control was also observed for Facility A (comparing results for SNCR[-] with SNCR[+]), even though total chromium content was similar for cases with and without NOx control. Figure 38c and d illustrates the typical amphoteric behavior for reduced chromium (Cr+3), which was observed for gypsum samples. Chromium concentrations in extracts were either constant (for cases with low leachable chromium), or increasing by up to a factor of 10 (cases with Cr+6 as the apparently dominant chromium form) with decreasing LS.
Cobalt. Figure 39 illustrates typical release behavior for cobalt, which is similar for all CCRs tested. Cobalt release increases with decreasing pH at pH<8, with the maximum concentration reflecting the total leachable content and the slope and relative pH shift in the slope typically reflecting the presence or absence of complexants in solution. Cobalt concentrations in extracts (where greater than the MDL) were typically increasing by up to a factor of 5 with decreasing LS.
Lead. Figure 40 illustrates typical release behavior for lead, which generally is expected to be amphoteric (Figure 40a, c). However, many samples did not have sufficient lead content or complexants present in solution to produce amphoteric behavior at pH<12 (Figure 40b, d). Lead concentrations in extracts were not significantly changed at decreasing LS.
Molybdenum. Figure 41 and Figure 42 illustrate typical release behaviors for molybdenum. Figure 41a illustrates increased concentration peaking at pH~8 most likely from complexation with ammonium present from use of SNCR (Facility A). Note the similar release behavior observed for fly ash, FSS and gypsum illustrated by Figure 41b and Figure 42b, c, albeit at different orders of magnitude in concentration. Figure 41c, d and Figure 42b, d illustrate three additional observed behaviors, present across multiple CCR types. Molybdenum concentrations typically increased with decreasing LS, in some cases by a factor much greater than 10 (e.g., FSS from Facility A).
Selenium. Figure 43 and Figure 44 illustrate typical selenium release behaviors observed for fly ash, scrubber sludge and FSS. For gypsum, selenium release was either constant as a function of pH (facilities O, P) or amphoteric (facilities N, Q). Selenium concentrations in extracts typically increased by up to a factor of 6 with decreasing LS.
Thallium. Figure 45 illustrates typical release behavior for thallium. Most cases were either analogous to Figure 45a or Figure 45c (increasing concentration with decreasing pH at pH<9) or Figure 45d (relatively constant as a function of pH). For gypsum, washing resulted in at least an
58

Characterization of Coal Cumbustion Residues II
59
order of magnitude reduction in the observed leaching concentrations (facilities N, O). Thallium concentrations typically increased by up to a factor of 5 with decreasing LS.
MDLML
10.3
0.044
MCL
0.001
0.01
0.1
1
2 4 6 8 10 12 14
Hg
[µg/
L]
pH
SR2-CFA - A SR2-CFA - BSR2-CFA - C
Fly Ash ‐ Fac. A. (NO+SNCR[‐]+FF)
MDLML
10.5
0.116
MCL
0.001
0.01
0.1
1
2 4 6 8 10 12 14
Hg
[µg/
L]
pH
SR2-AFA - A SR2-AFA - BSR2-AFA - C
Fly Ash ‐ Fac. A. (NO+SNCR[+]+FF)
MDLML
9.1
0.040
MCL
0.001
0.01
0.1
1
10
2 4 6 8 10 12 14
Hg
[µg/
L]
pH
SR2-DGD - A SR2-DGD - BSR2-DGD - C
Scrubber Sludge ‐ Fac. B. (NO+SCR[‐]+ESP,Mg Lime)
MDLML
6.7
0.029
MCL
0.001
0.01
0.1
1
10
2 4 6 8 10 12 14
Hg
[µg/
L]
pH
SR2-PAD - A SR2-PAD - B
Gypsum ‐ Fac. P. (FO+SCR[+]&SNCR[+]+ESP)
a) b)
c) d)
Figure 30. Mercury - Examples of characteristic leaching behavior as a function of pH (SR002.1 results).

Characterization of Coal Combustion Residues II
60
MDL
1000000
100000
100001804
]L 1000
/g [µ 100
Al
10
1
0.1 10.32 4 6 8 10 12 14
ML pH
SR2-CFA - A SR2-CFA - BSR2-CFA - C
Fly Ash ‐ Fac. A. (NO+SNCR[‐]+FF)
MDL
1000000
10000013427
10000
]L 1000
/g [µ 100
Al
10
1
0.1 10.52 4 6 8 10 12 14
ML pH
SR2-AFA - A SR2-AFA - BSR2-AFA - C
Fly Ash ‐ Fac. A. (NO+SNCR[+]+FF)
MDL
1000000
100000
10000
]L 1000
/g 496
[µ 100
Al
10
1
0.1 7.32 4 6 8 10 12 14
ML pH
SR2-CGD - A SR2-CGD - BSR2-CGD - C
Scrubber Sludge ‐ Fac. A. (NO+SNCR[‐]+FF)
MDL
1000000
100000
10000
]L 1000
/g [µ 100
37.0
Al
10
1
0.1 9.12 4 6 8 10 12 14
ML pH
SR2-DGD - A SR2-DGD - BSR2-DGD - C
Scrubber Sludge ‐ Fac. B. (NO+SCR[‐]+ESP)
a) b)
c) d)
Figure 31. Aluminum. Examples of characteristic leaching behavior as a function of pH.

Characterization of Coal Cumbustion Residues II
61
MDLML
10.3
6.43MCL
0.1
1
10
100
1000
2 4 6 8 10 12 14
Sb
[µg/
L]
pH
SR2-DFA - A SR2-DFA - BSR2-DFA - C
Fly Ash ‐ Fac. B. (NO+SNCR[‐]+FF)
MDLML
6.9
2.53
MCL
0.1
1
10
100
2 4 6 8 10 12 14
Sb
[µg/
L]
pH
SR2-QAU - A SR2-QAU - B
Gypsum ‐ Fac. Q. (FO+SCR[+]+ESP)
MDLML
9.1
5.44MCL
0.1
1
10
100
1000
2 4 6 8 10 12 14
Sb
[µg/
L]
pH
SR2-DGD - A SR2-DGD - BSR2-DGD - C
Scrubber Sludge ‐ Fac. B. (NO+SCR[‐]+ESP,Mg Lime)
MDLML
12.2
1.76
MCL
0.1
1
10
100
1000
2 4 6 8 10 12 14
Sb
[µg/
L]
pH
SR2-DCC - A SR2-DCC - BSR2-DCC - C
FSSL ‐ Fac. B. (NO+SCR[‐]+ESP,Mg Lime)
a) b)
c) d)
Figure 32. Antimony. Examples of characteristic leaching behavior as a function of pH.
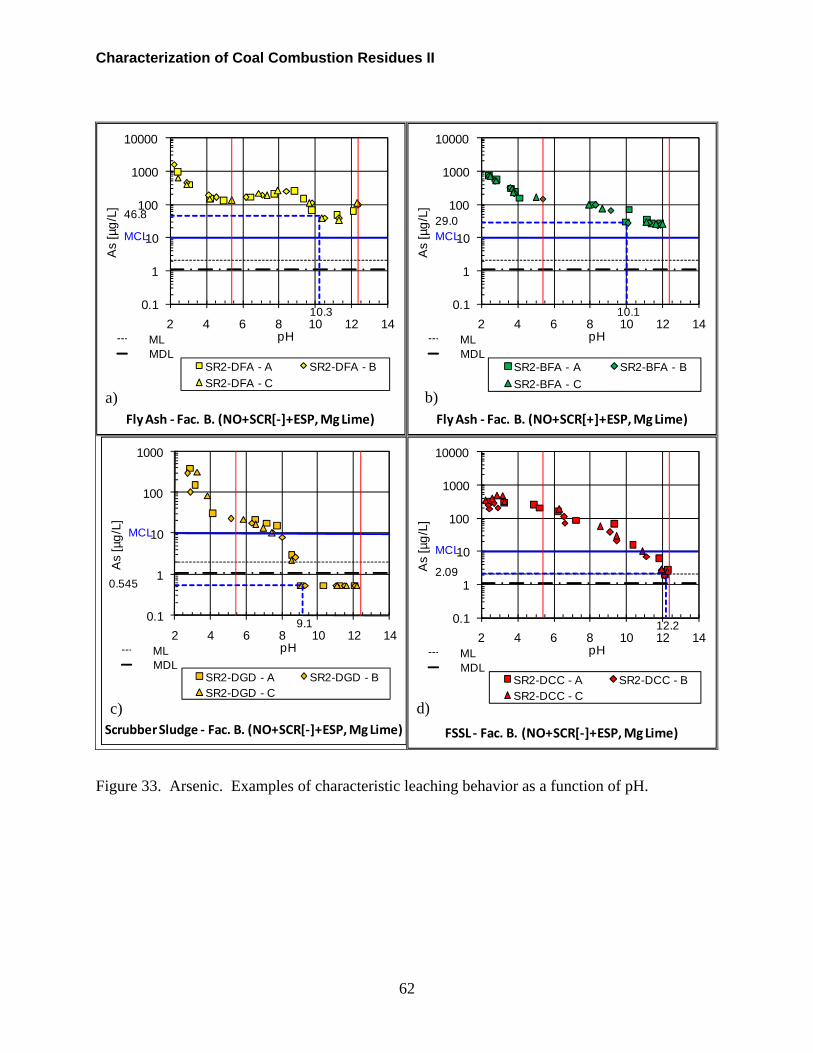
Characterization of Coal Combustion Residues II
62
MDLML
10.3
46.8
MCL
0.1
1
10
100
1000
10000
2 4 6 8 10 12 14
As
[µg/
L]
pH
SR2-DFA - A SR2-DFA - BSR2-DFA - C
Fly Ash ‐ Fac. B. (NO+SCR[‐]+ESP,Mg Lime)
MDLML
10.1
29.0MCL
0.1
1
10
100
1000
10000
2 4 6 8 10 12 14
As
[µg/
L]
pH
SR2-BFA - A SR2-BFA - BSR2-BFA - C
Fly Ash ‐ Fac. B. (NO+SCR[+]+ESP,Mg Lime)
MDLML
9.1
0.545
MCL
0.1
1
10
100
1000
2 4 6 8 10 12 14
As
[µg/
L]
pH
SR2-DGD - A SR2-DGD - BSR2-DGD - C
Scrubber Sludge ‐ Fac. B. (NO+SCR[‐]+ESP,Mg Lime)
MDLML
12.2
2.09
MCL
0.1
1
10
100
1000
10000
2 4 6 8 10 12 14
As
[µg/
L]
pH
SR2-DCC - A SR2-DCC - BSR2-DCC - C
FSSL ‐ Fac. B. (NO+SCR[‐]+ESP,Mg Lime)
d)
b)a)
c)
Figure 33. Arsenic. Examples of characteristic leaching behavior as a function of pH.

Characterization of Coal Cumbustion Residues II
63
MDLML
10.3
192
MCL
0.1
1
10
100
1000
10000
2 4 6 8 10 12 14
Ba
[µg/
L]
pH
SR2-DFA - A SR2-DFA - BSR2-DFA - C
Fly Ash ‐ Fac. B. (NO+SCR[‐]+ESP,Mg Lime)
MDLML
11.0
113
MCL
0.1
1
10
100
1000
10000
2 4 6 8 10 12 14
Ba
[µg/
L]
pH
SR2-KGD - A SR2-KGD - B
Scrubber Sludge ‐ Fac. K. (NO+SCR[+]+ESP,Mg Lime)
MDLML
12.2
2286MCL
0.1
1
10
100
1000
10000
2 4 6 8 10 12 14
Ba
[µg/
L]
pH
SR2-DCC - A SR2-DCC - BSR2-DCC - C
FSSL ‐ Fac. B. (NO+SCR[‐]+ESP,Mg Lime)
MDLML
7.3
80.0
MCL
0.1
1
10
100
1000
10000
2 4 6 8 10 12 14
Ba
[µg/
L]
pH
SR2-OAW - A SR2-OAW - B
Gypsum (Gyp‐W) ‐ Fac. O. (FO+SCR[+]+ESP)
d)
b)a)
c)
Figure 34. Barium. Examples of characteristic leaching behavior as a function of pH.

Characterization of Coal Combustion Residues II
64
MDLML
10.3
3551DWEL
0.1
1
10
100
1000
10000
100000
2 4 6 8 10 12 14
B [µ
g/L]
pH
SR2-DFA - A SR2-DFA - BSR2-DFA - C
Fly Ash ‐ Fac. B. (NO+SCR[‐]+ESP,Mg Lime)
MDLML
9.1
3331DWEL
0.1
1
10
100
1000
10000
100000
2 4 6 8 10 12 14
B [µ
g/L]
pH
SR2-DGD - A SR2-DGD - BSR2-DGD - C
Scrubber Sludge ‐ Fac. B. (NO+SCR[‐]+ESP,Mg Lime)
MDLML
7.2
2214DWEL
0.1
1
10
100
1000
10000
100000
2 4 6 8 10 12 14
B [µ
g/L]
pH
SR2-NAU - A SR2-NAU - B
Gypsum (Gyp‐U) ‐ Fac. N. (FO+SCR[+]+ESP)
MDLML
7.1
48.6
DWEL
0.1
1
10
100
1000
10000
100000
2 4 6 8 10 12 14
B [µ
g/L]
pH
SR2-NAW - A SR2-NAW - B
Gypsum (Gyp‐W) ‐ Fac. N. (FO+SCR[+]+ESP)d)c)
b)a)
Figure 35. Boron. Examples of characteristic leaching behavior as a function of pH.

Characterization of Coal Cumbustion Residues II
65
MDLML
10.3
0.795
MCL
0.1
1
10
100
2 4 6 8 10 12 14
Cd
[µg/
L]
pH
SR2-DFA - A SR2-DFA - BSR2-DFA - C
Fly Ash ‐ Fac. B. (NO+SCR[‐]+ESP,Mg Lime)
MDLML
11.0
0.200
MCL
0.1
1
10
100
2 4 6 8 10 12 14
Cd
[µg/
L]
pH
SR2-KGD - A SR2-KGD - B
Scrubber Sludge ‐ Fac. K. (NO+SCR[+]+ESP,Mg Lime)
MDLML
6.9
6.03MCL
0.1
1
10
100
2 4 6 8 10 12 14
Cd
[µg/
L]
pH
SR2-QAU - A SR2-QAU - B
Gypsum (Gyp‐U) ‐ Fac. Q. (FO+SCR[+]+ESP)
MDLML
8.4
0.634
MCL
0.1
1
10
100
2 4 6 8 10 12 14
Cd
[µg/
L]
pH
SR2-ACC - A SR2-ACC - BSR2-ACC - C
FSSL‐ Fac. B. (NO+SCR[+]+ESP,Mg Lime)
d)c)
b)a)
Figure 36. Cadmium. Examples of characteristic leaching behavior as a function of pH.

Characterization of Coal Combustion Residues II
66
MDLML
10.3
132MCL
0.1
1
10
100
1000
10000
2 4 6 8 10 12 14
Cr [
µg/L
]
pH
SR2-DFA - A SR2-DFA - BSR2-DFA - C
Fly Ash ‐ Fac. B. (NO+SCR[‐]+ESP,Mg Lime)
MDLML
10.1
851
MCL
0.1
1
10
100
1000
10000
2 4 6 8 10 12 14
Cr [
µg/L
]
pH
SR2-BFA - A SR2-BFA - BSR2-BFA - C
Fly Ash ‐ Fac. B. (NO+SCR[+]+ESP,Mg Lime)
MDLML
9.1
2.98
MCL
0.1
1
10
100
1000
10000
2 4 6 8 10 12 14
Cr [
µg/L
]
pH
SR2-DGD - A SR2-DGD - BSR2-DGD - C
Scrubber Sludge ‐ Fac. B. (NO+SCR[‐]+ESP,Mg Lime)
MDLML
10.1
228MCL
0.1
1
10
100
1000
10000
2 4 6 8 10 12 14
Cr [
µg/L
]
pH
SR2-BGD - A SR2-BGD - BSR2-BGD - C
Scrubber Sludge ‐ Fac. B. (NO+SCR[+]+ESP,Mg Lime)
d)c)
b)a)
Figure 37. Chromium. Examples of characteristic leaching behavior as a function of pH.
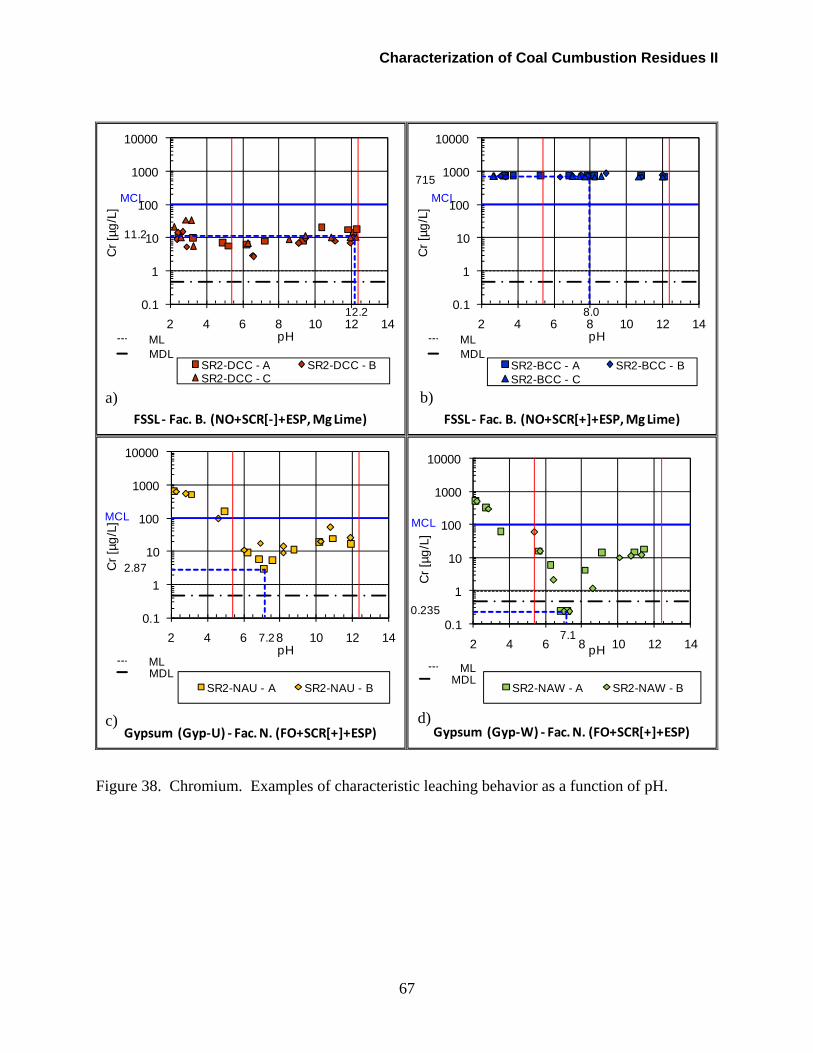
Characterization of Coal Cumbustion Residues II
67
MDLML
12.2
11.2
MCL
0.1
1
10
100
1000
10000
2 4 6 8 10 12 14
Cr [
µg/L
]
pH
SR2-DCC - A SR2-DCC - BSR2-DCC - C
FSSL ‐ Fac. B. (NO+SCR[‐]+ESP,Mg Lime)
MDLML
8.0
715MCL
0.1
1
10
100
1000
10000
2 4 6 8 10 12 14
Cr [
µg/L
]
pH
SR2-BCC - A SR2-BCC - BSR2-BCC - C
FSSL ‐ Fac. B. (NO+SCR[+]+ESP,Mg Lime)
MDLML
7.2
2.87
MCL
0.1
1
10
100
1000
10000
2 4 6 8 10 12 14
Cr [
µg/L
]
pH
SR2-NAU - A SR2-NAU - B
Gypsum (Gyp‐U) ‐ Fac. N. (FO+SCR[+]+ESP)
MDLML
7.1
0.235
MCL
0.1
1
10
100
1000
10000
2 4 6 8 10 12 14
Cr [
µg/L
]
pH
SR2-NAW - A SR2-NAW - B
Gypsum (Gyp‐W) ‐ Fac. N. (FO+SCR[+]+ESP)d)c)
b)a)
Figure 38. Chromium. Examples of characteristic leaching behavior as a function of pH.

Characterization of Coal Combustion Residues II
68
MDLML
10.3
0.255
0.1
1
10
100
1000
2 4 6 8 10 12 14
Co
[µg/
L]
pH
SR2-CFA - A SR2-CFA - BSR2-CFA - C
Fly Ash ‐ Fac. A. (NO+SNCR[‐]+FF)
MDLML
10.5
7.72
0.1
1
10
100
1000
2 4 6 8 10 12 14
Co
[µg/
L]
pH
SR2-AFA - A SR2-AFA - BSR2-AFA - C
Fly Ash ‐ Fac. A. (NO+SNCR[+]+FF)
MDLML
9.1
0.255
0.1
1
10
100
1000
2 4 6 8 10 12 14
Co
[µg/
L]
pH
SR2-DGD - A SR2-DGD - BSR2-DGD - C
Scrubber Sludge ‐ Fac. B. (NO+SCR[‐]+ESP,Mg Lime)
MDL
ML7.5
1.65
0.1
1
10
100
1000
2 4 6 8 10 12 14
Co
[µg/
L]
pH
SR2-OAU - A SR2-OAU - B
Gypsum (Gyp‐U) ‐ Fac. O. (FO+SCR[+]+ESP)
d)c)
b)a)
Figure 39. Cobalt. Examples of characteristic leaching behavior as a function of pH.

Characterization of Coal Cumbustion Residues II
69
MDLML
10.5
0.339
MCL
0.1
1
10
100
1000
2 4 6 8 10 12 14
Pb
[µg/
L]
pH
SR2-AFA - A SR2-AFA - BSR2-AFA - C
Fly Ash ‐ Fac. A. (NO+SNCR[+]+FF)
MDLML
6.8
0.354
MCL
0.1
1
10
100
1000
2 4 6 8 10 12 14
Pb
[µg/
L]
pH
SR2-AGD - A SR2-AGD - BSR2-AGD - C
Scrubber Sludge ‐ Fac. A. (NO+SNCR[+]+FF)
MDLML
8.4
0.569
MCL
0.1
1
10
100
1000
2 4 6 8 10 12 14
Pb
[µg/
L]
pH
SR2-ACC - A SR2-ACC - BSR2-ACC - C
FSSL‐ Fac. A. (NO+SCR[+]+ESP,Mg Lime)
MDLML
7.50.140
MCL
0.1
1
10
100
1000
2 4 6 8 10 12 14
Pb
[µg/
L]
pH
SR2-OAU - A SR2-OAU - B
Gypsum (Gyp‐U) ‐ Fac. O. (FO+SCR[+]+ESP)d)c)
b)a)
Figure 40. Lead. Examples of characteristic leaching behavior as a function of pH.

Characterization of Coal Combustion Residues II
70
MDLML
10.5
587DWEL
0.1
1
10
100
1000
10000
2 4 6 8 10 12 14
Mo
[µg/
L]
pH
SR2-AFA - A SR2-AFA - BSR2-AFA - C
Fly Ash ‐ Fac. A. (NO+SNCR[+]+FF)
MDLML
10.3
1956
DWEL
0.1
1
10
100
1000
10000
2 4 6 8 10 12 14
Mo
[µg/
L]
pH
SR2-DFA - A SR2-DFA - BSR2-DFA - C
Fly Ash ‐ Fac. B. (NO+SCR[‐]+FF)
MDLML
7.3
10.2
DWEL
0.1
1
10
100
1000
2 4 6 8 10 12 14
Mo
[µg/
L]
pH
SR2-CGD - A SR2-CGD - BSR2-CGD - C
Scrubber Sludge ‐ Fac. A. (NO+SNCR[‐]+FF)
MDLML
9.1
135DWEL
0.1
1
10
100
1000
2 4 6 8 10 12 14
Mo
[µg/
L]
pH
SR2-DGD - A SR2-DGD - BSR2-DGD - C
Scrubber Sludge ‐ Fac. B. (NO+SCR[‐]+ESP,Mg Lime)
d)c)
b)a)
Figure 41. Molybdenum. Examples of characteristic leaching behavior as a function of pH.
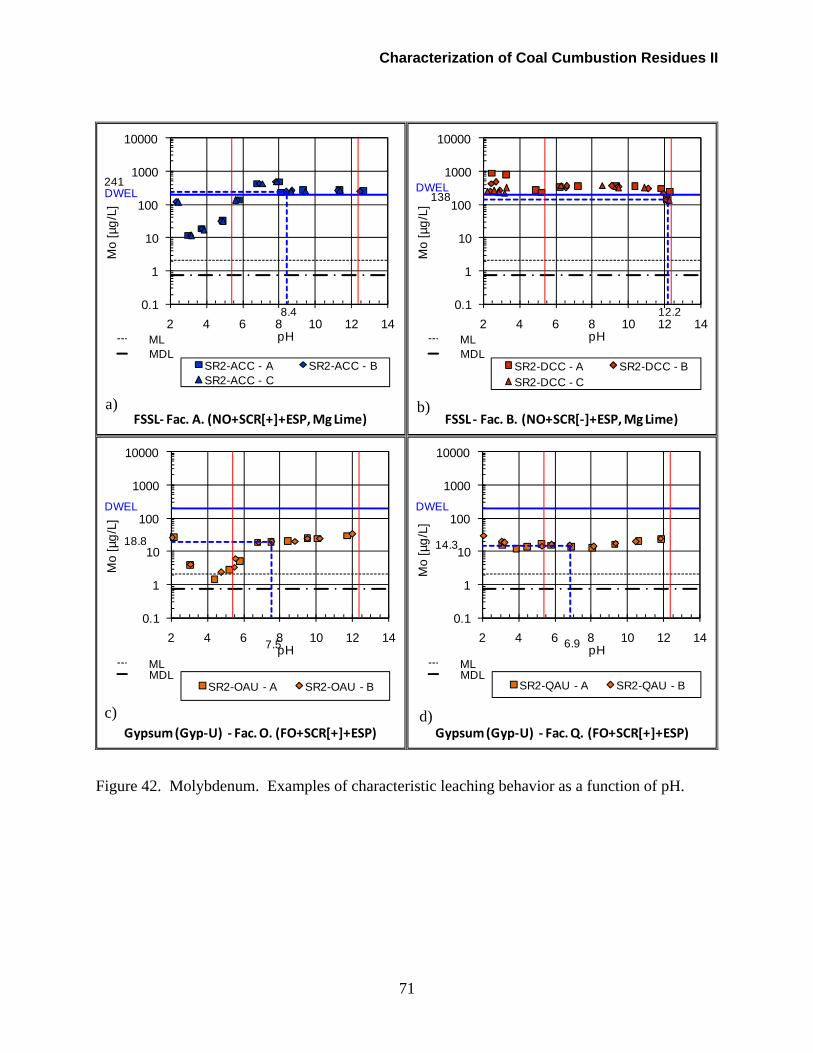
Characterization of Coal Cumbustion Residues II
71
MDLML
8.4
241DWEL
0.1
1
10
100
1000
10000
2 4 6 8 10 12 14
Mo
[µg/
L]
pH
SR2-ACC - A SR2-ACC - BSR2-ACC - C
FSSL‐ Fac. A. (NO+SCR[+]+ESP,Mg Lime)
MDLML
12.2
138DWEL
0.1
1
10
100
1000
10000
2 4 6 8 10 12 14
Mo
[µg/
L]
pH
SR2-DCC - A SR2-DCC - BSR2-DCC - C
FSSL ‐ Fac. B. (NO+SCR[‐]+ESP,Mg Lime)
MDLML
7.5
18.8
DWEL
0.1
1
10
100
1000
10000
2 4 6 8 10 12 14
Mo
[µg/
L]
pH
SR2-OAU - A SR2-OAU - B
Gypsum (Gyp‐U) ‐ Fac. O. (FO+SCR[+]+ESP)
MDLML
6.9
14.3
DWEL
0.1
1
10
100
1000
10000
2 4 6 8 10 12 14
Mo
[µg/
L]
pH
SR2-QAU - A SR2-QAU - B
Gypsum (Gyp‐U) ‐ Fac. Q. (FO+SCR[+]+ESP)d)c)
b)a)
Figure 42. Molybdenum. Examples of characteristic leaching behavior as a function of pH.
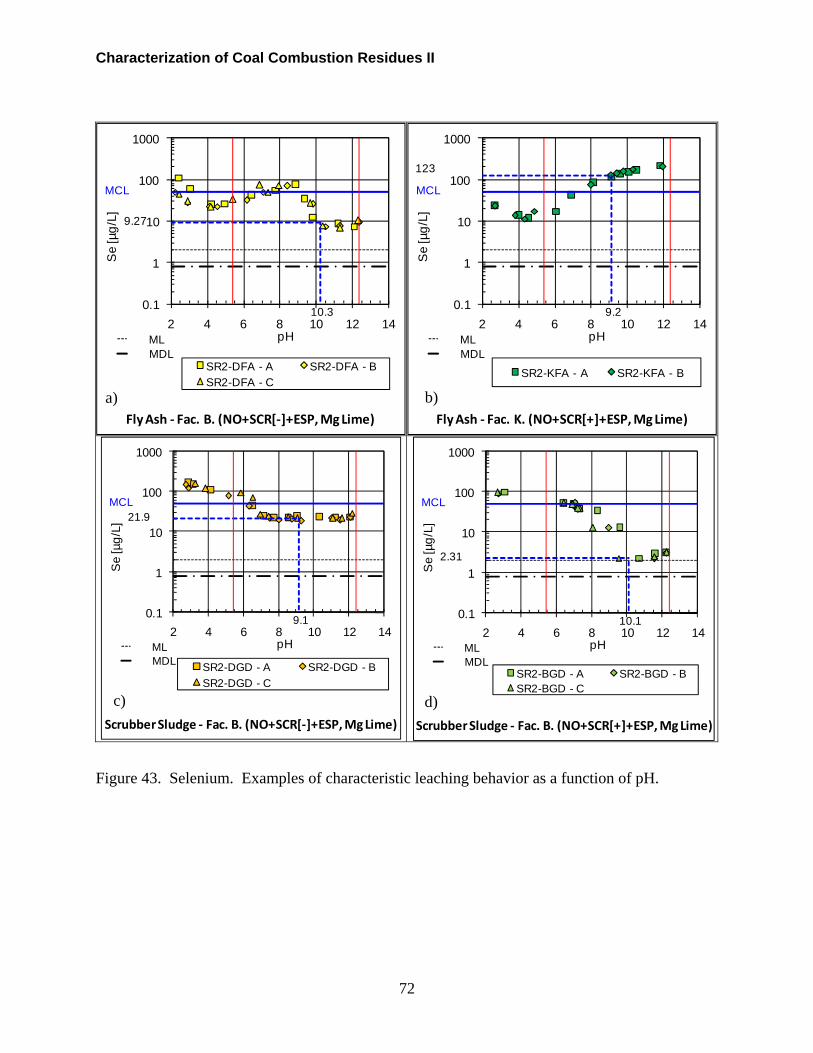
Characterization of Coal Combustion Residues II
72
MDLML
10.3
9.27
MCL
0.1
1
10
100
1000
2 4 6 8 10 12 14
Se
[µg/
L]
pH
SR2-DFA - A SR2-DFA - BSR2-DFA - C
Fly Ash ‐ Fac. B. (NO+SCR[‐]+ESP,Mg Lime)
MDLML
9.2
123
MCL
0.1
1
10
100
1000
2 4 6 8 10 12 14
Se
[µg/
L]
pH
SR2-KFA - A SR2-KFA - B
Fly Ash ‐ Fac. K. (NO+SCR[+]+ESP,Mg Lime)
MDLML
9.1
21.9MCL
0.1
1
10
100
1000
2 4 6 8 10 12 14
Se
[µg/
L]
pH
SR2-DGD - A SR2-DGD - BSR2-DGD - C
Scrubber Sludge ‐ Fac. B. (NO+SCR[‐]+ESP,Mg Lime)
MDLML
10.1
2.31
MCL
0.1
1
10
100
1000
2 4 6 8 10 12 14
Se
[µg/
L]
pH
SR2-BGD - A SR2-BGD - BSR2-BGD - C
Scrubber Sludge ‐ Fac. B. (NO+SCR[+]+ESP,Mg Lime)
d)c)
b)a)
Figure 43. Selenium. Examples of characteristic leaching behavior as a function of pH.
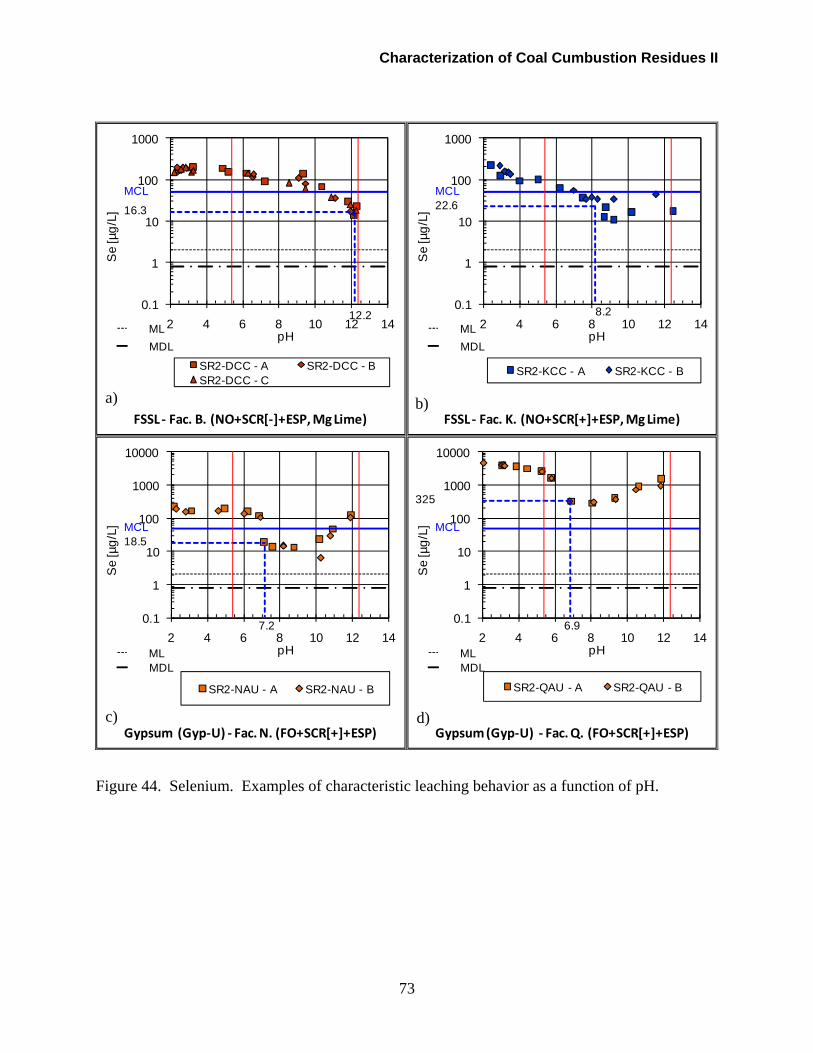
Characterization of Coal Cumbustion Residues II
73
MDLML
12.2
16.3
MCL
0.1
1
10
100
1000
2 4 6 8 10 12 14
Se
[µg/
L]
pH
SR2-DCC - A SR2-DCC - BSR2-DCC - C
FSSL ‐ Fac. B. (NO+SCR[‐]+ESP,Mg Lime)
MDLML
8.2
22.6MCL
0.1
1
10
100
1000
2 4 6 8 10 12 14
Se
[µg/
L]
pH
SR2-KCC - A SR2-KCC - B
FSSL ‐ Fac. K. (NO+SCR[+]+ESP,Mg Lime)
MDLML
7.2
18.5MCL
0.1
1
10
100
1000
10000
2 4 6 8 10 12 14
Se
[µg/
L]
pH
SR2-NAU - A SR2-NAU - B
Gypsum (Gyp‐U) ‐ Fac. N. (FO+SCR[+]+ESP)
MDLML
6.9
325
MCL
0.1
1
10
100
1000
10000
2 4 6 8 10 12 14
Se
[µg/
L]
pH
SR2-QAU - A SR2-QAU - B
Gypsum (Gyp‐U) ‐ Fac. Q. (FO+SCR[+]+ESP)d)c)
b)a)
Figure 44. Selenium. Examples of characteristic leaching behavior as a function of pH.

Characterization of Coal Combustion Residues II
74
MDLML
10.3
0.773MCL
0.1
1
10
100
1000
2 4 6 8 10 12 14
Tl [µ
g/L]
pH
SR2-DFA - A SR2-DFA - BSR2-DFA - C
Fly Ash ‐ Fac. B. (NO+SCR[‐]+ESP,Mg Lime)
MDLML
9.2
38.0
MCL
0.1
1
10
100
1000
2 4 6 8 10 12 14
Tl [µ
g/L]
pH
SR2-KFA - A SR2-KFA - B
Fly Ash ‐ Fac. K. (NO+SCR[+]+ESP,Mg Lime)
MDLML
12.2
15.6
MCL
0.1
1
10
100
1000
2 4 6 8 10 12 14
Tl [µ
g/L]
pH
SR2-DCC - A SR2-DCC - BSR2-DCC - C
FSSL ‐ Fac. B. (NO+SCR[‐]+ESP,Mg Lime)
MDLML
8.2
2.98MCL
0.1
1
10
100
1000
2 4 6 8 10 12 14
Tl [µ
g/L]
pH
SR2-KCC - A SR2-KCC - B
FSSL ‐ Fac. K. (NO+SCR[+]+ESP,Mg Lime)d)c)
b)a)
Figure 45. Thallium. Examples of characteristic leaching behavior as a function of pH.
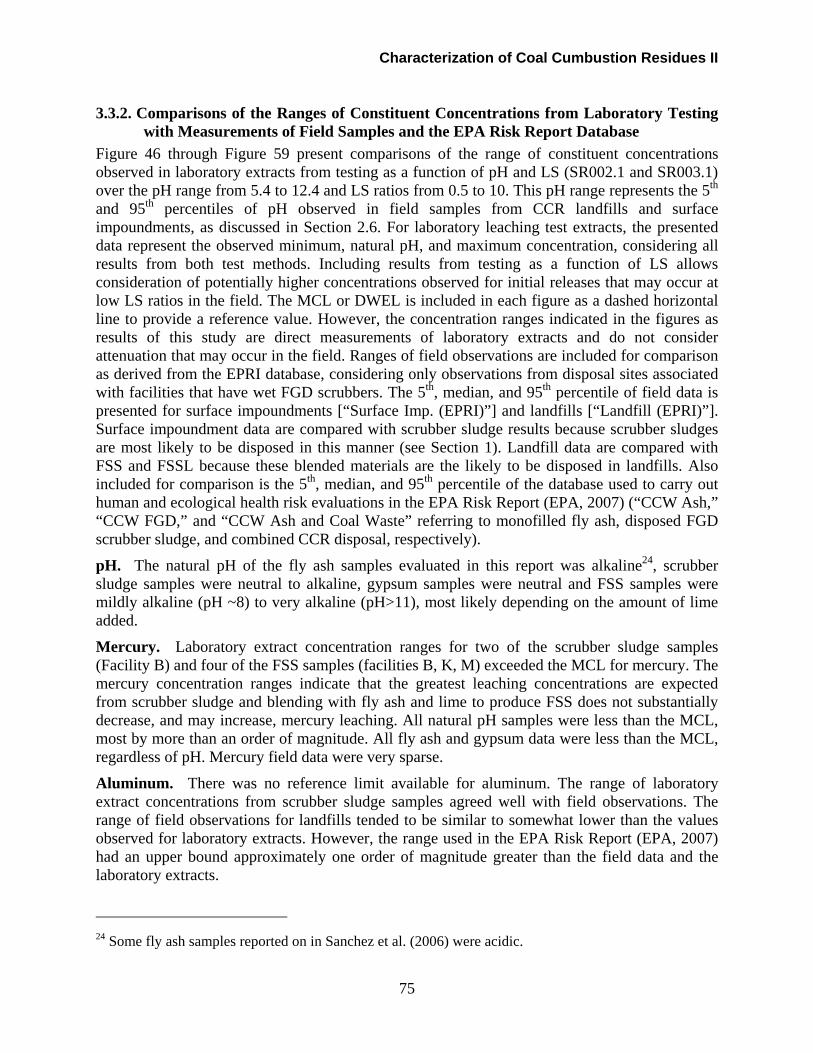
Characterization of Coal Cumbustion Residues II
3.3.2. Comparisons of the Ranges of Constituent Concentrations from Laboratory Testing with Measurements of Field Samples and the EPA Risk Report Database
Figure 46 through Figure 59 present comparisons of the range of constituent concentrations observed in laboratory extracts from testing as a function of pH and LS (SR002.1 and SR003.1) over the pH range from 5.4 to 12.4 and LS ratios from 0.5 to 10. This pH range represents the 5th
and 95th percentiles of pH observed in field samples from CCR landfills and surface impoundments, as discussed in Section 2.6. For laboratory leaching test extracts, the presented data represent the observed minimum, natural pH, and maximum concentration, considering all results from both test methods. Including results from testing as a function of LS allows consideration of potentially higher concentrations observed for initial releases that may occur at low LS ratios in the field. The MCL or DWEL is included in each figure as a dashed horizontal line to provide a reference value. However, the concentration ranges indicated in the figures as results of this study are direct measurements of laboratory extracts and do not consider attenuation that may occur in the field. Ranges of field observations are included for comparison as derived from the EPRI database, considering only observations from disposal sites associated with facilities that have wet FGD scrubbers. The 5th, median, and 95th percentile of field data is presented for surface impoundments [“Surface Imp. (EPRI)”] and landfills [“Landfill (EPRI)”]. Surface impoundment data are compared with scrubber sludge results because scrubber sludges are most likely to be disposed in this manner (see Section 1). Landfill data are compared with FSS and FSSL because these blended materials are the likely to be disposed in landfills. Also included for comparison is the 5th, median, and 95th percentile of the database used to carry out human and ecological health risk evaluations in the EPA Risk Report (EPA, 2007) (“CCW Ash,” “CCW FGD,” and “CCW Ash and Coal Waste” referring to monofilled fly ash, disposed FGD scrubber sludge, and combined CCR disposal, respectively).
pH. The natural pH of the fly ash samples evaluated in this report was alkaline24, scrubber sludge samples were neutral to alkaline, gypsum samples were neutral and FSS samples were mildly alkaline (pH ~8) to very alkaline (pH>11), most likely depending on the amount of lime added.
Mercury. Laboratory extract concentration ranges for two of the scrubber sludge samples (Facility B) and four of the FSS samples (facilities B, K, M) exceeded the MCL for mercury. The mercury concentration ranges indicate that the greatest leaching concentrations are expected from scrubber sludge and blending with fly ash and lime to produce FSS does not substantially decrease, and may increase, mercury leaching. All natural pH samples were less than the MCL, most by more than an order of magnitude. All fly ash and gypsum data were less than the MCL, regardless of pH. Mercury field data were very sparse.
Aluminum. There was no reference limit available for aluminum. The range of laboratory extract concentrations from scrubber sludge samples agreed well with field observations. The range of field observations for landfills tended to be similar to somewhat lower than the values observed for laboratory extracts. However, the range used in the EPA Risk Report (EPA, 2007) had an upper bound approximately one order of magnitude greater than the field data and the laboratory extracts.
24 Some fly ash samples reported on in Sanchez et al. (2006) were acidic.
75
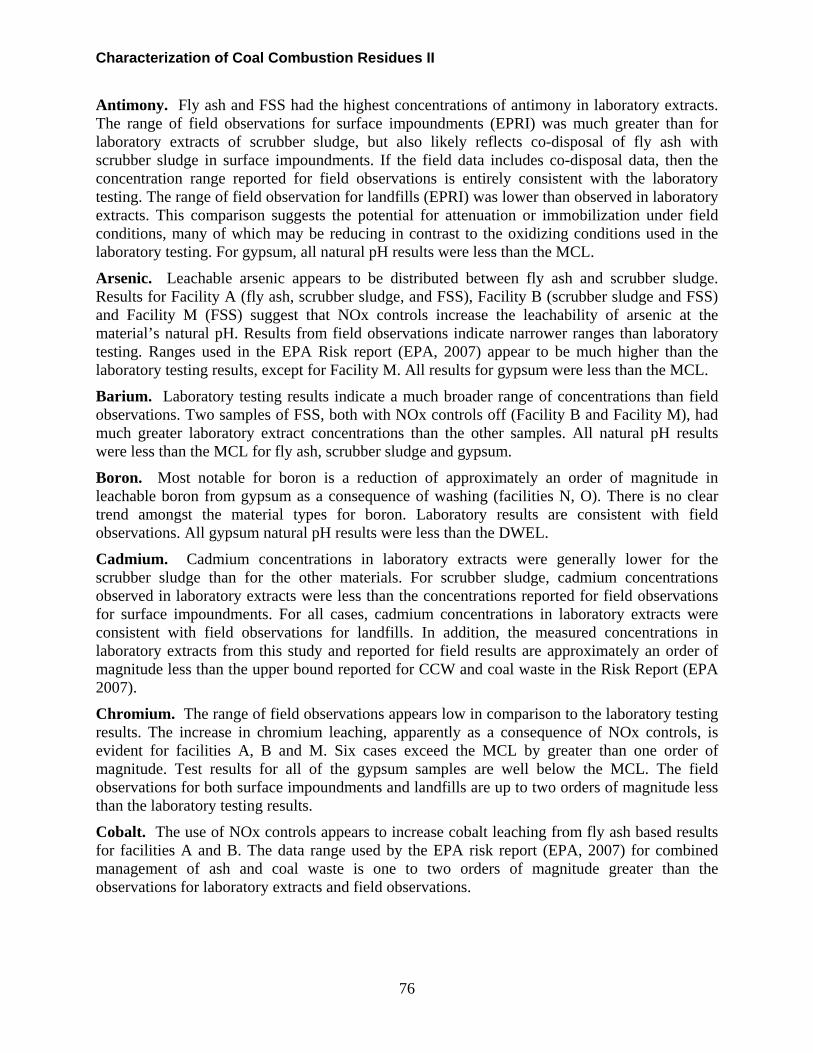
Characterization of Coal Combustion Residues II
Antimony. Fly ash and FSS had the highest concentrations of antimony in laboratory extracts. The range of field observations for surface impoundments (EPRI) was much greater than for laboratory extracts of scrubber sludge, but also likely reflects co-disposal of fly ash with scrubber sludge in surface impoundments. If the field data includes co-disposal data, then the concentration range reported for field observations is entirely consistent with the laboratory testing. The range of field observation for landfills (EPRI) was lower than observed in laboratory extracts. This comparison suggests the potential for attenuation or immobilization under field conditions, many of which may be reducing in contrast to the oxidizing conditions used in the laboratory testing. For gypsum, all natural pH results were less than the MCL.
Arsenic. Leachable arsenic appears to be distributed between fly ash and scrubber sludge. Results for Facility A (fly ash, scrubber sludge, and FSS), Facility B (scrubber sludge and FSS) and Facility M (FSS) suggest that NOx controls increase the leachability of arsenic at the material’s natural pH. Results from field observations indicate narrower ranges than laboratory testing. Ranges used in the EPA Risk report (EPA, 2007) appear to be much higher than the laboratory testing results, except for Facility M. All results for gypsum were less than the MCL.
Barium. Laboratory testing results indicate a much broader range of concentrations than field observations. Two samples of FSS, both with NOx controls off (Facility B and Facility M), had much greater laboratory extract concentrations than the other samples. All natural pH results were less than the MCL for fly ash, scrubber sludge and gypsum.
Boron. Most notable for boron is a reduction of approximately an order of magnitude in leachable boron from gypsum as a consequence of washing (facilities N, O). There is no clear trend amongst the material types for boron. Laboratory results are consistent with field observations. All gypsum natural pH results were less than the DWEL.
Cadmium. Cadmium concentrations in laboratory extracts were generally lower for the scrubber sludge than for the other materials. For scrubber sludge, cadmium concentrations observed in laboratory extracts were less than the concentrations reported for field observations for surface impoundments. For all cases, cadmium concentrations in laboratory extracts were consistent with field observations for landfills. In addition, the measured concentrations in laboratory extracts from this study and reported for field results are approximately an order of magnitude less than the upper bound reported for CCW and coal waste in the Risk Report (EPA 2007).
Chromium. The range of field observations appears low in comparison to the laboratory testing results. The increase in chromium leaching, apparently as a consequence of NOx controls, is evident for facilities A, B and M. Six cases exceed the MCL by greater than one order of magnitude. Test results for all of the gypsum samples are well below the MCL. The field observations for both surface impoundments and landfills are up to two orders of magnitude less than the laboratory testing results.
Cobalt. The use of NOx controls appears to increase cobalt leaching from fly ash based results for facilities A and B. The data range used by the EPA risk report (EPA, 2007) for combined management of ash and coal waste is one to two orders of magnitude greater than the observations for laboratory extracts and field observations.
76

Characterization of Coal Cumbustion Residues II
77
Lead. Laboratory test results indicate concentration ranges generally lower than or consistent with field observations for surface impoundments and landfills and much lower than the values used in the EPA risk report (EPA, 2007). All fly ash and gypsum samples were less than the MCL.
Molybdenum. Leachate molybdenum concentrations exceeding the DWEL by up to two orders of magnitude were observed for fly ash and FSS. Leachate molybdenum concentrations generally less than the DWEL were observed for gypsum.
Selenium. Similar ranges of selenium concentrations are expected for all materials.
Thallium. Laboratory test results indicate a concentration range in excess of two orders of magnitude for all materials and the observed concentration can exceed the MCL for thallium by more than one order of magnitude. Washed gypsum had significantly lower extract concentrations of thallium than unwashed gypsum.
4.0
5.0
6.0
7.0
8.0
9.0
10.0
11.0
12.0
13.0
14.0
Fac.
A (C
FA)
-Fa
c. A
(AFA
) +
Fac.
B (D
FA) -
Fac.
B (B
FA)
+Fa
c. K
(KFA
) +
CC
W A
sh [E
PA
]
Fac.
A (C
GD
) -
Fac.
A (A
GD
) +
Fac.
B (D
GD
) -Fa
c. B
(BG
D)
+Fa
c. K
(KG
D)
+S
urfa
ce Im
p. [E
PR
I]
Fac.
N (N
AU
) +U
Fac.
N (N
AW
) +W
Fac.
O (O
AU
) +U
Fac.
O (O
AW
) +W
Fac.
P (P
AD
) +U
Fac.
Q (Q
AU
) +U
Fac.
A (C
CC
) -
Fac.
A (A
CC
) +
Fac.
B (D
CC
) -
Fac.
B (B
CC
) +
Fac.
K (K
CC
) +
Fac.
M (M
AD
) -
Fac.
M (M
AS
) +
Land
fill [
EP
RI]
CC
W F
GD
[EP
A]
Ash
& C
oal W
aste
[E
PA
]
pH (S
I)
Fly Ash | Scrubber Sludge | Gypsum | FixatedScrubber Sludge
Nat. Ox. Nat. Ox. | I. Ox.Nat. Ox. Forced Ox.
Figure 46. Natural pH (pH in distilled water at LS=10) observed in SR02 extracts.
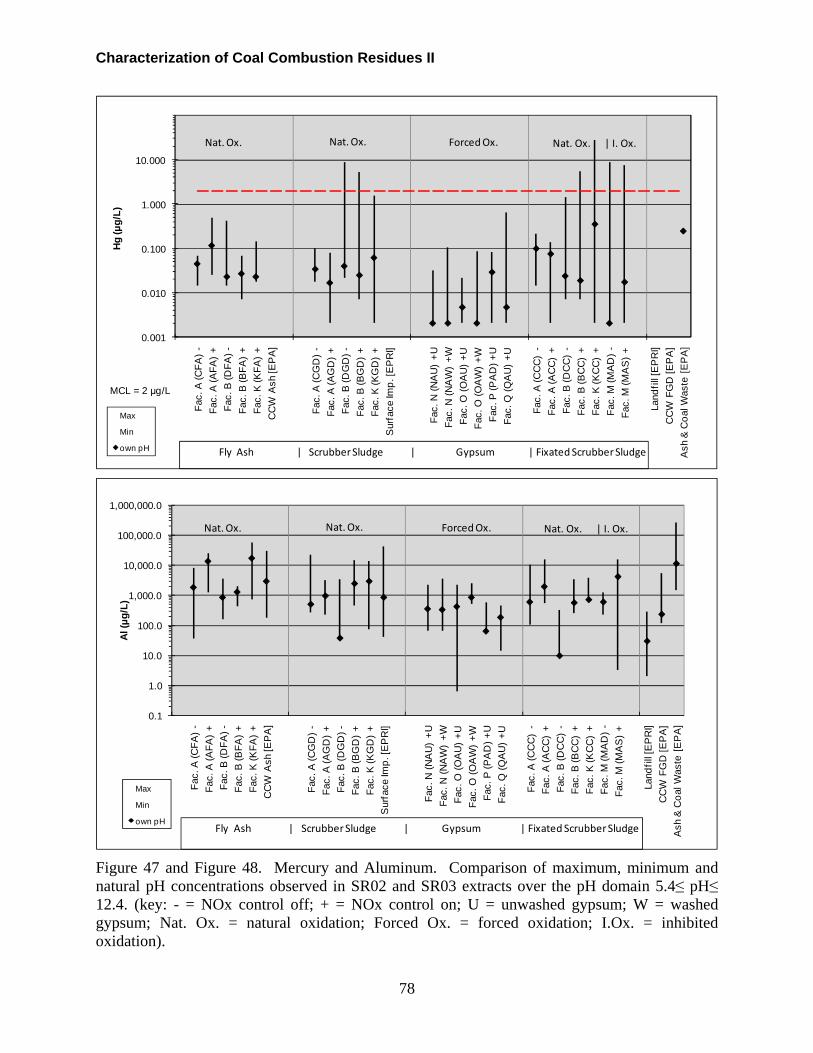
Characterization of Coal Combustion Residues II
78
0.001
0.010
0.100
1.000
10.000
Fac.
A (C
FA)
-Fa
c. A
(AFA
) +
Fac.
B (D
FA) -
Fac.
B (B
FA)
+Fa
c. K
(KFA
) +
CC
W A
sh [E
PA
]
Fac.
A (C
GD
) -
Fac.
A (A
GD
) +
Fac.
B (D
GD
) -Fa
c. B
(BG
D)
+Fa
c. K
(KG
D)
+S
urfa
ce Im
p. [E
PR
I]
Fac.
N (N
AU
) +U
Fac.
N (N
AW
) +W
Fac.
O (O
AU
) +U
Fac.
O (O
AW
) +W
Fac.
P (P
AD
) +U
Fac.
Q (Q
AU
) +U
Fac.
A (C
CC
) -
Fac.
A (A
CC
) +
Fac.
B (D
CC
) -
Fac.
B (B
CC
) +
Fac.
K (K
CC
) +
Fac.
M (M
AD
) -
Fac.
M (M
AS
) +
Land
fill [
EP
RI]
CC
W F
GD
[EP
A]
Ash
& C
oal W
aste
[E
PA
]
Hg (μ
g/L)
Max
Min
own pH
MCL = 2 μg/L
Nat. Ox. Nat. Ox. | I. Ox.Nat. Ox. Forced Ox.
Fly Ash | Scrubber Sludge | Gypsum | FixatedScrubber Sludge
0.1
1.0
10.0
100.0
1,000.0
10,000.0
100,000.0
1,000,000.0
Fac.
A (C
FA)
-Fa
c. A
(AFA
) +
Fac.
B (D
FA) -
Fac.
B (B
FA)
+Fa
c. K
(KFA
) +
CC
W A
sh [E
PA
]
Fac.
A (C
GD
) -
Fac.
A (A
GD
) +
Fac.
B (D
GD
) -Fa
c. B
(BG
D)
+Fa
c. K
(KG
D)
+S
urfa
ce Im
p. [E
PR
I]
Fac.
N (N
AU
) +U
Fac.
N (N
AW
) +W
Fac.
O (O
AU
) +U
Fac.
O (O
AW
) +W
Fac.
P (P
AD
) +U
Fac.
Q (Q
AU
) +U
Fac.
A (C
CC
) -
Fac.
A (A
CC
) +
Fac.
B (D
CC
) -
Fac.
B (B
CC
) +
Fac.
K (K
CC
) +
Fac.
M (M
AD
) -
Fac.
M (M
AS
) +
Land
fill [
EP
RI]
CC
W F
GD
[EP
A]
Ash
& C
oal W
aste
[E
PA
]
Al (μ
g/L)
Max
Min
own pHFly Ash | Scrubber Sludge | Gypsum | FixatedScrubber Sludge
Nat. Ox. Nat. Ox. | I. Ox.Nat. Ox. Forced Ox.
Figure 47 and Figure 48. Mercury and Aluminum. Comparison of maximum, minimum and natural pH concentrations observed in SR02 and SR03 extracts over the pH domain 5.4≤ pH≤ 12.4. (key: - = NOx control off; + = NOx control on; U = unwashed gypsum; W = washed gypsum; Nat. Ox. = natural oxidation; Forced Ox. = forced oxidation; I.Ox. = inhibited oxidation).

Characterization of Coal Cumbustion Residues II
79
0.1
1.0
10.0
100.0
1,000.0
Fac.
A (C
FA)
-Fa
c. A
(AFA
) +
Fac.
B (D
FA) -
Fac.
B (B
FA)
+Fa
c. K
(KFA
) +
CC
W A
sh [E
PA
]
Fac.
A (C
GD
) -
Fac.
A (A
GD
) +
Fac.
B (D
GD
) -Fa
c. B
(BG
D)
+Fa
c. K
(KG
D)
+S
urfa
ce Im
p. [E
PR
I]
Fac.
N (N
AU
) +U
Fac.
N (N
AW
) +W
Fac.
O (O
AU
) +U
Fac.
O (O
AW
) +W
Fac.
P (P
AD
) +U
Fac.
Q (Q
AU
) +U
Fac.
A (C
CC
) -
Fac.
A (A
CC
) +
Fac.
B (D
CC
) -
Fac.
B (B
CC
) +
Fac.
K (K
CC
) +
Fac.
M (M
AD
) -
Fac.
M (M
AS
) +
Land
fill [
EP
RI]
CC
W F
GD
[EP
A]
Ash
& C
oal W
aste
[E
PA
]
Sb
(μg/
L)
Max
Min
own pH
MCL = 6 μg/L
Fly Ash | Scrubber Sludge | Gypsum | FixatedScrubber Sludge
Nat. Ox. Nat. Ox. | I. Ox.Nat. Ox. Forced Ox.
0.1
1.0
10.0
100.0
1,000.0
10,000.0
100,000.0
Fac.
A (C
FA)
-Fa
c. A
(AFA
) +
Fac.
B (D
FA) -
Fac.
B (B
FA)
+Fa
c. K
(KFA
) +
CC
W A
sh [E
PA
]
Fac.
A (C
GD
) -
Fac.
A (A
GD
) +
Fac.
B (D
GD
) -Fa
c. B
(BG
D)
+Fa
c. K
(KG
D)
+S
urfa
ce Im
p. [E
PR
I]
Fac.
N (N
AU
) +U
Fac.
N (N
AW
) +W
Fac.
O (O
AU
) +U
Fac.
O (O
AW
) +W
Fac.
P (P
AD
) +U
Fac.
Q (Q
AU
) +U
Fac.
A (C
CC
) -
Fac.
A (A
CC
) +
Fac.
B (D
CC
) -
Fac.
B (B
CC
) +
Fac.
K (K
CC
) +
Fac.
M (M
AD
) -
Fac.
M (M
AS
) +
Land
fill [
EP
RI]
CC
W F
GD
[EP
A]
Ash
& C
oal W
aste
[E
PA
]
As
(μg/
L)
Max
Min
own pH
MCL = 10 μg/L
Fly Ash | Scrubber Sludge | Gypsum | FixatedScrubber Sludge
Nat. Ox. Nat. Ox. | I. Ox.Nat. Ox. Forced Ox.
Figure 49 and Figure 50. Antimony and Arsenic. Comparison of maximum, minimum and natural pH concentrations observed in SR02 and SR03 extracts over the pH domain 5.4≤ pH≤ 12.4. (key: - = NOx control off; + = NOx control on; U = unwashed gypsum; W = washed gypsum; Nat. Ox. = natural oxidation; Forced Ox. = forced oxidation; I.Ox. = inhibited oxidation).

Characterization of Coal Combustion Residues II
80
1
10
100
1,000
10,000
100,000
Fac.
A (C
FA)
-Fa
c. A
(AFA
) +
Fac.
B (D
FA) -
Fac.
B (B
FA)
+Fa
c. K
(KFA
) +
CC
W A
sh [E
PA
]
Fac.
A (C
GD
) -
Fac.
A (A
GD
) +
Fac.
B (D
GD
) -Fa
c. B
(BG
D)
+Fa
c. K
(KG
D)
+S
urfa
ce Im
p. [E
PR
I]
Fac.
N (N
AU
) +U
Fac.
N (N
AW
) +W
Fac.
O (O
AU
) +U
Fac.
O (O
AW
) +W
Fac.
P (P
AD
) +U
Fac.
Q (Q
AU
) +U
Fac.
A (C
CC
) -
Fac.
A (A
CC
) +
Fac.
B (D
CC
) -
Fac.
B (B
CC
) +
Fac.
K (K
CC
) +
Fac.
M (M
AD
) -
Fac.
M (M
AS
) +
Land
fill [
EP
RI]
CC
W F
GD
[EP
A]
Ash
& C
oal W
aste
[E
PA
]
Ba (μ
g/L)
Max
Min
own pH
MCL = 2000 μg/L
Nat. Ox. Nat. Ox. | I. Ox.Nat. Ox. Forced Ox.
Fly Ash | Scrubber Sludge | Gypsum | FixatedScrubber Sludge
1
10
100
1,000
10,000
100,000
1,000,000
Fac.
A (C
FA)
-Fa
c. A
(AFA
) +
Fac.
B (D
FA) -
Fac.
B (B
FA)
+Fa
c. K
(KFA
) +
CC
W A
sh [E
PA
]
Fac.
A (C
GD
) -
Fac.
A (A
GD
) +
Fac.
B (D
GD
) -Fa
c. B
(BG
D)
+Fa
c. K
(KG
D)
+S
urfa
ce Im
p. [E
PR
I]
Fac.
N (N
AU
) +U
Fac.
N (N
AW
) +W
Fac.
O (O
AU
) +U
Fac.
O (O
AW
) +W
Fac.
P (P
AD
) +U
Fac.
Q (Q
AU
) +U
Fac.
A (C
CC
) -
Fac.
A (A
CC
) +
Fac.
B (D
CC
) -
Fac.
B (B
CC
) +
Fac.
K (K
CC
) +
Fac.
M (M
AD
) -
Fac.
M (M
AS
) +
Land
fill [
EP
RI]
CC
W F
GD
[EP
A]
Ash
& C
oal W
aste
[E
PA
]
B (μ
g/L)
Max
Min
own pH
DWEL= 7000
Fly Ash | Scrubber Sludge | Gypsum | FixatedScrubber Sludge
Nat. Ox. Nat. Ox. | I. Ox.Nat. Ox. Forced Ox.
Figure 51 and Figure 52. Barium and Boron. Comparison of maximum, minimum and natural pH concentrations observed in SR02 and SR03 extracts over the pH domain 5.4≤ pH≤ 12.4. (key: - = NOx control off; + = NOx control on; U = unwashed gypsum; W = washed gypsum; Nat. Ox. = natural oxidation; Forced Ox. = forced oxidation; I.Ox. = inhibited oxidation).
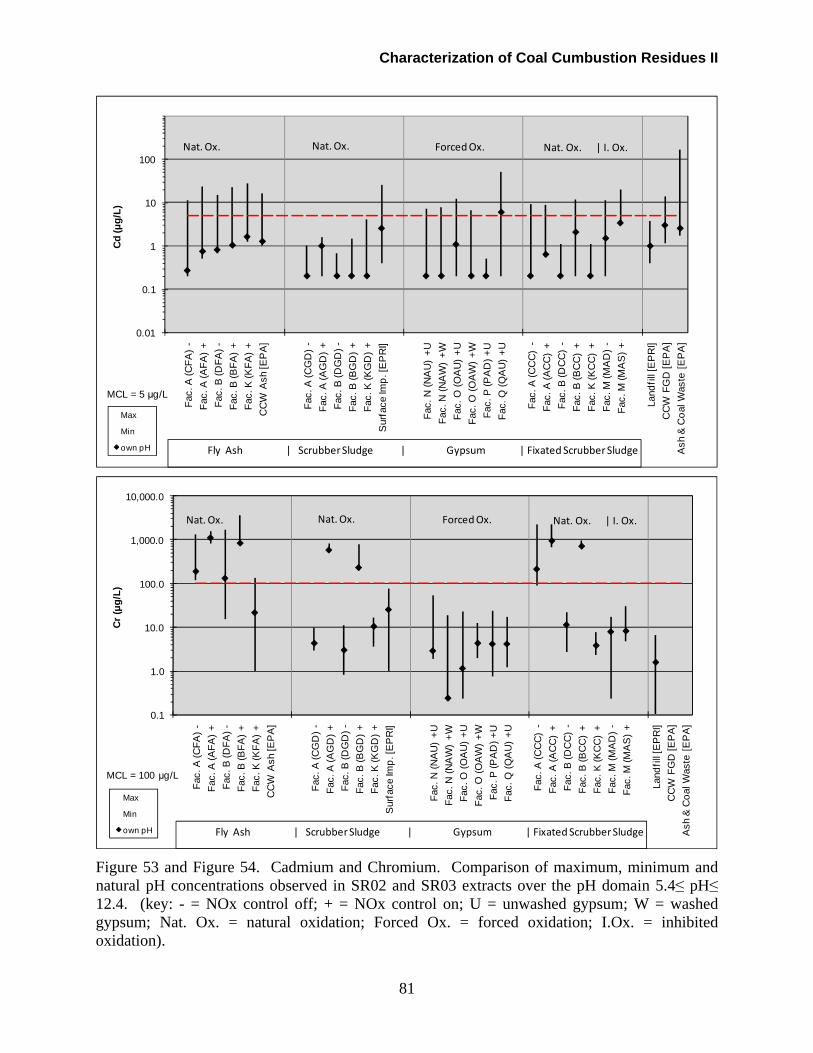
Characterization of Coal Cumbustion Residues II
81
0.01
0.1
1
10
100
Fac.
A (C
FA)
-Fa
c. A
(AFA
) +
Fac.
B (D
FA) -
Fac.
B (B
FA)
+Fa
c. K
(KFA
) +
CC
W A
sh [E
PA
]
Fac.
A (C
GD
) -
Fac.
A (A
GD
) +
Fac.
B (D
GD
) -Fa
c. B
(BG
D)
+Fa
c. K
(KG
D)
+S
urfa
ce Im
p. [E
PR
I]
Fac.
N (N
AU
) +U
Fac.
N (N
AW
) +W
Fac.
O (O
AU
) +U
Fac.
O (O
AW
) +W
Fac.
P (P
AD
) +U
Fac.
Q (Q
AU
) +U
Fac.
A (C
CC
) -
Fac.
A (A
CC
) +
Fac.
B (D
CC
) -
Fac.
B (B
CC
) +
Fac.
K (K
CC
) +
Fac.
M (M
AD
) -
Fac.
M (M
AS
) +
Land
fill [
EP
RI]
CC
W F
GD
[EP
A]
Ash
& C
oal W
aste
[E
PA
]
Cd (μ
g/L)
Max
Min
own pH
MCL = 5 μg/L
Nat. Ox. Nat. Ox. | I. Ox.Nat. Ox. Forced Ox.
Fly Ash | Scrubber Sludge | Gypsum | FixatedScrubber Sludge
0.1
1.0
10.0
100.0
1,000.0
10,000.0
Fac.
A (C
FA)
-Fa
c. A
(AFA
) +
Fac.
B (D
FA) -
Fac.
B (B
FA)
+Fa
c. K
(KFA
) +
CC
W A
sh [E
PA
]
Fac.
A (C
GD
) -
Fac.
A (A
GD
) +
Fac.
B (D
GD
) -Fa
c. B
(BG
D)
+Fa
c. K
(KG
D)
+S
urfa
ce Im
p. [E
PR
I]
Fac.
N (N
AU
) +U
Fac.
N (N
AW
) +W
Fac.
O (O
AU
) +U
Fac.
O (O
AW
) +W
Fac.
P (P
AD
) +U
Fac.
Q (Q
AU
) +U
Fac.
A (C
CC
) -
Fac.
A (A
CC
) +
Fac.
B (D
CC
) -
Fac.
B (B
CC
) +
Fac.
K (K
CC
) +
Fac.
M (M
AD
) -
Fac.
M (M
AS
) +
Land
fill [
EP
RI]
CC
W F
GD
[EP
A]
Ash
& C
oal W
aste
[E
PA
]
Cr (μ
g/L)
Max
Min
own pH
MCL = 100 μg/L
Fly Ash | Scrubber Sludge | Gypsum | Fixated Scrubber Sludge
Nat. Ox. Nat. Ox. | I. Ox.Nat. Ox. Forced Ox.
Figure 53 and Figure 54. Cadmium and Chromium. Comparison of maximum, minimum and natural pH concentrations observed in SR02 and SR03 extracts over the pH domain 5.4≤ pH≤ 12.4. (key: - = NOx control off; + = NOx control on; U = unwashed gypsum; W = washed gypsum; Nat. Ox. = natural oxidation; Forced Ox. = forced oxidation; I.Ox. = inhibited oxidation).

Characterization of Coal Combustion Residues II
82
0.1
1.0
10.0
100.0
1,000.0
10,000.0
Fac.
A (C
FA)
-Fa
c. A
(AFA
) +
Fac.
B (D
FA) -
Fac.
B (B
FA)
+Fa
c. K
(KFA
) +
CC
W A
sh [E
PA
]
Fac.
A (C
GD
) -
Fac.
A (A
GD
) +
Fac.
B (D
GD
) -Fa
c. B
(BG
D)
+Fa
c. K
(KG
D)
+S
urfa
ce Im
p. [E
PR
I]
Fac.
N (N
AU
) +U
Fac.
N (N
AW
) +W
Fac.
O (O
AU
) +U
Fac.
O (O
AW
) +W
Fac.
P (P
AD
) +U
Fac.
Q (Q
AU
) +U
Fac.
A (C
CC
) -
Fac.
A (A
CC
) +
Fac.
B (D
CC
) -
Fac.
B (B
CC
) +
Fac.
K (K
CC
) +
Fac.
M (M
AD
) -
Fac.
M (M
AS
) +
Land
fill [
EP
RI]
CC
W F
GD
[EP
A]
Ash
& C
oal W
aste
[E
PA
]
Co
(μg/
L)
Max
Min
own pH
Nat. Ox. Nat. Ox. | I. Ox.Nat. Ox. Forced Ox.
Fly Ash | Scrubber Sludge | Gypsum | Fixated Scrubber Sludge
0.01
0.10
1.00
10.00
100.00
Fac.
A (C
FA)
-Fa
c. A
(AFA
) +
Fac.
B (D
FA) -
Fac.
B (B
FA)
+Fa
c. K
(KFA
) +
CC
W A
sh [E
PA
]
Fac.
A (C
GD
) -
Fac.
A (A
GD
) +
Fac.
B (D
GD
) -Fa
c. B
(BG
D)
+Fa
c. K
(KG
D)
+S
urfa
ce Im
p. [E
PR
I]
Fac.
N (N
AU
) +U
Fac.
N (N
AW
) +W
Fac.
O (O
AU
) +U
Fac.
O (O
AW
) +W
Fac.
P (P
AD
) +U
Fac.
Q (Q
AU
) +U
Fac.
A (C
CC
) -
Fac.
A (A
CC
) +
Fac.
B (D
CC
) -
Fac.
B (B
CC
) +
Fac.
K (K
CC
) +
Fac.
M (M
AD
) -
Fac.
M (M
AS
) +
Land
fill [
EP
RI]
CC
W F
GD
[EP
A]
Ash
& C
oal W
aste
[E
PA
]
Pb (μ
g/L)
Max
Min
own pH
MCL = 15 μg/L
Fly Ash | Scrubber Sludge | Gypsum | FixatedScrubber Sludge
Nat. Ox. Nat. Ox. | I. Ox.Nat. Ox. Forced Ox.
Figure 55 and Figure 56. Cobalt and Lead. Comparison of maximum, minimum and natural pH concentrations observed in SR02 and SR03 extracts over the pH domain 5.4≤ pH≤ 12.4. (key: - = NOx control off; + = NOx control on; U = unwashed gypsum; W = washed gypsum; Nat. Ox. = natural oxidation; Forced Ox. = forced oxidation; I.Ox. = inhibited oxidation).

Characterization of Coal Cumbustion Residues II
83
0.1
1.0
10.0
100.0
1,000.0
10,000.0
100,000.0
Fac.
A (C
FA)
-Fa
c. A
(AFA
) +
Fac.
B (D
FA) -
Fac.
B (B
FA)
+Fa
c. K
(KFA
) +
CC
W A
sh [E
PA
]
Fac.
A (C
GD
) -
Fac.
A (A
GD
) +
Fac.
B (D
GD
) -Fa
c. B
(BG
D)
+Fa
c. K
(KG
D)
+S
urfa
ce Im
p. [E
PR
I]
Fac.
N (N
AU
) +U
Fac.
N (N
AW
) +W
Fac.
O (O
AU
) +U
Fac.
O (O
AW
) +W
Fac.
P (P
AD
) +U
Fac.
Q (Q
AU
) +U
Fac.
A (C
CC
) -
Fac.
A (A
CC
) +
Fac.
B (D
CC
) -
Fac.
B (B
CC
) +
Fac.
K (K
CC
) +
Fac.
M (M
AD
) -
Fac.
M (M
AS
) +
Land
fill [
EP
RI]
CC
W F
GD
[EP
A]
Ash
& C
oal W
aste
[E
PA
]
Mo
(μg/
L)
Max
Min
own pH
DWEL= 200 μg/L
Nat. Ox. Nat. Ox. | I. Ox.Nat. Ox. Forced Ox.
Fly Ash | Scrubber Sludge | Gypsum | Fixated Scrubber Sludge
1.0
10.0
100.0
1,000.0
10,000.0
Fac.
A (C
FA)
-Fa
c. A
(AFA
) +
Fac.
B (D
FA) -
Fac.
B (B
FA)
+Fa
c. K
(KFA
) +
CC
W A
sh [E
PA
]
Fac.
A (C
GD
) -
Fac.
A (A
GD
) +
Fac.
B (D
GD
) -Fa
c. B
(BG
D)
+Fa
c. K
(KG
D)
+S
urfa
ce Im
p. [E
PR
I]
Fac.
N (N
AU
) +U
Fac.
N (N
AW
) +W
Fac.
O (O
AU
) +U
Fac.
O (O
AW
) +W
Fac.
P (P
AD
) +U
Fac.
Q (Q
AU
) +U
Fac.
A (C
CC
) -
Fac.
A (A
CC
) +
Fac.
B (D
CC
) -
Fac.
B (B
CC
) +
Fac.
K (K
CC
) +
Fac.
M (M
AD
) -
Fac.
M (M
AS
) +
Land
fill [
EP
RI]
CC
W F
GD
[EP
A]
Ash
& C
oal W
aste
[E
PA
]
Se
(μg/
L)
Max
Min
own pH
MCL = 50 μg/L
Fly Ash | Scrubber Sludge | Gypsum | FixatedScrubber Sludge
Nat. Ox. Nat. Ox. | I. Ox.Nat. Ox. Forced Ox.
Figure 57 and Figure 58. Molybdenum and Selenium. Comparison of maximum, minimum and natural pH concentrations observed in SR02 and SR03 extracts over the pH domain 5.4≤ pH≤ 12.4. (key: - = NOx control off; + = NOx control on; U = unwashed gypsum; W = washed gypsum; Nat. Ox. = natural oxidation; Forced Ox. = forced oxidation; I.Ox. = inhibited oxidation).

Characterization of Coal Combustion Residues II
84
0.1
1.0
10.0
100.0
1,000.0
Fac.
A (C
FA)
-Fa
c. A
(AFA
) +
Fac.
B (D
FA) -
Fac.
B (B
FA)
+Fa
c. K
(KFA
) +
CC
W A
sh [E
PA
]
Fac.
A (C
GD
) -
Fac.
A (A
GD
) +
Fac.
B (D
GD
) -Fa
c. B
(BG
D)
+Fa
c. K
(KG
D)
+S
urfa
ce Im
p. [E
PR
I]
Fac.
N (N
AU
) +U
Fac.
N (N
AW
) +W
Fac.
O (O
AU
) +U
Fac.
O (O
AW
) +W
Fac.
P (P
AD
) +U
Fac.
Q (Q
AU
) +U
Fac.
A (C
CC
) -
Fac.
A (A
CC
) +
Fac.
B (D
CC
) -
Fac.
B (B
CC
) +
Fac.
K (K
CC
) +
Fac.
M (M
AD
) -
Fac.
M (M
AS
) +
Land
fill [
EP
RI]
CC
W F
GD
[EP
A]
Ash
& C
oal W
aste
[E
PA
]
Tl (μ
g/L)
Max
Min
own pH
MCL = 2 μg/L
Fly Ash | Scrubber Sludge | Gypsum | Fixated Scrubber Sludge
Nat. Ox. Nat. Ox. | I. Ox.Nat. Ox. Forced Ox.
Figure 59. Thallium. Comparison of maximum, minimum and natural pH concentrations observed in SR02 and SR03 extracts over the pH domain 5.4≤ pH≤ 12.4. (key: - = NOx control off; + = NOx control on; U = unwashed gypsum; W = washed gypsum; Nat. Ox. = natural oxidation; Forced Ox. = forced oxidation; I.Ox. = inhibited oxidation).

Characterization of Coal Cumbustion Residues II
4. SUMMARY OF RESULTS, CONCLUSIONS AND RECOMMENDATIONS
The following sections present conclusions from the results presented in this report.
Tables 8 through 11 summarize the results obtained from this study for fly ash, FGD gypsum, scrubber sludge, and FSS, respectively. The set of 23 CCRs evaluated in this report reflects 84 and 74 percent, respectively, of the current and future facility configuration types with acid gas scrubbers based on generating capacity, but only a limited number of facilities within each configuration type. Each table provides the following attributes, and associated ranges, related to each material type and constituent examined:
1. Total content (mg/kg, dw) from acid digestion.
2. The minimum and maximum elemental concentrations measured in laboratory leaching test extracts over the domain of 5.4≤ pH≤ 12.4 from leaching evaluation as a function of pH at LS=10 mL/g (SR002.1) and as a function of 0.5≤ LS≤ 10 mL/g dw (SR003.1). This range is intended to represent the potential range of leachate concentrations expected to be observed in the field from management of each of the material types in monofilled management conditions. Concentration ranges for individual samples of each material type are compared in Section 3.3.2.
3. The minimum and maximum elemental concentrations measured in laboratory leaching test extracts when extracted with deionized water only (“natural pH”) and 0.5≤ LS≤ 10 mL/g dw (SR003.1). The resulting pH range is also indicated.
4. The MCL or DWEL and TC (as available) for each constituent to provide reference concentrations for evaluation of the concentration results summarized as described above. However, the expected leachate concentration ranges derived directly from laboratory testing and probabilistic assessments do not include any dilution and attenuation that may occur prior to impacting water resources. Previous studies have indicated dilution and attenuation factors of as low as 2 to 10 on a national basis or as high as 8,000 at a particular site25. Thus, comparisons with the MCL, DWEL or TC for any constituent must be done with caution.
5. Variability in extract concentration as a function of pH based on results from laboratory leaching testing (SR002.1). Classification of variability is as follows: (a) Low = concentration range ≤ 1 order of magnitude, (b) Med. = concentration range of 1 to 2 orders of magnitude, (c) High = concentration range of >2 orders of magnitude.
In addition, results are emphasized through coding as follows:
1. Expected concentration values that exceed either the MCL or DWEL for the given constituent are in red bold typeface.
2. Constituents are underlined in the column heading (e.g., Cd in Table 9) when one of the expected concentration ranges exceeds either the MCL or DWEL.
25 See Section 3.3.
85

Characterization of Coal Combustion Residues II
Based on the results of testing and evaluations in this study, the following conclusions are drawn:
1. For each CCR type the following constituents exceeded either the maximum contaminant level (MCL) or drinking water equivalent level (DWEL) in at least one laboratory leaching test condition over the range of pH and LS ratios considered, and therefore potentially may present unacceptable environmental risks under some management scenarios. These cases warrant more detailed evaluation, including consideration of site-specific conditions.
a. Fly ash – antimony, arsenic, boron, cadmium, chromium, molybdenum, selenium and thallium.
b. FGD gypsum – boron, cadmium, molybdenum, selenium and thallium.
c. Scrubber sludge – mercury, antimony, arsenic, boron, chromium, lead, molybdenum, selenium and thallium.
d. Fixated scrubber sludge – mercury, antimony, arsenic barium, boron, cadmium, chromium, lead, molybdenum, selenium and thallium.
However, (i) typically, evaluation results from only a subset of samples of a given material type exceeded the indicated criteria, (ii) never did the full range reported exceed the indicated threshold, and (iii) this analysis does not account for additional dilution and attenuation processes that may occur under field management scenarios. These results suggest that (i) consideration of dilution and attenuation factors for specific management scenarios may indicate that release concentrations may be higher than exposure concentrations, and that release concentrations above the MCL or DWEL may not result in exposure concentrations above those levels; (ii) linear partition coefficients (Kds) are not appropriate for representing source term release from CCRs for a range of constituents and materials; and, (iii) evaluation of individual CCR sources may indicate that the environmental compatibility of specific types of CCRs with general management scenarios will depend on the source (reflected through leaching characteristics) of the material.
2. Leaching of individual constituents may vary over several orders of magnitude, depending on the conditions of the management scenario. Thus, these results can be used to suggest design conditions that would reduce or minimize constituent release (e.g., pH, and other conditions).
3. Leaching concentrations do not correlate with total content except for specific constituents in selected materials where the constituent (a) is weakly retained, and (b) leaching concentrations have a low variability relative to pH. Thus, total content is not a good indicator of leaching.
4. Results of this study suggest that it appears that Cr leachability is associated with the use of post-combustion NOx controls. This is based on a limited set of paired samples from the same facility operating with and with SCR or SNCR in use. This finding will be further evaluated as additional data are collected.
5. The systematic leaching behavior of COPCs observed in the range of samples evaluated suggests that the geochemical mechanisms controlling leaching can be discerned and
86

Characterization of Coal Cumbustion Residues II
quantified using geochemical speciation modeling, which in turn, can serve as the basis for evaluating and improving design of CCR management scenarios. Development of generalized geochemical speciation models for the materials evaluated in this study is recommended.
6. Ranges of concentrations of some constituents in laboratory leaching test extracts and field data included in this study suggest applicable concentration ranges for risk evaluation are different from the concentration ranges used in a recent report by USEPA (EPA, 2007). The new information reported here will help provide a more up-to-date and comprehensive dataset for future risk assessments.
87
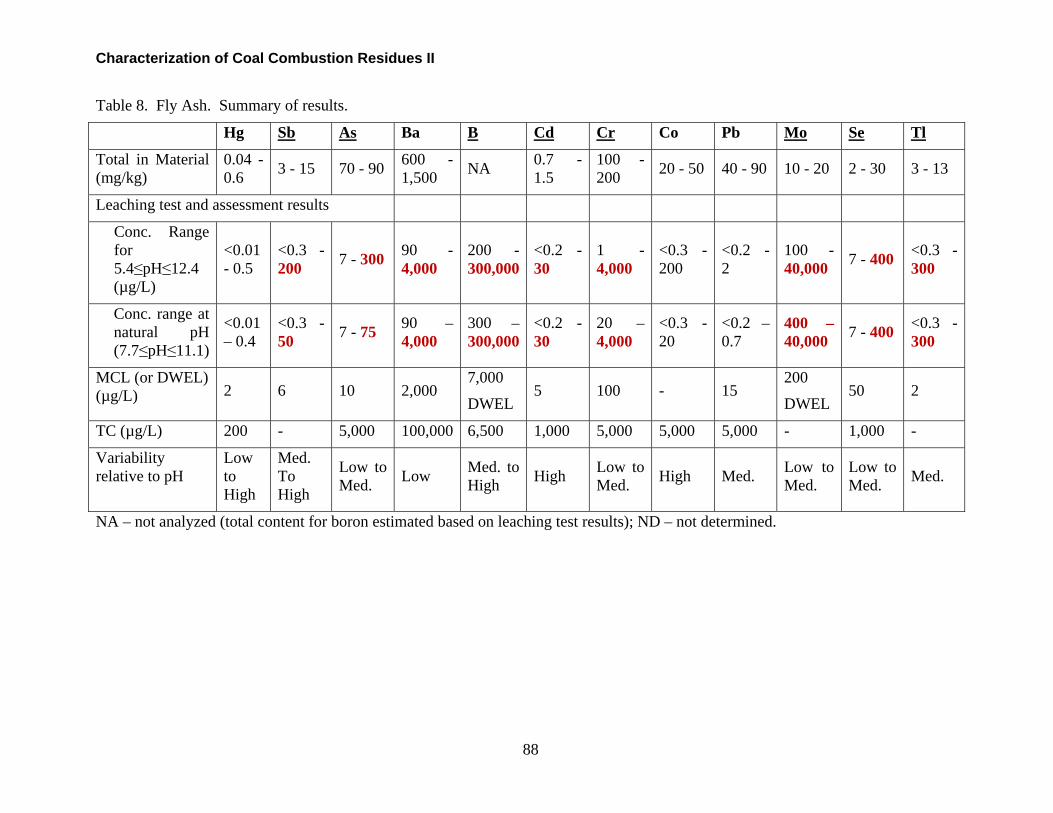
Characterization of Coal Combustion Residues II
Table 8. Fly Ash. Summary of results.
Hg Sb As Ba B Cd Cr Co Pb Mo Se Tl
Total in Material (mg/kg)
0.04 -0.6 3 - 15 70 - 90 600 -
1,500 NA 0.7 1.5
- 100 -200 20 - 50 40 - 90 10 - 20 2 - 30 3 - 13
Leaching test and assessment results
Conc. Range for 5.4≤pH≤12.4
<0.01 - 0.5
<0.3 -200 7 - 300 90 -
4,000 200 -300,000
<0.2 30
- 1 -4,000
<0.3 -200
<0.2 -2
100 -40,000 7 - 400 <0.3 -
300 (µg/L)
Conc. range at natural pH (7.7≤pH≤11.1)
<0.01 – 0.4
<0.3 -50 7 - 75 90 –
4,000 300 – 300,000
<0.2 30
- 20 – 4,000
<0.3 -20
<0.2 – 0.7
400 – 40,000 7 - 400 <0.3 -
300
MCL (or DWEL) (µg/L) 2 6 10 2,000
7,000
DWEL 5 100 - 15
200
DWEL 50 2
TC (µg/L) 200 - 5,000 100,000 6,500 1,000 5,000 5,000 5,000 - 1,000 -
Variability relative to pH
Low to High
Med. To High
Low to Med. Low Med. to
High High Low to Med. High Med. Low to
Med. Low to Med. Med.
NA – not analyzed (total content for boron estimated based on leaching test results); ND – not determined.
88

Characterization of Coal Cumbustion Residues II
Table 9. FGD Gypsum. Summary of results.
Hg Sb As Ba B Cd Cr Co Pb Mo Se Tl
Total in Material (mg/kg)
0.01 -0.5 2 - 6 2 - 4 3 - 60 NA 0.3
0.5 - 6 -20 1 - 4 1 -12 2 - 12 2 - 30 0.6 - 2
Leaching test and assessment results
Conc. Range for 5.4≤pH≤12.4 (µg/L)
<0.01 - 0.1
<0.3 -9
<0.5 -10
40 -400
40 -70,000
<0.2 50
- <0.3 -50
<0.6 -50
<0.2 -10 1 - 400 4 -
3,000 <0.3 -20
Conc. range at natural pH (3.8≤pH≤8.1)
<0.01 – 0.1
<0.3 -15
<0.5 -9
40 -150
40 – 70,000
<0.2 15
- <0.3 -20 1 - 50 <0.2 -
12 3 - 400 4 – 3,000
<0.3 -20
MCL (or DWEL where indicated) (µg/L)
2 6 10 2,000 7,000
DWEL 5 100 - 15
200
DWEL 50 2
TC (µg/L) 200 - 5,000 100,000 6,500 1,000 5,000 5,000 5,000 - 1,000 -
Variability relative to pH
Low -Med. Low Low -
Med. Low Low -Med. High Med. -
High Low Low Low Low -Med. Low
NA – not analyzed (total content for boron estimated based on leaching test results); ND – not determined.
89
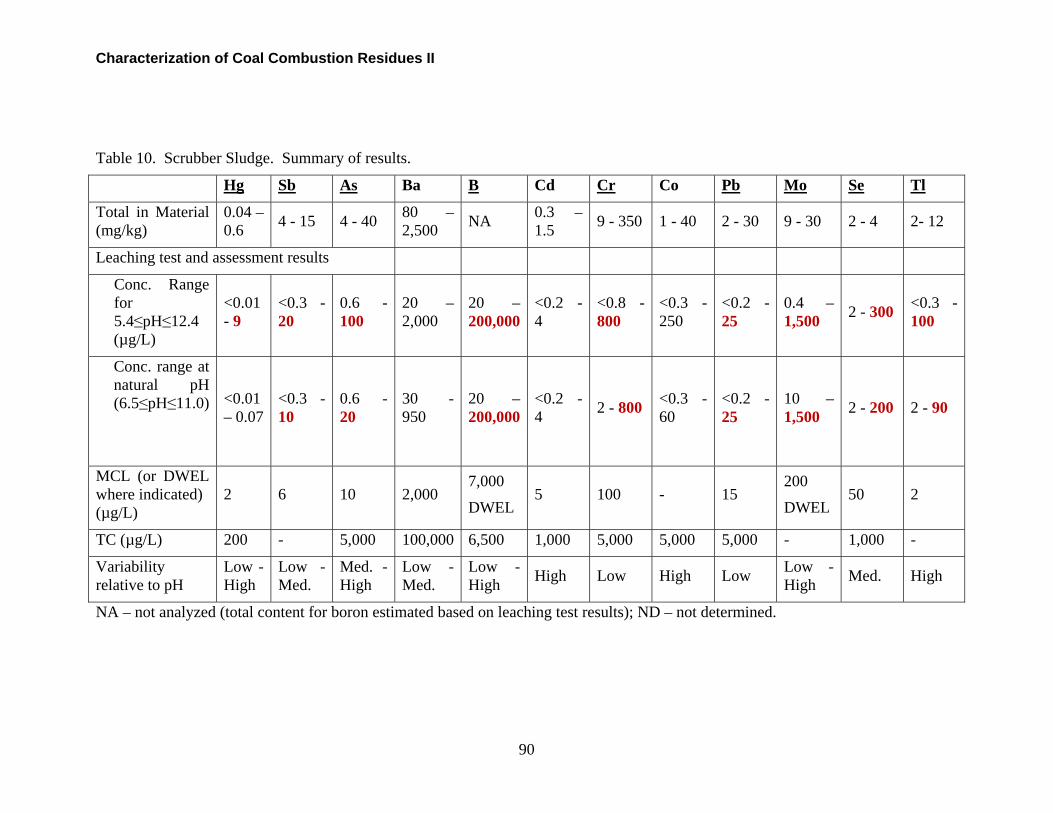
Characterization of Coal Combustion Residues II
Table 10. Scrubber Sludge. Summary of results.
Hg Sb As Ba B Cd Cr Co Pb Mo Se Tl
Total in Material (mg/kg)
0.04 – 0.6 4 - 15 4 - 40 80 –
2,500 NA 0.3 – 1.5 9 - 350 1 - 40 2 - 30 9 - 30 2 - 4 2- 12
Leaching test and assessment results
Conc. Range for 5.4≤pH≤12.4 (µg/L)
<0.01 - 9
<0.3 -20
0.6 -100
20 – 2,000
20 – 200,000
<0.2 -4
<0.8 -800
<0.3 -250
<0.2 -25
0.4 – 1,500 2 - 300 <0.3 -
100
Conc. range at natural pH (6.5≤pH≤11.0) <0.01
– 0.07 <0.3 -10
0.6 -20
30 -950
20 – 200,000
<0.2 -4 2 - 800 <0.3 -
60 <0.2 -25
10 – 1,500 2 - 200 2 - 90
MCL (or DWEL where indicated) (µg/L)
2 6 10 2,000 7,000
DWEL 5 100 - 15
200
DWEL 50 2
TC (µg/L) 200 - 5,000 100,000 6,500 1,000 5,000 5,000 5,000 - 1,000 -
Variability relative to pH
Low High
Low -Med.
Med. -High
Low -Med.
Low -High High Low High Low Low -
High Med. High
NA – not analyzed (total content for boron estimated based on leaching test results); ND – not determined.
90

Characterization of Coal Cumbustion Residues II
Table 11. Fixated Scrubber Sludge. Summary of results.
Hg Sb As Ba
B
Cd Cr Co Pb Mo Se Tl
Total in Material (mg/kg)
0.02 -1.0 5 - 20 3 - 70 80 -
1,000 NA 0.7 - 2 40 -150 2 - 50 4 - 100 9 - 30 2 - 30 0.8 - 8
Leaching test and assessment results
Conc. Range for 5.4≤pH≤12.4 (µg/L)
<0.01 - 30
<0.3 -200
0.5 -4,000
9 -10,000
6 -200,000
<0.2 -20
<0.3 -2,000
<0.3 150
- <0.2 -50
10 -40,000
9 -1,000 2 - 100
Conc. range at natural pH (5.8≤pH≤12.3)
<0.01 – 0.7
<0.3 -60
0.5 – 4,000
15 – 10,000
100 – 200,000
<0.2 -20
<0.3 – 2,000
<0.3 50
- <0.2 -50
10 – 40,000 9 - 500 3 - 50
MCL (or DWEL where indicated) (µg/L)
2 6 10 2,000 7,000
DWEL 5 100 - 15
200
DWEL 50 2
TC (µg/L) 200 - 5,000 100,000 6,500 1,000 5,000 5,000 5,000 - 1,000 -
Variability relative to pH
Low -High
Low -High
Med -High
Low -Med. High Low -
High Low High Low Low Low -Med.
Low -Med.
NA – not analyzed (total content for boron estimated based on leaching test results); ND – not determined.
91
Characterization of Coal Combustion Residues II
5. REFERENCES
ACAA (American Coal Ash Association), 2007. 2006 Coal Combustion Product (CCP) Production and Use Survey. http://www.acaa-usa.org/CCPSurveyShort.htm (accessed May 2008).
ASTM, 2002. Method D 6784-02, “Standard Test Method for Elemental, Oxidized, Particle-Bound, and Total Mercury in Flue Gas Generated from Coal-Fired Stationary Sources (Ontario-Hydro Method).” American Society for Testing and Materials, 2002.
Clean Air Mercury Rule. Code of Federal Regulations, 70 FR 28606; May 18, 2005.
Clean Air Interstate Rule. Code of Federal Regulations, 70 FR 25162; May 12, 2005.
DOE-EIA (Official Energy Statistics from the U.S. Government - Energy Information Administration), 2007. Annual Energy Outlook 2007 with Projections to 2030. http://www.eia.doe.gov/oiaf/aeo/index.html (accessed November 2007).
Duong, D. Do., 1998. Adsorption Analysis: Equilibria and Kinetics, London: Imperial College Press, 1998, 892 p.
EPA, 1988. Report to Congress – Wastes from the Combustion of Coal by Electric Utility Power Plants, EPA/530-SW-88-002. Washington, DC: U.S. Environmental Protection Agency, Office of Solid Waste and Emergency Response, 1988.
EPA, 1996. Method 3052, “Microwave Assisted Acid Digestion of Siliceous and Organically Based Matrices.” Test Methods for Evaluating Solid Waste, Physical/Chemical Methods (SW846). U.S. Environmental Protection Agency, 1996.
EPA, 1998a. Method 7470A, “Mercury in Liquid Waste (Manual Cold-Vapor Technique).” Test Methods for Evaluating Solid Waste, Physical/Chemical Methods (SW-846). U.S. Environmental Protection Agency, 1998.
EPA, 1998b. Method 7473, “Mercury in Solids and Solutions by Thermal Decomposition, Amalgamation, and Atomic Absorption Spectrophotometry.” Test Methods for Evaluating Solid Waste, Physical/Chemical Methods (SW-846). U.S. Environmental Protection Agency, 1998.
EPA, 1999. Report to Congress-Wastes from the Combustion of Fossil Fuels: Volume 2-Methods, Findings and Recommendations, EPA 530-R-99-010. Washington, DC: U.S. Environmental Protection Agency, Office of Solid Waste and Emergency Response, 1999.
EPA, 2000. Characterization and evaluation of landfill leachate, Draft Report. 68-W6-0068. U.S. Environmental Protection Agency, September 2000.
Kilgroe, J., C. Sedman, R. Srivastava, J. Ryan, C.W. Lee, S. Thorneloe, 2001. Control of Mercury Emissions from Coal-Fired Electric Utility Boilers: Interim Report, EPA-600/R-01109, Dec. 2001.
EPA, 2002. Characterization and Management of Residues from Coal-Fired Power Plants, Interim Report, EPA-600/R-02-083. U.S. Environmental Protection Agency, December 2002.
EPA, 2003. Technical Support Document for the Assessment of Detection and Quantitation Approaches. U.S. Environmental Protection Agency, 2003. Available at http://epa.gov/waterscience/methods/det/index.html. (accessed June 2008).
92

Characterization of Coal Cumbustion Residues II
EPA, 2005. Control of Mercury Emissions from Coal Fired Electric Utility Boilers: An Update. Air Pollution Prevention and Control Division, National Risk Management Research Laboratory, Office of Research and Development, U.S. Environmental Protection Agency, Research Triangle Park, NC, Feb 18, 2005. http://www.epa.gov/ttn/atw/utility/ord_whtpaper_hgcontroltech_oar-2002-0056-6141.pdf (accessed May 5, 2005).
EPA, 2006. 2006 Edition of the Drinking Water Standards and Health Advisories. EPA 822-R06-013 (updated August, 2006). Office of Water, U.S. Environmental Protection Agency. Washington, DC.
EPA, 2007. Human and Ecological Risk Assessment of Coal Combustion Wastes. Docket # EPA-HQ-RCRA-2006-0796; Docket Item# EPA-HQ-RCRA-2006-0796-0009. Released as part of notice of data availability on August 29, 2007; http://www.epa.gov/epaoswer/other/fossil/noda07.htm.
EPRI, 2005. Personal communication of Electric Power Research Institute (EPRI) leaching database (as of June 2005); summary information from K. Ladwig to D. Kosson.
EPRI, 2006, Characterization of Field Leachates at Coal Combustion Product Management Sites: Arsenic, Selenium, Chromium, and Mercury Speciation, EPRI Report Number 1012578. Electric Power Research Institute (EPRI), Palo Alto, CA and U.S. Department of Energy, Pittsburgh, PA, 2006.
Hensel, B., 2006. Sampling and Analysis Plan for Plant 14090, EPRI SAP1674. Electric Power Research Institute (EPRI), 2006.
Hutson, N.D., 2008. Mercury Capture on Fly Ash and Sorbents: The Effects of Coal Properties and Combustion Conditions, Water Air Soil Pollut: Focus (2008) 8:323-331.
Kilgroe, J., C. Sedman, R. Srivastava, J. Ryan, C.W. Lee, S. Thorneloe. Control of Mercury Emissions from Coal-Fired Electric Utility Boilers: Interim Report, EPA-600/R-01-109, Dec. 2001.
Kosson, D. S., H. A. van der Sloot, F. Sanchez, and A. C. Garrabrants, 2002. An Integrated Framework for Evaluating Leaching in Waste management and Utilization of Secondary materials. Environmental Engineering Science 19(3):159-204 (2002).
Laudal, D.L., J.S. Thompson, C.A. Wocken (2004) Selective Catalytic Reduction Mercury Field Sampling Project, EPA-600/R-04-147, November 2004.
Ladwig, K. Personal communication, Nov. 15, 2007.
MTI (McDermott Technology, Inc.), 2001. Mercury Emissions Predictions. http:// www.mtiresearch.com/aecdp/mercury.html#Coal%20Analyses%20and%20Mercury%20Emissio ns%20Predictions (accessed November 2002).
Munro, L. J., K. J. Johnson, and K. D. Jordan, 2001. An interatomic potential for mercury dimmer. Journal of Chemical Physics 114(13): 5545-5551 (2001).
Rudzinski, W., W. A. Steele, and G. Zgrablich, 1997. Equilibria and dynamics of gas adsorption on heterogeneous solid surfaces, Amsterdam: Elsevier, 1997.
Ruthven, D. M., 1984. Principles of Adsorption and Adsorption Processes, New York: Wiley, 1984, 433 p.
93
Characterization of Coal Combustion Residues II
Pavlish, J. H., E. A. Sondreal, M. D. Mann, E. S. Olson, K. C. Galbreath, D. L. Laudal, and S. A Benson, 2003. Status Review of Mercury Control Options for Coal-Fired Power Plants. Fuel Processing Technology 82: 89-165 (2003).
SAB (EPA Science Advisory Board, Environmental Engineering Committee), 2003. “TCLP Consultation Summary.” Presented at the Science Advisory Board (SAB) Environmental Engineering Committee consultation with U. S. Environmental Protection Agency, Washington, D.C., June 17-18, 2003.
Sanchez, F., and D. S. Kosson, 2005. Probabilistic approach for estimating the release of contaminants under field management scenarios. Waste Management 25(5), 643-472 (2005).
Sanchez, F., R. Keeney, D. S. Kosson, and R. Delapp, 2006. Characterization of Mercury-Enriched Coal Combustion Residues from Electric Utilities Using Enhanced Sorbents for Mercury Control, EPA-600/R-06/008. Prepared for the U.S. Environmental Protection Agency – Air Pollution Prevention and Control Division, Contract No. EP-C-04-023, Work Assignment 131, February 2006. www.epa.gov/nrmrl/pubs/600r06008/600r06008.pdf
Srivastava, R.K., W. Jozewicz, 2001. Flue Gas Desulfurization: The State of the Art. Journal of Air and Waste Management 51, 1676-1688.
Srivastava, R.K., N. Hutson, B. Martin, F. Princiotta, J. Staudt, 2006. Control of Mercury Emissions from Coal-Fired Electric Utility Boilers, Environmental Science & Technology, 41, 1385.
Thorneloe, S., 2003. “Application of Leaching Protocol to Mercury-Enriched Coal Combustion Residues”, Presentation to the U. S. Environmental Protection Agency (EPA) Science Advisory Board (SAB), Environmental Engineering Committee, Washington, D.C., June 17, 2003.
Thorneloe, S., 2006. Evaluating Life-Cycle Environmental Tradeoffs from the Management of Coal Combustion Residues Containing Mercury and Other Metals, Thesis for Masters of Environmental Management, Nicholas School of the Environment and Earth Sciences, Duke University, May 2006.
Thorneloe, S., D. Kosson, F. Sanchez, B. Khan, P. Kariher, 2008. Improved Leach Testing for Evaluating the Fate of Mercury and Other Metals from Management of Coal Combustion Residues, Proceedings for the Global Waste Management Symposium, Copper Mountain Conference Center, Colorado, USA, Sept 7-10, 2008.
Vidic, R.D., 2002. Combined Theoretical and Experimental Investigation of Mechanisms and Kinetics of Vapor-Phase Mercury uptake by Carbonaceous Surfaces, Final Report. Grant No. DE-FG26-98FT40119 to U. S. Department of Energy (DOE), National Energy Technology Laboratory, 2002.
Wang, J., Wang, T., Mallhi, H., Liu, Y., Ban, H. and Ladwig, K., 2007. The role of ammonia on mercury leaching from coal fly ash. Chemosphere 69:1586-1592.
94