US EPA-Pesticides; Pyrasulfotole | US EPA ARCHIVE DOCUMENT
43
Transcript of US EPA-Pesticides; Pyrasulfotole | US EPA ARCHIVE DOCUMENT


Data Evaluation Report on the adsorption-desorption of pyrasulfotole (AE 0317309) in soil
PMRA Submission Number 2006-2445 EPA MRID Number 46801 703
Data Requirement: PMRA Data Code: 8.2.4.2 EPA DP Barcode: D328639 OECD Data Point: IIA 7.4.1 EPA Guideline: 8 163- 1
Test material: Common name: Pyrasulfotole. Chemical name:
IUPAC name:
CAS name:
CAS No.: Synonyms:
Smiles string:
(5-Hydroxy- l,3-dimethylpyrazol-4-yl)(a,a,a-trMuoro-2-mesy1-p- to1yl)methanone. (5-H ydroxy- l,3-dimethyl-l H-pyrazol-4-yl)(2-mesyl-4- trifluoromethy1phenyl)methanone. (5-Hydroxy- 1,3-dimethyl-1 H-pyrazol-4-yl)[2-methylsulfony1)- 4(trifluoromethyl)phenyl]methanone. Methanone, (5-hydroxy- 1,3 -dimethyl- 1 H-pyrazol-4-yl)[2- (methylsulfony1)-4-(tri fluoromethyl)phenyl]. 365400-1 1-9. AE 03 17309; K-1196; K-1267. FC(c1 cc(c(cc 1)C(=O)c1 c(n(nc1 C)C)O)S(=O)(=O)C)(F)F (ISIS v2.3/Universal SMILES). No EPI Suite, v3.12 SMILES String found as of 6/7/06. Ccl nn(C)c(O)cl C(=O)c2ccc(C(F)(F)F)cc2S(C)(=O)=O. CS(=O)(=O)c 1 c(ccc(c 1 )C(F)(F)F)C(=O)c 1 c(n(nc 1 C)C)O.
Primary Reviewer: Kindra Bozicevich Signature: Cambridge Environmental Date: 6/14/06
Secondary Reviewer: Joan Harlin Signature: Cambridge Environmental Date: 6/14/06
QCfQA Manager: Joan Gaidos Signature: Cambridge Environmental Date: 6/14/06
Final Reviewer: Marietta Echeverria Signature: EPA Reviewer Date: //23/" 7
Find Reviewer: JD Whall (Officer # 1268) Date: Signature:/?)*
PMRA Reviewer ~//6/o 7 Final Reviewer: Olga Braga Signature: c.L,&~- , , ; DEH Reviewer Date:
34 jol /&fW
TEXT SEARCHABLE DOCUMENT

Data Evaluation Report on the adsorption~d6~6lptidn of pyrasulfotole (AE 0317309) in soil
PMRA Submission Number 2006-2445 EPA MRID Number 46801703
Company Code: BCZ Active Code: PSA Use Site Category: 13,14 EPA PC Code: 000692
CITATION: Maurer, T., U. Eyrich, and R. Fliege. 2003. Adsorptionldesorption of AE 03 17309 on five soils and one sediment. Unpublished study performed by Bayer CropScience GmbH, Franfurt am Main, Germany; sponsored and submitted by Bayer CropScience, USA. Laboratory Project ID CP 02/014. Study start date July 09,2002, and completion date October 3 1,2002 (p. 6). Final report issued September 26,2003.
Page 2 of 3 1

Data Evaluation Report on the adsorptidn-d3s6rptiJon of pyrasulfotole (AE 0317309) in soil
PMRA Submission Number 2006-2445 EPA MRID Number 46801 703
EXECUTIVE SUMMARY
The adsorptioddesorption characteristics of [pyrazole-3-14~]-labeled (5-hydroxy-1,3- dimethylpyazol-4-yl)(a,a,a-trifluoro-2-mesyl-p-tolyl)methanone. (pyrasulfotole; AE 03 1 73 09) were studied in definitive experiments using three US soils: a silt loam [HCB, pH 7.7, organic carbon 4.7%], a loamy sand [Pikeville, pH 6.4, organic carbon 1.2%], and a silt loam [Carlyle, pH 5.2, organic carbon 1.5%]; two German soils: a clay loam [CLGS, pH 7.5, organic carbon 1.7%] and a sandy loam [SL2.3, pH 6.7, organic carbon 1.1 %I; and a Geman sandy loam sediment [Nidda, pH 5.8, organic carbon 4.6%], in a batch equilibrium experiment. The experiment was conducted in accordance with the USEPA Guidelines for Pesticides Registration, Subdivision N 5 163-1, and in compliance with OECD Good Laboratory Practices. The adsorption phase of the study was carried out by equilibrating air-dried soils with [pyrazole-3- 14~]pyrasulfotole at actual test concentrations of ca. 0.0057,0.0124,0.0418,0.1235, and 0.4275 mg a.i./kg soil for the HCB silt loam, Pikeville loamy sand, CL6S clay loam, SL2.3 sandy loam soils; ca. 0.0285,0.0618,0.209,0.6175, and 2.1375 mg a.i./kg soil for the Carlyle silt loam soil; and ca. 0.1 14,0.247,0.836,2.47, and 8.55 mg a.i.lkg soil for the Nidda sandy loam sediment. The samples were shaken in the dark at ambient temperature for 24 hours. The equilibrating solution used was 0.01 M CaCl;! solution, with soil/solution ratios ranging fkom 1 : 1 to 20 (w:v) for all test soils. The desorption phase of the study was carried out by replacing the adsorption solution with an equivalent volume of pesticide-fiee 0.01M CaC12 solution and equilibrating in the dark at ambient temperature for 24 hours. For all test soils, two desorption cycles were conducted for the desorption phase.
The supernatant after adsorption and desorption was separated by centrifugation, and aliquots were analyzed for total radioactivity using LSC. Following the second desorption cycle, the soils were homogenized and analyzed for total radioactivity using LSC following combustion. Samples were not analyzed for pyrasulfotole or its transformation products.
The incubation temperature during the study was maintained at ambient temperature; no supporting information was provided. The pH values of the supernatant solutions during the adsorption and desorption phases were not reported. LSC analysis of application control samples without soil (three samples per soil type and test concentration), concurrently run with each definitive test series, verified application accuracy and lack of test material adsorption to the glass test containers; >98% of the applied radioactivity was recovered in the application control solutions.
Mass balances at the end of the adsorption phase were not reported. Mean mass balances at the end of the desorption phase averaged 95.3% (range 93.3-97.3%), 96.6% (range 93.9-99.3%), 95.0% (range 93.6-96.3%), 98.5% (range 98.3-98.7%), 98.8% (range 98.7-99.0%), and 100.6% (range 100.4-1 00.7%) of the applied for the HCB silt loam, Pikeville loamy sand, CL6S clay loam, SL2.3 sandy loam, and Carlyle silt loam soils, and the Nidda sandy loam sediment, respectively.
Page 3 of 31

Data Evaluation Report on the adsorptiirn~dbsar#tibh of pyrasulfotole (AE 0317309) in soil
PMRA Submission Number 2006-2445 EPA MRID Number 4680 1703
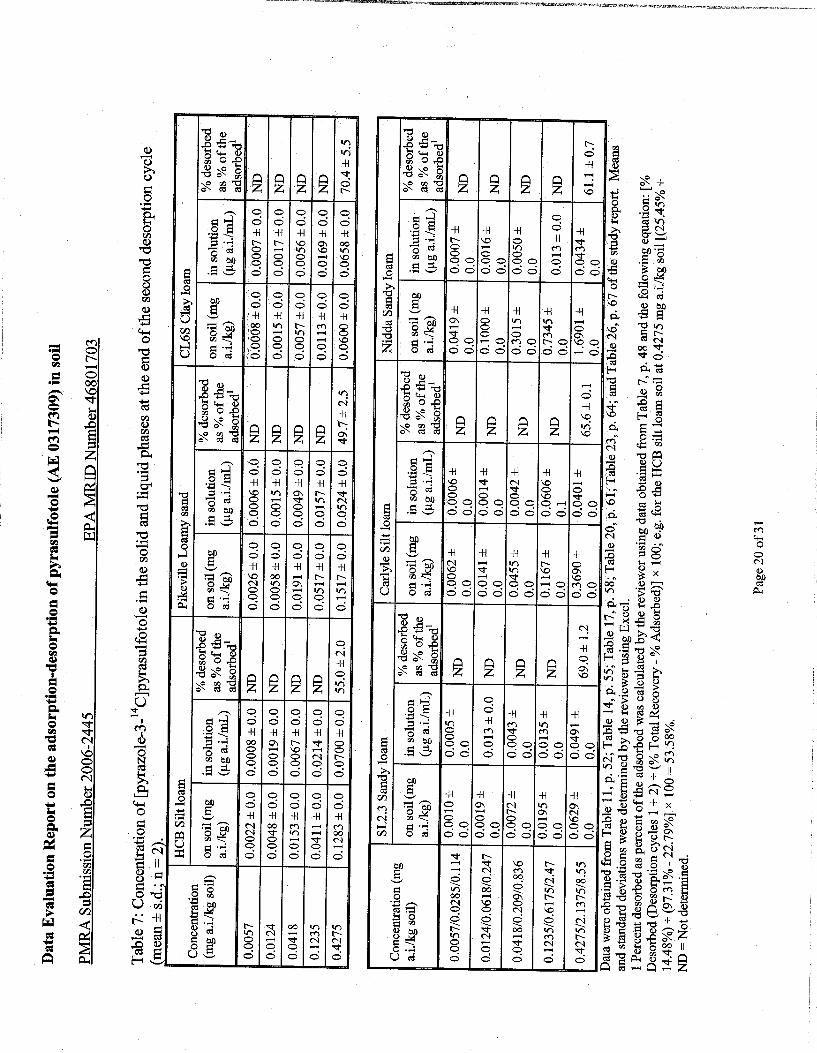
After 24 hours of equilibration, 55.7-63.3%, 60.3-71.0%, 26.4-32.3%, 30.1-35.2%, 43.9-52.2%, and 50.4-73.5% of the applied [14~]pyrasulfotole was adsorbed to the HCB silt loam, Pikeville loamy sand, CL6S clay loam, SL2.3 sandy loam, and Carlyle silt loam soils, and the Nidda sandy loam sediment, respectively (reviewer-calculated). Registrant-calculated adsorption & values averaged 1.32, 1.77,0.367, 0.47,4.25, and 32.9 for the HCB silt loam, Pikeville loamy sand, CL6S clay loam, SL2.3 sandy loam, and Carlyle silt loam soils, and the Nidda sandy loam sediment, respectively; corresponding adsorption &, values averaged 28.1, 148,21.6,42.7,283, and 715. Registrant-calculated Freundlich adsorption KF values were 0.980, 1.20, 0.341,0.386, 3.20, and 15.9 for the HCB silt loam, Pikeville loamy sand, CL6S clay loam, SL2.3 sandy loam, Carlyle silt loam soils, and the Nidda sandy loam sediment, respectively; corresponding Freundlich adsorption KFoc values were 20.8, 100,20.0,35.1,213, and 345. At the end of the ~ desorption phase, 55.0%, 49.7%, 70.4% 69.0% 65.6%, and 61.1% of the applied [pyrazole-3- I
14~]pyrasulfotole desorbed fi-om the HCB silt loam, Pikeville loamy sand, CL6S clay loam, SL2.3 sandy loam, and Carlyle silt loam soils, and the Nidda sandy loam sediment, respectively (reviewer-calculated). Registrant-calculated desorption I& values averaged 2.26,3.67,0.923, 1.51, 10.4, and 56.6 for the HCB silt loam, Pikeville loamy sand, CL6S clay loam, SL2.3 sandy loam, and Carlyle silt loam soils, and the Nidda sandy loam sediment, respectively; corresponding adsorption K, values averaged 48.2,306,54.3, 137,696, and 1230. Registrant- calculated Freundlich desorption KF values were 1.37,2.30,0.678, 1.13, 8.46, and 30.9 for the HCB silt loam, Pikeville loamy sand, CL6S clay loam, SL2.3 sandy loam, and Carlyle silt loam soils, and the Nidda sandy loam sediment, respectively; corresponding Freundlich desorption KFoc values were 29.2, 192,40, 103, 564, and 672.
Adsorption coefficients were re-calculated by the secondary reviewer using slopes of adsorption isotherms rather than mean coefficients. values were 1.12, 1.37,0.37,0.42, 3.46 and 1 8.2 for HCB silt loam, Pikeville loamy sand, CL6S clay loam, SL2.3 sandy loam, and Carlyle silt loam soils and the Nidda sandy loam sediment, respectively; corresponding KOCmads values were 24, 114,22,38,23 1 and 395, respectively. Freundlich regressions gave KF-ads values of 0.98, 1.20, 0.34, 0.39, 3.20 and 15.9 for HCB silt loam, Pikeville loamy sand, CL6S clay loam, SL2.3 sandy loam, and Carlyle silt loam soils and the Nidda sandy loam sediment, respectively; corresponding KFOC-ads values were 21, 100,20, 35,214 and 346, respectively. Based on the Koc-ads values and the mobility classification of McCall at al. (1 98 I), pyrasulfotole is expected to exhibit moderate to very high mobility in the range of soils studied. Pyrasulfotole mobility tended to increase with increasing pH, with pyrasulfotole showing the greatest mobility at neutral soil pH levels
Desorption coefficients were similarly re-calculated by the secondary reviewer using slopes of desorption isotherms. Desorption isotherms were based on consecutive desorption through two cycles fiom the highest test concentration only. Consecutive desorption &-dB values were 0.76, 0.75,0.15,0.25,2.40 and 12.7 for HCB silt loam, Pikeville loamy sand, CL6S clay loam, SL2.3 sandy loam, and Carlyle silt loam soils and the Nidda sand4 loam sediment, respectively; corresponding &-dB values were 16,63,9,23, 160 and 276, respectively. Freundlich regressions gave &-des values of 0.55, 0.51,0.17, 0.20, 1.76 and 9.21 for HCB silt loam, Pikeville loamy sand, CL6S clay loam, SL2.3 sandy loam, @d Carlyle silt loam soils and the

Data Evaluation Report on the adsorptibn-dbirbrj?tion of pyrasulfotole (AE 0317309) in soil
PMRA Submission Number 2006-2445 EPA MRID Number 4680 1703
Nidda sandy loam sediment, respectively; corresponding K F O ~ - ~ ~ ~ values were 12,42, 10, 18, 1 17 and 200, respectively. After two desorption cycles, &c-des values remained very similar to Gc ads values, indicating that pyrasulfotole remains relatively strongly bound to soils after initial adsorption. ,
Results Synopsis:
Soil type: HCB Silt loam Amount adsorbed: Adsorption &: Adsorption LC: Freundlich adsorption KF: Freundlich adsorption KFoc: Amount desorbed: Desorption &: Desorption &: Freundlich desorption KF: Freundlich desorption KFoc:
55.7-63.3% of the applied. 1.32 28.1 0.980 20.8 55.0% of the adsorbed (high-dose soils only). 2.26 48.2 1.37 29.2
Soil type: Pikeville Loamy sand Amount adsorbed: 60.3-7 1.0% of the applied. Adsorption &: 1.77 Adsorption &: 148 Freundlich adsorption KF: 1.20 Freundlich adsorption KFoc: 100 Amount desorbed: 49.7% of the adsorbed @&-dose soils only). Desorption &: 3.67 Desorption &: 306 Freundlich desorption KF: 2.30 Freundlich desorption KFoc: 1 92
Soil type: CL6S Clay loam Amount adsorbed: Adsorption &: Adsorption &,,: Freundlich adsorption KF: Freundlich adsorption KFoc: Amount desorbed: Desorption &: Desorption &,: Freundlich desorption KF: Freundlich desorption KFoc:
26.4-32.3% of the applied. 0.367 21.6 0.341 20.0 70.4% of the adsorbed (high-dose soils only). 0.923 54.3 0.678 40
Soil type: SL2.3 Sandy loam
Page 5 of 3 1

Data Evaluation Report on the adsorption=d&S61$tion of pyrasulfotole (AE 0317309) in soil
PMRA Submission Number 2006-2445 EPA MRID Number 46801703
Amount adsorbed: Adsorption &: Adsorption kc: Freundlich adsorption KF: Freundlich adsorption KFoc: Amount desorbed: Desorption &: Desorption k c : Freundlich desorption KF: Freundlich desorption KFoc:
30.1-35.2% of the applied. 0.47 42.7 0.386 35.1 69.0% of the adsorbed (high-dose soils only). 1.51 137 1.13 103
Soil type: Carlyle Silt loam Amount adsorbed: 43.9-52.2% of the applied. Adsorption &: 4.25 Adsorption k c : 283 Freundlich adsorption KF: 3.20 Freundlich adsorption KFoc: 2 13 Amount desorbed: 65.6% of the adsorbed (high-dose soils only). Desorption &: 10.4 Desorption LC: 696 Freundlich desorption KF: 8.46 Freundlich desorption KFoc: 564
Soil type: Nidda Sandy loam Amount adsorbed: 50.4-73.5% of the applied. Adsorption &: 32.86 Adsorption kc: 7 15 Freundlich adsorption KF: 1 5.9 Freundlich adsorption KFoc: 345 Amount desorbed: 6 1.1 % of the adsorbed (high-dose soils only). Desorption &: 56.59 Desorption &,: 1230 Freundlich desorption KF: 30.9 Freundlich desorption KFoc: 672
PMRA Results Synopsis:
Soil type: HCB Silt loam Amount adsorbed: 55.7-63.3% of the applied. Adsorption &: 1.12 Adsorption &: 24 Freundlich adsorption KF: 0.98 Freundlich adsorption KFoc: 2 1 Mobility classification: Very high

Data Evaluation Report on the adsorption-desorptidn of pyrasulfotole (AE 0317309) in soil
PMRA Submission Number 2006-2445 EPA MRID Number 46801 703
Amount desorbed: 55.0% of th Desorption &: 0.76 Desorption Kc: 16 Freundlich desorption KF: 0.55 Freundlich desorption KFoc: 12
Soil type: Pikeville Loamy sand Amount adsorbed: 60.3-71 .O% Adsorption &: 1.37 Adsorption &,: 114 Freundlich adsorption KF: 1.20 Freundlich adsorption KFoc: 1 00 Mobility classification: High Amount desorbed: 49.7% of th Desorption &: 0.75 Desorption Kc: 63 Freundlich desorption KF: 0.5 1 Freundlich desorption KFoc: 42
Soil type: CL6S Clay loam Amount adsorbed: 26.4-32.3% I
Adsorption &: 0.37 Adsorption Kc: 22 Freundlich adsorption KF: 0.34 Freundlich adsorption KFoc: 20 Mobility classification: Very high Amount desorbed: 70.4% of the Desorption Kd: 0.15 Desorption K,,: 9 Freundlich desorption KF: 0.17 Freundlich desorption KFoc: 10
Soil type: SL2.3 Sandy loam Amount adsorbed: 30.1-35.2% ( Adsorption &: 0.42 Adsorption Kc: 38 Freundlich adsorption KF: 0.39 Freundlich adsorption KFoc: 3 5 Mobility classification: Very high Amount desorbed: 69.0% of the Desorption Kd: 0.25 Desorption &,: 23 Freundlich desorption KF: 0.2 Freundlich desorption KFoc: 18
adsorbed (high-dose soils only).
)f the applied.
adsorbed (high-dose soils only).
~f the applied.
adsorbed (high-dose soils only).
'the applied.
idsorbed mgh-dose soils only).

Data Evaluation Report on the adsorption-dkdiokptiou of pyrasulfotole (AE 0317309) in soil
PMRA Submission Number 2006-2445 EPA MRID Number 46801703
Soil type: Carlyle Silt loam Amount adsorbed: 43.9-52.2% of the applied. Adsorption &: 3.46 Adsorption I?,,: 23 1 Freundlich adsorption KF: 3.20 Freundlich adsorption KFoc: 2 14 Mobility classification: Moderate Amount desorbed: 65.6% of the adsorbed (high-dose soils only). Desorption Kd: 2.40 Desorption I?,,: 160 Freundlich desorption KF: 1.76 Freundlich desorption KFoc: 1 17
Soil type: Nidda Sandy loam Amount adsorbed: 50.4-73.5% of the applied. Adsorption &: 18.2 Adsorption &: 395 Freundlich adsorption KF: 15.9 Freundlich adsorption KFoc: 346 Mobility classification: Moderate Amount desorbed: 61.1 % of the adsorbed (high-dose soils only). Desorption &: 12.7 Desorption I?,,: 276 Freundlich desorption KF: 9.2 1 Freundlich desorption KFoc: 200
Study Acceptability: This study is classified as acceptable. No significant deviations from good scientific practices were noted. It could not be determined if the foreign soils used in the study were typical of the pesticide use area in the U.S. Also, material balances were determined for high-dose soils only.
I. MATEIUALS AND METHODS
GUIDELINE FOLLOWED: This study was conducted in accordance with the USEPA Guidelines for Pesticides Registration, Subdivision N 5 1 63 - 1 (1 982) and the OECD Guideline for Testing of Chemicals No. 106 "Adsorption/-Desorption" (2000; pp. 6, 16). Significant deviations from the objectives of Subdivision N guidelines were:
Page 8 of 3 1
Data Evaluation Report on the adsorption-desorption of pyrasulfotole (AE 0317309) in soil
PMRA Submission Number 2006-2445 EPA MRID Number 4680 1703
It could not be determined if the foreign soils that were used in the study were typical of the pesticide use area in the U.S.
Material balances were determined for high-dose soils only.
COMPLIANCE: This study was conducted in compliance with OECD Good Laboratory Practices (p. 3; Appendix 3, p. 84). Signed and dated No Data Confidentiality, GLP, Quality Assurance, and Certificate of Authenticity statements were provided (pp. 2-5).
A. MATERIALS:
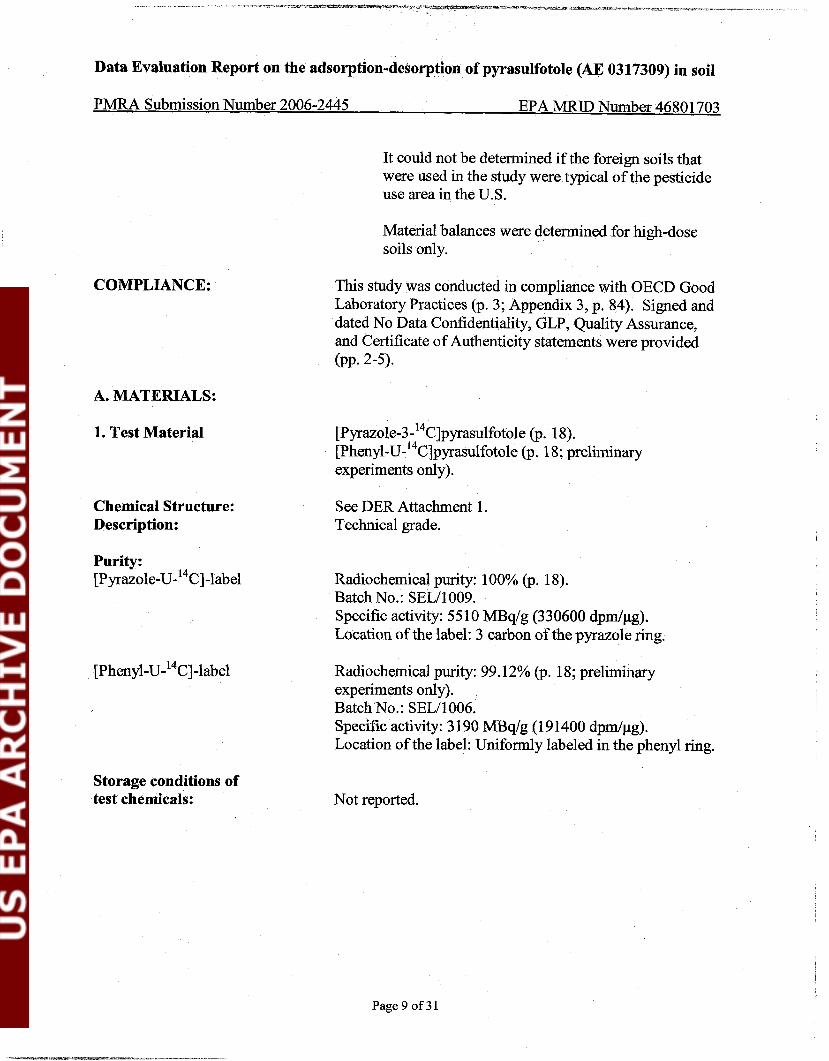
1. Test Material [~~razole-3-'~~]~yrasulfotole (p. 18). [~hen~l-~-~~~]~~rasulfotole (p. 1 8; preliminary experiments only).
Chemical Structure: See DER Attachment 1. Description: Technical grade.
Purity: [ ~ ~ r a z o l e - ~ - ~ ~ ~ ] - l a b e l Radiochemical purity: 100% (p. 18).
Batch No.: SELl1009. Specific activity: 5510 MBqIg (330600 dpmlpg). Location of the label: 3 carbon of the pyrazole ring.
[ ~ h e n ~ l - ~ - ~ ~ ~ ] - l a b e l Radiochemical purity: 99.12% (p. 18; preliminary experiments only). Batch No.: SELl1006. Specific activity: 3 190 MBq/g (1 9 1400 dpdpg). Location of the label: Uniformly labeled in the phenyl ring.
Storage conditions of test chemicals: Not reported.
Page 9 of 3 1

Data Evaluation Report on the adsorption-desorption of pyrasulfotole (AE 0317309) in soil
PMRA Submission Number 2006-2445 EPA MRID Number 46801703
Comment
--
Very soluble
1 Vapor PressureNolatility
water &,= 264 UV Absorption 0.1M HC1 Lm = 241
0.lMNaOH k,,,,=216
Pka 4.2 + 0.15
0.276 at pH 4 log KW at 23°C -1.362 at pH 7
-1.58 at pH 9
Not likely to undergo photolysis.
Not likely to bioaccumulate
No significant degradation Stability of compound at room temperature, if over 12 months at ambient
Data obtained £+om pyrasulfatole chemistry review of Submission 2006-2445.
Page 10 of 31

Data Evaluation Report on the adsorption-desorptiion of pyrasulfotole (AE 0317309) in soil
PMRA Submission Number 2006-2445 EPA MRID Number 46801 703
2. Soil Characteristics
Data were obtained fiom pp. 19-20 of the study report. 1 Storage length was determined by the reviewer as the interval between the field sampling date (July 2001 for the Illinois silt loam, March 2002 for the German clay loam, April 2002 for the North Dakota silt loam and German sandy loam sediment, May 2002 for the North Carolina loamy sand, and June 2002 for the German sandy loam) and the experimental study initiation (July 2002; Table 2, p. 41 of the study report).
at the collection site Collection
Page 11 of31
Sampled from the A horizon; no further details were provided.

Data Evaluation Report on the adsorption-des~rptioh of pyrasulfotole (AE 0317309) in soil
PMRA Submission Number 2006-2445 EPA MRID Number 4680 1 703
Data were obtained from Table 2, p. 41 of the study report. 1 Reviewer-calculated as % organic carbon x 1.7.
C. STUDY DESIGN:
1. Preliminary study: Preliminary experiments were conducted to determine the adsorption of the test material to the test vessels, and to determine the appropriate soil:solution ratio and equilibrium time to be used in the definitive study (pp. 23,25-26).
Prior to study initiation, application solutions were prepared by diluting a stock solution of [phenyl-~-14~]pyrasulfotole, at a nominal concentration of ca. 4.6 mg/mL, and a stock solution of [pyrazole-3-14~]pyrasulfotole, at a nominal concentration of ca. 4.0 mg/mL, with 0.01M CaC12 solution (pp. 19,23).
To determine the stability of the test material and adsorption of the test material to the glass centrifuge jars, aliquots (1 x 10 yL) of the [pyrazole-3-14~]pyrasulfotole application solution were diluted to 50 mL with 0.01M CaC12 solution (pp. 20,25). The samples were incubated in the dark at room temperature. After 0, 1, and 3 days, aliquots were analyzed using LSC. Additional aliquots were analyzed using HPLC. HPLC analysis was performed under the following conditions (p. 22): Waters symmetry C18 column (4.6 x 250 mm; 5-ym particle size), mobile combining (Solvent System A) ammonium formate 0.02M adjusted to pH 2 with formic acid and (Solvent System B) acetonitrile [percent A:B (v:v) at 0-5 min,, 90:lO; 10 min., 75:25;
Page 12 of 3 1

Data Evaluation Report on the adsorption-deiorwon of pyrasulfotole (AE 0317309) in soil
PMRA Submission Number 2006-2445 EPA MRID Number 46801 703
30 min., 40;60; 40-45 min., 5:95; 5.0-60 min., 90:10], and flow rate of 1 mllminute. [14~]~yrasulfotole was identified by comparison to the retention time of an unlabeled reference standard (Rt = ca. 18-19 rnin.). Based on HPLC analysis, it was determined that there was no significant degradation of [pyrazole-3-14~]pyrasulfotole after 3 days of shaking (p. 33). In addition, no significant adsorption of [pyrazole-3-14~]pyrasulfotole to the glass centrifuge jars was observed (Table 8, p. 49).
To determine the adsorption kinetics, aliquots (6 x ca. 20 g, per soil type) of each test soil were placed into glass centrifuge jars (p. 25). Each sample was mixed with ca. 19 mL of 0.01M CaC12 solution, sealed with screw caps, and shaken on a gyro wheel mixer for ca. 24 hours. Following pre-equilibration, the Carlyle silt loam, HCB silt loam, CL6S clay loam, and Pikeville loamy sand soils were treated with a 1 .O-mL aliquot of a [phenyl-~-14~]pyrasulfotole test solution at a nominal test concentration of ca. 1.1 mg/L (Table A, p. 24). The Nidda sandy loam sediment and SL2.3 sandy loam soil were treated with a 1 .O-mL aliquot of a [pyrazole-3-14~] pyrasulfotole test solution at a nominal test concentration of ca. 1.1 mg/L. The samples were shaken for 2,4, 6, 16,24, and 48 hours. Following each sampling interval, duplicate samples were centrifuged and aliquots of the supernatants were analyzed for total radioactivity using LSC. An additional experiment, Accelerated Solvent Extraction (ASE), was conducted on selected soil samples following 24 hours of adsorption exposure to [14~]pyrasulfotole at ca. 1.1 OdmL (p. 34). described. The 24-hour soil samples were mixed with 20 g of diatomaceous earth and extracted using acetonitri1e:water (2: 1, v:v; Figure 3, p. 70). A primary "mild" extraction phase (40EC) and a consecutive "aggravated" extraction phase (i.e. 100EC, elevated temperature) were each analyzed using LSC, then concentrated in vacuo using a rotary evaporator and analyzed using HPLC as previously described (p. 26). The extracted soils were ground to a powder and analyzed using LSC following combustion. It was determined that 40.2-68.0% and 2.4-28.2% of the applied radioactivity was released from the test soils under "mild" and "aggravated" extraction conditions, respectively (Table 6, p. 47). Most of the recovered radioactivity was unchanged pyrasulfotole, based on HPLC analysis (Figures 4-5, pp. 7 1-72). Mass balances ranged from 98.2-100.6% of the applied for the HCB silt loam, Pikeville loamy sand, CL6S clay loam, SL2.3 sandy loam, and Carlyle silt loam soils, with [14c] pyrasulfotole accounting for 89.5-95.1% of the applied (pp. 34-35; Table 6, p. 47). For the Nidda sandy loam sediment, a mass balance of 97.3% of the applied was observed, with [phenyl-~-14~] pyrasulfotole accounting for 82.5% of the applied. The low recovery of parent compound from the Nidda sandy loam sediment was due to an incomplete test material extraction, according to the study authors.
To determine the desorption kinetics, aliquots (6 x ca. 20 g, per soil type) of each test soil were prepared, pre-equilibrated, and treated with test material as previously described (p. 26). Following 24 hours of adsorption, the samples were centrifuged, the supernatants were decanted, and ca. 20 mL of fresh 0.01M CaC12 solution were added to each sample. The samples were shaken for 2,4,6, 16,24, and 48 hours. Following each sampling interval, duplicate samples were centrifuged and aliquots of the supernatants were analyzed for total radioactivity using LSC. Additional samples were analyzed using HPLC as previously described.
Page 13 of 31

Data Evaluation Report on the adsorption-deborption of pyrasulfotole (AE 0317309) in soil
PMRA Submission Number 2006-2445 EPA MRID Number 46801 703
To check for levels of background radioactivity, blank samples were included in the preliminary adsorption and desorption kinetics tests (p. 26). Aliquots (2 x ca. 20 g, per soil type) were treated with ca. 20 mL of 0.01M CaC12 solution and pre-equilibrated for ca. 24 hours. Following pre-equilibration, the samples were shaken on a gyro wheel mixer for 96 hours and centrifuged. Aliquots of the supernatants were analyzed using LSC. For all test soils, an insignificant amount of background radioactivity was released into the supernatants (p. 35).
Based on the results of these preliminary experiments, an equilibration time of 24 hours and soi1:solution ratios of 1:s (w:v) for the Carlyle silt loam soil, 1:20 (w:v) for the Nidda sandy loam sediment, and 1 : 1 (w:v) for the HCB silt loam, Pikeville loamy sand, CLGS clay loam, and SL2.3 sandy loam soils were selected for use in the definitive study (pp. 3 3 -34; Figures 6-7, pp. 73-74).
2. Defmitive study experimental conditions:
concentrations ca. 0.0057,0.0124,0.0418,0.1235,0.4275 concentrations (mg
Page 14 of 3 1

Data Evaluation Report on the adsorption-desorption of pyrasulfotole (AE 0317309) in soil
PMRA Submission Number 2006-2445 EPA MRID Number 46801703
Darkness (YesNo)
Shaking method Shaking time
Method of separation of supernatant
Data were obtained from pp. 20,23-24,26-27 and Table 3, p. 42 of the study report. 1 Prior to use, aliquots of each test soil were pre-equilibrated by rotation on a gyro wheel mixer for ca. 24 hours with 0.0 1M CaCl? solution. 2 Test material concentrations were calculated by the reviewer by converting mgL to mg a.i./kg using the following equation: [test concentration (mg/L) x total volume of test material (d)] + amount of soil (g); eg. for the Carlyle silt loam soil [0.006 mg/L x 23.75 mL] + 5.0 g = 0.0285 mg a.i./kg soil.
Page 15 of31

Data Evaluation Report on the adsorption-deso@tion of pyrasulfotole (AE 0317309) in soil
PMRA Submission Number 2006-2445 EPA MRID Number 46801703
No. of desorption cycles 2 0.01M 0.01M
Equilibration solution and quantity CaC12 CaC12 used per treatment for desorption (eg., 0.01M CaClz solution; ca. 20 mL. solution; solution; 0.0 1M CaC12) ca. 25 ca. 60
mL. mL. Soi1:solution ratio 1:l 1:5 1:20
Controls Triplicate samples without soil. Replications Duplicate samples without test material.
Treatments Duplicate.
Data were obtained from pp. 26-27; Table 3, p. 42; Table 9, p. 50; Table 12, p. 53; Table 15, p. 56; Table 18, p. 59; Table 21, p. 62; and Table 24, p. 65 of the study report.
3, Description of analytical procedures:
Extractionlclean up/concentration methods: No extractionlclean uplconcentration methods were employed in this study.
Page 16 of 31
-

Data Evaluation Report on the adsorption-desorpbdn of pyrasulfotole (AE 0317309) in soil
PMRA Submission Number 2006-2445 EPA MRID Number 46801703
Total 14c measurement: Following adsorption and each desorption cycle, aliquots (ca. 3 x 0.5- 2.0 mL) of the supernatants were analyzed for total radioactivity using LSC (pp. 21-22,27). Mass balances were determined for high-dose soils by summing the radioactivity recovered in the adsorption solutions, two desorption solutions, and unextracted radiocarbon (p. 32).
Non-extractable residues, if any: Following the second desorption cycle, the soils were homogenized and analyzed for total radioactivity using LSC following combustion; combustion efficiency ranged from q8.4-100.3% (p. 22).
Derivatization method, if used: A derivatization method was not employed in this study.
Identification and quantification of parent compound: Samples were not analyzed for pyrasulfotole.
Identification and quantification of transformation products, if appropriate: Samples were not analyzed for transformation products of pyrasulfotole.
Detection limits (LOD, LOQ) for the parent compound: The Limit of Quantification (LOQ) for LSC analysis was 30 dpm; the Limit of Detection (LOD) was not reported (p. 21).
Detection limits (LOD, LOQ) for the transformation products, if appropriate: For LSC analysis, the LOQ was 30 dpm; the LOD was not reported (p. 2 1).
11. RESULTS AND DISCUSSION
A. TEST CONDITIONS: The incubation temperature during the study was maintained at ambient temperature; no supporting information was provided (Table 3, p. 42). The pH values of the supernatants solutions during the adsorption and desorption phases were not reported. The test samples were not analyzed for parent or its transformation products. LSC analysis of application control samples without soil (three samples per soil type and test concentration), concurrently run with each definitive test series, verified the application accuracy and lack of test material adsorption to the glass test containers; >98% of the applied radioactivity was recovered in the application control solutions (p. 37; Table 8, p. 49).
B. MASS BALANCE: Mass balances at the end of the adsorption phase were not reported. Mean mass balances at the end of the desorption phase averaged 95.3% (range 93.3-97.3%), 96.6% (range 93.9-99.3%), 95.0% (range 93.6-96.3%), 98.5% (range 98.3-98.7%), 98.8% (range 98.7-99.0%), and 100.6% (range 100.4-100.7%) of the applied for the HCB silt loam, Pikeville loamy sand, CL6S clay loam, SL2.3 sandy loam, and Carlyle silt loam soils, and the Nidda sandy loam sediment, respectively (p. 37; Table 7, p. 48).
Page 17 of 31

Data Evaluation Report on the adsorption-desorptiofi of pyrasulfotole (AE 0317309) in soil
PMRA Submission Number 2006-2445 EPA MRID Number 46801 703
Table 5: Recovery of [pyrazole-3-14~]pyrasulfotole, expressed as percentage of applied
1 Supernatant solution ' Solid phase (extracted)
I Total recovery I Not determined. I
22.4 h 0.6 1 29.7 + 0.6 1 41.8 * 1.4 1 44.1 1 1.0 1 53.9 f 0.6 1 51.7 + 0.7
Not determined. Non-extractable residues in soil, if measured
I At the end of the desomtion vhase
Not determined.
Supernatant solution (Desorption 1) 25.4 f 0.1 21.4 * 0.4 23.7 * 6.0 26.9 0.2 20.8 i 0.3 20.3 h 0.1
Supernatant solution (Desorption 2) 14.7h0.3 11.9+0.1 13.8A2.7 10.6hO.O 8.7h0.1 9.6h0.1
I Solid phase (extracted) 1 Not determined. Non-extractable residues in soil, if measured 334
32.9 + 2.5 33.6 + 3.9 15.6 A 2.9 16.8 h 0.9 15.5 f 0.2 19.1 i 0.5
Data were obtained from Table 7, p. 48 of the study report. Means and standard deviations were determined by the reviewer using Excel. 1 Determined by the reviewer by dividing the mass of test item in supernatant after adsorption (dprn) by the total mass of test item before adsorption (dprn); e.g. for the HCB silt loam soil (6.77 x lo5 + 2.97 x lo6] x 100 = 22.79%. 2 Determined by the reviewer by dividing the mass of test item in supernatant after desorption (dprn) by the total mass of test item before adsorption (dprn); e.g. for the HCB silt loam soil, first desorption [7.56 x lo5 + 2.97 x lo6] x 100 = 25.45%. 3 All soils were combusted following desorption. 4 Determined by dividing the total mass of test item in soil after the last desorption (dprn) by the total mass of test item before adsorption (dprn); e.g. for the HCB silt loam soil 11.03 x lo6 + 2.97 x lo6] x 100 = 34.68%. 5 Determined by dividing the amount recovered (dpm) by the total mass of test item before adsorption (dprn); e.g. for the HCB silt loam soil 12.89 x lo6 + 2.97 x lo6] x 100 = 97.31%.
Page 18 of 31
- --- -----


Data Evaluation Report on the adsorption-desorption of pyrasulfotole (AE 0317309) in soil
PMRA Submission Number 2006-2445 EPA MRID Number 46801 703
Kd - Adsorption and desorption coefficients; K - Freundlich adsorption and desorption coefficients; 1/N - Slope of ~reindlich adsorption~desorption isotherms. KO, - Coefficient adsorption per organic carbon (Kd or K x 1001% organic carbon). R~ - Regression coefficient of Freundlich equation. 1 Freundlich KF values were calculated by the study author using the following equation (p. 30):
Log C, = lln x log C , + log KF, where C, = soil concentration after adsorption or desorption (Qglg); C, = concentration of supernatant after adsorption or desorption (Qglg); lln = Freundlich exponent; and KF = Freundlich coefficient.

Data Evaluation Report on the adsorption-desorption of pyrasulfotole (AE 0317309) in soil
PMRA Submission Number 2006-2445 EPA MRID Number 46801 703
Data were obtained from pp. 35-36, Table 1, p. 40, Tables 9-26, pp. 50-67, and Figures 8-13, pp. 75-80 of the study report. & - Adsorption and desorption coefficients; KF - Freundlich adsorption and desorption coefficients; 1/N - Slope of Freundlich adsorption/desorption isotherms. K, - Coefficient adsorption per organic carbon (Kd or K x 1001% organic carbon). R~ - Regression coefficient. * - Low R' predominantly driven by one outlier.
Page 22 of 3 1
Data Evaluation Report on the adsorption-desorption of pyrasulfotole (AE 0317309) in soil
PMRA Submission Number 2006-2445 EPA MRID Number 46801703
C. ADSORPTION: After 24 hours of equilibration, 55.7-63.3%, 60.3-7 1.0%, 26.4-32.3%, 30.1 - 35.2%, 43.9-52.2%, and 50.4-73.5% of the applied [pyrazole-3-14~]pyrasulfotole was adsorbed to the HCB silt loam, Pikeville loamy sand, CL6S clay loam, SL2.3 sandy loam, and Carlyle silt loam soils and the Nidda sandy loam sediment, respectively (reviewer-calculated; Table 9, p. 50; Table 12, p. 53; Table 15, p. 56; Table 18, p. 59; Table 21, p. 62; Table 24, p. 65). Registrant- calculated adsorption J& values averaged 1.32,1.77,0.367,0.47,4.25, and 32.9 for the HCB silt loam, Pikeville loamy sand, CL6S clay loam, SL2.3 sandy loam, and Carlyle silt loam soils and the Nidda sandy loam sediment, respectively; corresponding adsorption &, values averaged 28.1, 148,21.6,42.7,283, and 71 5. Registrant-calculated Freundlich adsorption KF values were 0.980, 1.20,0.341,0.386,3.20, and 15.9 for the HCB silt loam, Pikeville loamy sand, CL6S clay loam, SL2.3 sandy loam, and Carlyle silt loam soils, and the Nidda sandy loam sediment, respectively; corresponding Freundlich adsorption ?SF, values were 20.8,100,20.0,3 5.1,2 1 3, and 345.
I Adsorption coefficients were re-calculated by the secondary reviewer using slopes of adsorption isotherms rather than mean coefficients. &-ads values were 1.12, 1.37,0.37,0.42, 3.46 and 18.2 for HCB silt loam, Pikeville loamy sand, CL6S clay loam, SL2.3 sandy loam, and Carlyle silt loam soils and the Nidda sandy loam sediment, respectively; corresponding values were 24, 114,22,38,231 and 395, respectively. Freundlich regressions gave KFak values of 0.98, 1.20,0.34,0.39,3.20 and 15.9 for HCB silt loam, Pikeville loamy sand, CL6S clay loam, SL2.3 sandy loam, and Carlyle silt loam soils and the Nidda sandy loam sediment, respectively; corresponding KFOC-ads values were 21, 100,20,35,214 and 346, respectively. The slopes (1111) of the Freundlich adsorption regressions were all within the range of 0.9-1 .l, with the exception of Nidda sediment (Table 8b).
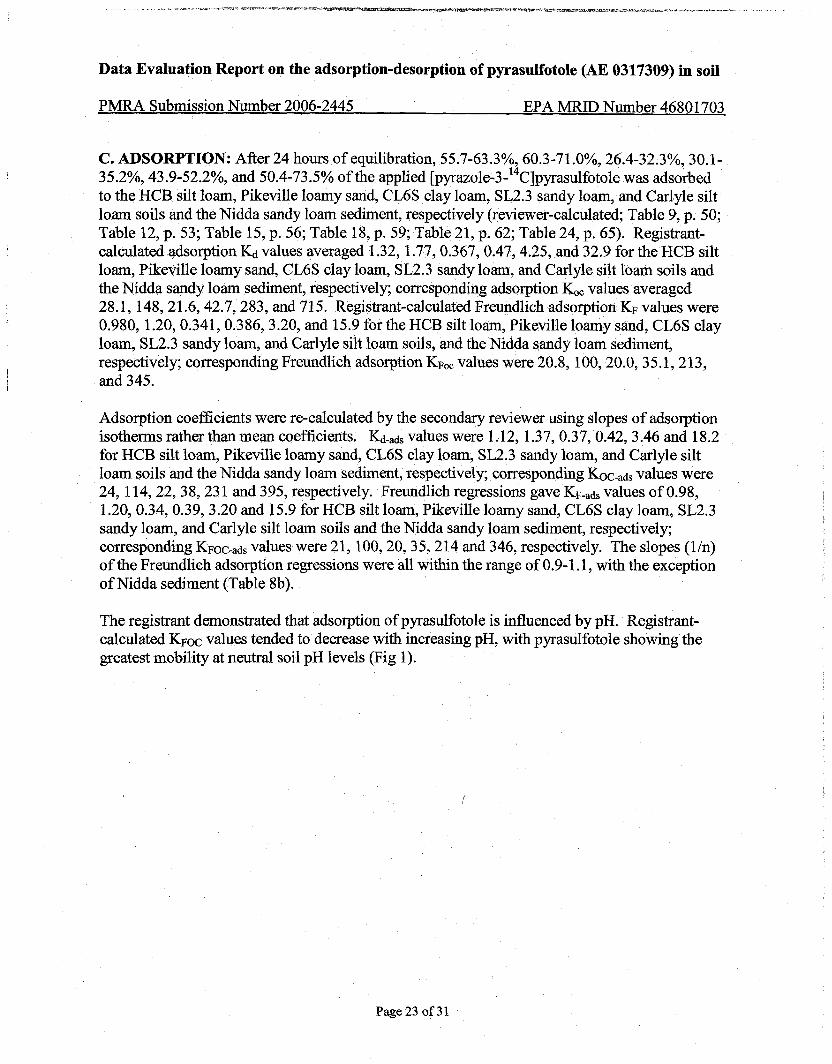
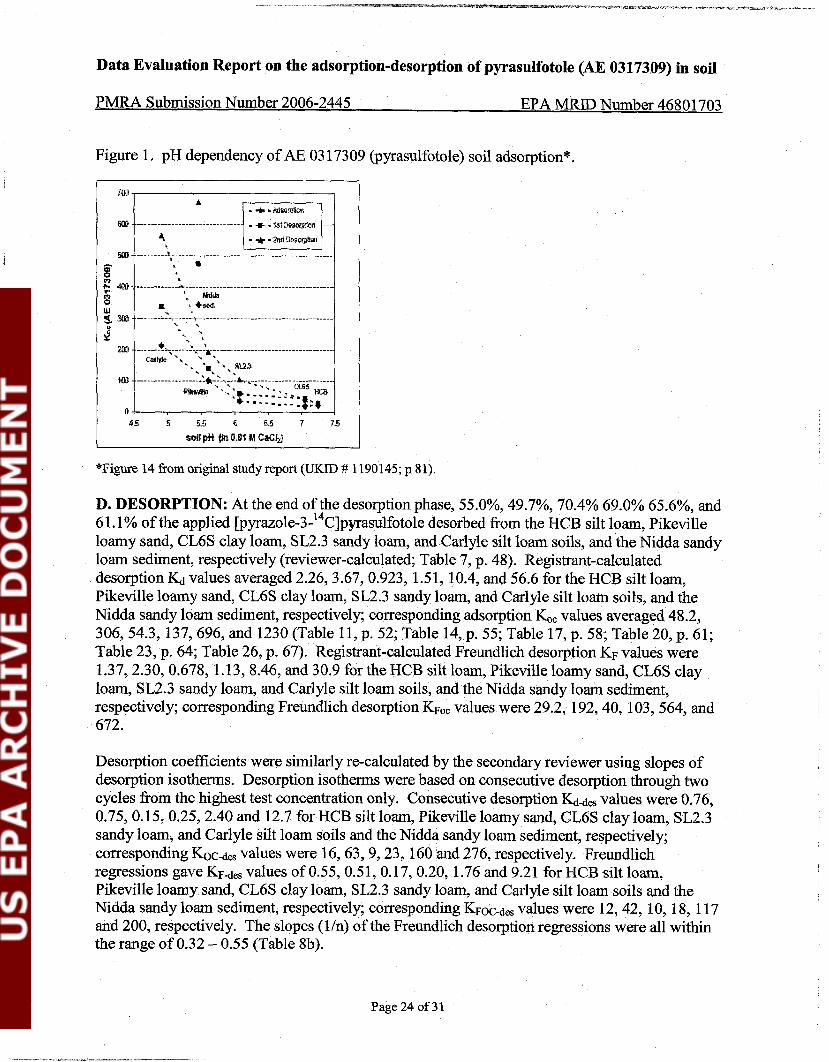
The registrant demonstrated that adsorption of pyrasulfotole is influenced by pH. Registrant- calculated KFoC values tended to decrease with increasing pH, with pyrasulfotole showing the greatest mobility at neutral soil pH levels (Fig 1).
Page 23 of 3 1
Data Evaluation Report on the adsorption-desorption of pyrasulfotole (AE 0317309) in soil
PMRA Submission Number 2006-2445 EPA MRID Number 46801703
Figure 1. pH dependency of AE 03 17309 (pyrasulfotole) soil adsorption*
*Figure 14 from original study report (UKID # 1190145; p 8 1).
iTiO - A
4 \ . 580 -.------ ---!.--. --. .- - .-- ._-- .-----. .--. .-. ---- .-. ---- --- ..
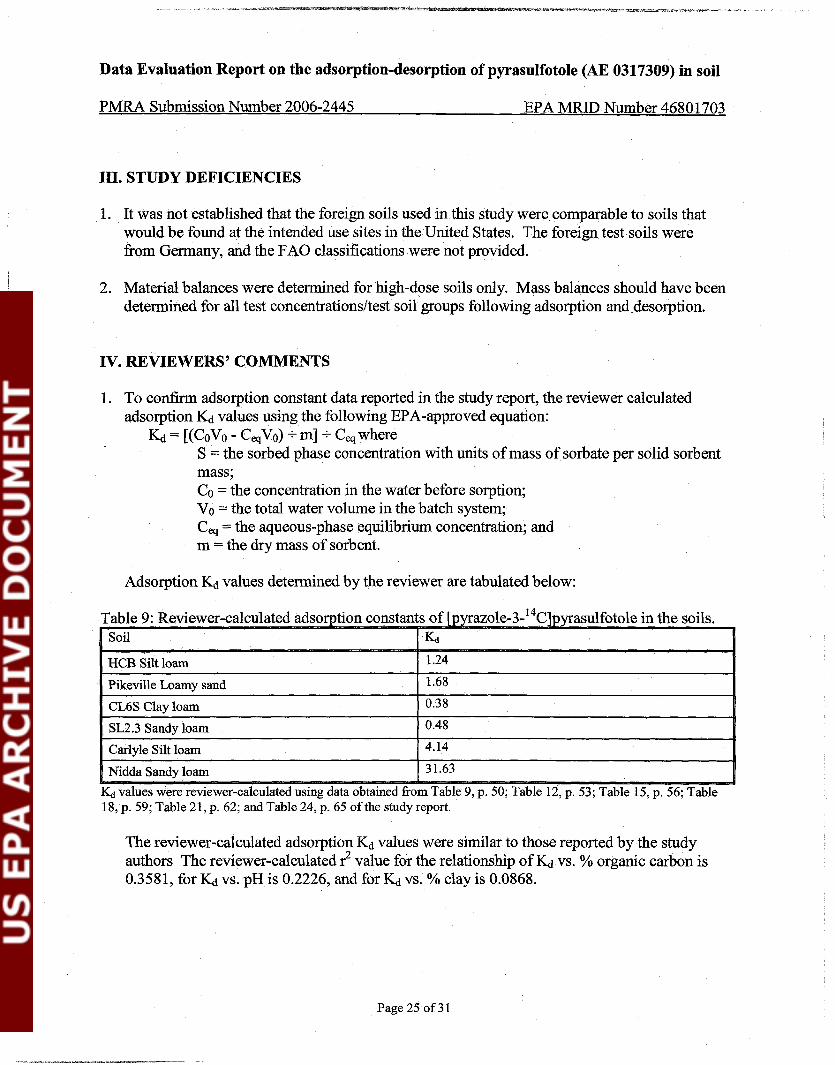
D. DESORPTION: At the end of the desorption phase, 55.0%, 49.7%, 70.4% 69.0% 65.6%, and 61.1% of the applied [pyrawle-3-14~]pyrasulfotole desorbed from the HCB silt loam, Pikeville loamy sand, CL6S clay loam, SL2.3 sandy loam, and Carlyle silt loam soils, and the Nidda sandy loam sediment, respectively (reviewer-calculated; Table 7, p. 48). Registrant-calculated desorption Kd values averaged 2.26,3.67,0.923,1.51, 10.4, and 56.6 for the HCB silt loam, Pikeville loamy sand, CL6S clay loam, SL2.3 sandy loam, and Carlyle silt loam soils, and the Nidda sandy loam sediment, respectively; corresponding adsorption K, values averaged 48.2, 306,54.3, 137,696, and 1230 (Table 11, p. 52; Table 14, p. 55; Table 17, p. 58; Table 20, p. 61; Table 23, p. 64; Table 26, p. 67). Registrant-calculated Freundlich desorption KF values were 1.37,2.30,0.678, 1.13,8.46, and 30.9 for the HCB silt loam, Pikeville loamy sand, CL6S clay loam, SL2.3 sandy loam, and Carlyle silt loam soils, and the Nidda sandy loam sediment, respectively; corresponding Freundlich desorption KFoc values were 29.2, 192,40, 103, 564, and 672.
37 P f? 6 W a 38 w
J
lm
0,
Desorption coefficients were similarly re-calculated by the secondary reviewer using slopes of desorption isotherms. Desorption isotherms were based on consecutive desorption through two cycles from the highest test concentration only. Consecutive desorption values were 0.76, 0.75,0.15,0.25,2.40 and 12.7 for HCB silt loam, Pikeville loamy sand, CL6S clay loam, SL2.3 sandy loam, and Carlyle silt loam soils and the Nidda sandy loam sediment, respectively; corresponding bc-des values were 16,63,9,23,160 and 276, respectively. Freundlich regressions gave KFmdes values of 0.55,0.5 1,O. 17,0.20, 1.76 and 9.21 for HCB silt loam, Pikeville loamy sand, CL6S clay loam, SL2.3 sandy loam, and Carlyle silt loam soils and the Nidda sandy loam sediment, respectively; corresponding K F ~ ~ - ~ ~ values were 12,42, 10, 1 8, 1 1 7 and 200, respectively. The slopes (l/n) of the Freundlich desorption regressions were all within
I
the range of 0.32 - 0.55 (Table 8b).
&-.------------I ', -
I &**sea. ..-------- -1., ..---.c_.----._-.---..-..--.._-.-.----.-..--...
- * - * -> '
-.------ 8 -.-... >-.-: x--.--..--.-..----.-.----._..---._... CB~W\..* *\ "+
3 '32.3 '. '* *, ..------------------ -1*-> +--- & * * - - -. , UGS HCB - '.' .-..-:: .:- ..-. . .::::*
Page 24 of 31
8 5 5 55 6 5 5 7 75
sod pH (in 0.01 M CaCh]
Data Evaluation Report on the adsorption-desorption of pyrasulfotole (AE 0317309) in soil
PMRA Submission Number 2006-2445 EPA MRlD Number 46801 703
111. STUDY DEFICIENCIES
1. It was not established that the foreign soils used in this study were comparable to soils that would be found at the intended use sites in the United States. The foreign test soils were &om Germany, and the FA0 classifications were not provided.
2. Material balances were determined for high-dose soils only. Mass balances should have been determined for all test concentrations/test soil groups following adsorption and desorption.
IV. REVIEWERS' COMMENTS
1. To confirm adsorption constant data reported in the study report, the reviewer calculated adsorption Kd values using the following EPA-approved equation:
& = [(COVO - CeqVO) + m] + C, where S = the sorbed phase concentration with units of mass of sorbate per solid sorbent mass; Co = the concentration in the water before sorption; Vo = the total water volume in the batch system; C, = the aqueous-phase equilibrium concentration; and m = the dry mass of sorbent.
Adsorption & values determined by the reviewer are tabulated below:
CL6S Clay loam 0.38
SL2.3 Sandy loam 0.48
& values were reviewer-calculated using data obtained from Table 9, p. 50; Table 12, p. 53; Table 15, p. 56; Table 18, p. 59; Table 21, p. 62; and Table 24, p. 65 of the shtdy report.
The reviewer-calculated adsorption Kd values were similar to those reported by the study authors The reviewer-calculated 2 value for the relationship of & VS. % organic carbon is 0.358 1, for ISd VS. pH is 0.2226, and for IGj VS. % clay is 0.0868.
Page 25 of 3 1

Data Evaluation Report on the adsorption-desorption of pyrasulfotole (AE 0317309) in soil
PMRA Submission Number 2006-2445 EPA MRID Number 46801703
2. Based on the adsorption phase study results and the Briggs classification, pyrasulfotole is classified as mobile, intermediately mobile or having low mobility in soil, mainly depending on soil pH (pp. 36,38; Figure 14, p. 81).
3. None of the test soils had an organic matter content <I%, as recommended by Subdivision N guidelines.
4. The study authors reported the following information following the first desorption cycle:
Data were obtained fiom Table 10, p. 51; Table 13, p. 54; Table 16, p. 57; Table 19, p. 60; Table 22, p. 63; and Table 25, p. 66 of the study report.
5. An alternative mathematical evaluation of the desorption behaviour of pyrasulfotole was performed in accordance with the Canadian Guideline (p. 30). Freundlich desorption isotherms were plotted through soil and supernatant concentration data pairs from the adsorption phase and each of the two consecutive cycles of the desorption phase, using the following actual test concentrations: for the HCB silt loam, Pikeville loamy sand, CL6S clay loam, and SL2.3 sandy loam soils, 0.0418 mg a.i./kg soil; for the Carlyle silt loam soil, 0.209 mg a.i./kg soil; and for the Nidda sandy loam sediment, 0.836 mg a.i.kg soil. These actual test concentrations were converted into mole fractions (mol/mol water phase) or molar concentrations (mollg soil dry weight) prior to setting up the desorption isotherms (p. 3 1). Calculations and graphical plots of the desorption isotherms are presented in Appendices 1-2, pp. 82-83, respectively, of the study report.
6. The average radiopurities of the [phenyl-~-14~]- and [pyrazole-3-14~]-labeled pyrasulfotole stock solutions were confirmed to be 97.26% and 97.12%, respectively, using HPLC analysis (Figures 1-2, pp. 68-69).
7. The Freundlich lln values for the adsorption and desorption phases for the Nidda sandy loam sediment were below 0.9. Subdivision N guidelines specify that 1111 values should be in the range of 0.9 to 1.1.
Page 26 of 3 1

Data Evaluation Report on the adsorption-desorption of pyrasulfotole (AE 0317309) in soil
PMRA Submission Number 2006-2445 EPA MRID Number 46801703
8. The maximum field application rate for pyrasulfotole was not reported. Subdivision N guidelines specify that one test concentration should be roughly equivalent to the maximum proposed or registered field application rate of the parent compound.
9. The secondary reviewer re-calculated & and KF values for both adsorption and desorption phases based on current PMRA practices (Table 8b). PMRA-calculated Kd values were very similar to those reported by the study author, but differ slightly as they represent the slope of the adsorption coefficients across all test concentrations, rather than an average of the individual values from all concentrations. With the exception of the Nidda sediment results, this does not result in a difference in interpretation of pyrasulfotole's adsorptive capabilities. To determine the desorptive capabilities of the active ingredient following absorption, the PMRA models the consecutive desorption of the highest test concentration through two desorption cycles, and therefore Kd-des values in Table 8b differ significantly than those presented by the study authors. As the l/n values for all sediments (with the exception of Nidda sediments) fall between 0.9-1.1, the PMRA recommends using the non- Freundlich ISoc values to classify pyrasultatole's mobility potential and for subsequent water modelling.
10. DEH does not agree with the study author's comment "the analyte sorption to soils increases at low concentration" because the provided sorption isotherm does not support the claim (it is linear over the tested concentration). A linear sorption isotherm is the one in which the affinity of the sorbate for the sorbent remains the same over the observed concentration range. If sorption increases at low concentrations (as claimed by the study author), it can mean that analyte sorbs to specific sites. Such a case involves an adsorbent (e.g., soot, clay mineral) exhibiting a limited number of sites with a high affinity for the sorbate that dominate the overall sorption at low concentration, plus a partitioning process (e.g., into natural organic matter; linear isotherm) predominating at higher concentration. If this is pyrasulfotole sorption behaviour, a mixed and not a linear isotherm should be observed.
1 1. There is some indication that pyrasulfotole could have combined sorption behaviour due to the value of n (1.02-1.2). When n > 1 it means that more sorbate present in the sorbent enhances the further sorption (isotherm is concave upward). While, when n = 1 it means that there is constant sorption fi-ee energy at all sorbate concentration (meaning the isotherm is linear). However, to see this combined sorption behaviour fixther experiments are needed as the provided data doesn't support this claim.
12. DEH does not agree with the study author's interpretation that "the Koc for the adsorption and the two corresponding consecutive desorption cycles revealed significant increase in adsorption". We do not consider the increase significant (increase by a factor of 1.4 to 2.9) especially when compared to the increased factor observed with the benzoic acid metabolite of up to a factor of 12.
Page 27 of 3 1
Data Evaluation Report on the adsorption-desorption of pyrasulfotole (AE 0317309) in soil
PMRA Submission Number 2006-2445 EPA MRID Number 4680 1703
13. DEH does not agree with the study author's interpretation "once pyrasulfotole is adsorbed, the compound is not readily released back into aqueous environment" because the Koc values in the two consecutive desorptions are still classified as mobile in most soil.
V. REFERENCES
1. McCall, J.P., D.A. Laskowski, R.L. Swam and H.J. Dishbuger. 198 1. Measurement of sorption coefficients of organic chemicals and their use in environmental fate analysis. Pages 89-109 in Test protocols for environmental fate and movement of toxicants. Proceedings of a symposium. Assoc. of Official Analytical Chemists. 94th Annual Meeting, October 21-22, 1980. Washington, D.C.
2. U.S. Environmental Protection Agency. 1982. Pesticide Assessment Guidelines, Subdivision N, Chemistry: Environmental Fate, Section 163-1. Mobility studies. Office of Pesticide and Toxic Substances, Washington, DC. EPA 54019-82-021.
3. U.S. Environmental Protection Agency. 1989. FIFRA Accelerated Reregistration, Phase 3 Technical Guidance. Office of the Prevention, Pesticides, and Toxic Substances, Washington, DC. EPA 540109-90-078,
4. U.S. Environmental Protection Agency. 1993. Pesticide Registration Rejection Rate Analysis - Environmental Fate. Office of the Prevention, Pesticides, and Toxic Substances, Washington, DC. EPA 738.
5. U.S. Environmental Protection Agency. 2003. Guidance for Calculating Sorption Coefficients in Batch Equilibrium Studies.
Page 28 of 3 1

Data Evaluation Report on the adsorption-desorption of pyrasulfotole (AE 0317309) in soil
PMRA Submission Number 2006-2445 EPA MRID Number 46801703
Attachment 1: Structures of Parent Compound and Transformation Products
Page 29 of 3 1

Data Evaluation Report on the adsorption-desorption of pyrasulfotole (AE 0317309) in soil
PMRA Submission Number 2006-2445 EPA MRID Number 4680 1703
Pyrasulfotole [AE 0317309; K-1196; K-12671
IUPAC Name: (5-Hydroxy-1,3-dimethylpyrazol-4-yl)(a,a,a-trifluoro-2-mesyl-p- toly1)methanone. (5-Hydroxy- l,3 -dimethyl- 1 H-pyrazol-4-y1)(2-mesyl-4- trifluoromethylphenyl)methanone.
CAS Name: (5-Hydroxy-l,3-dimethyl- 1 H-pyrazol-4-yl)[2-methylsulfony1)- 4(trifluoromethyl)phenyl]methanone. Methanone, (5-hydroxy- 1,3 -dimethyl- 1H-pyrazol-4-yl)[2- (methylsulfony1)-4-(trifluoromethyl)phenyl] .
CAS Number: 365400- 11 -9. I
SMILES String: FC(c1 cc(c(cc 1 )C(=O)cl c(n(nc 1 C)C)O)S(=O)(=O)C)(F)F (ISIS - v2.31Universal SMILES). No EPI Suite, v3.12 SMILES String found as of 6/7/06. Cclnn(C)c(O)c 1 C(=O)c2ccc(C(F)(F)F)cc2S(C)(=O)=O. CS(=O)(=O)cl c(ccc(c1)C(F)(F)F)C(=O)cl c(n(nc1 C)C)O.
Unlabeled
14c = Position of radiolabel.
Page 30 of 3 1
---"-.-,---">

Data Evaluation Report on the adsorption-desorption of pyrasulfotole (AE 0317309) in soil
PMRA Submission Number 2006-2445 EPA MRID Number 4680 1703
Pyrasulfotole [AE 0317309; K-1196; K-12671
IUPAC Name: (5-Hydroxy- 1,3 -dimethylpyrazol-4-yl)(a,a,a-trifluoro-2-mesyl-p- toly1)methanone. (5-Hydroxy-l,3-dimethyl- 1 H-pyrazol-4-y1)(2-mesyl-4-
I trifluoromethylpheny1)methanone. CAS Name: (5-Hydroxy- 1,3 -dimethyl- 1H-pyrazol-4-yl)[2-methylsulfony1)-
4(trifluoromethyl)phenyl]methanone. Methanone, (5-hydroxy- 1,3 -dimethyl-1H-pyrazol-4-yl)[2- (methylsulfony1)-4-(trifluoromethyl)phenyl] .
CAS Number: 365400-1 1-9. SMILES String: FC(c1 cc(c(ccl)C(=O)cl c(n(nc1 C)C)O)S(=O)(=O)C)(F)F (ISIS
v2.3AJniversal SMILES). No EPI Suite, v3.12 SMILES String found as of 6/7/06. Cclnn(C)c(O)cl C(=O)c2ccc(C(F)(F)F)cc2S(C)(=O)=O. CS(=O)(=O)c 1 c(ccc(c l)C(F)(F)F)C(=O)c 1 c(n(nc1 C)C)O.
Unlabeled
14c = Position of radiolabel.

Chemical: Pyrasulfotole PC Code: 000692 MRID: 4680 1 703 Guideline No: 163-1
Table 416
0.45 0.45 AVG
STDEV
0.13 0.13 AVG
STDEV
0.044 0.044 AVG
STDEV
0.013 0.01 3 AVG
STDEV
Adsorption on soil
Silt loam Loamy sand 0.231 5 0.2573 0.2448 0.2583 0.2382 0.2578 0.01 0.00
Clay loam 0.1 31 1 0.1096 0.1 204 0.02
0.0326 0.0326 0.0326 0.00
Sandy loam 0.1 321 0.1253 0.1 287 0.00
0.0404 0.0375 0.0390 0.00
Silt loam 0.9452 0.9522 0.9487 0.00
Sandy loam 4.2996 4.31 20 4.3058 0.01
0.006 0.0034 0.0038 0.001 5 0.0020 0.01 35 0.0747 0.006 0.0034 0.0038 0.001 6 0.001 9 0.01 39 0.0766 AVG 0.0034 0.0038 0.001 6 0.0020 0.01 37 0.0757
STDEV 0.00 0.00 0.00 0.00 0.00 0.00
Data were obtained from Table 9, p. 50, Table 12, p. 53, Table 15, p. 56, Table 18, p. 59, Table 21, p. 62, and Table 24, p. 65 of the study report.
Table 5 High-dose adsorption solution
Silt loam Loamy sand Clay loam Sandy loam Silt loam 0.45 22.79 30.13 40.74 43.43 53.51 0.45 21.92 29.29 42.76 44.78 54.29 AVG 22.36 29.71 41.75 44.1 1 53.90
STDEV 0.6 0.6 1.4 1 .O 0.6
Data were obtained from Table 7, p. 48 of the study report.
Sandy loam 52.1 6 51.16 51.66 0.7

Chemical: Pyrasulfotole PC Code: 000692 MRID: 46801 703 Guideline No: 163-1
Table 5 High-dose desorption 1 solution
Silt loam Loamy sand Clay loam Sandy loam 0.45 25.45 21.04 19.43 27.1 0 0.45 25.32 21.65 27.95 26.77 AVG 25.39 21.35 23.69 26.94
STDEV 0.1 0.4 6.0 0.2
Table 5 High-dose desorption 2 solution
Silt loam Loamy sand Clay loam Sandy loam 0.45 14.48 1 1.82 15.69 10.54 0.45 14.95 11.95 1 1.82 10.61 AVG 14.72 1 1.89 13.76 10.58
STDEV 0.3 0.1 2.7 0.0
Table 5 Com busted
Silt loam Loamy sand Clay loam Sandy loam 0.45 34.68 30.91 17.68 17.37 0.45 31.11 36.36 13.54 16.16 AVG 32.90 33.64 15.61 16.77
STDEV 2.5 3.9 2.9 0.9
Table 5 Recovery
Silt loam Loamy sand Clay loam Sandy loam 0.45 97.31 93.94 93.60 98.65 0.45 93.27 99.33 96.30 98.32 AVG 95.29 96.64 94.95 98.49
STDEV 2.9 3.8 1.9 0.2
Data were obtained from Table 7, p. 48 of the study report.
Silt loam 21 -06 20.57 20.82 0.3
Silt loam 8.73 8.62 8.68 0.1
Silt loam 15.64 15.40 15.52 0.2
Silt loam 98.96 98.70 98.83 0.2
Sandy loam 20.38 20.27 20.33 0.1
Sandy loam 9.50 9.59 9.55 0.1
Sandy loam 1 8.72 19.38 19.05 0.5
Sandy loam 100.66 100.44 100.55
0.2
Chemical: Pyrasulfotole PC Code: 000692 MRID: 46801 703 Guideline No: 163-1
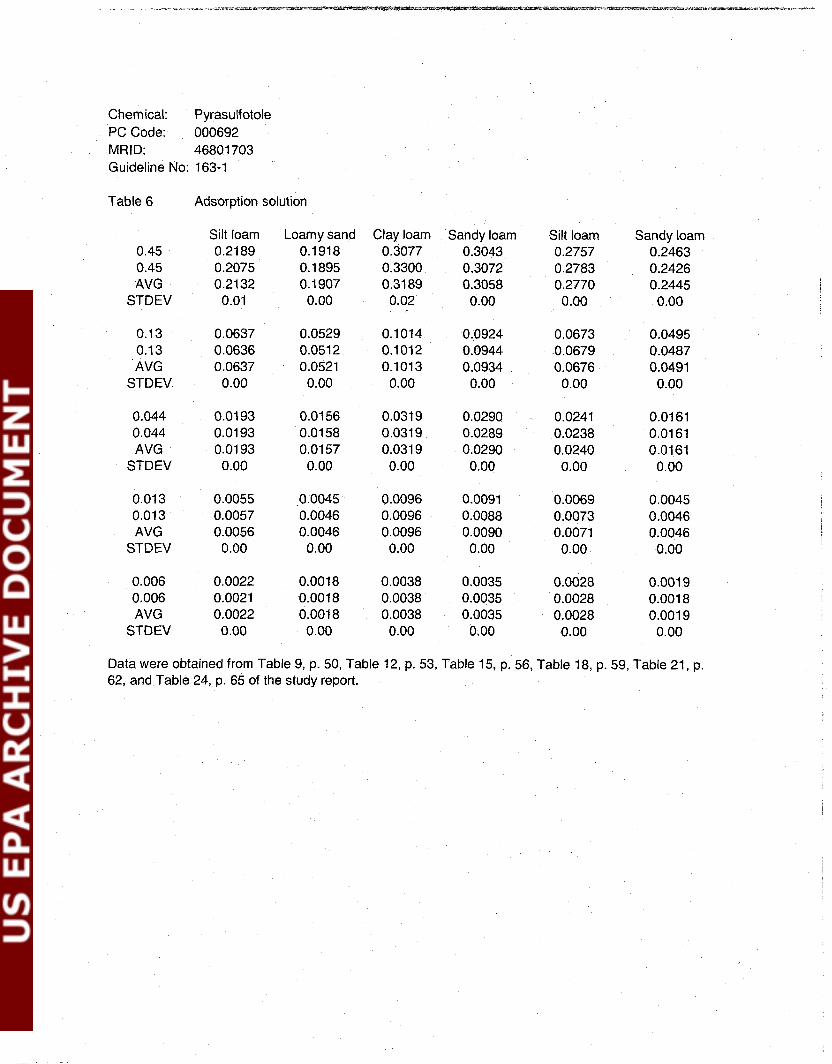
Table 6 Adsorption solution
Silt loam Loamy sand 0.45 0.21 89 0.1918 0.45 0.2075 0.1 895 AVG 0.2132 0.1 907
STDEV 0.01 0.00
0.1 3 0.0637 0.0529 0.1 3 0.0636 0.051 2 AVG 0.0637 0.0521
STDEV 0.00 0.00
0.044 0.01 93 0.01 56 0.044 0.01 93 0.01 58 AVG 0.01 93 0.01 57
STDEV 0.00 0.00
Clay loam 0.3077 0.3300 0.31 89 0.02
Sandy loam 0.3043 0.3072 0.3058 0.00
Silt loam 0.2757 0.2783 0.2770 0.00
Sandy loam 0.2463 0.2426 0.2445 0.00
0.013 0.0055 .0.0045 0.0096 0.0091 0.0069 0.0045 0.01 3 0.0057 0.0046 0.0096 0.0088 0.0073 0.0046 AVG 0.0056 0.0046 0.0096 0.0090 0.0071 0.0046
STDEV 0.00 0.00 0.00 0.00 0.00 0.00
0.006 0.0022 0.0018 0.0038 0.0035 0.0028 0.001 9 0.006 0.0021 0.0018 0.0038 0.0035 0.0028 0.001 8 AVG 0.0022 0.001 8 0.0038 0.0035 0.0028 0.001 9
STDEV 0.00 0.00 0.00 0.00 0.00 0.00
Data were obtained from Table 9, p. 50, Table 12, p. 53, Table 15, p. 56, Table 18, p. 59, Table 21, p. 62, and Table 24, p. 65 of the study report.
Chemical: Pyrasulfotole PC Code: 000692 MRID: 46801 703 Guideline No: 163-1
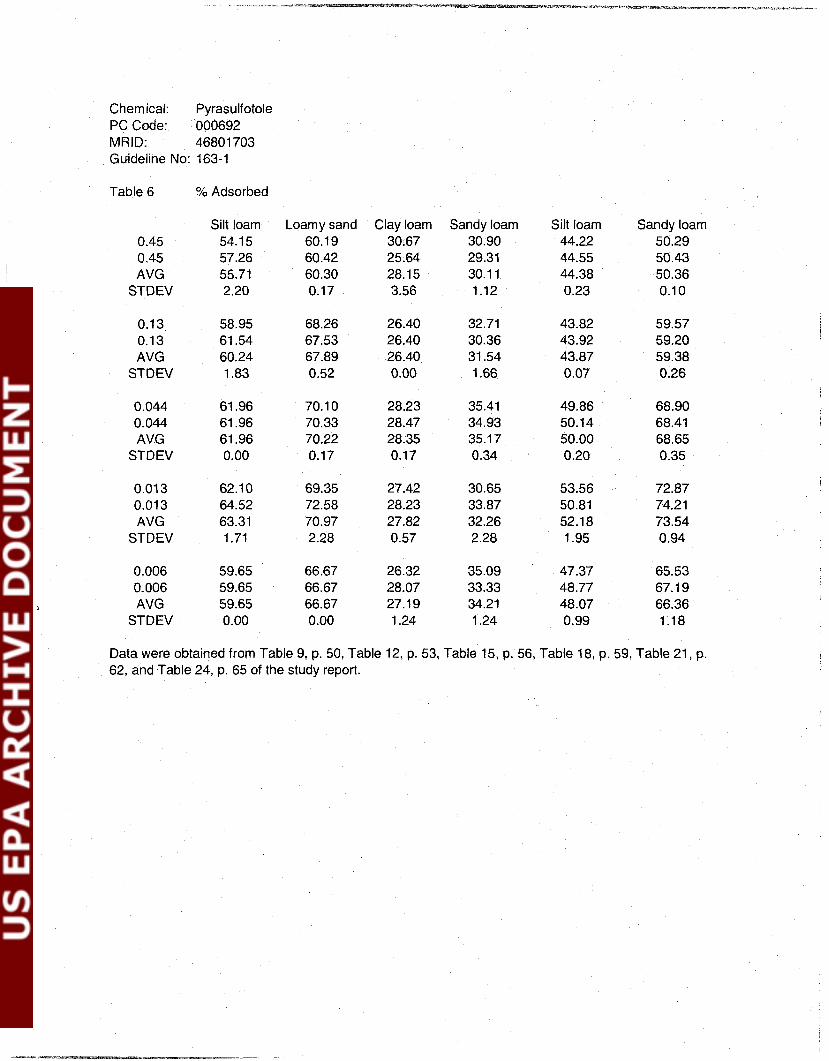
Table 6 % Adsorbed
Silt loam Loamy sand Clay loam Sandy loam Silt loam Sandy loam 0.45 54.1 5 60.19 30.67 30.90 44.22 50.29 0.45 57.26 60.42 25.64 29.31 44.55 50.43 AVG 55.71 60.30 28.15 30.1 1 44.38 50.36
STDEV 2.20 0.17 3.56 1.12 0.23 0.1 0
0.1 3 58.95 68.26 26.40 32.71 43.82 59.57 0.13 61.54 67.53 26.40 30.36 43.92 59.20 AVG 60.24 67.89 26.40 31.54 43.87 59.38
STDEV 1.83 0.52 0.00 1 -66 0.07 0.26
0.044 61.96 70.10 28.23 35.41 49.86 68.90 0.044 61.96 70.33 28.47 34.93 50.14 68.41 AVG 61.96 70.22 28.35 35.17 50.00 68.65
STDEV 0.00 0.17 0.17 0.34 0.20 0.35
0.01 3 62.10 69.35 27.42 30.65 53.56 72.87 0.01 3 64.52 72.58 28.23 33.87 50.81 74.21 AVG 63.31 70.97 27.82 32.26 52.18 73.54
STDEV 1.71 2.28 0.57 2.28 1.95 0.94
0.006 59.65 66.67 26.32 35.09 47.37 65.53 0.006 59.65 66.67 28.07 33.33 48.77 67.19 AVG 59.65 66.67 27.19 34.21 48.07 66.36
STDEV 0.00 0.00 1.24 1.24 0.99 1.18
Data were obtained from Table 9, p. 50, Table 12, p. 53, Table 15, p. 56, Table 18, p. 59, Table 21, P. 62, and Table 24, p. 65 of the study report.

Chem~cal: Pyrasulfotole PC Code: 000692 MRID: 46801 703 Guideline No: 163-1
Table 7
0.45 0.45 AVG
STDEV
0.13 0.13 AVG
STDEV
0.044 0.044 AVG
STDEV
Desorption 2 on soil
Silt loam 0.1248 0.1317 0.1283 0.00
0.0403 0.041 8 0.041 1 0.00
0.0153 0.01 53 0.01 53 0.00
Loamy sand 0.1505 0.1528 0.1517 0.00
0.051 6 0.051 8 0.0517 0.00 '
0.01 91 0.01 90 0.01 91 0.00
Clay loam 0.0679 0.0520 0.0600 0.01
Sandy loam 0.0650 0.0607 0.0629 0.00
Silt loam 0.3644 0.3736 0.3690 0.01
Sandy loam 1.6621 1.71 80 1.6901 0.04
0.01 3 0.0047 0.0057 0.001 5 0.001 5 0.01 46 0.0985 0.01 3 0.0048 0.0059 0.0015 0.0022 0.01 36 0.1014 AVG 0.0048 0.0058 0.001 5 0.001 9 0.01 41
STDEV 0.1000
0.00 0.00 0.00 0.00 0.00 0.00
0.006 0.0022 0.0026 0.0007 0.0012 0.0061 0.0408 0.006 0.0022 0.0026 0.0008 0.0007 0.0063 AVG
0.0429 0.0022 0.0026 0.0008 0.001 0 0.0062
STDEV 0.041 9
0.00 0.00 0.00 0.00 0.00 0.00
Data were obtained from Table 11, p. 52, Table 14, p. 55, Table 17, p. 58, Table 20, p. 61, Table 23, p. 64, and Table 26, p. 67 of the study report.

Chemical: Pyrasulfotole PC Code: 000692 MRID: 46801 703 Guideline No: 163-1
Table 7 Desorption 2 in solution
Silt loam Loamy sand Clay loam Sandy loam Silt loam Sandy loam 0.45 0.0706 0.0525 0.0782 0.0493 0.0405 0.0432 0.45 0.0694 0.0523 0.0534 0.0489 0.0397 0.0435 AVG 0.0700 0.0524 0.0658 0.0491 0.0401 0.0434
STDEV 0.00 0.00 0.02 0.00 0.00 0.00
0.13 0.13 AVG
STDEV
0.044 0.044 AVG
STDEV
0.01 3 0.013 AVG
STDEV
0.006 0.0008 0.0006 0.0007 0.0005 0.006 0.0008 0.0006 0.0007 0.0005 AVG 0.0008 0.0006 0.0007 0.0005
STDEV 0.00 0.00 0.00 0.00
Data were obtained from Table 11, p. 52, Table 14, p. 55, Table 17, p. 58, Table 20, p. 61, Table 23, p. 64, and Table 26, p. 67 of the study report.

Chemical: Pyrasulfotole PC Code: 000692 MRID: 46801 703 Guideline No: 163-1
Table 7 % Desorbed as % of the adsorbed
Silt loam Loamy sand Clay loam Sandy loam Silt loam Sandy loam 0.45 53.58 51.50 66.44 68.16 65.54 61.61 0.45 56.44 47.97 74.28 69.82 65.73 60.59 AVG 55.01 49.73 70.36 68.99 65.64 61.10
STDEV 2.02 2.49 5.54 1.17 0.13 0.72
Data were obtained from Table 7, p. 48 of the study report.

Chemical: Pyrasulfotole PC Code: 000692 MRID: 46801 703 Guideline No: 163-1
Table 8 Adsorption Kd
Silt loam Loamy sand Clay loam Sandy loam Silt loam Sandy loam 1.12 1.35 0.377 0.42 3.42 17.61 1.17 1.61 0.322 0.42 4.01 29.87 1.34 1.87 0.373 0.51 4.37 35.72 1.40 1.92 0.358 0.45 4.53 39.78 1.57 2.12 0.404 0.56 4.94 41.34
AVG 1.32 1.77 0.367 0.47 4.25 32.86
Table 8 Adsorption Koc
Silt loam Loamy sand Clay loam Sandy loam Silt loam Sandy loam 23.8 113 22.2 38.3 228 383 24.9 134 18.9 37.9 267 649 28.6 156 21.9 46.1 291 777 29.8 160 21 .O 40.6 302 865 33.5 176 23.8 50.5 329 899
AVG 28.1 148 21.6 42.7 283 71 5
Data were obtained from Table 9, p. 50; Table 12, p. 53; Table 15, p. 56; Table 18, p. 59; Table 21, p. 62; and Table 24, p. 65 of the study report.
Table 8 Desorption 1 Kd
Silt loam Loamy sand Clay loam Sandy loam Silt loam Sandy loam 1.41 2.04 1.023 0.71 5.61 27.27 1.49 2.39 0.380 0.77 6.78 42.30 1.76 2.85 0.639 0.90 7.24 47.26 1.86 2.96 0.587 0.79 7.42 53.1 5 2.1 5 3.24 0.695 0.98 7.69 54.05
AVG 1.73 2.70 0.665 0.83 6.95 44.81
Table 8 Desorption 1 Koc
Silt loam Loamy sand Clay loam Sandy loam Silt loam Sandy loam 29.9 170 60.2 64.5 374 593 31.6 1 99 22.4 70.1 452 920 37.5 238 37.6 82.2 483 1027 39.5 246 34.6 71.9 494 1155 45.8 270 40.9 89.5 51 3 1175
AVG 36.9 225 39.1 75.6 463 974
Data were obtained from Table 10, p. 51; Table 13, p. 54; Table 16, p. 57; Table 19, p. 60; Table 22, p. 63; and Table 25, p. 66 of the study report.

Chemical: Pyrasulfotole PC Code: 000692 MRID: 46801 703 Guideline No: 1 63-1
Table 8 Desorption 2 Kd
Silt loam Loamy sand Clay loam Sandy loam Silt loam Sandy loam 1.83 2.89 0.91 1 1.28 9.19 38.99 1.92 3.29 0.668 1.44 10.52 55.25 2.28 3.89 1.01 5 1.68 10.81 60.62 2.45 3.98 0.91 7 1.38 10.36 63.37 2.84 4.30 1.106 1.76 1 1.32 64.72
AVG 2.26 3.67 0.923 1.51 10.44 56.59
Table 8 Desorption 2 Koc
Silt loam Loamy sand Clay loam Sandy loam Silt loam Sandy loam 39.0 241 53.6 116.3 61 3 848 40.9 274 39.3 130.7 702 1201 48.5 324 59.7 152.6 720 1318 52.1 331 54.0 125.8 691 1378 60.4 358 65.0 159.9 755 1407
AVG 48.2 306 54.3 137.1 696 1230
Data were obtained from Table 11, p. 52; Table 14, p. 55; Table 17, p. 58; Table 20, p. 61; Table 23, p. 64; and Table 26, p. 67 of the study report.
Chemical: Pyrasulfotole PC Code: 000692 MRID: 46801 703 Guideline No: 163-1
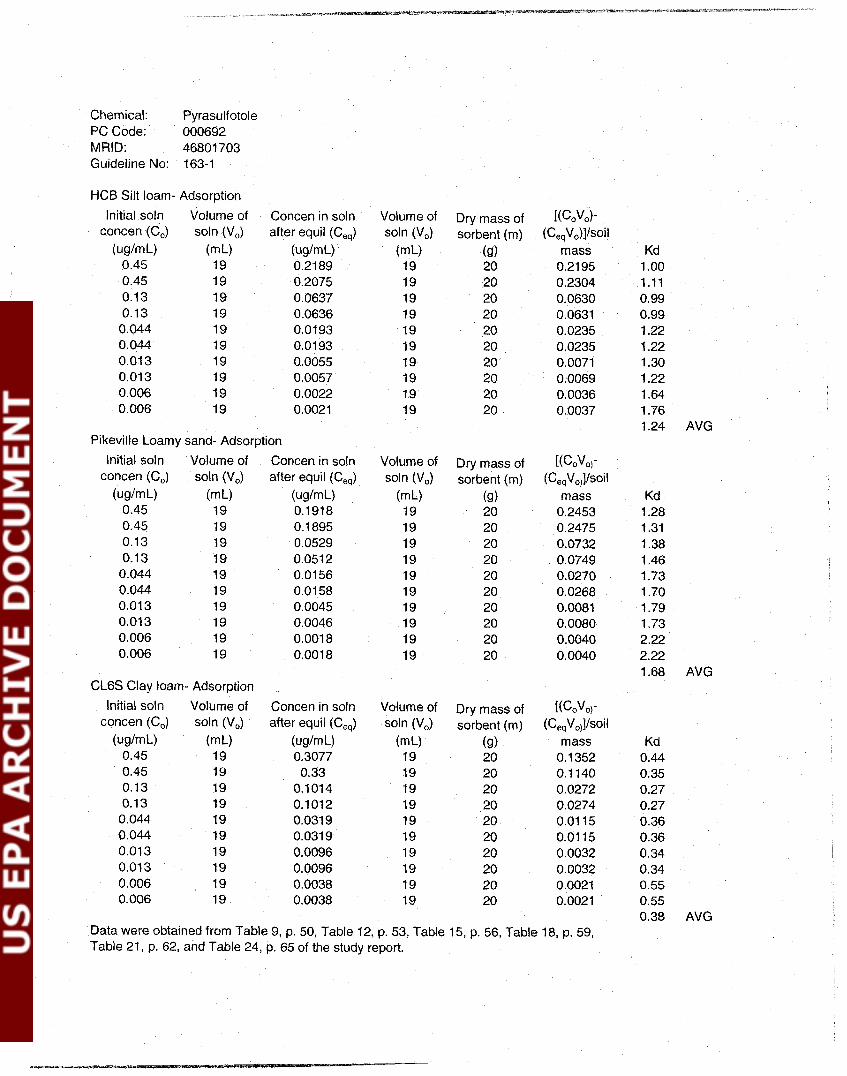
HCB Silt loam- Adsorption
Initial soln concen (C,)
(ug/mL)
Volume of soln (V,)
(mL) 19 19 19 19 19 19 19 19 19 19
Concen in soln after equil (C,,)
(w/mL) 0.21 89 0.2075 0.0637 0.0636 0.0193 0.01 93 0.0055 0.0057 0.0022 0.0021
Pikeville Loamy sand- Adsorption
Initial soln concen (C,)
(ug/mL) 0.45
Volume of soln (V,)
19 19 19 19 19 19 19 19 19 19
CL6S Clay loam- Adsorption
Concen in soln after equil (C,,)
(ug/mL) 0.1918 0.1895 0.0529 0.051 2 0.01 56 0.01 58 0.0045 0.0046 0.0018 0.001 8
Volume of soln (V,)
19 19 19 19 19 19 19 19 19 19
Volume of soln (V,)
19 19 19 19 19 19 19 19 19 19
Dry mass of sorbent (m)
(9) 20 20 20 20 20 20 20 20 20 20
Dry mass of sorbent (m)
(9) 20 20 20 20 20 20 20 20 20 20
[(CoVo)- (CeqV,)]/soil
mass 0.21 95 0.2304 0.0630 0.0631 0.0235 0.0235 0.0071 0.0069 0.0036 0.0037
[(CoVo,- (Ce,Vo)]/soil
mass 0.2453 0.2475 0.0732 0.0749 0.0270 0.0268 0.0081 0.0080 0.0040 0.0040
AVG
Kd 1.28 1.31 1.38 1.46 1.73 1.70 1.79 1.73 2.22 2.22 1.68 AVG
Initial s0ln Volume of Concen in soin Volume of Dry mass of [(COVO)- concen (C,) soln (V,) after equil (C,,) soln (V,) sorbent (m) (C,,V,,]/soil
(WmL) (mL) (ug/mL) (m L) (9) mass ~d 0.45 19 0.3077 19 20 0.1 352 0.44 0.45 19 0.33 19 20 0.1 140 0.35 0.13 19 0.1014 19 20 0.0272 0.27 0.13 19 0.1012 19 20 0.0274 0.27 0.044 19 0.031 9 19 20 0.01 15 0.36 0.044 19 0.031 9 19 20 0.01 15 0.36 0.013 19 0.0096 19 20 0.0032 0.34 0.01 3 19 0.0096 19 20 0.0032 0.34 0.006 19 0.0038 19 20 0.0021 0.55 0.006 19 0.0038 19 20 0.0021 0.55
0.38 AVG Data were obtained from Table 9, p. 50, Table 12, p. 53, Table 15, p. 56, Table 18, p. 59, Table 21, p. 62, and Table 24, p. 65 of the study report.

) Chemical: Pyrasulfotole PC Code: 000692 MRID: 46801 703 Guideline No: 163-1
SL2.3 Sandy loam- Adsorption
Initial soln concen (C,)
(ug/mL) 0.45 0.45 0.13 0.13 0.044 0.044 0.013 0.01 3 0.006 0.006
Volume of soln (V,)
19 19 19 19 19 19 19 19 19 19
Concen in soln after equil (C,,)
(ug/mL) 0.3043 0.3072 0.0924 0.0944 0.029 0.0289 0.0091 0.0088 0.0035 0.0035
Volume of soln (V,)
(mL) 19 19 19 19 19 19 19 19 19 19
Dry mass of sorbent (m)
(9) 20 20 20 20 20 20 20 20 20 20
[(CoVo)- (C,,V,)]lsoil
mass Kd 0.1 384 0.45 0.1357 0.44 0,0357 0.39 0.0338 0.36 0.0143 0.49 0.0143 0.50 0.0037 0.41 0.0040 0.45 0.0024 0.68 0.0024 0.68
0.48 AVG
Carlyle Silt loam- Adsorption lnitial soln Volume of Concen in soln Volume of Dry mass of [(CoVo)-
concen (C,) soln (V,) after equil (C,,) soln (V,) sorbent (m) (C,,V,)]/soil Kd 0.45 23.75 0.2757 23.75 5 0.8279 3.00 0.45 23.75 0.2783 23.75 5 0.81 56 2.93 0.13 23.75 0.0673 23.75 5 0.2978 4.43 0.13 23.75 0.0679 23.75 5 0.2950 4.34 0.044 23.75 0.0241 23.75 5 0.0945 3.92 0.044 23.75 0.0238 23.75 5 0.0960 4.03 0.01 3 23.75 0.0069 23.75 5 0.0290 4.20 0.01 3 23.75 0.0073 23.75 5 0.0271 3.71 0.006 23.75 0.0028 23.75 5 0.01 52 5.43 0.006 23.75 0.0028 23.75 5 0.01 52 5.43
4.14 AVG Nidda Sandy loam- Adsorption
Initial soln Volume of Concen in soln Volume of Dry mass of [(CoVo)- concen (C,) soln (V,) after equil (C,,) soln (V,) sorbent (m) (C,,V,)]/soil Kd
0.45 57 0.2463 57 3 3.8703 15.71 0.45 57 0.2426 57 3 3.9406 16.24 0.13 57 0.0495 57 3 1.5295 30.90 0.13 57 0.0487 57 3 1.5447 31.72 0.044 57 0.01 61 57 3 0.5301 32.93 0.044 57 0.0161 57 3 0.5301 32.93 0.01 3 57 0.0045 57 3 0.1615 35.89 0.01 3 57 0.0046 57 3 0.1596 34.70 0.006 57 0.001 9 57 3 0.0779 41 .OO 0.006 57 0.001 8 57 3 0.0798 44.33
31.63 AVG Data were obtained from Table 9, p. 50, Table 12, p. 53, Table 15, p. 56, Table 18, p. 59, Table 21, p. 62, and Table 24, p. 65 of the study report.