U.S. Engineering & Construction Sector (E&C) · PDF file02/08/2011 · 13 Industrial...
42
Steven M. Fisher, CFA, CPA Analyst 1-212-713-8634 [email protected] August 2011 UBS does and seeks to do business with companies covered in its research reports. As a result, investors should be aware that the firm may have a conflict of interest that could affect the objectivity of this report. Investors should consider this report as only a single factor in making their investment decision. U.S. Engineering & Construction Sector (E&C) This report has been prepared by UBS Securities LLC Analyst Certification and Required Disclosures Begin on Page 36 Rice Global E&C Forum – Roundtable Discussion
Transcript of U.S. Engineering & Construction Sector (E&C) · PDF file02/08/2011 · 13 Industrial...

Steven M. Fisher, CFA, CPAAnalyst
August 2011
UBS does and seeks to do business with companies covered in its research reports. As a result, investors should be aware that the firm may have a conflict of interest that could affect the objectivity of this report. Investors should consider this report as only a single factor in making their investment decision.
U.S. Engineering & Construction Sector (E&C)
This report has been prepared by UBS Securities LLC
Analyst Certification and Required Disclosures Begin on Page 36
Rice Global E&C Forum – Roundtable Discussion

2 IndustrialSteven Fisher- (212) 713-8634
Agenda – A Wall Street View of E&C
E&C in context
Who invests in E&C stocks
Stock drivers
How we analyze E&C stocks/UBS outlook
Valuing E&C stocks
Case studies
Q&A
3 IndustrialSteven Fisher- (212) 713-8634
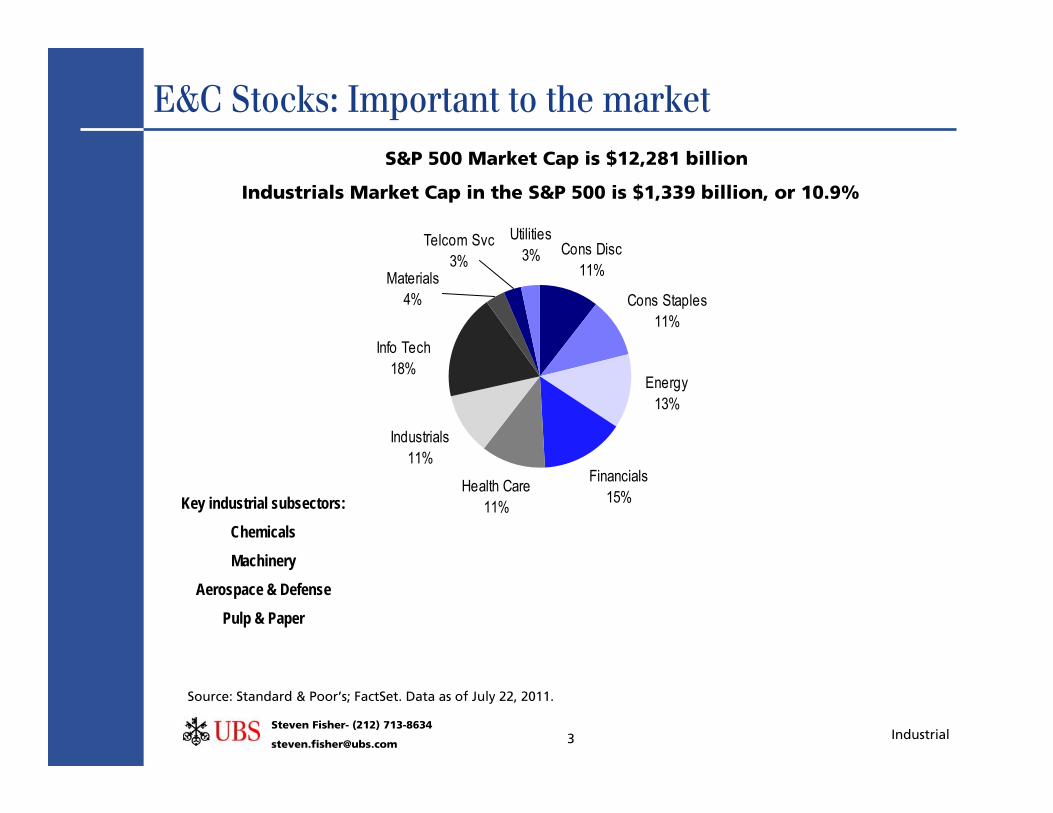
E&C Stocks: Important to the market
Source: Standard & Poor’s; FactSet. Data as of July 22, 2011.
Industrials Market Cap in the S&P 500 is $1,339 billion, or 10.9%
Telcom Svc3%
Materials4%
Info Tech18%
Industrials11%
Utilities3% Cons Disc
11%
Cons Staples11%
Energy13%
Financials15%Health Care
11%
S&P 500 Market Cap is $12,281 billion
Key industrial subsectors:
Chemicals
Machinery
Aerospace & Defense
Pulp & Paper

4 IndustrialSteven Fisher- (212) 713-8634
E&C Stocks: Critical to the world
Source: UBS, company reports
Oil & gas production
Refining
Chemicals
Power generation
Mining
Environmental regulation
Industrial capacity
Non residential construction
Civil infrastructure development
Water sourcing and treatment
Military operations
Federal government: DOE, Security, FEMA,
NASA

5 IndustrialSteven Fisher- (212) 713-8634
E&C Stocks: Critical to the world
Source: UBS

6 IndustrialSteven Fisher- (212) 713-8634
E&C Stocks: Critical to the world
Source: UBS

7 IndustrialSteven Fisher- (212) 713-8634
E&C Stocks: Critical to the world
Source: UBS

8 IndustrialSteven Fisher- (212) 713-8634
E&C Stocks: Critical to the world
Source: UBS

9 IndustrialSteven Fisher- (212) 713-8634
Who owns E&C Stocks?
Source: UBS, FactSet
Fluor Jacobs KBR Shaw CB&I GE AT&T Southern CoInsider 0.5% 3% 0.5% 2.0% 2.0% 0.1% 0.1% 0.1%Institutional 84% 83% 93% 97% 82% 54% 59% 44%
Top 10 Holders
Fluor Jacobs KBR CB&IFidelity Fidelity Capital World Lord Abbett
Blackrock Vanguard Blackrock BlackrockVanguard Blackrock Vanguard Jennison
State Street Artisan Ptrs Fidelity Frontier CapitalJP Morgan AM State Street State Street Wells Capital
Montag & Caldwell William Blair Aronson & Johsnon Southern Sun AMT Rowe Price Perkins Inv TIAA-CREF Rainier Inv Mgmt
MFS Investment Wellington Columbia Mgmt Columbus CircleClearbridge DF Dent NFJ Fairpointe Capital
Winslow Capital TIAA- CREF Cambiar Columbia Mgmt

10 IndustrialSteven Fisher- (212) 713-8634
How are money managers structured?
Source: UBS
Portfolio Manager
Analyst - Sector
Analyst - Sector
Analyst - Sector Analyst - Sector
Analyst - Sector
Analyst - Sector
Analyst - Sector

11 IndustrialSteven Fisher- (212) 713-8634
E&C stocks are late-cycle
Source: UBS Wealth Management Research
Services
Early Expansion
Middle Expansion
Late Expansion
Early Contraction
Late Contraction
Transportation
Technology
Capital Goods
Basic Materials
Energy
Consumer Staples
Utilities
Financials
Consumer Cyclicals
Are we here?
E&C

12 IndustrialSteven Fisher- (212) 713-8634
0
10
20
30
40
50
60
70
Jul-0
0
May-0
1
Mar-0
2
Jan-
03
Nov-0
3
Sep-
04
Jul-0
5
May-0
6
Mar-0
7
Jan-
08
Nov-0
8
Sep-
09
Jul-1
0
May-1
1
Stoc
k pric
e $/bb
l
0
20
40
60
80
100
120
140
160
Oil p
rice $
/bblOil price
MDR stock
E&C Stock Drivers: Oil Prices
Source: FactSet
020
406080
100120
140160
May
-02
Nov-
02M
ay-0
3No
v-03
May
-04
Nov-
04M
ay-0
5No
v-05
May
-06
Nov-
06M
ay-0
7No
v-07
May
-08
Nov-
08M
ay-0
9No
v-09
May
-10
Nov-
10M
ay-1
1
Oil p
rice
$/bb
l
0102030405060708090100
Stoc
k pr
ice $
FLR stock
Oil price
Fluor stock vs. oil price Jacobs stock vs. oil price
0
20
40
60
80
100
120
140
160
May
-02
Nov-
02M
ay-0
3No
v-03
May
-04
Nov-
04M
ay-0
5No
v-05
May
-06
Nov-
06M
ay-0
7No
v-07
May
-08
Nov-
08M
ay-0
9No
v-09
May
-10
Nov-
10M
ay-1
1
Oil p
rice
$/bb
l
0102030405060708090100
Stoc
k pr
ice $
JEC stock
Oil price
0
20
40
60
80
100
120
140
160
May-0
2No
v-02
May-0
3No
v-03
May-0
4No
v-04
May-0
5No
v-05
May-0
6No
v-06
May-0
7No
v-07
May-0
8No
v-08
May-0
9No
v-09
May-1
0No
v-10
May-1
1
Oil p
rice $
/bbl
01020
30405060
708090
Stoc
k pric
e $
FWLT stock
Oil price
Foster Wheeler stock vs. oil price McDermott stock vs. oil price

13 IndustrialSteven Fisher- (212) 713-8634
E&C Stock Drivers: Backlog
Source: FactSet, company reports
FLR rel perf vs. backlog growth
-80%-60%-40%-20%
0%20%40%60%80%
100%
Jan-
82Oc
t-83
Jul-8
5Ap
r-87
Jan-
89Oc
t-90
Jul-9
2Ap
r-94
Jan-
96Oc
t-97
Jul-9
9M
ar-0
1De
c-02
Sep-
04Ju
n-06
Mar
-08
Dec-
09
Chan
ge (%
YOY
)
FLR backlog
FLR relativ e performance
JEC rel perf vs. backlog growth
-20%-10%
0%10%20%30%40%50%60%70%
Dec-
93De
c-94
Dec-
95De
c-96
Dec-
97De
c-98
Dec-
99De
c-00
Dec-
01De
c-02
Dec-
03De
c-04
Dec-
05De
c-06
Dec-
07De
c-08
Dec-
09De
c-10
Back
log Y
OY
-40%-20%0%20%40%60%80%100%120%140%
Rel P
erf
JEC relativ e perf.
JEC YOY backlog
-100%
-50%
0%
50%
100%
150%
200%
250%
Dec-
03Ju
n-04
Dec-
04Ju
n-05
Dec-
05Ju
n-06
Dec-
06Ju
n-07
Dec-
07Ju
n-08
Dec-
08Ju
n-09
Dec-
09Ju
n-10
Dec-
10
% C
hang
e YO
Y
FWLT YOY backlog FWLT relat ive
performance
FWLT YOY scope backlog
FWLT rel perf vs. backlog growth
14 IndustrialSteven Fisher- (212) 713-8634
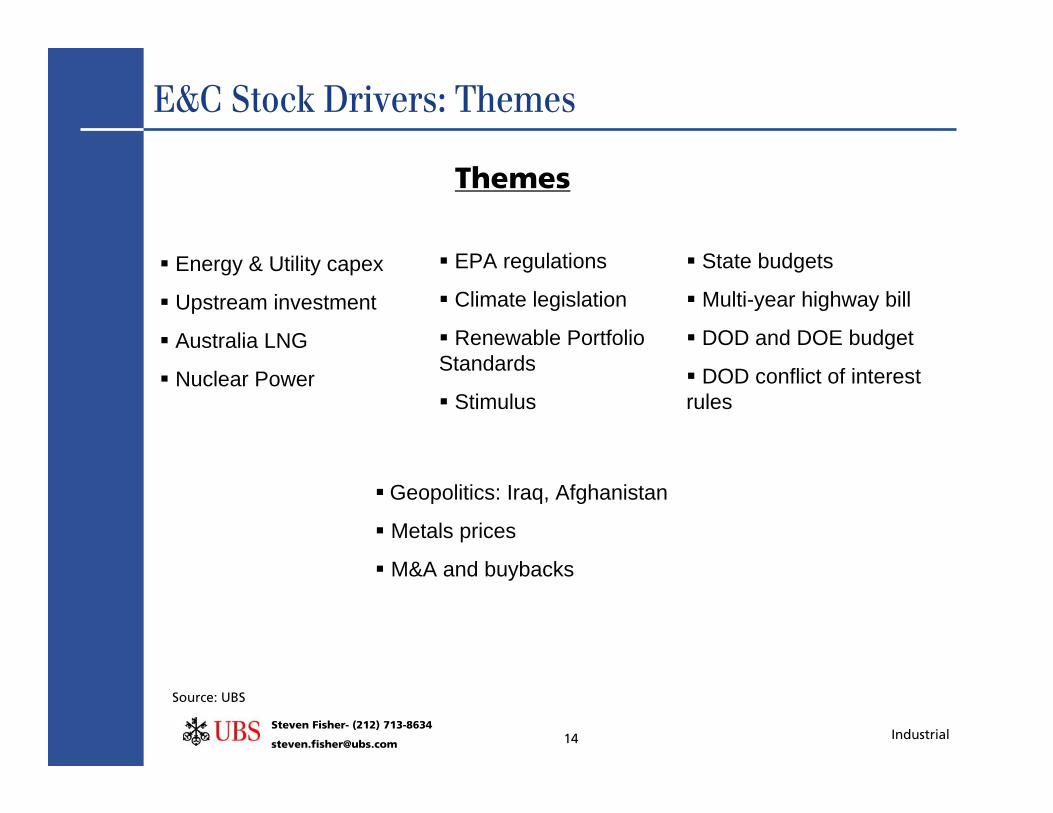
E&C Stock Drivers: Themes
Source: UBS
Energy & Utility capex
Upstream investment
Australia LNG
Nuclear Power
Themes
EPA regulations
Climate legislation
Renewable Portfolio Standards
Stimulus
State budgets
Multi-year highway bill
DOD and DOE budget
DOD conflict of interest rules
Geopolitics: Iraq, Afghanistan
Metals prices
M&A and buybacks

15 IndustrialSteven Fisher- (212) 713-8634
E&C Stock Drivers: Themes
Source: FactSet, Company reports
Themes
$22
$23
$24
$25
$26
$27
$28
$29
15-J
ul-07
19-J
ul-07
23-J
ul-07
27-J
ul-07
31-J
ul-07
4-Au
g-07
8-Au
g-07
12-A
ug-0
716
-Aug
-07
20-A
ug-0
724
-Aug
-07
28-A
ug-0
7
ACM
sto
ck p
rice
1,300
1,350
1,400
1,450
1,500
1,550
1,600
S&P
500
S&P 500
ACM
I-35W bridge collapse
$0$5
$10$15$20$25$30$35$40
1-Ja
n-10
5-Ja
n-10
9-Ja
n-10
13-J
an-1
017
-Jan
-10
21-J
an-1
025
-Jan
-10
29-J
an-1
02-
Feb-
106-
Feb-
1010
-Feb
-10
14-F
eb-1
018
-Feb
-10
22-F
eb-1
026
-Feb
-10
SHAW
sto
ck p
rice
1,0001,0201,0401,0601,0801,1001,1201,1401,160
S&P
500
S&P 500
SHAW
State of the Union (1/27/10)
$0$5
$10$15$20$25$30$35$40$45
1-M
ar-1
15-
Mar
-11
9-M
ar-1
113
-Mar
-11
17-M
ar-1
121
-Mar
-11
25-M
ar-1
129
-Mar
-11
2-Ap
r-11
6-Ap
r-11
10-A
pr-1
114
-Apr
-11
KBR
stoc
k pr
ice
1,2001,2201,2401,2601,2801,3001,3201,3401,360
S&P
500
S&P
KBR
Tōhoku earthquake
Nuclear theme Infrastructure improvement
LNG demand

16 IndustrialSteven Fisher- (212) 713-8634
$0$1,000$2,000$3,000$4,000$5,000$6,000$7,000$8,000$9,000
2003
2005
2007
Dec-0
8
Jun-
09
Dec-0
9
Jun-
10
Dec-1
0
CBI b
acklo
g ($
mn)
$0$1,000$2,000$3,000$4,000$5,000$6,000$7,000$8,000$9,000
$10,000
2003
2005
2007
Dec-0
8
Jun-
09
Dec-0
9
Jun-
10
Dec-1
0
FWLT
bac
klog
($m
n)
$0$2,000$4,000$6,000$8,000
$10,000$12,000$14,000$16,000$18,000
2003
2005
2007
Dec-0
8
Jun-
09
Dec-0
9
Jun-
10
Dec-1
0
JEC
back
log
($m
n)
$0$1,000$2,000$3,000$4,000$5,000$6,000$7,000$8,000$9,000
2003
2005
2007
Dec-0
8
Jun-
09
Dec-0
9
Jun-
10
Dec-1
0
ACM
back
log
($m
n)
$0
$1,000
$2,000
$3,000
$4,000
$5,000
$6,000
2003
2005
2007
Dec-0
8
Jun-
09
Dec-0
9
Jun-
10
Dec-1
0
BWC
back
log
($m
n)
Foster Wheeler
Company Backlog
Source: Company reports
AECOM Babcock & Wilcox
CB&I
$0
$5,000
$10,000
$15,000$20,000
$25,000
$30,000
$35,000
$40,000
2003
2005
2007
Dec-0
8
Jun-
09
Dec-0
9
Jun-
10
Dec-1
0
FLR
back
log
($m
n)
Fluor
Jacobs
$0$10,000$20,000$30,000$40,000$50,000$60,000$70,000$80,000$90,000
$100,000
1996
1998
2000
2002
2004
2006
2008
2010
Bech
tel b
acklo
g ($
mn)
Bechtel
$0$2,000$4,000$6,000$8,000
$10,000$12,000$14,000$16,000$18,000
2003
2005
2007
Dec-0
8
Jun-
09
Dec-0
9
Jun-
10
Dec-1
0
KBR
back
log
($m
n)
$0
$1,000
$2,000
$3,000
$4,000
$5,000
$6,000
2003
2005
2007
Dec-0
8
Jun-
09
Dec-0
9
Jun-
10
Dec-1
0
MDR
back
log
($m
n)
KBR McDermott

17 IndustrialSteven Fisher- (212) 713-8634
Company Backlog
Notes: SHAW - Each quarter ends one month earlier than x-axis label.Source: Company reports
$0$1,000$2,000$3,000$4,000$5,000$6,000$7,000$8,000$9,000
2003
2005
2007
Dec-0
8
Jun-
09
Dec-0
9
Jun-
10
Dec-1
0
TPC
back
log
($m
n)
$0
$5,000
$10,000
$15,000
$20,000
$25,000
2003
2005
2007
Dec-
08
Jun-
09
Dec-
09
Jun-
10
Dec-
10
Jun-
11
SHAW
bac
klog
($m
n)
$0
$5,000
$10,000
$15,000
$20,000
$25,000
2003
2005
2007
Dec-0
8
Jun-
09
Dec-0
9
Jun-
10
Dec-1
0
URS
back
log
($m
n)
$0
$500
$1,000
$1,500
$2,000
$2,500
2003
2005
2007
Dec-0
8
Jun-
09
Dec-0
9
Jun-
10
Dec-1
0
WG
back
log
($m
n)Tutor Perini Shaw Group URS
Willbros
Book/Bill as of Dec. 31: 2003 2004 2005 2006 2007 2008 2009 Mar-10 Jun-10 Sep-10 Dec-10JEC 1.1 1.2 1.2 1.2 1.5 1.1 0.9 0.9 0.5 0.9 0.9FLR 1.1 1.4 1.0 1.4 1.4 1.1 0.7 0.7 1.8 1.4 1.3FWLT n/a n/a 1.4 1.1 1.2 0.9 0.9 1.5 1.1 1.1 1.5URS3 1.3 1.0 1.1 1.2 3.6 0.9 1.0 1.1 0.6 1.3 0.7KBR n/a n/a n/a 0.0 1.4 1.1 1.0 0.7 0.7 1.0 0.9MDR 0.6 0.9 1.4 2.5 1.3 0.9 0.7 2.6 1.1 0.1 3.7SHAW1 n/a 1.3 1.4 1.5 1.7 1.1 2.0 0.5 0.5 0.9 0.3ACM2 1.0 1.0 1.1 1.1 1.1 1.4 1.1 0.7 1.0 1.7 1.6BWC 1.3 0.8 1.1 1.7 1.5 1.1 0.8 1.0 0.4 1.0 2.2Average4 1.1 1.1 1.2 1.3 1.6 1.0 1.0 1.1 0.8 1.0 1.5Note: (1) SHAW is as of Nov. end of same year. In 2009, we estimate $9.5bn in bookings from nuclear awards. Ex the awards, book to bill would have been 0.7x. (2) ACM is as of Sept. end from 2006 back. (3) In 2007, increased bookings due to WNG acquisition. (4) Average in 2009 assuming SHAW of 0.7x (ex-nuclear bookings) would be 0.9x.

18 IndustrialSteven Fisher- (212) 713-8634
0100200300400500600700800900
2004
2005
2006
2007
2008
2009
2010
2011
E
2012
E
$ bi
llion
s
Year-over-year change2004 2005 2006 2007 2008 2009 2010 2011E 2012E 2005 2006 2007 2008 2009 2010 2011E 2012E
Major Oil Companies 22 120 149 188 229 295 289 307 360 359 24% 26% 22% 29% -2% 6% 17% 0%Secondary Oil Companies 38 18 27 37 46 59 51 63 76 73 47% 38% 26% 27% -13% 24% 20% -3%Global Oil Drilling 26 5 7 11 16 21 17 17 20 17 38% 64% 48% 30% -20% 1% 19% -17%Pipeline 22 7 8 14 19 27 22 23 27 25 26% 66% 40% 38% -16% 4% 16% -7%Mining 30 12 17 25 32 55 36 42 57 65 36% 50% 28% 73% -34% 17% 36% 13%Coal 16 1 2 2 4 4 7 5 11 10 44% 32% 46% 13% 72% -34% 137% -11%
Subtotal 154 163 209 277 347 460 422 457 552 549 28% 33% 25% 33% -8% 8% 21% -1%Electric Utilities 78 86 97 120 149 182 168 166 188 172 13% 24% 24% 22% -8% -1% 13% -9%Gas Utilities 26 17 20 28 36 44 52 53 56 56 19% 41% 27% 25% 17% 1% 6% 1%Water Utilities 6 3 2 3 3 4 4 4 4 4 -38% 27% 17% 34% -9% -10% 21% -1%
Utilities 110 106 119 151 188 231 223 222 248 232 12% 27% 25% 23% -3% 0% 12% -6%Chemicals 66 22 26 31 36 41 36 34 45 46 16% 21% 15% 14% -13% -4% 31% 2%Total 330 292 353 459 570 732 681 714 845 827 21% 30% 24% 28% -7% 5% 18% -2%
# companiesCapex ($ billions)
Energy & Utility capex
Source: UBS analysts (330 major energy and utility companies worldwide), updated 7/10/11 (see published note).
Fig. 1: UBS Estimates of Total Capital Spending Plans (2004-2012E) of Energy & Utility Companies Under UBS Coverage – by Sector
Fig. 2: UBS Estimates of Total Capital Spending Plans (2004-2012E) of Energy & Utility Companies Under UBS Coverage
Source: UBS analysts (330 major energy and utility companies worldwide), updated 7/10/11 (see published note).

19 IndustrialSteven Fisher- (212) 713-8634
E&C Backlog & Capex, Book/Bill, Burn Rate
Aggregate E&C Backlog vs. Energy & Utility Capex
Source: UBS, Company reports
$0
$100
$200
$300
$400
$500
$600
$700
$800
$900
2004 2005 2006 2007 2008 2009 2010 2011E 2012E
End
Mark
et C
apex
($bn
)
$0
$20
$40
$60
$80
$100
$120
$140
Aggr
egat
e E&C
Bac
klog
($bn
)
Capex
Backlog
20 IndustrialSteven Fisher- (212) 713-8634
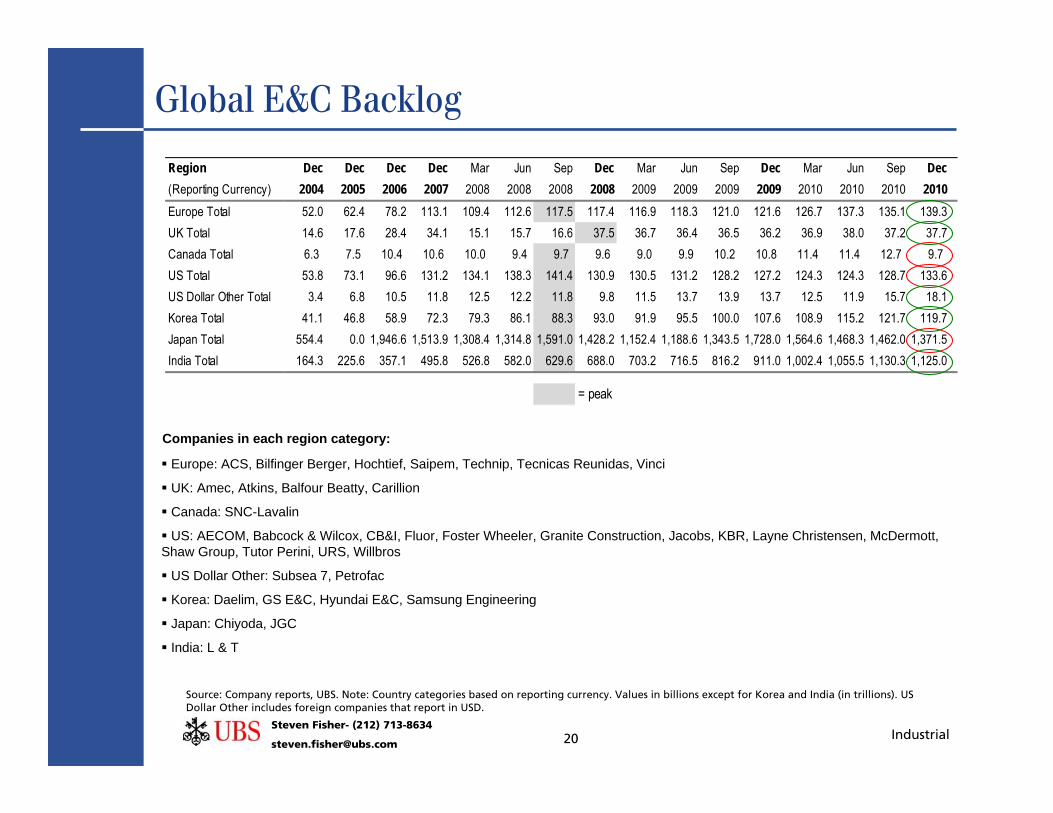
Global E&C Backlog
Source: Company reports, UBS. Note: Country categories based on reporting currency. Values in billions except for Korea and India (in trillions). US Dollar Other includes foreign companies that report in USD.
Europe: ACS, Bilfinger Berger, Hochtief, Saipem, Technip, Tecnicas Reunidas, Vinci
UK: Amec, Atkins, Balfour Beatty, Carillion
Canada: SNC-Lavalin
US: AECOM, Babcock & Wilcox, CB&I, Fluor, Foster Wheeler, Granite Construction, Jacobs, KBR, Layne Christensen, McDermott, Shaw Group, Tutor Perini, URS, Willbros
US Dollar Other: Subsea 7, Petrofac
Korea: Daelim, GS E&C, Hyundai E&C, Samsung Engineering
Japan: Chiyoda, JGC
India: L & T
Companies in each region category:
Region Dec Dec Dec Dec Mar Jun Sep Dec Mar Jun Sep Dec Mar Jun Sep Dec(Reporting Currency) 2004 2005 2006 2007 2008 2008 2008 2008 2009 2009 2009 2009 2010 2010 2010 2010Europe Total 52.0 62.4 78.2 113.1 109.4 112.6 117.5 117.4 116.9 118.3 121.0 121.6 126.7 137.3 135.1 139.3UK Total 14.6 17.6 28.4 34.1 15.1 15.7 16.6 37.5 36.7 36.4 36.5 36.2 36.9 38.0 37.2 37.7Canada Total 6.3 7.5 10.4 10.6 10.0 9.4 9.7 9.6 9.0 9.9 10.2 10.8 11.4 11.4 12.7 9.7 US Total 53.8 73.1 96.6 131.2 134.1 138.3 141.4 130.9 130.5 131.2 128.2 127.2 124.3 124.3 128.7 133.6US Dollar Other Total 3.4 6.8 10.5 11.8 12.5 12.2 11.8 9.8 11.5 13.7 13.9 13.7 12.5 11.9 15.7 18.1Korea Total 41.1 46.8 58.9 72.3 79.3 86.1 88.3 93.0 91.9 95.5 100.0 107.6 108.9 115.2 121.7 119.7Japan Total 554.4 0.0 1,946.6 1,513.9 1,308.4 1,314.8 1,591.0 1,428.2 1,152.4 1,188.6 1,343.5 1,728.0 1,564.6 1,468.3 1,462.0 1,371.5India Total 164.3 225.6 357.1 495.8 526.8 582.0 629.6 688.0 703.2 716.5 816.2 911.0 1,002.4 1,055.5 1,130.3 1,125.0
= peak

21 IndustrialSteven Fisher- (212) 713-8634
Fixed price mix increasing?
Source: Company reports, UBS estimates
Fixed Price Exposure by Company
Historical Fixed Price Exposure
2001 2002 2003 2004 2005 2006 2007 2008 2009 2010FLR 45% 33% 40% 27% 32% 26% 24% 25% 21% 29%JEC 23% 19% 18% 17% 15% 10% 12% 14% 15% 13%SHAW 18% 22% 23% 22% 30% 40% 52% 40% 45% 48%FWLT 45% 37% 56% 60% 42% 28% 21% 25% 17% 44%TPC 41% 30% 30% 32% 8% 8% 8% 22% 47% 57%KBR 43% 28% 20% 18% 21%ACM 38% 37% 38% 37%
Average 34% 28% 33% 32% 25% 26% 26% 26% 29% 36%
Company % Fixed Price Comment
Shaw Group 48% of 8/31/10 backlogAECOM (1) 37% of fiscal 2010 revenues; design/engineeringKBR 20% of 3/31/11 backlogWillbros 59% of 6/30/10 backlogFluor 29% of 12/31/10 backlogFoster Wheeler (2) 45% of 3/31/11 total backlogURS 10-15% 2008 revenue base; may also have some unit price contractsJacobs 13% of FY10 revenues; plus 1% guaranteed maxTutor Perini 57% of 12/31/10 backlog; 43% is cost plus and guaranteed maxMcDermott 62% of 6/30/10 backlog
Average 38%
CB&I n/a "A portion of our net revenue is... from fixed-price, lump-sum contracts"
(2) FWLT Scope backlog is 68% fixed price; some fixed price is for design.
(1) AECOM is a pure design/engineering firm; we believe fixed price engineering is less of a concern than fixed price construction.

22 IndustrialSteven Fisher- (212) 713-8634
U.S. Public Construction Spending
Source: US Census Bureau. Note: Includes the following categories of public construction not shown separately: lodging, religious, communication and mfg. $ mns.
Type of Construction: 2002 2003 2004 2005 2006 2007 2008 2009 2010 June '10 June '11
Total Public Construction 1 213,438 216,127 220,183 234,160 255,385 289,073 308,738 314,895 303,024 136,560 128,499
Residential 5,264 5,216 5,508 5,608 6,083 7,222 7,489 8,015 9,905 4,466 4,145
Nonresidential 208,174 210,911 214,675 228,552 249,303 281,852 301,249 306,880 293,119 132,094 124,354 Office 8,982 8,839 9,525 8,487 8,507 11,445 13,061 14,626 13,342 6,629 5,741 Commercial 3,512 4,024 3,862 3,658 3,345 3,827 3,558 3,609 2,876 1,277 1,614 Health care 4,701 5,112 5,912 5,935 6,456 8,179 8,464 9,536 9,562 4,532 5,258 Educational 60,753 60,892 61,549 66,899 71,089 80,068 86,267 86,351 74,871 35,343 32,358 Public safety 7,610 6,976 6,730 6,906 7,350 9,606 12,460 13,316 10,911 5,570 4,671 Amusement and recreation 9,851 9,066 8,263 7,728 9,707 11,019 11,320 11,002 10,418 4,730 4,395 Transportation 19,007 18,142 18,219 17,928 19,310 22,868 25,537 27,646 28,321 13,401 11,990 Power 4,196 7,831 8,035 9,161 8,590 11,940 11,833 12,797 11,939 5,299 6,035 Highway and street 57,350 56,974 58,294 63,790 71,567 76,248 81,161 82,056 82,548 33,034 31,125 Sewage and waste disposal 15,991 16,304 17,598 19,627 22,881 24,464 25,031 24,362 25,642 11,817 10,713 Water supply 12,045 12,100 12,215 13,703 14,483 15,282 16,286 15,152 14,641 6,829 6,448 Conservation and development 3,516 3,694 3,869 4,322 5,047 5,155 5,179 5,720 6,910 3,137 3,395
Total Public Construction 1 1% 2% 6% 9% 13% 7% 2% -4% -6%
Residential -1% 6% 2% 8% 19% 4% 7% 24% -7%
Nonresidential 1% 2% 6% 9% 13% 7% 2% -4% -6% Office -2% 8% -11% 0% 35% 14% 12% -9% -13% Commercial 15% -4% -5% -9% 14% -7% 1% -20% 26% Health care 9% 16% 0% 9% 27% 3% 13% 0% 16% Educational 0% 1% 9% 6% 13% 8% 0% -13% -8% Public safety -8% -4% 3% 6% 31% 30% 7% -18% -16% Amusement and recreation -8% -9% -6% 26% 14% 3% -3% -5% -7% Transportation -5% 0% -2% 8% 18% 12% 8% 2% -11% Power 87% 3% 14% -6% 39% -1% 8% -7% 14% Highway and street -1% 2% 9% 12% 7% 6% 1% 1% -6% Sewage and waste disposal 2% 8% 12% 17% 7% 2% -3% 5% -9% Water supply 0% 1% 12% 6% 6% 7% -7% -3% -6% Conservation and development 5% 5% 12% 17% 2% 0% 10% 21% 8%
YTD

23 IndustrialSteven Fisher- (212) 713-8634
$0
$10
$20
$30
$40
$50
Jan Feb Mar Apr May Jun Jul Aug Sep Oct Nov Dec
Mont
hly I
ssua
nce (
$ in
billi
ons)
2009 2010 2011 5-year Average
Infrastructure and Non-Res Construction Indicators
Source: U..S. DOT Note: Data is cumulative.
Municipal Bond Issuances Transportation Stimulus
Source: Thomson Reuters, UBS estimates
6%
8%
10%
12%
14%
16%
18%
20%
Mar-0
3Se
p-03
Mar-0
4Se
p-04
Mar-0
5Se
p-05
Mar-0
6Se
p-06
Mar-0
7Se
p-07
Mar-0
8Se
p-08
Mar-0
9Se
p-09
Mar-1
0Se
p-10
Mar-1
1
Index
Valu
e (%
)
Office Vacancy Rates
Source: Reis Inc.
65%
70%
75%
80%
85%
90%
Jun-
92Ju
n-93
Jun-
94Ju
n-95
Jun-
96Ju
n-97
Jun-
98Ju
n-99
Jun-
00Ju
n-01
Jun-
02Ju
n-03
Jun-
04Ju
n-05
Jun-
06Ju
n-07
Jun-
08Ju
n-09
Jun-
10Ju
n-11
CapU
(%)
Source: U.S. Census Bureau
Capacity Utilization (Current Dollars)
Ex pansion
Contraction
$0
$10,000
$20,000
$30,000
$40,000
$50,000
Mar
-09
May
-09
Jul-0
9Se
p-09
Nov-
09Ja
n-10
Mar
-10
May
-10
Jul-1
0Se
p-10
Nov-
10Ja
n-11
Mar
-11
May
-11
Jul-1
1
Oblig
atio
ns ($
mn)
$0$5,000$10,000$15,000$20,000$25,000$30,000$35,000
Disb
urse
men
ts ($
mn)
Obligations Disbursements

24 IndustrialSteven Fisher- (212) 713-8634
Cash flow, Net Debt, and Headcount
Source: Company reports Note: Period relates to fiscal year end.
Free Cash Flow
HeadcountCash and Debt ($mn)
Source: Company reports (May 2011)
1998 1999 2000 2001 2002 2003 2004 2005 2006 2007 2008 2009 2010 TotalFLR 102 -39 -302 466 133 -383 -189 195 22 621 653 666 286 2,230JEC 44 43 37 -29 124 122 51 117 170 296 199 478 148 1,798FWLT -193 -134 -63 -123 107 -75 -40 40 294 374 325 234 127 874URS 20 -12 -5 27 15 159 77 177 136 272 252 553 411 2,083TPC 26 26 41 -29 -8 37 55 18 95 258 59 -63 1 517SHAW -18 10 -90 -27 241 -224 -50 38 -147 394 494 585 254 1,460MDR n/a -83 -76 152 702 -38 -32 -18 -235 845 n/a n/a n/a n/aKBR n/a n/a n/a n/a n/a n/a -135 451 874 205 54 -151 415 n/aWG n/a n/a n/a n/a n/a n/a n/a n/a -115 -44 192 40 -3 n/aACM n/a n/a n/a n/a n/a n/a n/a n/a 89 89 87 152 82 n/a
Company Debt Cash Net DebtFLR 83 1,991 (1,908) FWLT 171 1,103 (932) WG 362 79 282 TPC 422 367 55 GVA 273 324 (50) JEC 434 748 (314) URS 695 487 208 SHAW 1 709 (708) CBI 85 430 (345) KBR 149 788 (639) ACM 1,169 348 821 LAYN 42 47 (5) BWC 5 292 (287) MDR 65 535 (470)
2001 2002 2003 2004 2005 2006 2007 2008 2009 2010
ACM n/a n/a n/a n/a 22,000 27,300 32,000 43,000 43,200 48,100 BWC n/a n/a n/a n/a n/a n/a n/a n/a 13,000 12,000 FLR 51,313 44,809 29,011 34,799 34,836 37,560 41,260 42,119 36,152 39,229 FWLT 10,394 8,945 6,661 6,723 8,953 11,992 13,859 14,729 13,446 12,105 JEC 29,300 34,900 33,700 35,400 38,600 43,800 49,200 57,100 53,200 52,200 KBR n/a n/a n/a n/a n/a 56,000 52,000 57,000 51,000 35,000 MDR 13,300 18,200 16,000 12,500 14,200 27,800 28,400 26,400 29,000 15,000 SHAW 11,000 17,000 14,800 17,200 19,000 22,000 27,000 26,000 28,000 27,000 TPC 3,400 3,200 1,725 1,520 3,900 5,275 4,100 7,100 4,072 3,096 URS 16,000 25,000 26,000 27,500 29,200 29,300 56,000 50,000 45,000 47,000 WG 3,790 4,620 3,282 3,766 4,870 4,156 5,475 6,512 3,714 7,271

25 IndustrialSteven Fisher- (212) 713-8634
P/EPrice Market
Company Ticker 08/02/11 Cap 09A 10A 11E 12E 10A 11E 12E 09A 10A 11E 12E 09A 10A 11E 12EFluor FLR 60.53 10,836 3.75 2.30 3.32 3.96 -39% 44% 19% 16.1 26.3 18.3 15.3 -21% 79% 40% 29%Jacobs JEC 37.72 4,804 2.85 2.42 2.77 3.09 -15% 14% 12% 13.2 15.6 13.6 12.2 -35% 6% 5% 3%Foster Wheeler FWLT 27.02 3,386 2.96 1.64 1.48 2.23 -45% -10% 50% 9.1 16.5 18.2 12.1 -55% 12% 40% 2%McDermott MDR 19.14 4,531 0.86 1.24 1.30 1.66 44% 4% 28% 22.3 15.4 14.8 11.5 10% 5% 13% -3%Willbros WG 7.79 379 0.49 -0.96 -0.65 0.64 -296% nmf -199% 15.9 nmf nmf 12.1 -22% nmf nmf 2%URS URS 38.93 3,068 3.09 3.54 3.64 4.01 15% 3% 10% 12.6 11.0 10.7 9.7 -38% -25% -18% -18%KBR KBR 33.92 5,156 1.79 2.09 2.66 2.78 17% 27% 4% 18.9 16.2 12.7 12.2 -7% 11% -2% 3%Tutor Perini TPC 15.46 740 2.79 2.13 2.20 2.50 -24% 3% 14% 5.5 7.3 7.0 6.2 -73% -51% -46% -48%CB&I CBI 39.23 3,929 1.79 2.04 2.45 3.02 14% 20% 23% 21.9 19.2 16.0 13.0 8% 31% 23% 9%AECOM ACM 23.58 2,811 1.73 2.13 2.49 2.88 23% 17% 15% 13.6 11.1 9.5 8.2 -33% -25% -27% -31%Shaw Group SHAW 25.62 1,851 1.93 1.52 0.70 2.43 -21% -54% 249% 13.3 16.9 36.8 10.5 -35% 15% 183% -11%Babcock & Wilcox BWC 24.42 2,881 1.42 1.30 1.30 1.88 -8% 0% 44% 17.3 18.8 18.8 13.0 -15% 28% 44% 10%Granite Construction GVA 22.04 852 1.90 -1.56 1.06 1.50 -182% nmf 42% 11.6 nmf 20.9 14.7 -43% nmf 60% 24%Layne Christensen LAYN 26.90 529 0.90 1.53 2.07 2.15 70% 35% 4% 29.9 17.6 13.0 12.5 47% 20% 0% 5%
Average -32% 9% 23% 15.8 16.0 16.2 11.7 -22% 9% 24% -2%Average ex-LAYN -18% 6% 43% 14.7 15.8 16.4 11.6 -28% 8% 26% -2%S&P 500 - Consensus 1,254 62 85 96 105 39% 13% 10% 20.3 14.7 13.0 11.9S&P 500 - UBS 1,254 62 85 96 104 37% 12% 8% 20.1 14.7 13.1 12.1
EV/EBITDAEV
Company Ticker 08/02/11 09A 10A 11E 12E 10A 11E 12E 09A 10A 11E 12EFluor FLR 8,961 1305 948 1167 1351 -27% 23% 16% 6.9 9.5 7.7 6.6Jacobs JEC 4,499 632 558 651 687 -12% 17% 6% 7.1 8.1 6.9 6.5Foster Wheeler FWLT 2,496 510 354 322 451 -31% -9% 40% 4.9 7.1 7.7 5.5McDermott MDR 4,130 435 458 496 603 5% 8% 22% 9.5 9.0 8.3 6.8Willbros WG 604 78 54 99 153 -31% 83% 55% 7.7 11.2 6.1 3.9URS URS 3,373 642 678 736 777 6% 9% 6% 5.3 5.0 4.6 4.3KBR KBR 4,550 591 676 677 743 14% 0% 10% 7.7 6.7 6.7 6.1Tutor Perini TPC 795 267 204 224 256 -24% 10% 14% 3.0 3.9 3.5 3.1CB&I CBI 3,656 394 376 435 521 -5% 16% 20% 9.3 9.7 8.4 7.0AECOM ACM 3,685 377 475 565 629 26% 19% 11% 9.8 7.8 6.5 5.9Shaw Group SHAW 1,177 334 278 168 359 -17% -40% 114% 3.5 4.2 7.0 3.3Babcock & Wilcox BWC 2,594 352 336 312 419 -5% -7% 34% 7.4 7.7 8.3 6.2Granite Construction GVA 835 209 -35 149 178 -117% nmf 19% 4.0 nmf 5.6 4.7Layne Christensen LAYN 527 72 96 107 114 33% 11% 7% 7.3 5.5 4.9 4.6
Average 2,992 443 390 436 517 -13% 11% 27% 6.7 7.3 6.6 5.3Average ex-WG 471 416 462 545 -12% 5% 24% 6.6 7.0 6.6 5.4
EPS Growth (YoY) P/E Relative P/E
EBITDA Consensus (Calendar) EBITDA Growth (YoY) EV/EBITDA
EPS Consensus (Calendar)
Engineering & Construction – Consensus
Source: Company reports, Bloomberg, Thomson/FactSet consensus data used for all companies; UBS covers all companies except CB&I and GVA.
Industry comps as of August 2, 2011
EV/BacklogTicker EV Backlog EV/BacklogFLR 8,961 37,186 0.24JEC 4,499 14,002 0.32FWLT 2,496 3,921 0.64MDR 4,130 4,764 0.87WG 604 2,393 0.25URS 3,373 16,300 0.21KBR 4,550 11,974 0.38TPC 795 4,231 0.19CBI 3,656 7,257 0.50ACM 3,685 8,518 0.43SHAW 1,177 19,715 0.06BWC 2,594 4,907 0.53GVA 835 2,004 0.42LAYN 527 530 0.99Average 0.43

26 IndustrialSteven Fisher- (212) 713-8634
0x10x20x30x40x50x60x
1976
1978
1980
1982
1984
1986
1988
1990
1992
1994
1996
1998
2000
2002
2004
2006
2008
2010
JEC
P/E
(NTM
)
Valuation Charts – P/E and EV/EBITDA
Source: FactSet
JEC
0x2x4x6x8x
10x12x14x16x18x
Jun-
02De
c-02
Jun-
03De
c-03
Jun-
04De
c-04
Jun-
05De
c-05
Jun-
06De
c-06
Jun-
07De
c-07
Jun-
08De
c-08
Jun-
09De
c-09
Jun-
10De
c-10
Jun-
11
JEC
- EV/
EBIT
DA (N
TM)

27 IndustrialSteven Fisher- (212) 713-8634
Source: FactSet
Valuation Charts – P/E and EV/EBITDAURS
0x
5x
10x15x
20x
25x
1991
1992
1993
1994
1995
1996
1997
1998
1999
2000
2001
2002
2003
2004
2005
2006
2007
2008
2009
2010
URS
- P/E
(NTM
)
0x2x4x6x8x
10x12x
Jun-
02De
c-02
Jun-
03De
c-03
Jun-
04De
c-04
Jun-
05De
c-05
Jun-
06De
c-06
Jun-
07De
c-07
Jun-
08De
c-08
Jun-
09De
c-09
Jun-
10De
c-10
Jun-
11
URS
- EV/
EBIT
DA (N
TM)

28 IndustrialSteven Fisher- (212) 713-8634
0x10x20x30x40x50x60x
1976
1978
1980
1982
1984
1986
1988
1990
1992
1994
1996
1998
2000
2002
2004
2006
2008
2010
FLR
- P/E
(NTM
)
Valuation Charts – P/E and EV/EBITDAFLR
Source: FactSet
0x2x4x6x8x
10x12x14x16x18x
Jun-
02De
c-02
Jun-
03De
c-03
Jun-
04De
c-04
Jun-
05De
c-05
Jun-
06De
c-06
Jun-
07De
c-07
Jun-
08De
c-08
Jun-
09De
c-09
Jun-
10De
c-10
Jun-
11
FLR
- EV/
EBIT
DA (N
TM)

29 IndustrialSteven Fisher- (212) 713-8634
E&C Street Views
Buy Hold SellMDR 20 1 0FLR 18 6 1CBI 15 4 0KBR 15 4 0PWR 14 3 1JEC 13 10 0FWLT 12 5 0ACM 12 5 0URS 8 10 1BWC 8 7 0WG 4 8 1SHAW 2 15 0
Avg 12 7 0
Source: FactSet

30 IndustrialSteven Fisher- (212) 713-8634
You Make the Call: Case Study #1
Source: FactSet
Backlog up 10% over the past year
Oil prices $67/bbl
Stock trading at 8x estimated earnings vs. 16-17x historical and peers at 11x
0
10
20
30
40
50
60
70
Mar-0
8
Apr-0
8
May-0
8
Jun-
08
Jul-0
8
Jul-0
8
Aug-
08
Sep-
08
Oct-0
8

31 IndustrialSteven Fisher- (212) 713-8634
You Make the Call: Case Study #1
Source: FactSet
0
2
4
6
8
10
12
14
16
18
20
Nov-0
8
Dec-0
8
Jan-
09
Feb-
09
Mar-0
9
Stock: McDermott
Lesson: Be aware of risk in backlog

32 IndustrialSteven Fisher- (212) 713-8634
You Make the Call: Case Study #2
Source: FactSet
Backlog up 20% over the past 12-18 months
Oil prices $63/bbl
Stock trading at 21x estimated earnings vs. 17x historical and peers at 19x
0
5
10
15
20
25
30
35
40
45
50
Jan-
05
Feb-
05
Apr-0
5
May-0
5
Jul-0
5
Aug-
05
Sep-
05
Nov-0
5
Dec-0
5
Feb-
06
Mar-0
6
May-0
6
Jun-
06
Aug-
06
Sep-
06
Nov-0
6
18 month time period

33 IndustrialSteven Fisher- (212) 713-8634
You Make the Call: Case Study #2
Source: FactSet
0
20
40
60
80
100
120
Jan-
05
Feb-
05
Apr-0
5
May-0
5
Jul-0
5
Aug-
05
Sep-
05
Nov-0
5
Dec-0
5
Feb-
06
Mar-0
6
May-0
6
Jun-
06
Aug-
06
Sep-
06
Nov-0
6
Dec-0
6
Feb-
07
Mar-0
7
May-0
7
Jun-
07
Aug-
07
Sep-
07
Nov-0
7
Dec-0
7
Stock: Jacobs Engineering
Lesson: Analyze cyclical potential

34 IndustrialSteven Fisher- (212) 713-8634
The primary risks to the sector include potential declines in commodity prices (particularly oil), slowing US and global economic activity, weaker than expected industrial and non res construction markets, failure to execute on backlogs/cost overruns on fixed price contracts, potential for constrained growth due to rising construction costs and labor availability.
Statement of Risk
Jacobs – Key risks to the earnings and to the stock include potential slowing backlog growth, losses on fixed price contracts, falling oil prices, and labor shortages.
Fluor – Key risks: (1) execution – could incur losses on power and infrastructure projects; (2) even weaker than expected bookings trends in the power business; (3) oil prices could fall; (4) higher risk from larger projects; (5) project delays or cancellations.
URS – Key risks include (1) government work in Iraq that slows more quickly than anticipated, (2) general cuts in defense or homeland security budgets, (3) a slowing economy limits state and local spending on infrastructure and other private sector projects, (4) integration of the Washington Group acquisition, (5) lawsuits related to the I-35W bridge/NYC building demolition project.
Tutor Perini – Key risks include: 1) Risk of losses due to potential cost overruns in fixed price contracts; 2) Execution of major casino projects due to possible capacity constraints; 3) Risk of adverse judgments in ongoing lawsuits resulting in material financial impact; 4) Overhang exists as CEO has registered to potentially sell a significant amount of company shares outstanding; 5) Political and sovereign risk may affect financial performance of work in process in Iraq and Afghanistan; and 6) Risk of further declines in backlog due to difficult credit and economic conditions which could delay new projects.
McDermott – The primary risks to McDermott’s earnings and stock include falling oil prices, cost overruns on fixed price projects, and intense competition.
Babcock & Wilcox – The primary risks include sustained period of regulatory uncertainty and economic weakness, higher than expected R&D costs, higher than expected pension expense, competition for federal programs, and reductions in defense spending.

35 IndustrialSteven Fisher- (212) 713-8634
Statement of RiskWESCO – The primary risks include a decline in U.S. industrial activity or a decline in non-residential construction activity, which could cause earnings to fall below our expectations.
KBR – The primary risks include difficulty estimating any given quarter how much revenue and income will be recognized due to % completion accounting. KBR also operates in markets that are primarily outside the U.S. with a particular emphasis on lesser developed markets that tend to be more volatile politically and economically. Additional risks include cost overruns from fixed price contracts. KBR’s government services business is subject to troop withdrawal from Iraq, as well as bidding by competitors. KBR remains the subject of various investigations into its billing and bidding practices in the U.S. and elsewhere in the world. Shaw Group – We believe the primary risks to the stock include potential for cost overruns on fixed price contracts, potential for further adverse results in legal matters, slower than expected development of the nuclear business, backlog cancellation risk, and risk of further write-downs of joint ventures.
AECOM – Key risks include slowing global economic growth, labor shortages and rising construction costs which could delay or cancel projects, and M&A related risks.
Willbros – Primary risks include potential losses on fixed price projects, management’s execution of international expansion, oil and gas prices, and resolution of legacy issues.
Layne Christensen – Primary risks include economic weakness, falling commodity prices, competitive dynamics, operational risk, potential losses on fixed price contracts, acquisition integration risk, and contract pricing risk.
Foster Wheeler – Key risks to earnings and to the stock include slowing backlog growth, losses on fixed-price contracts, labor shortages, high material costs, project delays/cancellations, falling oil prices, regulatory uncertainty surrounding coal-fired power projects, further charges from asbestos litigation, and uncertainty over the future CEO transition.

36 IndustrialSteven Fisher- (212) 713-8634
Required DisclosuresThis report has been prepared by UBS Securities LLC, an affiliate of UBS AG. UBS AG, its subsidiaries, branches and affiliates are referred to herein as UBS.
For information on the ways in which UBS manages conflicts and maintains independence of its research product; historical performance information; and certain additional disclosures concerning UBS research recommendations, please visit www.ubs.com/disclosures. The figures contained in performance charts refer to the past; past performance is not a reliable indicator of future results. Additional information will be made available upon request. UBS Securities Co. Limited is licensed to conduct securities investment consultancy businesses by the China Securities Regulatory Commission.
UBS Investment Research: Global Equity Rating Allocations
UBS 12-Month Rating Rating Category Coverage1 IB Services2
Buy Buy 54% 39%Neutral Hold/Neutral 39% 35%Sell Sell 7% 14%UBS Short-Term Rating Rating Category Coverage3 IB Services4
Buy Buy less than 1% 33%Sell Sell less than 1% 25%
1:Percentage of companies under coverage globally within the 12-month rating category. 2:Percentage of companies within the 12-month rating category for which investment banking (IB) services were provided within the past 12 months. 3:Percentage of companies under coverage globally within the Short-Term rating category. 4:Percentage of companies within the Short-Term rating category for which investment banking (IB) services were provided within the past 12 months. Source: UBS. Rating allocations are as of 30 June 2011. UBS Investment Research: Global Equity Rating Definitions
UBS 12-Month Rating Definition Buy FSR is > 6% above the MRA. Neutral FSR is between -6% and 6% of the MRA. Sell FSR is > 6% below the MRA. UBS Short-Term Rating Definition
Buy Buy: Stock price expected to rise within three months from the time the rating was assigned because of a specific catalyst or event.
Sell Sell: Stock price expected to fall within three months from the time the rating was assigned because of a specific catalyst or event.

37 IndustrialSteven Fisher- (212) 713-8634
Required Disclosures (Continued)
Analyst CertificationEach research analyst primarily responsible for the content of this research report, in whole or in part, certifies that with respect to each security or issuer that the analyst covered in this report: (1) all of the views expressed accurately reflect his or her personal views about those securities or issuers and were prepared in an independent manner, including with respect to UBS, and (2) no part of his or her compensation was, is, or will be, directly or indirectly, related to the specific recommendations or views expressed by that research analyst in the research report.
KEY DEFINITIONS
Forecast Stock Return (FSR) is defined as expected percentage price appreciation plus gross dividend yield over the next 12 months.Market Return Assumption (MRA) is defined as the one-year local market interest rate plus 5% (a proxy for, and not a forecast of, the equity
risk premium).Under Review (UR) Stocks may be flagged as UR by the analyst, indicating that the stock's price target and/or rating are subject to possible
change in the near term, usually in response to an event that may affect the investment case or valuation.Short-Term Ratings reflect the expected near-term (up to three months) performance of the stock and do not reflect any change in the
fundamental view or investment case.Equity Price Targets have an investment horizon of 12 months.
EXCEPTIONS AND SPECIAL CASES
UK and European Investment Fund ratings and definitions are: Buy: Positive on factors such as structure, management, performance record, discount; Neutral: Neutral on factors such as structure, management, performance record, discount; Sell: Negative on factors such as structure, management, performance record, discount.Core Banding Exceptions (CBE): Exceptions to the standard +/-6% bands may be granted by the Investment Review Committee (IRC). Factors considered by the IRC include the stock's volatility and the credit spread of the respective company's debt. As a result, stocks deemed to be very high or low risk may be subject to higher or lower bands as they relate to the rating. When such exceptions apply, they will be identified in the Company Disclosures table in the relevant research piece.
Research analysts contributing to this report who are employed by any non-US affiliate of UBS Securities LLC are not registered/qualified as research analysts with the NASD and NYSE and therefore are not subject to the restrictions contained in the NASD and NYSE rules on communications with a subject company, public appearances, and trading securities held by a research analyst account. The name of each affiliate and analyst employed by that affiliate contributing to this report, if any, follows.
UBS Securities LLC: Steven Fisher, CFA; Brandon Verblow.
Unless otherwise indicated, please refer to the Valuation and Risk sections within the body of this report.

38 IndustrialSteven Fisher- (212) 713-8634
Companies Mentioned
For a complete set of disclosure statements associated with the companies discussed in this report, including information on valuation and risk, please contact UBS Securities LLC, 1285 Avenue of Americas, New York, NY 10019, USA, Attention: Publishing Administration.
Source: UBS. AEST: Australian eastern standard time; BST: British summertime; EDT: Eastern daylight time; JST: Japanese standard time.
Company Disclosures
Company Name Reuters 12-mo rating Short-term rating Price Price date AECOM Technology Corp.1, 5, 16 ACM.N Buy N/A US$23.58 02 Aug 2011 Babcock & Wilcox Co16 BWC.N Neutral N/A US$24.42 02 Aug 2011 Fluor Corporation4, 6a, 6b, 6c, 7, 13, 16 FLR.N Buy N/A US$60.53 02 Aug 2011 Foster Wheeler Ltd.5, 16 FWLT.O Buy N/A US$27.02 02 Aug 2011 Jacobs Engineering Group, Inc.16 JEC.N Neutral N/A US$37.72 02 Aug 2011 KBR, Inc.4, 6a, 6c, 7, 16 KBR.N Buy N/A US$33.92 02 Aug 2011 Layne Christensen Company16 LAYN.O Sell N/A US$26.90 02 Aug 2011 McDermott International5, 16 MDR.N Buy N/A US$19.14 02 Aug 2011 Shaw Group Inc4, 6a, 16, 20 SHAW.N Buy (CBE) N/A US$25.62 02 Aug 2011 Tutor Perini Corp.5, 16 TPC.N Buy N/A US$15.46 02 Aug 2011 URS Corporation4, 6a, 16 URS.N Neutral N/A US$38.93 02 Aug 2011 WESCO International, Inc.16 WCC.N Buy N/A US$47.82 02 Aug 2011 Willbros Group, Inc.4, 5, 6a, 16 WG.N Neutral N/A US$7.79 02 Aug 2011
Source: UBS. All prices as of local market close. Ratings in this table are the most current published ratings prior to this report. They may be more recent than the stock pricing date
39 IndustrialSteven Fisher- (212) 713-8634
Companies Mentioned (Continued)
Source: UBS; as of 2 Aug 2011
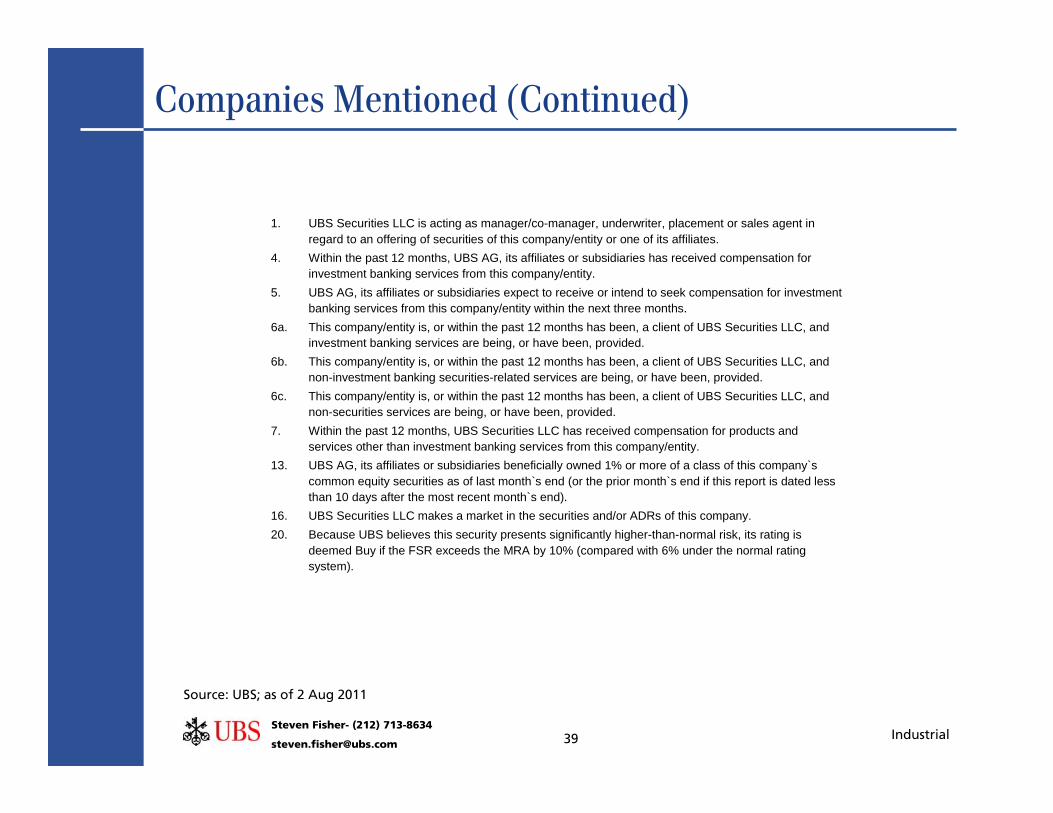
1. UBS Securities LLC is acting as manager/co-manager, underwriter, placement or sales agent in regard to an offering of securities of this company/entity or one of its affiliates.
4. Within the past 12 months, UBS AG, its affiliates or subsidiaries has received compensation for investment banking services from this company/entity.
5. UBS AG, its affiliates or subsidiaries expect to receive or intend to seek compensation for investment banking services from this company/entity within the next three months.
6a. This company/entity is, or within the past 12 months has been, a client of UBS Securities LLC, and investment banking services are being, or have been, provided.
6b. This company/entity is, or within the past 12 months has been, a client of UBS Securities LLC, and non-investment banking securities-related services are being, or have been, provided.
6c. This company/entity is, or within the past 12 months has been, a client of UBS Securities LLC, and non-securities services are being, or have been, provided.
7. Within the past 12 months, UBS Securities LLC has received compensation for products and services other than investment banking services from this company/entity.
13. UBS AG, its affiliates or subsidiaries beneficially owned 1% or more of a class of this company`s common equity securities as of last month`s end (or the prior month`s end if this report is dated less than 10 days after the most recent month`s end).
16. UBS Securities LLC makes a market in the securities and/or ADRs of this company. 20. Because UBS believes this security presents significantly higher-than-normal risk, its rating is
deemed Buy if the FSR exceeds the MRA by 10% (compared with 6% under the normal rating system).
40 IndustrialSteven Fisher- (212) 713-8634
This report has been prepared by UBS Securities LLC, an affiliate of UBS AG. UBS AG, its subsidiaries, branches and affiliates are referred to herein as UBS. In certain countries, UBS AG is referred to as UBS SA.
This report is for distribution only under such circumstances as may be permitted by applicable law. Nothing in this report constitutes a representation that any investment strategy or recommendation contained herein is suitable or appropriate to a recipient’s individual circumstances or otherwise constitutes a personal recommendation. It is published solely for information purposes, it does not constitute an advertisement and is not to be construed as a solicitation or an offer to buy or sell any securities or related financial instruments in any jurisdiction. No representation or warranty, either express or implied, is provided in relation to the accuracy, completeness or reliability of the information contained herein, except with respect to information concerning UBS AG, its subsidiaries and affiliates, nor is it intended to be a complete statement or summary of the securities, markets or developments referred to in the report. UBS does not undertake that investors will obtain profits, nor will it share with investors any investment profits nor accept any liability for any investment losses. Investments involve risks and investors should exercise prudence in making their investment decisions. The report should not be regarded by recipients as a substitute for the exercise of their own judgement. Past performance is not necessarily a guide to future performance. The value of any investment or income may go down as well as up and you may not get back the full amount invested. Any opinions expressed in this report are subject to change without notice and may differ or be contrary to opinions expressed by other business areas or groups of UBS as a result of using different assumptions and criteria. Research will initiate, update and cease coverage solely at the discretion of UBS Investment Bank Research Management. The analysis contained herein is based on numerous assumptions. Different assumptions could result in materially different results. The analyst(s) responsible for the preparation of this report may interact with trading desk personnel, sales personnel and other constituencies for the purpose of gathering, synthesizing and interpreting market information. UBS is under no obligation to update or keep current the information contained herein. UBS relies on information barriers to control the flow of information contained in one or more areas within UBS, into other areas, units, groups or affiliates of UBS. The compensation of the analyst who prepared this report is determined exclusively by research management and senior management (not including investment banking). Analyst compensation is not based on investment banking revenues, however, compensation may relate to the revenues of UBS Investment Bank as a whole, of which investment banking, sales and trading are a part.
The securities described herein may not be eligible for sale in all jurisdictions or to certain categories of investors. Options, derivative products and futures are not suitable for all investors, and trading in these instruments is considered risky. Mortgage and asset-backed securities may involve a high degree of risk and may be highly volatile in response to fluctuations in interest rates and other market conditions. Past performance is not necessarily indicative of future results. Foreign currency rates of exchange may adversely affect the value, price or income of any security or related instrument mentioned in this report. For investment advice, trade execution or other enquiries, clients should contact their local sales representative. Neither UBS nor any of its affiliates, nor any of UBS' or any of its affiliates, directors, employees or agents accepts any liability for any loss or damage arising out of the use of all or any part of this report. For financial instruments admitted to trading on an EU regulated market: UBS AG, its affiliates or subsidiaries (excluding UBS Securities LLC and/or UBS Capital Markets LP) acts as a market maker or liquidity provider (in accordance with the interpretation of these terms in the UK) in the financial instruments of the issuer save that where the activity of liquidity provider is carried out in accordance with the definition given to it by the laws and regulations of any other EU jurisdictions, such information is separately disclosed in this research report. UBS and its affiliates and employees may have long or short positions, trade as principal and buy and sell in instruments or derivatives identified herein.
Any prices stated in this report are for information purposes only and do not represent valuations for individual securities or other instruments. There is no representation that any transaction can or could have been effected at those prices and any prices do not necessarily reflect UBS's internal books and records or theoretical model-based valuations and may be based on certain assumptions. Different assumptions, by UBS or any other source, may yield substantially different results.
Global Disclaimer

41 IndustrialSteven Fisher- (212) 713-8634
United Kingdom and the rest of Europe: Except as otherwise specified herein, this material is communicated by UBS Limited, a subsidiary of UBS AG, to persons who are eligible counterparties or professional clients and is only available to such persons. The information contained herein does not apply to, and should not be relied upon by, retail clients. UBS Limited is authorised and regulated by the Financial Services Authority (FSA). UBS research complies with all the FSA requirements and laws concerning disclosures and these are indicated on the research where applicable. France: Prepared by UBS Limited and distributed by UBS Limited and UBS Securities France SA. UBS Securities France S.A. is regulated by the Autorité des Marchés Financiers (AMF). Where an analyst of UBS Securities France S.A. has contributed to this report, the report is also deemed to have been prepared by UBS Securities France S.A. Germany: Prepared by UBS Limited and distributed by UBS Limited and UBS Deutschland AG. UBS Deutschland AG is regulated by the Bundesanstalt fur Finanzdienstleistungsaufsicht (BaFin). Spain: Prepared by UBS Limited and distributed by UBS Limited and UBS Securities España SV, SA. UBS Securities España SV, SA is regulated by the Comisión Nacional del Mercado de Valores(CNMV). Turkey: Prepared by UBS Menkul Degerler AS on behalf of and distributed by UBS Limited. Russia: Prepared and distributed by UBS Securities CJSC. Switzerland: Distributed by UBS AG to persons who are institutional investors only. Italy: Prepared by UBS Limited and distributed by UBS Limited and UBS Italia SimS.p.A.. UBS Italia Sim S.p.A. is regulated by the Bank of Italy and by the Commissione Nazionale per le Società e la Borsa (CONSOB). Where an analyst of UBS Italia Sim S.p.A. has contributed to this report, the report is also deemed to have been prepared by UBS Italia Sim S.p.A.. South Africa: UBS South Africa (Pty) Limited (Registration No. 1995/011140/07) is a member of the JSE Limited, the South African Futures Exchange and the Bond Exchange of South Africa. UBS South Africa (Pty) Limited is an authorised Financial Services Provider. Details of its postal and physical address and a list of its directors are available on request or may be accessed at http:www.ubs.co.za. United States: Distributed to US persons by either UBS Securities LLC or by UBS Financial Services Inc., subsidiaries of UBS AG; or by a group, subsidiary or affiliate of UBS AG that is not registered as a US broker-dealer (a 'non-US affiliate'), to major US institutional investors only. UBS Securities LLC or UBS Financial Services Inc. accepts responsibility for the content of a report prepared by another non-US affiliate when distributed to US persons by UBS Securities LLC or UBS Financial Services Inc. All transactions by a US person in the securities mentioned in this report must be effected through UBS Securities LLC or UBS Financial Services Inc., and not through a non-US affiliate. Canada: Distributed by UBS Securities Canada Inc., a subsidiary of UBS AG and a member of the principal Canadian stock exchanges & CIPF. A statement of its financial condition and a list of its directors and senior officers will be provided upon request. Hong Kong: Distributed by UBS Securities Asia Limited. Singapore: Distributed by UBS Securities Pte. Ltd [mica (p) 039/11/2009 and Co. Reg. No.: 198500648C] or UBS AG, Singapore Branch. Please contact UBS Securities Pte Ltd, an exempt financial advisor under the Singapore Financial Advisers Act (Cap. 110); or UBS AG Singapore branch, an exempt financial adviser under the Singapore Financial Advisers Act (Cap. 110) and a wholesale bank licensed under the Singapore Banking Act (Cap. 19) regulated by the Monetary Authority of Singapore, in respect of any matters arising from, or in connection with, the analysis or report. The recipient of this report represent and warrant that they are accredited and institutional investors as defined in the Securities and Futures Act (Cap. 289). Japan: Distributed by UBS Securities Japan Ltd to institutional investors only. Where this report has been prepared by UBS Securities Japan Ltd, UBS Securities Japan Ltd is the author, publisher and distributor of the report. Australia: Distributed by UBS AG (Holder of Australian Financial Services License No. 231087) and UBS Securities Australia Ltd (Holder of Australian Financial Services License No. 231098) only to 'Wholesale' clients as defined by s761G of the Corporations Act 2001. New Zealand: Distributed by UBS New Zealand Ltd. An investment adviser and investment broker disclosure statement is available on request and free of charge by writing to PO Box 45, Auckland, NZ. Dubai: The research prepared and distributed by UBS AG Dubai Branch, is intended for Professional Clients only and is not for further distribution within the United Arab Emirates. Korea: Distributed in Korea by UBS Securities Pte. Ltd., Seoul Branch. This report may have been edited or contributed to from time to time by affiliates of UBS Securities Pte. Ltd., Seoul Branch. Malaysia: This material is authorized to be distributed in Malaysia by UBS Securities Malaysia Sdn. Bhd (253825-x).India : Prepared by UBS Securities India Private Ltd. 2/F,2 North Avenue, Maker Maxity, Bandra Kurla Complex, Bandra (East), Mumbai (India) 400051. Phone: +912261556000 SEBI Registration Numbers: NSE (Capital Market Segment): INB230951431 , NSE (F&O Segment) INF230951431, BSE (Capital Market Segment) INB010951437.
The disclosures contained in research reports produced by UBS Limited shall be governed by and construed in accordance with English law.
UBS specifically prohibits the redistribution of this material in whole or in part without the written permission of UBS and UBS accepts no liability whatsoever for the actions of third parties in this respect. Images may depict objects or elements which are protected by third party copyright, trademarks and other intellectual property rights. © UBS 2011. The key symbol and UBS are among the registered and unregistered trademarks of UBS. All rights reserved.
Global Disclaimer (Continued)

42 IndustrialSteven Fisher- (212) 713-8634
Contact Information
UBS Securities LLC1285 Avenue of the AmericasNew York, NY 10019
Tel: +1-212-713-2000
www.ubs.com
UBS Securities LLC is a subsidiary of UBS AG.