U.S. Energy Information Administration Report: The ... · Organization of the Petroleum Exporting...
43
The Availability and Price of Petroleum and Petroleum Products Produced in Countries Other Than Iran June 26, 2012 Independent Statistics & Analysis www.eia.gov U.S. Department of Energy Washington, DC 20585 The third in a series of reports required by section 1245 (d) (4) (A) of the National Defense Authorization Act for Fiscal Year 2012
-
Upload
nguyendung -
Category
Documents
-
view
213 -
download
0
Transcript of U.S. Energy Information Administration Report: The ... · Organization of the Petroleum Exporting...

The Availability and Price of
Petroleum and Petroleum
Products Produced in Countries
Other Than Iran
June 26, 2012
Independent Statistics & Analysis
www.eia.gov
U.S. Department of Energy
Washington, DC 20585
The third in a series of reports required by section 1245 (d) (4) (A) of the National Defense Authorization Act for Fiscal Year 2012
U.S. Energy Information Administration | Availability and Price of Petroleum and Petroleum Products Produced in Countries Other Than Iran i
This report was prepared by the U.S. Energy Information Administration (EIA), the statistical and
analytical agency within the U.S. Department of Energy. By law, EIA’s data, analyses, and forecasts are
independent of approval by any other officer or employee of the United States Government. The views
in this report, therefore, should not be construed as representing those of the Department of Energy or
other Federal agencies.

U.S. Energy Information Administration | Availability and Price of Petroleum and Petroleum Products Produced in Countries Other Than Iran ii
Table of Contents
Tables ........................................................................................................................................................... iii
Figures .......................................................................................................................................................... iii
Summary ....................................................................................................................................................... 1
Market Indicators Considered in this Report .......................................................................................... 6
Estimates of Production, Consumption, Spare Capacity and Inventories ............................................... 7
Crude Oil and Petroleum Product Prices ................................................................................................. 8
Report Background and Context ................................................................................................................... 9
Liquid Fuels Production during May and June 2012 ................................................................................... 11
Liquid Fuels Consumption during May and June 2012 ............................................................................... 15
Inventory Net Withdrawals ......................................................................................................................... 16
Spare Crude Oil Production Capacity .......................................................................................................... 20
Refining and Transportation Capacity ........................................................................................................ 21
Crude Oil and Petroleum Product Prices .................................................................................................... 23
Interpreting Price Levels, Volatility, and Spreads .................................................................................. 23
Crude Oil: Price Levels, Volatility, and Spreads - May and June 2012 ................................................... 26
Petroleum Products: Price Levels, Volatility, and Spreads - May and June 2012 .................................. 33
U.S. Energy Information Administration | Availability and Price of Petroleum and Petroleum Products Produced in Countries Other Than Iran iii
Tables
Table 1. Summary of Estimated Liquid Fuels Quantities and Prices ............................................................. 5
Table 2. International Liquid Fuels Production, Consumption, and Inventory Estimates .......................... 13
Table 3. Non-OPEC Liquid Fuels Supply Estimates ...................................................................................... 18
Table 4. OPEC Crude Oil (Excluding Condensates) and Liquid Fuels Supply Estimates .............................. 19
Table 5. Crude Oil and Petroleum Product Price Data ................................................................................ 26
Figures
Figure 1. World Liquid Fuels Production and Consumption and Net Inventory Withdrawal, January 2011-
June 2012 ...................................................................................................................................................... 2
Figure 2. Front Month Crude Oil Futures Prices ........................................................................................... 3
Figure 3. Estimated Unplanned Production Disruptions Among non-OPEC Producers ............................. 14
Figure 4. Global Total Liquids Inventories Net Withdrawals ...................................................................... 17
Figure 5. OECD Total Liquid Fuels Inventories ............................................................................................ 17
Figure 6. World Spare Crude Oil Production Capacity ................................................................................ 20
Figure 7. Global Crude Oil Distillation Capacity .......................................................................................... 21
Figure 8. Front Month Futures Crack Spreads ............................................................................................ 22
Figure 9. Very Large Crude Carrier Shipping Rates for Delivery from the Persian Gulf .............................. 23
Figure 10. Density and Sulfur Content of Selected Crude Oils ................................................................... 24
Figure 11. Global Crude Oil Spot Prices ...................................................................................................... 28
Figure 12. Global Crude Oil Spot Price Averages ........................................................................................ 28
Figure 13. Global Crude Oil Spot Price Differentials ................................................................................... 29
Figure 14. Global Crude Oil Spot Price Differential Averages ..................................................................... 29
Figure 15. Crude Oil 1st - 12th Month Futures Price Spread ...................................................................... 30
Figure 16. Crude Oil Historical and Implied Volatility ................................................................................. 30
Figure 17. Crude Oil Historical and Implied Volatility Averages ................................................................. 31
Figure 18. Put/Call Ratio for all Options on WTI Futures Contracts .......................................................... 31
Figure 19. Volatility Skew for the September 2012 WTI Futures Contract ................................................. 32
Figure 20. Probability of the September 2012 WTI Contract Expiring Above Different Price Levels ......... 32
Figure 21. Global Gasoline Spot Price Averages ......................................................................................... 34
Figure 22. Global Gasoline Spot Price Differentials .................................................................................... 34
Figure 23. Global Distillate Spot Price Averages ......................................................................................... 35
Figure 24. Global Distillate Spot Price Differentials .................................................................................... 35
Figure 25. Front Month RBOB Gasoline and Heating Oil Futures Prices .................................................... 36
Figure 26. Front Month Futures Volatility .................................................................................................. 36
Figure 27. RBOB Gasoline Historical and Implied Volatility ........................................................................ 37
Figure 28. Heating Oil Historical and Implied Volatility .............................................................................. 37
Figure 29. Probability of September 2012 Retail Gasoline Exceeding Different Price Levels at Expiration38
Figure 30. Global Jet Fuel Spot Price Averages ........................................................................................... 38
Figure 31. Global Jet Fuel Spot Price Differentials ...................................................................................... 39

June 2012
U.S. Energy Information Administration | Availability and Price of Petroleum and Petroleum Products Produced in Countries Other Than Iran 1
Summary
The global oil market has loosened since our previous report.
World oil inventories are estimated to have grown by an average 1.0 million barrels per day (bbl/d) during May and June, a marked contrast to the year-ago period when global inventories were being drawn down following the disruption in supplies from Libya (Figure 1). In addition, the latest available estimates for March and April show significantly higher production and lower consumption, and therefore, much larger inventory additions than had previously been estimated.
Oil prices and backwardation of the futures curve have declined significantly over the last month, both indicators of a looser market (Figure 2 and Figure 15). The average price for Brent in June decreased by $14 per barrel compared with its May average, and it is the lowest price since December 2010. The Brent market has moved into contango for the first time in almost a year with the average 1st – 12th month spread for the five days ending June 22 at -$0.77 per barrel. This marks a significant change from March 1 when the Brent market was backwardated and the five-day average for 1st – 12th month spread peaked at about $8 per barrel.
Organization of the Petroleum Exporting Countries (OPEC) production has increased over the past year, especially in Iraq and Libya. Saudi Arabia, which acts as a balancing force in the global oil market, continues to produce at high levels.
The overall growth in non-OPEC production is led by North America, particularly in the tight oil plays of the United States (Table 2). While unplanned production outages in non-OPEC countries remain higher than normal, they have declined from the elevated levels of earlier this year (Figure 3).
Global spare capacity remains relatively tight by historical standards, and is currently estimated at less than 3 percent of total world consumption (Table 1 and Figure 6).
Economic growth concerns have increased due to the debt crisis in Europe and indicators of slowing growth in China, both of which could have significant spillover effects on other economies. Prospects for slower economic growth and changing expectations about current and potential supply disruptions are among the economic and political indicators influencing market expectations, beyond the easing in the supply and demand balance over the last few months that have significantly contributed to recent oil price changes.
This is the third in a series of reports prepared in fulfillment of Section 1245(d)(4)(A) of the National
Defense Authorization Act (NDAA) for Fiscal Year 2012, which requires the U.S. Energy Information
Administration (EIA) to “submit to Congress a report on the availability and price of petroleum and
petroleum products produced in countries other than Iran in the 60-day period preceding the
submission of the report.” EIA consulted with the Department of Treasury, the Department of State, and
the intelligence community in the process of developing this report. The statutory language in the NDAA
clearly envisions a report that is primarily, if not exclusively, historical in nature.

June 2012
U.S. Energy Information Administration | Availability and Price of Petroleum and Petroleum Products Produced in Countries Other Than Iran 2
Figure 1. World Liquid Fuels Production and Consumption and Net Inventory Withdrawal, January 2011-June 2012
Source: U.S. Energy Information Administration
It is important to recognize that due to time lags in the collection of production and consumption data,
nearly all of the petroleum and petroleum product volumes presented in this report are estimates
rather than actual data. EIA revises estimates as new information becomes available, and production
and consumption estimates featured in the previous two reports in this series have since changed
accordingly. For example, after incorporating the latest data for March and April, EIA’s current estimate
of average global liquid fuels production over that time period is 0.7 million barrels per day (bbl/d)
higher than previously estimated, while consumption is 0.6 million bbl/d lower. This suggests that the
looser view of the market presented in this report extends to months prior to May and June.
EIA estimates that global liquid fuels production in May and June 2012 increased by 2.9 million bbl/d
from the same time period last year. Additionally, global liquid fuels production exceeded consumption
by an average of 1.0 million bbl/d in May and June, causing oil stocks to build (Table 1). Inventories in
the United States were estimated to have risen by an average of 0.5 million bbl/d in May and June. Over
that same time frame, commercial inventories in other member states of the Organization for Economic
Cooperation and Development (OECD) were built by an estimated 0.2 million bbl/d, and EIA’s balance
suggests that non-OECD inventories increased by 0.3 million bbl/d in May and June.
-3
-2
-1
0
1
2
3
83
84
85
86
87
88
89
90
91
Inventory Net Withdrawals
Liquid Fuels Consumption
Liquid Fuels Production
Production and Consumption million barrels per day
Net Inventory Withdrawal million barrels per day

June 2012
U.S. Energy Information Administration | Availability and Price of Petroleum and Petroleum Products Produced in Countries Other Than Iran 3
In contrast to data on petroleum and petroleum product volumes, price data is available on a real-time
or near-real-time basis. Over the five days ending on June 22, the price of the front-month futures
contract for Brent crude from the North Sea, a proxy for the global oil price, averaged about $92.94 per
barrel, a $33 per barrel decline from its average over the March 9 - 14 period when prices were at their
highest level for 2012. Brent futures prices are at their lowest levels since December 2010. The Brent
market has moved into “contango,” when current prices are less than future prices, for the first time in
almost a year with the average 1st – 12th month spread for the five days ending June 22 at -$0.77 per
barrel. This marks a significant change from March 1 when the Brent market was “backwardated,”
which occurs when current prices are higher than future prices, and the five-day average for 1st – 12th
month spread peaked at about $8 per barrel. The switch from backwardation to contango is another
sign of easing in the world oil markets.
Figure 2. Front Month Crude Oil Futures Prices
Note: All prices represent rolling 5-day averages.
Source: U.S. Energy Information Administration, based on Chicago Mercantile Exchange (CME), Intercontinental Exchange (ICE)
and Dubai Mercantile Exchange (DME).
EIA estimates that 88.9 million bbl/d of liquid fuels were produced in May and June, which is roughly 2.9
million bbl/d higher than both the 2009-2011 annual average and for the same time period in 2011. The
increase can be attributed largely to a combination of increased output from some members of the
Organization of the Petroleum Exporting Countries (OPEC), continued growth in North American oil
supply, and lower aggregate disruption to non-OPEC production. Iraq and Libya stand out among OPEC
countries. Iraq’s estimated production level of 2.9 million bbl/d in May and June is the country’s highest
since 2000, as new infrastructure has facilitated increased exports from its large southern fields, while
Libya’s production, which virtually ceased for much of 2011, has now been restored to between 80 and
90 percent of its pre-disruption level. The United States is the largest source of non-OPEC liquids
production growth over the past year and the largest source of liquids production growth relative to the
recent three-year average for any country. Due to the continued success of tight oil plays, U.S. crude oil
production averaged 6.3 million bbl/d in June, the highest it has been in 14 years.
75
85
95
105
115
125
135
12/28/2011 2/10/2012 3/25/2012 5/8/2012 6/21/2012
Brent front month futures price
WTI front month futures price
Dubai front month futures price
dollars per barrel

June 2012
U.S. Energy Information Administration | Availability and Price of Petroleum and Petroleum Products Produced in Countries Other Than Iran 4
Unplanned non-OPEC disruptions declined from an average of 1.2 million bbl/d in March and April to 0.9
million bbl/d in May and June, largely explained by the completion of unplanned maintenance activities
that had reduced Canada’s oil sands production. An above-normal volume of non-OPEC production is
still offline due to political issues for Sudan, South Sudan, Syria, and Yemen, as well as technical issues in
the North Sea.
EIA estimates that spare crude oil production capacity grew to 2.4 million bbl/d in May and June from
2.1 million bbl/d in March and April, caused by a decrease in Saudi Arabia’s production. Nonetheless,
spare capacity in May and June is still quite modest by historical standards, especially when measured as
a percentage of global oil production and consumption.

June 2012
U.S. Energy Information Administration | Availability and Price of Petroleum and Petroleum Products Produced in Countries Other Than Iran 5
Table 1. Summary of Estimated Liquid Fuels Quantities and Prices
Item May 2012
June 2012
May-June 2012
Average
May-June 2011
Average 2009-2011
Average
Total Global Liquid Fuels
Total Global Liquid Fuels Production (million bbl/d) 89.1 88.7 88.9 86.0 86.1
Total Global Liquid Fuels Consumption (million bbl/d) 87.2 88.7 87.9 87.3 86.6
Biofuels Production (a) (million bbl/d) 1.9 1.9 1.9 1.9 1.8
Biofuels Consumption (a) (million bbl/d) 1.8 1.8 1.8 1.8 1.7
Iran Liquid Fuels Production (million bbl/d) 3.9 3.8 3.8 4.3 4.2
Iran Liquid Fuels Consumption (million bbl/d) 1.6 1.6 1.6 1.7 1.8
Petroleum and Petroleum Products Produced and Consumed in Countries Other Than Iran
Production (b) (million bbl/d) 83.4 83.0 83.2 79.8 80.1
Consumption (c) (million bbl/d) 83.8 85.3 84.5 83.8 83.1
Production minus Consumption -0.5 -2.2 -1.3 -3.9 -3.0
World Inventory Net Withdrawals Including Iran (million barrels) -1.9 (d) 0.0 -1.0 1.2 0.5
Estimated OECD Inventory Level (e) (million barrels) 2,669 2,679 2,674 2,669 --
Spare Production Capacity
OPEC Spare Crude Oil Production Capacity (f) (million bbl/d) 2.3 2.5 2.4 3.1 3.4
Oil Price Level
WTI Front Month Futures Price (g) ($ per barrel) 94.72 82.83 89.71 98.83 78.94
Brent Front Month Futures Price (h) ($ per barrel) 110.29 96.34 104.42 114.21 84.64
RBOB Front Month Futures Price (i) ($ per gallon) 2.95 2.65 2.82 3.02 2.21
Oil Price Time Spread
WTI 1st - 12th Month Futures Spread ($ per barrel) -1.08 -2.88 -1.84 -2.54 -5.39
Brent 1st - 12th Month Futures Spread ($ per barrel) 4.54 0.63 2.89 3.00 -3.08
Note: The term “liquid fuels” encompasses crude oil, lease condensate, natural gas plant liquids, biofuels, coal-to-liquids, gas-to-liquids,
and refinery processing gains, which are important to consider in concert due to the inter-related supply, demand, and price dynamics
of petroleum, petroleum products, and related fuels.
(a) Biofuels production and consumption are based on EIA estimates for 2010 as published in the International Energy Statistics. (b)
Production includes crude oil (including lease condensates), natural gas plant liquids, other liquids, and refinery processing gains.
(c) Consumption of petroleum by the OECD countries is synonymous with “products supplied," defined in the glossary of the EIA
Petroleum Supply Monthly, DOE/EIA-0109. Consumption of petroleum by the non-OECD countries is "apparent consumption," which
includes internal consumption, refinery fuel and loss, and bunkering.
(d) The estimate is - 0.04 million bbl/d. (e) Estimated inventory level is for OECD only.
(f) EIA defines spare oil production capacity as potential oil production that could be brought online within 30 days and sustained for at
least 90 days, consistent with sound business practices. This does not include oil production increases that could not be sustained
without degrading the future production capacity of a field.
Note: June prices include data through market close on June 22, 2012.
(g)WTI refers to West Texas Intermediate crude oil traded on the Chicago Mercantile Exchange (CME).
(h) Brent refers to Brent crude oil traded on the Intercontinental Exchange (ICE).
(i) RBOB refers to reformulated blendstock for oxygenate blending traded on the CME.
Source: U.S. Energy Information Administration

June 2012
U.S. Energy Information Administration | Availability and Price of Petroleum and Petroleum Products Produced in Countries Other Than Iran 6
Market Indicators Considered in this Report In addition to estimated volumes of production and consumption, as well as spot market and futures
prices, this report focuses on a variety of other indicators of volumes, spare production capacity, and
price spreads relevant to the “availability and price of petroleum and petroleum products.”
EIA defines spare capacity as the amount of additional production that can be brought onstream within
30 days and sustained for at least 90 days, and consistent with sound business and reservoir
management practices. Spare capacity is an indicator of the world oil market’s ability to respond to
potential disruptions that reduce oil supply. Oil prices tend to rise when spare capacity reaches very low
levels, as occurred in the 2003 to 2008 period.
Crude oil and petroleum product inventories, also referred to as stocks, act as the balancing point
between supply and demand. Given the uncertainty of supply and demand, inventories are often seen
as a precautionary measure and, along with spare capacity, serve to cushion the market in addressing
negative supply shocks and/or positive demand shocks. The term structure of prices for future delivery,
discussed below, is one factor that signals the market to build or reduce stocks.
Petroleum and petroleum product prices are indicators of the relative balance of supply and demand.
Rising prices suggest that demand is growing more rapidly (or declining at a slower rate) than supply,
while falling prices imply that demand is growing less quickly (or falling more rapidly) than supply. Prices
also reflect expectations regarding future changes in the balance between supply and demand, which
can be influenced by a variety of supply and demand drivers. This report reflects price data through
June 22, 2012.
Differences in prices, commonly referred to as price spreads, also convey important information about
the current state of the market and market expectations. The term structure of prices for future
delivery is one key indicator of market participants’ expectations regarding changes in market tightness
over time. For example, the difference between the price of the front month and twelfth month futures
contracts provides insight into current market tightness relative to expectations for the coming year. A
positive difference, referred to as backwardation, indicates tightness in the current market, while a
negative difference, called contango, indicates a relatively looser near-term supply-demand balance and
encourages stock building.
There are a variety of other spreads that also provide important market insights. These include the price
spread across different crude streams that can arise due to differences in physical characteristics (for
example, American Petroleum Institute [API] gravity and sulfur content) or their location. With respect
to location, transportation bottlenecks can result in significant price differences between physically
similar crudes in markets with different balances between crude supply and demand.
The price spread between crude oil and refined products, often referred to as a crack spread, provides
an indication of the relative tightness in the supply-demand balance for different petroleum products.
In recent years, the crack spread for distillate fuels (a category that includes diesel fuel and heating oil)
has generally been greater than the crack spread for gasoline. Crack spreads also provide insight into
the profitability of refining operations, which is often a reflection of the availability of refinery capacity
relative to the demand for refined products.

June 2012
U.S. Energy Information Administration | Availability and Price of Petroleum and Petroleum Products Produced in Countries Other Than Iran 7
The value of options on futures contracts is another current indicator of forward-looking market
sentiment. Call options provide the holder with the right to buy a commodity at a specified price up to a
specified future date, while put options provide the right to sell at a specified price up to a specified
future date. Given strike prices and the time to expiration, the value of options contracts can be used to
calculate the market’s current assessment of the uncertainty range for future prices and/or the market’s
view that prices for future delivery at specified dates will exceed or fall below any particular level.
Estimates of Production, Consumption, Spare Capacity and Inventories Because biofuels are a close substitute for petroleum products, this report examines “availability and
price” in the global liquid fuels market. The term “liquid fuels” encompasses petroleum and petroleum
products and close substitutes, including crude oil, lease condensate, natural gas plant liquids, biofuels,
coal-to-liquids, gas-to-liquids, and refinery processing gains.
Once the availability of global liquid fuels is established, EIA estimates the volume of “petroleum and
petroleum products produced in countries other than Iran” by subtracting global biofuels and liquid
fuels produced and consumed in Iran from the global liquid fuels totals.
Looking at the total global market during May and June 2012, EIA estimates that world liquid fuels
production averaged 88.9 million bbl/d, which is 2.9 million bbl/d higher than the comparable year-ago
average of 86.0 million bbl/d and 2.8 million bbl/d higher than the three-year annual average of 86.1
million bbl/d (Table 1). During this same period, EIA estimates that global liquid fuels consumption
averaged 87.9 million bbl/d, 0.7 million bbl/d higher than the comparable year-ago period and 1.3
million bbl/d higher than its previous three-year annual average.
During the last two months, EIA estimates that liquid fuels production and consumption in Iran were 3.8
million bbl/d and 1.6 million bbl/d, respectively. Iran is the world’s fifth-largest producer of liquid fuels –
accounting for between 4 and 5 percent of global supply – and the third-largest exporter of crude oil.
Iran’s crude oil production capacity has eroded in recent years, due to its inability to carry out
investment projects that are necessary to offset the natural decline in production from existing wells.
Although its output of lease condensate and natural gas liquids has increased somewhat, these
increases have not been enough to offset the decline in crude oil production, and EIA estimates that
Iran’s total liquids production capability has fallen. In addition, Iran has historically been a net importer
of petroleum products, particularly gasoline, since its consumption levels exceed its own refining
capacity.
In May and June 2012, EIA estimates consumption of petroleum and petroleum products in countries
other than Iran averaged 84.5 million bbl/d. During the same period, EIA estimates that production of
petroleum and petroleum products in countries other than Iran averaged 83.2 million barrels bbl/d,
which is 3.1 million bbl/d or almost 4 percent higher than the three-year annual average from 2009-
2011. EIA’s balance in May and June suggests that global oil inventories grew by an average of 1.0
million bbl/d during the past two months. The growth in global oil inventories includes growth in Iranian
oil inventories, as sanctions have caused some disruption in Iranian oil sales.
Currently, all of the world’s spare crude oil production capacity is held by the member countries of the
Organization of the Petroleum Exporting Countries (OPEC), and largely by Saudi Arabia. EIA estimates

June 2012
U.S. Energy Information Administration | Availability and Price of Petroleum and Petroleum Products Produced in Countries Other Than Iran 8
that spare OPEC oil production capacity averaged 2.4 million bbl/d during May and June. Spare oil
production capacity is currently quite modest relative to historical levels, including an average of 3.1
million bbl/d in the comparable year-ago period and a 2009-2011 average of 3.4 million bbl/d. Spare
capacity must also be considered in the context of current geopolitical uncertainties, including, but not
limited to, the situation in Iran. For example, if Iran is forced to shut in production because difficulties
with marketing its oil outstrip available oil storage capacity, then that shut-in capacity may be
technically counted as new spare capacity. However, that hypothetical spare capacity would not be
readily available to alleviate market tightness in the same manner as regular spare capacity not forced
by sanctions.
Crude Oil and Petroleum Product Prices Crude oil prices have declined sharply since the end of April. These changes are reflected in price
movements on the most commonly traded oil futures contracts. Comparing the 5-day periods ending
April 27, 2012 and June 22, 2012, the price of the front month of the New York Mercantile Exchange
(NYMEX) light sweet crude oil contract (WTI) declined from $104.05 per barrel to $81.41 per barrel. The
Brent front month price, which is widely viewed as being more representative of global prices for light
sweet crude oil, declined from $119.15 to $92.94 per barrel over the same period. WTI and Brent prices
have declined by $26.75 and $32.65 per barrel, respectively, from their 2012 peaks of $108.16 per barrel
on March 1 and $125.59 per barrel on March 14.
Despite the decline in oil prices during May and June 2012, petroleum and petroleum product prices
were higher than they had been on average over the last three years. The average of the monthly price
for May and June of the front month WTI contract was $89.71 per barrel and the two-month average for
the Brent front month contract was $104.42 per barrel. These prices were $10.78 and $19.78 per barrel
higher than the three-year averages, but $15.15 and $18.38 per barrel lower than their March and April
2012 averages, respectively.
The 1st – 12th month spread for Brent had a May and June average of $2.89 per barrel, signifying an
easing in the relative current tightness in the world waterborne crude market indicated in the previous
report. The Brent curve has recently moved into contango for the first time since the summer of 2011
and is now closer to its three-year average of -$3.08 per barrel. The WTI spread also remains in
contango, averaging -$1.84 per barrel between May and June, but this is a much smaller spread than the
three-year average of -$5.39 per barrel. WTI prices continue to reflect transportation bottlenecks in the
midcontinent region and future plans to ameliorate them by reconfiguring existing pipelines and
building new ones.
For the five days ending June 22, the average price of the September 2012 WTI crude oil futures
contract was $81.83 per barrel and the average price of the September 2012 Brent contract was $93.17
per barrel. The WTI and Brent prices for the 5-day average ending June 22 for the September 2012
contract have decreased by about $23 per barrel and $25 per barrel, respectively, since April 27. Based
on implied volatilities calculated from options and futures prices over the 5 days ending June 22, the
probability of the September 2012 WTI futures contract expiring above $100 per barrel is 6 percent, a
decrease of 55 percentage points from the same calculation made using price data from the 5-day
period ending April 27. Given the higher absolute level of Brent prices relative to WTI prices over the

June 2012
U.S. Energy Information Administration | Availability and Price of Petroleum and Petroleum Products Produced in Countries Other Than Iran 9
last two months, the probabilities that the September Brent contract will exceed specified dollar
thresholds are higher.
Reformulated blendstock for oxygenate blending (RBOB) is an unfinished gasoline that requires blending
with an oxygenate, such as ethanol, before being sold. RBOB (or Eurobob in Europe) is often traded
instead of finished motor gasoline that already has been blended with ethanol since oxygenate blending
typically takes place at terminals along the distribution chain.
RBOB prices had been generally rising over the past two months, but have decreased significantly in
recent weeks. Comparing the 5-day periods ending April 27, 2012 and June 22, 2012, the price of the
front month of the NYMEX RBOB contract, which calls for delivery in New York Harbor, fell from $3.18
per gallon to $2.60 per gallon. During May and June, the average price for the front month RBOB
futures contract was $2.82 per gallon, $0.61 per gallon higher than the average front month price over
the three-year period from 2009-2011, but $0.20 per gallon below the May and June 2011 average.
The average price of the September 2012 RBOB futures contract for the 5-day period ending June 22
was $2.45 per gallon, a decrease of $0.55 per gallon since April 27. Based on implied volatilities
calculated from options and futures prices over the 5 days ending June 22,the probability of the
September 2012 RBOB futures contract expiring above $3.30 per gallon (comparable to a $4.00 per
gallon national average retail price for regular grade gasoline) is now 1 percent, a 23 percentage point
decrease from April 27. A combination of lower prices and decreased time to expiration contributed to
decreased probability of the September gasoline contracts exceeding these price levels.
Report Background and Context
The Availability and Price of Petroleum and Petroleum Products Produced in Countries Other Than Iran is
a recurring report required under Section 1245(d)(4)(A) of Public Law 112-81, the National Defense
Authorization Act for Fiscal Year 2012, signed into law on December 31, 2011. The Act requires that
every 60 days the “Energy Information Administration, in consultation with the Secretary of the
Treasury, the Secretary of State, and the Director of National Intelligence, shall submit to Congress a
report on the availability and price of petroleum and petroleum products produced in countries other
than Iran in the 60-day period preceding the submission of the report.”
This report and its future editions are intended to provide information relevant to the President’s
determination under Section 1245(d)(4)(B) whether the “price and supply of petroleum and petroleum
products produced in countries other than Iran is sufficient to permit purchasers of petroleum and
petroleum products from Iran to reduce significantly in volume their purchases from Iran.”
Because Iran participates in the global oil market and because biofuels are a close substitute for
petroleum products, this report examines “availability and price” in the global liquid fuels market. The
term “liquid fuels” encompasses petroleum and petroleum products and close substitutes, including
crude oil, lease condensate, natural gas plant liquids, biofuels, coal-to-liquids, gas-to-liquids, and
refinery processing gains.
June 2012
U.S. Energy Information Administration | Availability and Price of Petroleum and Petroleum Products Produced in Countries Other Than Iran 10
Once the availability of global liquid fuels is established, EIA estimates the availability of “petroleum and
petroleum products produced in countries other than Iran” by subtracting global biofuels and liquid
fuels produced and consumed in Iran from the global liquid fuels totals.
In 2011, EIA estimates that Iran was the world’s fifth-largest supplier of total liquid fuels – producing an
average of 4.2 million bbl/d and accounting for between 4 and 5 percent of global supply. In 2009 and
2010, Iran’s total liquid fuels production had been 4.2 million bbl/d and 4.3 million bbl/d, respectively.
Iran is the third-largest exporter of crude oil. Though Iran’s crude oil production capacity has eroded in
recent years, increases in output of lease condensate and natural gas liquids have partially offset
declines in crude oil production since the beginning of 2011. Iran has historically been a net importer of
petroleum products, particularly gasoline, since its consumption of liquid fuels exceeds its own refining
capacity.
All of the volume data presented in this report are estimates that are subject to change as more
information becomes available. For many countries, official monthly liquid fuels production,
consumption and inventory data are unavailable, significantly lagged, or frequently revised. Production
estimates for the months covered by this report are based upon a combination of the most recent
available production or trade data, forecast decline rates, project schedules, and adjustments due to
maintenance and other reported outages.
Liquid fuels consumption and inventory data for most OECD member countries outside of the United
States are based upon published International Energy Agency (IEA) estimates, which are lagged by two
to three months and are trended forward using forecast economic growth, weather, and related
assumptions. As of this report’s release, the most recent available IEA data are for March. Weekly data
on U.S. stock changes, refinery activity, and imports together with estimates of primary liquids
production, exports, and product supplied are available through EIA’s Weekly Petroleum Status Report.
EIA’s estimates of liquid fuels consumption for non-OECD countries are primarily based upon estimated
changes in economic activity and related assumptions.
In this report, monthly data are presented alongside their year-ago and 2009-2011 averages to provide
context regarding how current market conditions compare to recent history.
In contrast to volume data, price data are available on a daily basis and can be considered final. The
price data in this report are current as of June 22, 2012. In order to make it more understandable, and
to respect contractual restrictions on EIA republication of certain data, most price data are reported
using 5-day rolling or monthly averages and some are reported only in the figures.

June 2012
U.S. Energy Information Administration | Availability and Price of Petroleum and Petroleum Products Produced in Countries Other Than Iran 11
Liquid Fuels Production during May and June 2012
World liquid fuels production significantly exceeded historical averages during May and June 2012. EIA
estimates that an average of 88.9 million bbl/d of liquid fuels were produced over those two months,
which is roughly 2.9 million bbl/d higher than both the 2009-2011 annual average and the same time
period in 2011 (Table 2). However, global production fell slightly from May to June due largely to
maintenance in the North Sea, Angola, and Russia, and a small cutback in output from Saudi Arabia.
Increased supplies of crude oil from OPEC members, which serve as the “swing” producers in the world
market due to their control of surplus or “spare” oil production capacity, accounts for almost half of the
growth in global liquid fuels production over the past year. OPEC crude oil output over the past two
months is estimated at 30.8 million bbl/d, above the three-year average of 29.6 million bbl/d. Excluding
Iran, OPEC members produced an average of 27.7 million bbl/d of crude oil in May and June. OPEC
members also produced an estimated 5.8 million bbl/d of non-crude liquid fuels (e.g., condensates and
natural gas plant liquids) during the same time period. This non-crude output, which is not subject to
OPEC’s production targets, was 0.4 million bbl/d above year-ago levels and 0.7 million bbl/d above the
three-year annual average.
Outside of Iran, notable changes to OPEC crude oil production in recent months have occurred in
Angola, Iraq, Libya, and Saudi Arabia. Iraq is an especially significant contributor to the recent increase in
global liquid fuels production, as new infrastructure has facilitated increased exports from the country’s
large southern fields. Iraq’s estimated crude oil production level of 2.9 million bbl/d in May and June is
its highest since 2000, and represents increases of 0.3 million bbl/d relative to year-ago levels and 0.5
million bbl/d relative to the 2009-2011 annual average. Libya is producing approximately 1.4 million
bbl/d, an increase of 1.2 million bbl/d from May-June 2011, when most of the country’s crude oil
production capacity was shut-in due to civil strife. The impressive restoration of the lion’s share of
Libya’s oil production has mitigated one major source of market tightness over the last year, but signs of
strain are apparent: crude oil output has recently stagnated after steady growth towards pre-crisis levels
of over 1.6 million bbl/d as technical issues linger, political risk is elevated in advance of elections, and
the militia-dominated security environment remains precarious. Other OPEC developments include a
slight decline in crude oil production from Angola in June due to maintenance on the Total-operated
deepwater Girassol field. Meanwhile, Saudi Arabia, as a balancing force in the global oil market, is
estimated to have reduced production slightly in May and June in light of slightly looser market
conditions.
Liquid fuels production among non-OPEC countries was approximately 52.3 million bbl/d in May and
June 2012, an increase of 1.0 million bbl/d from the same period last year and 0.9 million bbl/d above
the three-year average. The vast majority of the recent growth in non-OPEC liquids production has
occurred in North America. In fact, production growth in North America – at 1.2 million bbl/d relative to
May-June 2011 and 1.5 million bbl/d from 2009-2011 average levels – exceeds total non-OPEC growth as
the combined output of other regions showed a net decline (Table 3). The United States represents the
single largest source of non-OPEC liquids production growth over the past year and the largest source of
liquids production growth relative to the recent three-year average for any country, OPEC and non-OPEC
alike. Over the last two months, U.S. liquid fuels production – including natural gas liquids, condensates,

June 2012
U.S. Energy Information Administration | Availability and Price of Petroleum and Petroleum Products Produced in Countries Other Than Iran 12
biofuels, and refinery gains, as well as crude oil – reached 10.9 million bbl/d, relative to 10.0 million
bbl/d for the same months last year and 9.6 million bbl/d over 2009-2011. For the first time in 14 years,
U.S. crude oil production averaged 6.3 million bbl/d in June 2012. Tight oil plays are the primary driver
of the increase, as North Dakota recently surpassed Alaska as the state with the second-largest oil
output due to accelerated drilling in the Bakken shale formation. Canadian liquid fuels production also
exceeds historical levels, albeit by a lesser amount, due to the growth in unconventional output from
Alberta’s oil sands. Mexican oil production, on the other hand, has been flat at 3.0 million bbl/d –
though this too represents another achievement of sorts for North America, given that the recent
relatively steep declines in output from that country’s state-run oil sector seem to have ceased for the
time being.
Unplanned outages to non-OPEC production have ameliorated somewhat since March and April, but
remain elevated (Figure 3). EIA estimates that approximately 0.9 million bbl/d of non-OPEC production
was offline in May and June, relative to 1.3 million bbl/d in March, 1.1 million bbl/d in April, and an
average of 0.6 million bbl/d in the fourth quarter of 2011. The largest source of disruption stems from
tensions between Sudan and South Sudan, where a combined 0.4 million bbl/d is offline. All of South
Sudan’s oil production is shut-in, which accounts for over 0.3 million bbl/d of the total, while output
from the contested Heglig field currently controlled by Sudan has been partially restored after military
clashes in April caused damage to the field’s infrastructure. Another 0.2 million bbl/d of production
continues to be offline in Syria, where oil exports have virtually ceased since sanctions were imposed.
The risks to oil output in Syria have increased in recent weeks along with reported attacks to pipelines
and increasingly intense fighting between the Bashar al-Assad regime and opposing factions. A smaller
amount of production is offline in Yemen, about 0.1 million bbl/d, due to continued insecurity around
the sabotaged Marib pipeline.
Technical issues and related shut-ins persist in the North Sea, but have eased in Canada. North Sea
output is impaired by unplanned maintenance at Norway’s Snorre, Gullfaks, and Grane fields, shut-in
production at the United Kingdom’s Elgin/Franklin Complex, and ongoing compressor problems in the
Buzzard Field. Compared to the time period covered by the previous report in this series, a major reason
for the lower level of disruptions to non-OPEC production in May and June is the completion of repairs
to the plants that upgrade bitumen produced from Alberta’s oil sands into synthetic crude oil.
Unplanned outages to Canadian production peaked at 0.3 million bbl/d in March and have been mostly
resolved since, though smaller amounts of planned maintenance continue.

June 2012
U.S. Energy Information Administration | Availability and Price of Petroleum and Petroleum Products Produced in Countries Other Than Iran 13
Table 2. International Liquid Fuels Production, Consumption, and Inventory Estimates
Item May 2012
June 2012
May-June 2012
Average
May-June 2011
Average 2009-2011
Average
Production (million barrels per day) (a)
OECD 22.5 22.2 22.4 21.0 21.4
U.S. (50 States) 10.9 10.9 10.9 10.0 9.6
Canada 3.7 3.7 3.7 3.3 3.5
Mexico 3.0 2.9 3.0 3.0 3.0
North Sea (b) 3.3 3.1 3.2 3.2 3.7
Other OECD 1.6 1.6 1.6 1.5 1.5
Non-OECD 66.6 66.5 66.6 65.0 64.8
OPEC 36.7 36.5 36.6 34.7 34.7
Crude Oil Portion 30.9 30.7 30.8 29.3 29.6
Other Liquids 5.8 5.8 5.8 5.4 5.1
Former Soviet Union 13.4 13.3 13.3 13.3 13.1
China 4.4 4.5 4.4 4.3 4.2
Other Non-OECD 12.1 12.2 12.2 12.6 12.7
Total World Production 89.1 88.7 88.9 86.0 86.1
Non-OPEC Production 52.4 52.2 52.3 51.3 51.4
Consumption (million barrels per day) (c)
OECD 43.7 44.9 44.3 44.6 45.8
U.S. (50 States) 18.4 18.9 18.7 18.8 18.9
U.S. territories 0.3 0.3 0.3 0.3 0.3
Canada 2.1 2.2 2.2 2.2 2.2
Europe 13.5 14.0 13.7 14.2 14.5
Japan 4.0 4.2 4.1 3.9 4.4
Other OECD 5.2 5.4 5.3 5.3 5.4
Non-OECD 43.6 43.8 43.7 42.6 40.8
Former Soviet Union 4.6 4.6 4.6 4.5 4.5
Europe 0.7 0.8 0.8 0.7 0.7
China 10.1 10.2 10.1 9.8 9.2
Other Asia 10.7 10.6 10.6 10.4 9.8
Other Non-OECD 17.5 17.7 17.6 17.2 16.6
Total World Consumption 87.2 88.7 87.9 87.3 86.6
Inventory Net Withdrawals (million barrels per day)
U.S. (50 States) -0.4 -0.5 -0.5 -0.5 0.0
Other OECD -0.5 0.2 -0.2 0.2 0.1
Other Stock Draws and Balance -0.9 0.3 -0.3 1.5 0.4
Total Stock Draw -1.9 0.0 -1.0 1.2 0.5
End-of-period Inventories (million barrels)
U.S. Commercial Inventory 1,092 1,107 1,100 1,080 --
OECD Commercial Inventory 2,669 2,679 2,674 2,669 --

June 2012
U.S. Energy Information Administration | Availability and Price of Petroleum and Petroleum Products Produced in Countries Other Than Iran 14
OECD = Organization for Economic Cooperation and Development: Australia, Austria, Belgium, Canada, the Czech Republic,
Denmark, Finland, France, Germany, Greece, Hungary, Iceland, Ireland, Italy, Japan, Luxembourg, Mexico, the Netherlands, New
Zealand, Norway, Poland, Portugal, Slovakia, South Korea, Spain, Sweden, Switzerland, Turkey, the United Kingdom, and the
United States. Monthly OECD supply and consumption does not yet include Chile, Estonia, Israel, or Slovenia.
OPEC = Organization of the Petroleum Exporting Countries: Algeria, Angola, Ecuador, Iran, Iraq, Kuwait, Libya, Nigeria, Qatar,
Saudi Arabia, the United Arab Emirates, and Venezuela.
Former Soviet Union = Armenia, Azerbaijan, Belarus, Estonia, Georgia, Kazakhstan, Kyrgyzstan, Latvia, Lithuania, Moldova,
Russia, Tajikistan, Turkmenistan, Ukraine and Uzbekistan.
(a) Supply includes production of crude oil (including lease condensates), natural gas plant liquids, biofuels, other liquids, and
refinery processing gains.
(b) Includes offshore supply from Denmark, Germany, the Netherlands, Norway, and the United Kingdom.
(c) Consumption of petroleum by the OECD countries is synonymous with "products supplied," defined in the glossary of the EIA
Petroleum Supply Monthly, DOE/EIA-0109. Consumption of petroleum by the non-OECD countries is "apparent consumption,"
which includes internal consumption, refinery fuel and loss, and bunkering.
Source: U.S. Energy Information Administration
Figure 3. Estimated Unplanned Production Disruptions Among non-OPEC Producers, October 2011 – June 2012
Source: U.S. Energy Information Administration
0
200
400
600
800
1000
1200
1400
Oct-11 Nov-11 Dec-11 Jan-12 Feb-12 Mar-12 Apr-12 May-12 Jun-12
Australia Brazil Canada China Colombia Mexico North Sea Sudan/S. Sudan Syria Yemen
thousand barrels per day
June 2012
U.S. Energy Information Administration | Availability and Price of Petroleum and Petroleum Products Produced in Countries Other Than Iran 15
Liquid Fuels Consumption during May and June 2012
Over the last two months, EIA estimates that global liquid fuels consumption averaged 87.9 million bbl/d
(Table 2), which was 0.7 million bbl/d higher than the year-ago level, 1.3 million bbl/d higher than the
2009-2011 average, and 0.3 million bbl/d above the estimated average for March and April.
Since 2009, non-OECD countries have accounted for most of world’s consumption growth, due to a
combination of rapid economic growth and other factors. China’s liquid fuels consumption is estimated
to be 10.1 million bbl/d, compared to an estimated May-June 2011 average of 9.8 million bbl/d and a
three-year average of 9.2 million bbl/d. China’s apparent oil demand growth hinges on several factors,
including economic and industrial growth. Apparent demand is estimated, as China does not publish
complete energy data. Recent indicators reflect that China’s gross domestic product growth and
industrial production moderated in the first half of 2012, and the official production manufacturing
index (PMI) for May fell to the lowest level in 2012.
Average OECD oil consumption for May and June was approximately 0.4 million bbl/d lower than year-
ago levels and about 1.5 million bbl/d lower than the three-year average. May and June consumption
figures should be considered in light of the seasonality of fuel consumption. Seasonality refers to the
fact that consumption normally rises in the Northern Hemisphere winter due to higher heating oil
consumption in OECD countries, as well as in the summer because of the U.S. driving season and
increased oil use to fuel electricity generation in the Middle East. Japan has had a significant increase in
liquid fuels consumption from year-ago levels due to a greater reliance on oil for electricity production
and reconstruction needs in the wake of the 2011 earthquake and tsunami.
With the summer driving season now underway, U.S. oil consumption in May and June rose to an
average of 18.7 million bbl/d compared to March and April’s average of 18.3 million bbl/d. Total
consumption in OECD Europe remained flat compared with the March and April average. While a
rebuilding of inventories following a much colder-than-normal winter is likely ongoing, current economic
conditions in much of Europe are affecting the demand for non-heating fuel, thus dampening the effect
of the stock rebuild on the overall consumption volumes. Furthermore, a ramping up in the use of crude
oil for electric power generation in the Middle East is occurring, contributing to the overall growth in
total consumption, particularly in June.
Oil demand and economic growth are strongly correlated, and the latter is a key input into oil
consumption estimates. World economic growth has stalled during the first and second quarters of
2012, with Western Europe showing the slowest growth and the Asia-Pacific region experiencing the
highest growth. During the second quarter of 2012, world economic growth is estimated at 2.7 percent,
the same as the previous quarter (all growth rates weighted at market exchange rates). The second
quarter 2012 world economic growth flattened primarily because Asia-Pacific’s growth accelerated
while growth prospects in the Eurozone weakened. While second quarter 2012 world economic growth
remained at first quarter rates of growth, Asia-Pacific region experienced growth at 5.2 percent, 0.2
percent higher than the first quarter growth, primarily led by Japanese and Indian growth recoveries.
Western Europe experienced an estimated -0.3 percent growth in second quarter 2012, 0.4 percentage
points below its first-quarter growth.

June 2012
U.S. Energy Information Administration | Availability and Price of Petroleum and Petroleum Products Produced in Countries Other Than Iran 16
Inventory Net Withdrawals
Commercial oil inventories enable world liquids markets to ameliorate temporary imbalances between
supply and demand. Inventories constitute the first line of defense against a supply disruption, which
makes inventory change an important metric in assessing the tightness of world oil markets. As such,
inventory level and change estimations serve as a balancing factor between supply and demand.
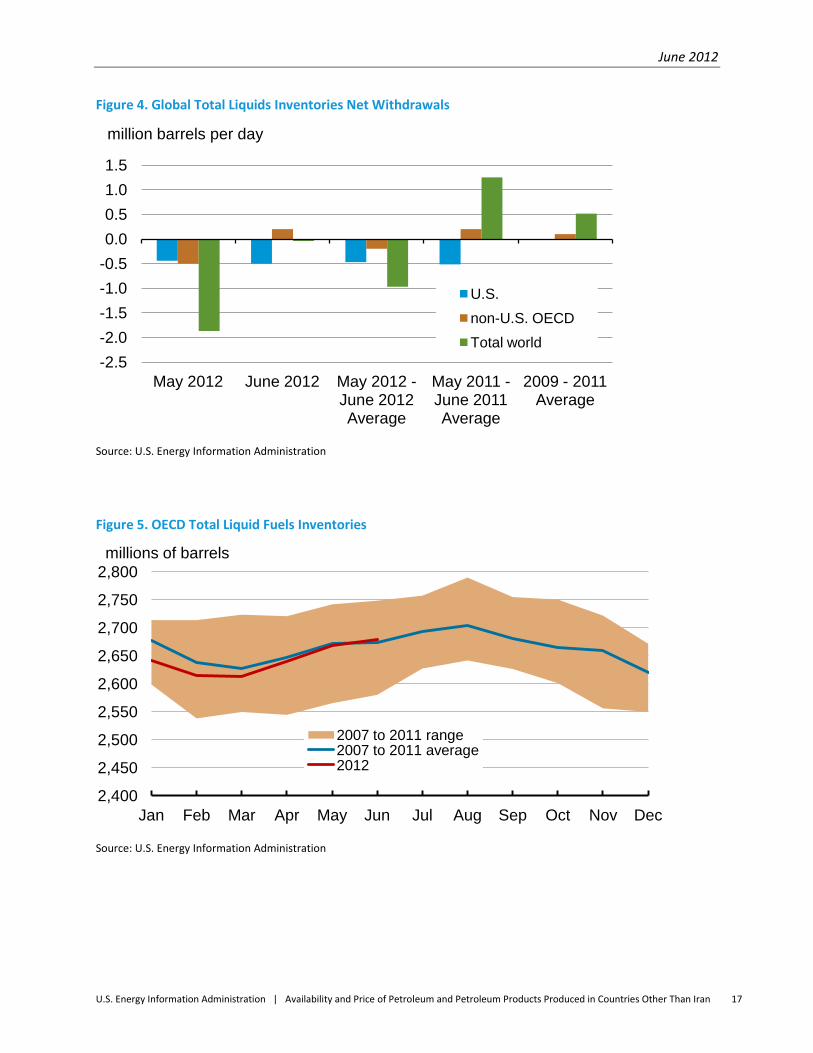
Inventories in the United States were estimated to have risen by 0.4 million bbl/d in May 2012 and by
0.5 million bbl/d in June 2012 (Table 2). EIA estimates that other OECD commercial liquid fuels
inventories also increased by an average of 0.5 million bbl/d during May, but declined to 0.2 million
bbl/d in June 2012. Typically, inventories in OECD countries are built during May-June following
seasonal withdrawals in the winter months (November-March).
EIA’s estimate of global inventories, which include implied non-OECD stocks and a balancing item, built
by an average of 1.0 million bbl/d in May-June 2012. In contrast, global stock levels decreased by an
estimated 1.2 million bbl/d over the same time period in 2011. There are continuing reports that
impediments to Iranian oil exports have resulted in Iranian oil production being accumulated, perhaps
involuntarily, as on-land and “on the water” oil inventories.
June 2012
U.S. Energy Information Administration | Availability and Price of Petroleum and Petroleum Products Produced in Countries Other Than Iran 17
Figure 4. Global Total Liquids Inventories Net Withdrawals
Source: U.S. Energy Information Administration
Figure 5. OECD Total Liquid Fuels Inventories
Source: U.S. Energy Information Administration
-2.5
-2.0
-1.5
-1.0
-0.5
0.0
0.5
1.0
1.5
May 2012 June 2012 May 2012 - June 2012 Average
May 2011 - June 2011 Average
2009 - 2011 Average
U.S.
non-U.S. OECD
Total world
million barrels per day
2,400
2,450
2,500
2,550
2,600
2,650
2,700
2,750
2,800
Jan Feb Mar Apr May Jun Jul Aug Sep Oct Nov Dec
2007 to 2011 range 2007 to 2011 average 2012
millions of barrels

June 2012
U.S. Energy Information Administration | Availability and Price of Petroleum and Petroleum Products Produced in Countries Other Than Iran 18
Table 3. Non-OPEC Liquid Fuels Supply Estimates
Item (million barrels per day) May 2012
June 2012
May-June 2012
Average
May-June 2011
Average 2009-2011
Average
North America 17.6 17.5 17.6 16.3 16.1
Canada 3.7 3.7 3.7 3.3 3.5
Mexico 3.0 2.9 3.0 3.0 3.0
United States 10.9 10.9 10.9 10.0 9.6
Central and South America 4.7 4.7 4.7 4.8 4.7
Argentina 0.8 0.8 0.8 0.7 0.8
Brazil 2.6 2.6 2.6 2.7 2.7
Colombia 0.9 0.9 0.9 0.9 0.8
Other Central and South America 0.4 0.4 0.4 0.5 0.5
Europe 4.3 4.1 4.2 4.1 4.6
Norway 2.1 1.9 2.0 1.9 2.2
United Kingdom (offshore) 1.0 1.0 1.0 1.1 1.3
Other North Sea 0.2 0.2 0.2 0.3 0.3
Former Soviet Union (FSU) 13.4 13.3 13.3 13.3 13.1
Azerbaijan 1.0 1.0 1.0 1.0 1.0
Kazakhstan 1.6 1.6 1.6 1.7 1.6
Russia 10.3 10.2 10.2 10.2 10.1
Turkmenistan 0.2 0.2 0.2 0.2 0.2
Other FSU 0.3 0.3 0.3 0.2 0.2
Middle East 1.3 1.3 1.3 1.4 1.5
Oman 0.9 0.9 0.9 0.9 0.9
Syria 0.2 0.2 0.2 0.4 0.4
Yemen 0.2 0.2 0.2 0.1 0.2
Asia and Oceania 8.9 9.0 8.9 8.6 8.7
Australia 0.6 0.6 0.6 0.5 0.5
China 4.4 4.5 4.4 4.3 4.2
India 0.9 0.9 0.9 0.9 0.9
Indonesia 1.0 1.0 1.0 1.0 1.0
Malaysia 0.6 0.6 0.6 0.6 0.7
Vietnam 0.4 0.4 0.4 0.3 0.3
Africa 2.3 2.3 2.3 2.6 2.6
Egypt 0.7 0.7 0.7 0.7 0.7
Equatorial Guinea 0.3 0.3 0.3 0.3 0.3
Gabon 0.2 0.2 0.2 0.2 0.2
Sudan 0.1 0.1 0.1 0.5 0.5
Total non-OPEC liquids 52.4 52.2 52.3 51.3 51.4
OPEC non-crude liquids 5.8 5.8 5.8 5.4 5.1
June 2012
U.S. Energy Information Administration | Availability and Price of Petroleum and Petroleum Products Produced in Countries Other Than Iran 19
Non-OPEC + OPEC non-crude liquids 58.2 58.0 58.1 56.7 56.5
Former Soviet Union = Armenia, Azerbaijan, Belarus, Estonia, Georgia, Kazakhstan, Kyrgyzstan, Latvia, Lithuania, Moldova,
Russia, Tajikistan, Turkmenistan, Ukraine and Uzbekistan.
Sudan production represents total production from both north and south.
OPEC = Organization of the Petroleum Exporting Countries: Algeria, Angola, Ecuador, Iran, Iraq, Kuwait, Libya, Nigeria, Qatar,
Saudi Arabia, the United Arab Emirates, and Venezuela. Source: U.S. Energy Information Administration
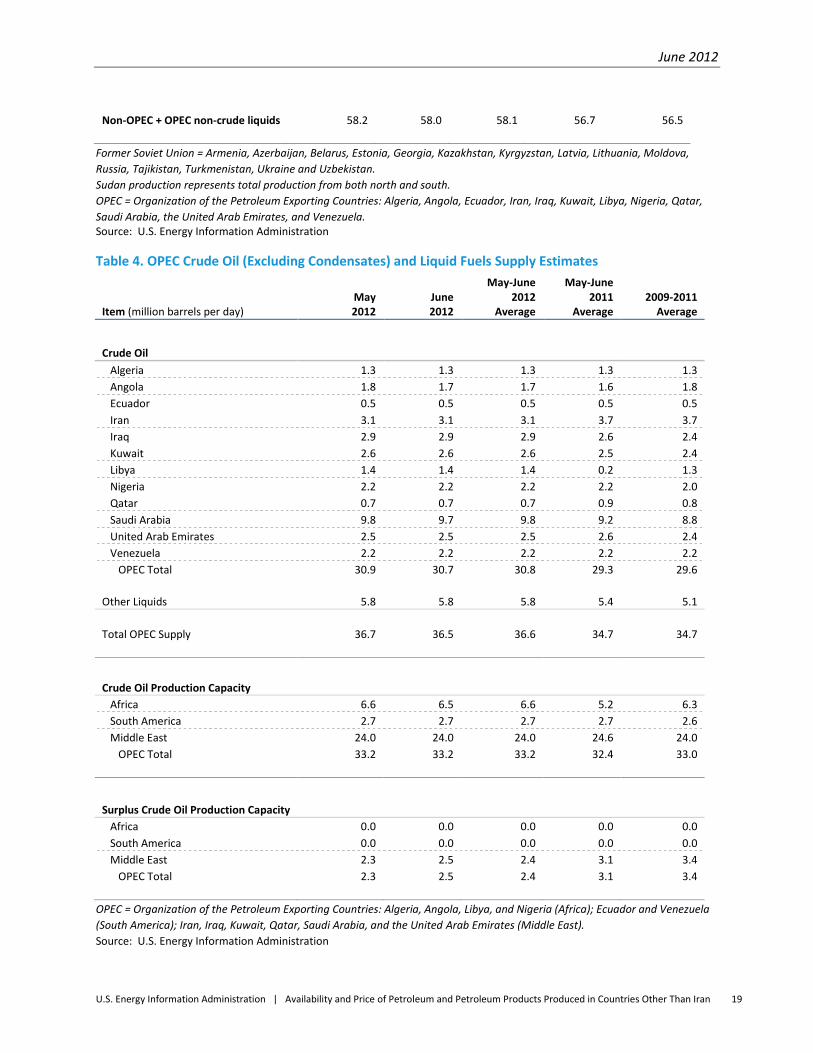
Table 4. OPEC Crude Oil (Excluding Condensates) and Liquid Fuels Supply Estimates
Item (million barrels per day) May 2012
June 2012
May-June 2012
Average
May-June 2011
Average 2009-2011
Average
Crude Oil
Algeria 1.3 1.3 1.3 1.3 1.3
Angola 1.8 1.7 1.7 1.6 1.8
Ecuador 0.5 0.5 0.5 0.5 0.5
Iran 3.1 3.1 3.1 3.7 3.7
Iraq 2.9 2.9 2.9 2.6 2.4
Kuwait 2.6 2.6 2.6 2.5 2.4
Libya 1.4 1.4 1.4 0.2 1.3
Nigeria 2.2 2.2 2.2 2.2 2.0
Qatar 0.7 0.7 0.7 0.9 0.8
Saudi Arabia 9.8 9.7 9.8 9.2 8.8
United Arab Emirates 2.5 2.5 2.5 2.6 2.4
Venezuela 2.2 2.2 2.2 2.2 2.2
OPEC Total 30.9 30.7 30.8 29.3 29.6
Other Liquids 5.8 5.8 5.8 5.4 5.1
Total OPEC Supply 36.7 36.5 36.6 34.7 34.7
Crude Oil Production Capacity
Africa 6.6 6.5 6.6 5.2 6.3
South America 2.7 2.7 2.7 2.7 2.6
Middle East 24.0 24.0 24.0 24.6 24.0
OPEC Total 33.2 33.2 33.2 32.4 33.0
Surplus Crude Oil Production Capacity
Africa 0.0 0.0 0.0 0.0 0.0
South America 0.0 0.0 0.0 0.0 0.0
Middle East 2.3 2.5 2.4 3.1 3.4
OPEC Total 2.3 2.5 2.4 3.1 3.4
OPEC = Organization of the Petroleum Exporting Countries: Algeria, Angola, Libya, and Nigeria (Africa); Ecuador and Venezuela
(South America); Iran, Iraq, Kuwait, Qatar, Saudi Arabia, and the United Arab Emirates (Middle East).
Source: U.S. Energy Information Administration

June 2012
U.S. Energy Information Administration | Availability and Price of Petroleum and Petroleum Products Produced in Countries Other Than Iran 20
Spare Crude Oil Production Capacity
EIA defines spare crude oil production capacity as potential oil production that could be brought online
within 30 days and sustained for at least 90 days, consistent with sound business practices. This does
not include oil production increases that could not be sustained without degrading the future
production capacity of a field. Spare crude oil production capacity is an important indicator of the
market’s ability to respond to potential disruptions; consequently, low spare oil production capacity
tends to be associated with high oil prices and high oil price volatility.
Currently, the world’s only spare crude oil production capacity lies in the OPEC countries in the Persian
Gulf, largely in Saudi Arabia. EIA estimates that spare OPEC oil production capacity averaged 2.4 million
bbl/d during May and June, compared with an average of 3.1 million bbl/d in the comparable year-ago
period and 3.4 million bbl/d over 2009-2011 (Figure 6). Based on EIA estimates, spare production
capacity is less than 3 percent of total world consumption, a historically low level. Spare capacity must
also be considered in the context of current geopolitical uncertainties, including, but not limited to, the
situation in Iran.
Spare capacity is not created equal. For example, if Iran is forced to shut in production because
difficulties with marketing its oil outstrip available oil storage capacity, then that shut-in capacity may be
technically counted as new spare capacity. However, that hypothetical spare capacity would not be
readily available to alleviate market tightness in the same manner as regular spare capacity not forced
by sanctions. Likewise, declines in spare capacity due to declines in the actual production capacity of an
OPEC member might have different implications for prices and perceptions of market tightness than a
decline in spare capacity because of changes to production in response to market needs. For these
reasons, markets may react to changes in the composition of spare capacity, as well as its aggregate
level.
Figure 6. World Spare Crude Oil Production Capacity
Source: U.S. Energy Information Administration
0
20
40
60
80
100
120
140
0
1
2
3
4
5
6
7
2001 2002 2003 2004 2005 2006 2007 2008 2009 2010 2011 2012
OPEC spare capacity (left axis)
WTI crude oil price (right axis)
million barrels per day 2010 dollars per barrel

June 2012
U.S. Energy Information Administration | Availability and Price of Petroleum and Petroleum Products Produced in Countries Other Than Iran 21
Refining and Transportation Capacity
Oil refineries and transportation capacity are critical components of the global oil market. When
changes in oil supply, demand, or loss of capacity cause either refining or transportation capacity to
become overloaded, it creates “bottlenecks” that can cause substantial fluctuations in the availability
and price of petroleum and petroleum products. With the notable exception of oil pipeline capacity in
the U.S. midcontinent, refining and transportation capacity has been adequate and has not caused
significant distortions in the availability and price of petroleum and petroleum products during May and
June 2012.
Despite some notable refinery capacity reductions and closures in the United States, the Caribbean, and
Europe in 2011, total oil distillation capacity worldwide was essentially unchanged last year (Figure 7) as
new refining capacity in Asia offset the closures. The difference between the value of refined products
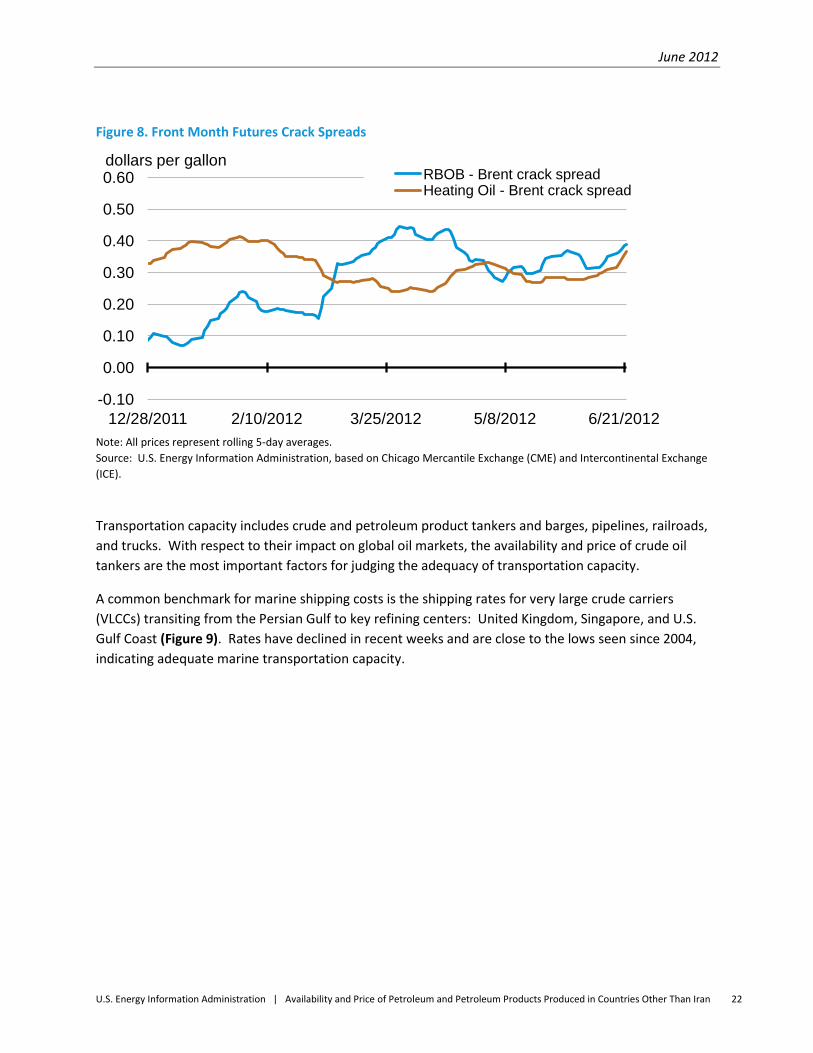
and crude oil, or the “crack spread,” can be used as an indicator of the adequacy of refining capacity.
Two important crack spreads for the U.S. East Coast are RBOB futures and heating oil futures spreads
versus Brent (Figure 8). The gasoline crack spread averaged $0.34 per gallon in May and June (Table 5),
$0.03 per gallon higher than in May and June 2011, but less than the $0.38-per-gallon spread in March
and April 2012. The heating oil crack spread in May and June was $0.30 per gallon, $0.05 per gallon
above last year’s two-month average and $0.03 per gallon higher than March and April 2012. Aside
from these changes in the RBOB-Brent spread, crude oil and product prices at the key refining centers
around the world remain relatively stable, and do not indicate any significant global shortage of refining
capacity (Figures 11, 21, 23, 30).
Figure 7. Global Crude Oil Distillation Capacity
Source: Purvin & Gertz.
80
82
84
86
88
90
92
94
2000 2001 2002 2003 2004 2005 2006 2007 2008 2009 2010 2011
million barrels per day
=
June 2012
U.S. Energy Information Administration | Availability and Price of Petroleum and Petroleum Products Produced in Countries Other Than Iran 22
Figure 8. Front Month Futures Crack Spreads
Note: All prices represent rolling 5-day averages.
Source: U.S. Energy Information Administration, based on Chicago Mercantile Exchange (CME) and Intercontinental Exchange
(ICE).
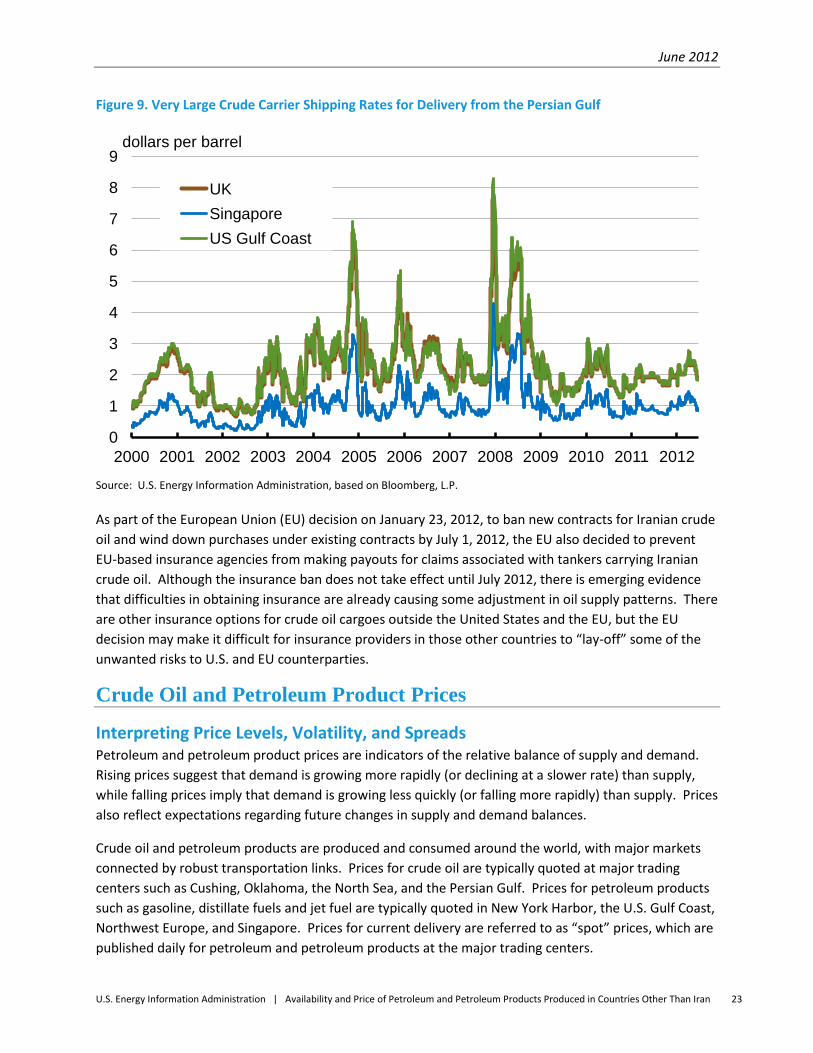
Transportation capacity includes crude and petroleum product tankers and barges, pipelines, railroads,
and trucks. With respect to their impact on global oil markets, the availability and price of crude oil
tankers are the most important factors for judging the adequacy of transportation capacity.
A common benchmark for marine shipping costs is the shipping rates for very large crude carriers
(VLCCs) transiting from the Persian Gulf to key refining centers: United Kingdom, Singapore, and U.S.
Gulf Coast (Figure 9). Rates have declined in recent weeks and are close to the lows seen since 2004,
indicating adequate marine transportation capacity.
-0.10
0.00
0.10
0.20
0.30
0.40
0.50
0.60
12/28/2011 2/10/2012 3/25/2012 5/8/2012 6/21/2012
RBOB - Brent crack spread Heating Oil - Brent crack spread
dollars per gallon
June 2012
U.S. Energy Information Administration | Availability and Price of Petroleum and Petroleum Products Produced in Countries Other Than Iran 23
Figure 9. Very Large Crude Carrier Shipping Rates for Delivery from the Persian Gulf
Source: U.S. Energy Information Administration, based on Bloomberg, L.P.
As part of the European Union (EU) decision on January 23, 2012, to ban new contracts for Iranian crude
oil and wind down purchases under existing contracts by July 1, 2012, the EU also decided to prevent
EU-based insurance agencies from making payouts for claims associated with tankers carrying Iranian
crude oil. Although the insurance ban does not take effect until July 2012, there is emerging evidence
that difficulties in obtaining insurance are already causing some adjustment in oil supply patterns. There
are other insurance options for crude oil cargoes outside the United States and the EU, but the EU
decision may make it difficult for insurance providers in those other countries to “lay-off” some of the
unwanted risks to U.S. and EU counterparties.
Crude Oil and Petroleum Product Prices
Interpreting Price Levels, Volatility, and Spreads Petroleum and petroleum product prices are indicators of the relative balance of supply and demand.
Rising prices suggest that demand is growing more rapidly (or declining at a slower rate) than supply,
while falling prices imply that demand is growing less quickly (or falling more rapidly) than supply. Prices
also reflect expectations regarding future changes in supply and demand balances.
Crude oil and petroleum products are produced and consumed around the world, with major markets
connected by robust transportation links. Prices for crude oil are typically quoted at major trading
centers such as Cushing, Oklahoma, the North Sea, and the Persian Gulf. Prices for petroleum products
such as gasoline, distillate fuels and jet fuel are typically quoted in New York Harbor, the U.S. Gulf Coast,
Northwest Europe, and Singapore. Prices for current delivery are referred to as “spot” prices, which are
published daily for petroleum and petroleum products at the major trading centers.
0
1
2
3
4
5
6
7
8
9
2000 2001 2002 2003 2004 2005 2006 2007 2008 2009 2010 2011 2012
UK
Singapore
US Gulf Coast
dollars per barrel
June 2012
U.S. Energy Information Administration | Availability and Price of Petroleum and Petroleum Products Produced in Countries Other Than Iran 24
In addition, certain crude oils and petroleum products are traded on futures exchanges, where traders
buy and sell contracts for future delivery of specific crude oils and petroleum products. Prices are
negotiated through a bid and ask system, and therefore reflect news, events, and other information that
may affect current or future crude oil and petroleum product supply and demand. This process is
referred to as price discovery. The front month futures contract price is an indicator of current market
conditions and is usually very close in value to the “spot” price of a specific product in a given trading
center. The front month is the active contract with the shortest time to maturity.
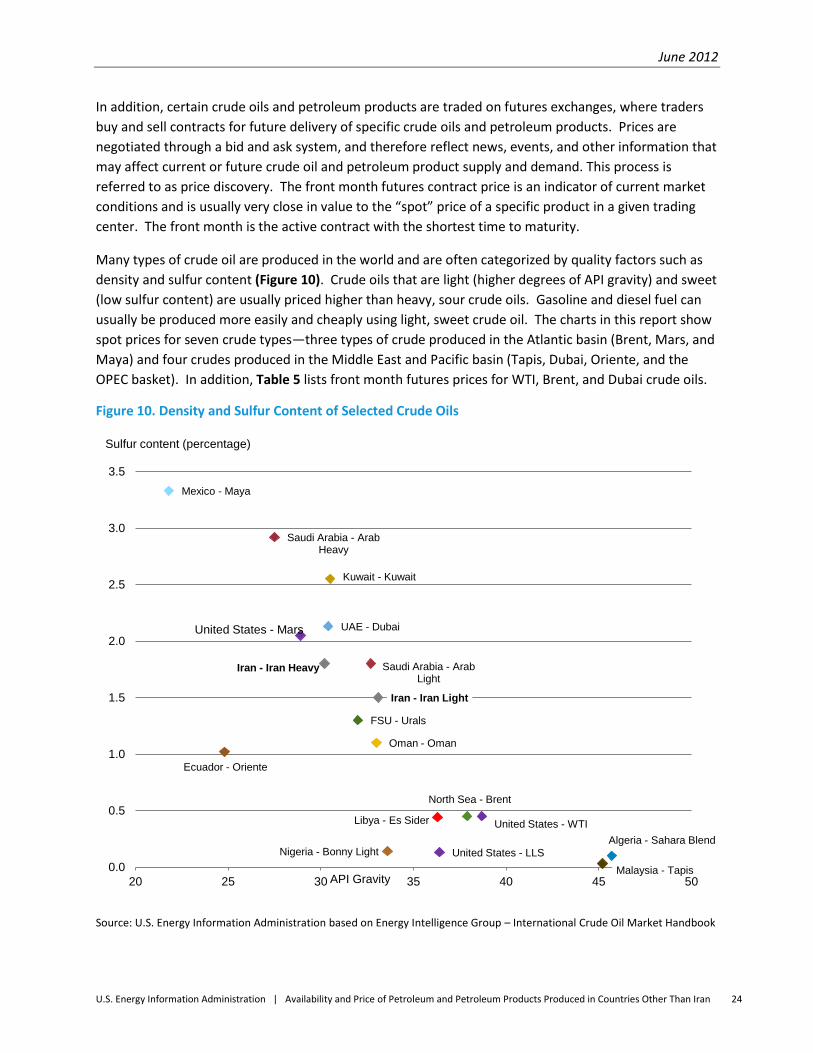
Many types of crude oil are produced in the world and are often categorized by quality factors such as
density and sulfur content (Figure 10). Crude oils that are light (higher degrees of API gravity) and sweet
(low sulfur content) are usually priced higher than heavy, sour crude oils. Gasoline and diesel fuel can
usually be produced more easily and cheaply using light, sweet crude oil. The charts in this report show
spot prices for seven crude types—three types of crude produced in the Atlantic basin (Brent, Mars, and
Maya) and four crudes produced in the Middle East and Pacific basin (Tapis, Dubai, Oriente, and the
OPEC basket). In addition, Table 5 lists front month futures prices for WTI, Brent, and Dubai crude oils.
Figure 10. Density and Sulfur Content of Selected Crude Oils
Source: U.S. Energy Information Administration based on Energy Intelligence Group – International Crude Oil Market Handbook
Algeria - Sahara Blend
Ecuador - Oriente
FSU - Urals
Kuwait - Kuwait
Libya - Es Sider
Malaysia - Tapis
Mexico - Maya
Nigeria - Bonny Light
North Sea - Brent
Oman - Oman
Saudi Arabia - Arab Heavy
Saudi Arabia - Arab Light
UAE - Dubai
United States - LLS
United States - Mars
United States - WTI
Iran - Iran Heavy
Iran - Iran Light
0.0
0.5
1.0
1.5
2.0
2.5
3.0
3.5
20 25 30 35 40 45 50
Sulfur content (percentage)
API Gravity

June 2012
U.S. Energy Information Administration | Availability and Price of Petroleum and Petroleum Products Produced in Countries Other Than Iran 25
WTI is an important benchmark crude that is heavily traded on futures exchanges. Over the last 18
months, however, the WTI market has disengaged from other global markets, in large part due to the
increasing crude oil flows into Cushing, Oklahoma (the physical delivery point for the NYMEX light, sweet
crude oil futures contract). Crude oil produced in the northern part of the United States and western
Canada exceed the sum of regional refining capacity and the pipeline capacity needed to move the
excess crude to refineries in other regions, including the Gulf Coast. For that reason, Brent and other
crude oils are currently considered better indicators of global prices for light sweet crude oil.
Spot petroleum product prices are presented for gasoline, distillate, and jet fuel in New York Harbor, the
U.S. Gulf Coast, Northwest Europe, and Singapore. RBOB is an unfinished gasoline that requires
blending with an oxygenate, such as ethanol, before being sold. RBOB (or Eurobob in Europe) is often
traded instead of finished motor gasoline that already has been blended with ethanol, since oxygenate
blending typically takes place at terminals further along the distribution chain. Table 5 includes front
month futures market prices for RBOB and heating oil.
Price differences between types of crude oil or between market locations, and how these differences
change over time, provide information on changing market conditions around the world. Monitoring
prices and price differentials in several regional markets gives insight into global market conditions. In
addition, the difference between the price of the front month and twelfth month futures contracts is
one way to measure current market tightness relative to expectations for the coming year. A positive
difference, referred to as backwardation, indicates tightness in the current market, while a negative
difference, called contango, indicates a looser supply-demand balance and encourages stock building.
Historical volatility is an empirical measure of the magnitude of price movements in a past time period.
Implied volatility represents the market’s expectation about the magnitude of future price movements
and is calculated based on option prices.
The put-call ratio is another measure of market sentiment, which is calculated by dividing the total
number of put option contracts by the number of call option contracts. If market participants are
concerned about prices rising in the future, they would tend to purchase more call options, which would
reduce the put-call ratio. However, one important limitation regarding this data is that most forward
transactions take place outside of organized exchanges. On-exchange contract volumes are not
necessarily indicative of developments in the broader marketplace.
Additional information can be provided by the volatility skew, which is constructed by graphing the
implied volatility against option strike prices. The skew provides an indication of the concerns that
market participants have about large upward or downward future price movements.
Data from options trading in futures markets can also be used to calculate the probability that a futures
contract will expire above specified price levels. Both the volatility skew and the probability calculations
for crude oil presented in this report use data from WTI options trading, which is a much more active
market than options trading for Brent. As futures and options contracts get closer to expiration,
changes in the probabilities of exceeding different price levels can be dominated by relatively small
changes in the time to expiration. In order to avoid this, EIA performs this probability calculation on
futures contracts that expire within the next 2 to 5 months at time of publication of this report.
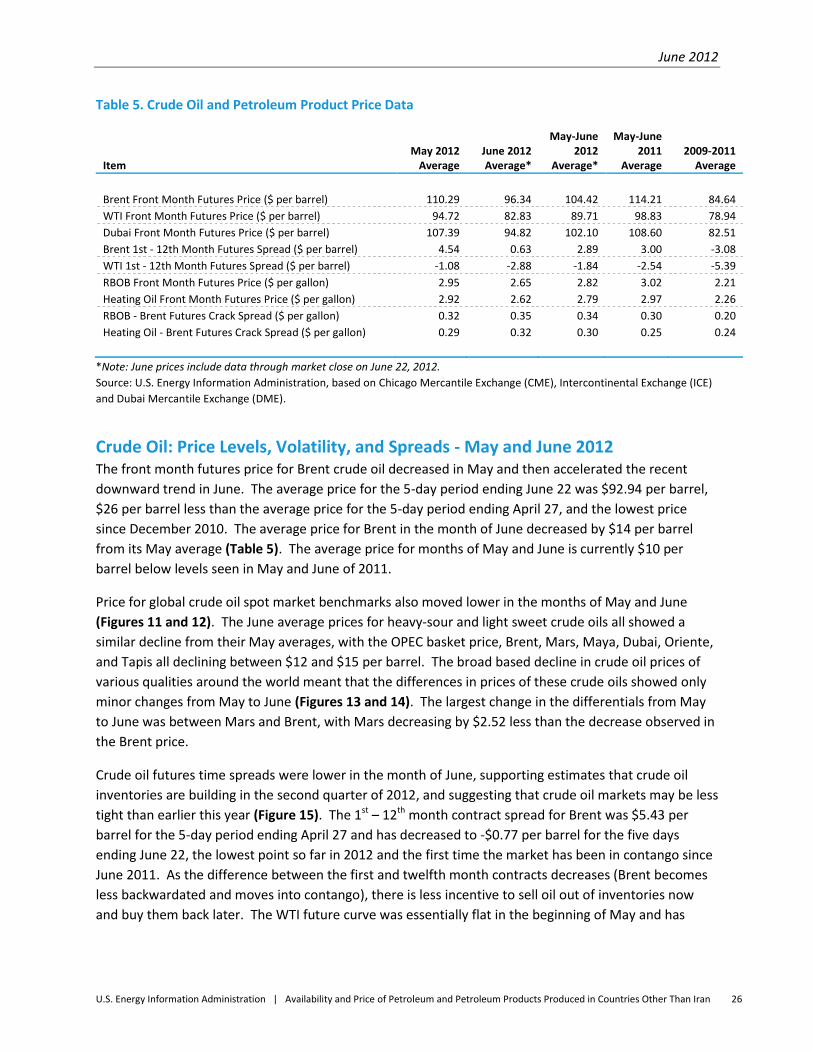
June 2012
U.S. Energy Information Administration | Availability and Price of Petroleum and Petroleum Products Produced in Countries Other Than Iran 26
Table 5. Crude Oil and Petroleum Product Price Data
Item May 2012
Average June 2012 Average*
May-June 2012
Average*
May-June 2011
Average 2009-2011
Average
Brent Front Month Futures Price ($ per barrel) 110.29 96.34 104.42 114.21 84.64
WTI Front Month Futures Price ($ per barrel) 94.72 82.83 89.71 98.83 78.94
Dubai Front Month Futures Price ($ per barrel) 107.39 94.82 102.10 108.60 82.51
Brent 1st - 12th Month Futures Spread ($ per barrel) 4.54 0.63 2.89 3.00 -3.08
WTI 1st - 12th Month Futures Spread ($ per barrel) -1.08 -2.88 -1.84 -2.54 -5.39
RBOB Front Month Futures Price ($ per gallon) 2.95 2.65 2.82 3.02 2.21
Heating Oil Front Month Futures Price ($ per gallon) 2.92 2.62 2.79 2.97 2.26
RBOB - Brent Futures Crack Spread ($ per gallon) 0.32 0.35 0.34 0.30 0.20
Heating Oil - Brent Futures Crack Spread ($ per gallon) 0.29 0.32 0.30 0.25 0.24
*Note: June prices include data through market close on June 22, 2012.
Source: U.S. Energy Information Administration, based on Chicago Mercantile Exchange (CME), Intercontinental Exchange (ICE)
and Dubai Mercantile Exchange (DME).
Crude Oil: Price Levels, Volatility, and Spreads - May and June 2012 The front month futures price for Brent crude oil decreased in May and then accelerated the recent
downward trend in June. The average price for the 5-day period ending June 22 was $92.94 per barrel,
$26 per barrel less than the average price for the 5-day period ending April 27, and the lowest price
since December 2010. The average price for Brent in the month of June decreased by $14 per barrel
from its May average (Table 5). The average price for months of May and June is currently $10 per
barrel below levels seen in May and June of 2011.
Price for global crude oil spot market benchmarks also moved lower in the months of May and June
(Figures 11 and 12). The June average prices for heavy-sour and light sweet crude oils all showed a
similar decline from their May averages, with the OPEC basket price, Brent, Mars, Maya, Dubai, Oriente,
and Tapis all declining between $12 and $15 per barrel. The broad based decline in crude oil prices of
various qualities around the world meant that the differences in prices of these crude oils showed only
minor changes from May to June (Figures 13 and 14). The largest change in the differentials from May
to June was between Mars and Brent, with Mars decreasing by $2.52 less than the decrease observed in
the Brent price.
Crude oil futures time spreads were lower in the month of June, supporting estimates that crude oil
inventories are building in the second quarter of 2012, and suggesting that crude oil markets may be less
tight than earlier this year (Figure 15). The 1st – 12th month contract spread for Brent was $5.43 per
barrel for the 5-day period ending April 27 and has decreased to -$0.77 per barrel for the five days
ending June 22, the lowest point so far in 2012 and the first time the market has been in contango since
June 2011. As the difference between the first and twelfth month contracts decreases (Brent becomes
less backwardated and moves into contango), there is less incentive to sell oil out of inventories now
and buy them back later. The WTI future curve was essentially flat in the beginning of May and has

June 2012
U.S. Energy Information Administration | Availability and Price of Petroleum and Petroleum Products Produced in Countries Other Than Iran 27
since moved into contango as the 1st – 12th month contract spread is -$3 per barrel for the 5-day period
ending June 22.
Implied volatility for the front month WTI futures contract has increased for the majority of time during
May and June (Figure 16). For the 5-day period ending June 22, implied volatility averaged 32.4 percent.
Recent daily price movements in crude oil futures prices for WTI and Brent have pushed historical
volatility for these two benchmarks higher. Historical volatility, calculated from daily changes in price
over the previous 30 trading days, for WTI and Brent is 25.6 and 26.3 percent, respectively, as of June
22.
The put-call ratio has increased from 0.78 on April 27 to 0.85 on June 22 as traders purchased more put
options, which can be used to hedge against or profit from decreases in the price of WTI, relative to call
options over the last two months (Figure 18). A review of changes in the volatility skew for the
September futures contract over the last two months shows that implied volatility has increased for all
options strike prices but that implied volatility has increased more for out-of-the-money put options
(Figure 19). This reflects a market belief that although the chance of crude oil prices moving either up or
down between now and September has increased since April 27, the larger increase in premiums for put
options suggests there is a larger concern for downward price movements compared to market
conditions on April 27.
For the five days ending June 22, the average price of the September 2012 WTI crude oil futures
contract was $81.83 per barrel and the average price of the September 2012 Brent contract was $93.17
per barrel. The WTI and Brent prices for the 5-day average ending June 22 for the September 2012
contract have decreased by about $23 per barrel and $25 per barrel, respectively, since April 27. Based
on implied volatilities calculated from options and futures prices over the 5 days ending June 22, the
probability of the September 2012 WTI futures contract expiring above $100 per barrel is 6 percent, a
decrease of 55 percentage points from the same calculation made using price data from the 5-day
period ending April 27 (Figure 20). Given the higher absolute level of Brent prices relative to WTI prices
over the last two months, the probabilities that the September Brent contract will exceed specified
dollar thresholds are higher.

June 2012
U.S. Energy Information Administration | Availability and Price of Petroleum and Petroleum Products Produced in Countries Other Than Iran 28
Figure 11. Global Crude Oil Spot Prices
Note: All prices represent rolling 5-day averages.
Source: U.S. Energy Information Administration, based on Bloomberg, L.P.
Figure 12. Global Crude Oil Spot Price Averages
Source: U.S. Energy Information Administration, based on Bloomberg, L.P.
80
90
100
110
120
130
140
12/28/2011 2/10/2012 3/25/2012 5/8/2012 6/21/2012
Brent Mars
Maya Tapis
Dubai Oriente
dollars per barrel
0
20
40
60
80
100
120
140
160
Brent (North Sea)
OPEC crude oil basket
Mars (United States)
Maya (Mexico)
Tapis (Malaysia)
Dubai (UAE)
Oriente (Ecuador)
May and June 2011 average May 2012 average June 2012 average
spot price (dollars per barrel)

June 2012
U.S. Energy Information Administration | Availability and Price of Petroleum and Petroleum Products Produced in Countries Other Than Iran 29
Figure 13. Global Crude Oil Spot Price Differentials
Note: All prices represent rolling 5-day averages.
Source: U.S. Energy Information Administration, based on Bloomberg, L.P.
Figure 14. Global Crude Oil Spot Price Differential Averages
Source: U.S. Energy Information Administration, based on Bloomberg, L.P.
-10
-5
0
5
10
15
12/28/2011 2/10/2012 3/25/2012 5/8/2012 6/21/2012
Mars - Brent spread Oriente - Maya spread Tapis - Brent spread Dubai - Mars spread
dollars per barrel
-10
-5
0
5
10
OPEC basket - Brent
Mars - Brent Oriente - Maya Tapis - Brent Dubai - Mars
May and June 2011 average
May 2012 average
June 2012 average
spot price difference (dollars per barrel)

June 2012
U.S. Energy Information Administration | Availability and Price of Petroleum and Petroleum Products Produced in Countries Other Than Iran 30
Figure 15. Crude Oil 1st - 12th Month Futures Price Spread
Note: All prices represent rolling 5-day averages.
Source: U.S. Energy Information Administration, based on Chicago Mercantile Exchange (CME) and Intercontinental Exchange
(ICE).
Figure 16. Crude Oil Historical and Implied Volatility
Note: Historical volatility is shown as a 30-day rolling average. Implied volatility is a 5-day rolling average.
Source: U.S. Energy Information Administration, based on Chicago Mercantile Exchange (CME) and Intercontinental Exchange
(ICE).
-6
-4
-2
0
2
4
6
8
10
12/28/2011 2/10/2012 3/25/2012 5/8/2012 6/21/2012
Brent
WTI
dollars per barrel
10
20
30
40
50
12/28/2011 2/10/2012 3/25/2012 5/8/2012 6/21/2012
WTI front month implied volatility
WTI historical 30 day volatility
Brent historical 30 day volatility
annualized percent
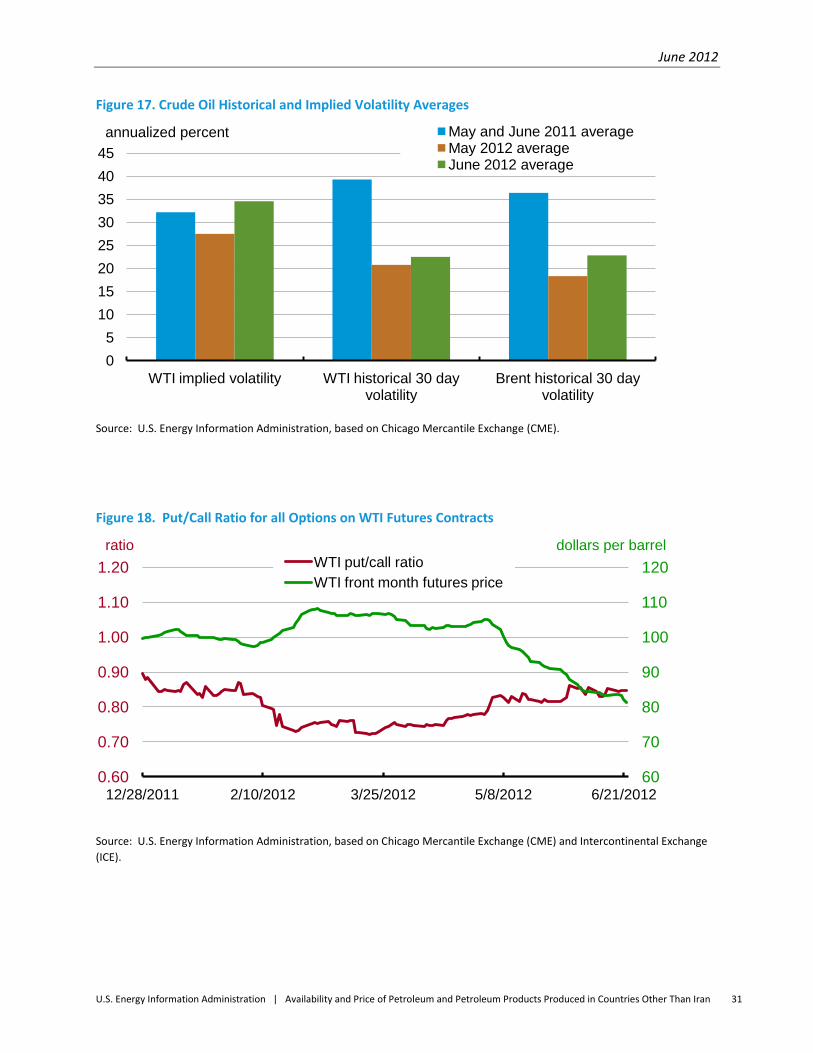
June 2012
U.S. Energy Information Administration | Availability and Price of Petroleum and Petroleum Products Produced in Countries Other Than Iran 31
Figure 17. Crude Oil Historical and Implied Volatility Averages
Source: U.S. Energy Information Administration, based on Chicago Mercantile Exchange (CME).
Figure 18. Put/Call Ratio for all Options on WTI Futures Contracts
Source: U.S. Energy Information Administration, based on Chicago Mercantile Exchange (CME) and Intercontinental Exchange
(ICE).
0
5
10
15
20
25
30
35
40
45
WTI implied volatility WTI historical 30 day volatility
Brent historical 30 day volatility
May and June 2011 average May 2012 average June 2012 average
annualized percent
60
70
80
90
100
110
120
0.60
0.70
0.80
0.90
1.00
1.10
1.20
12/28/2011 2/10/2012 3/25/2012 5/8/2012 6/21/2012
WTI put/call ratio
WTI front month futures price
dollars per barrel ratio
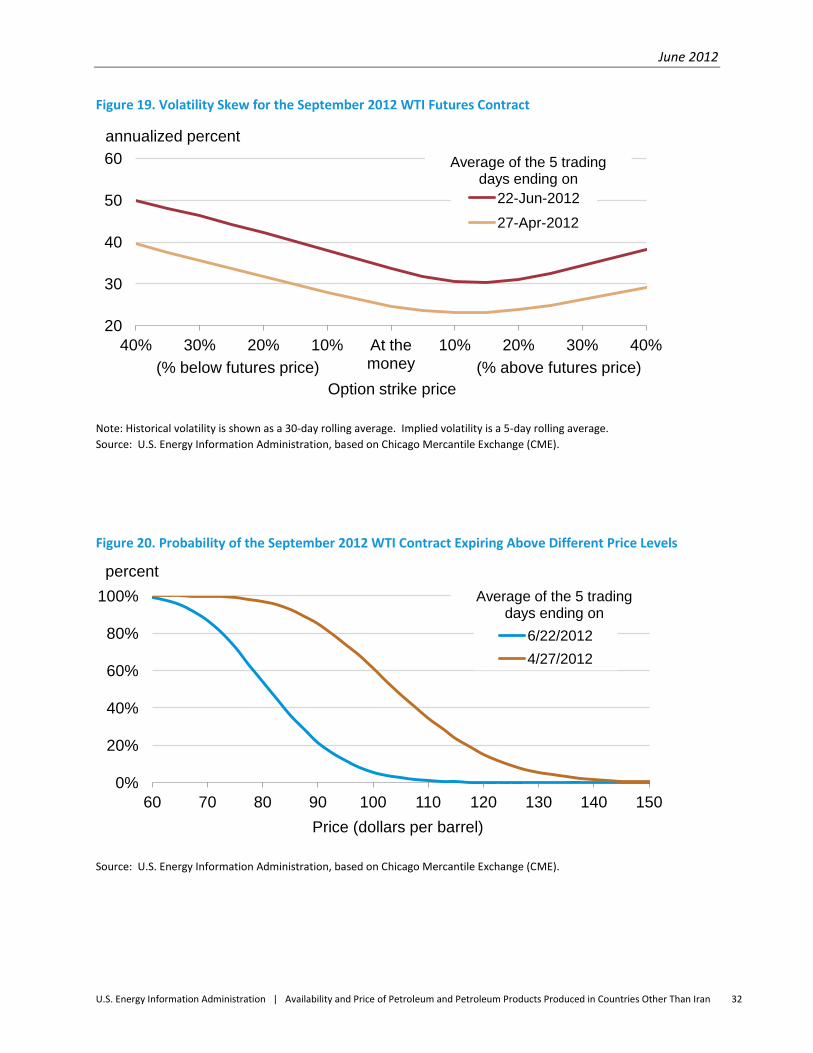
June 2012
U.S. Energy Information Administration | Availability and Price of Petroleum and Petroleum Products Produced in Countries Other Than Iran 32
Figure 19. Volatility Skew for the September 2012 WTI Futures Contract
Note: Historical volatility is shown as a 30-day rolling average. Implied volatility is a 5-day rolling average.
Source: U.S. Energy Information Administration, based on Chicago Mercantile Exchange (CME).
Figure 20. Probability of the September 2012 WTI Contract Expiring Above Different Price Levels
Source: U.S. Energy Information Administration, based on Chicago Mercantile Exchange (CME).
20
30
40
50
60
40% 30% 20% 10% At the money
10% 20% 30% 40%
22-Jun-2012
27-Apr-2012
annualized percent
Option strike price
Average of the 5 trading days ending on
(% below futures price) (% above futures price)
0%
20%
40%
60%
80%
100%
60 70 80 90 100 110 120 130 140 150
Price (dollars per barrel)
6/22/2012
4/27/2012
percent Average of the 5 trading
days ending on
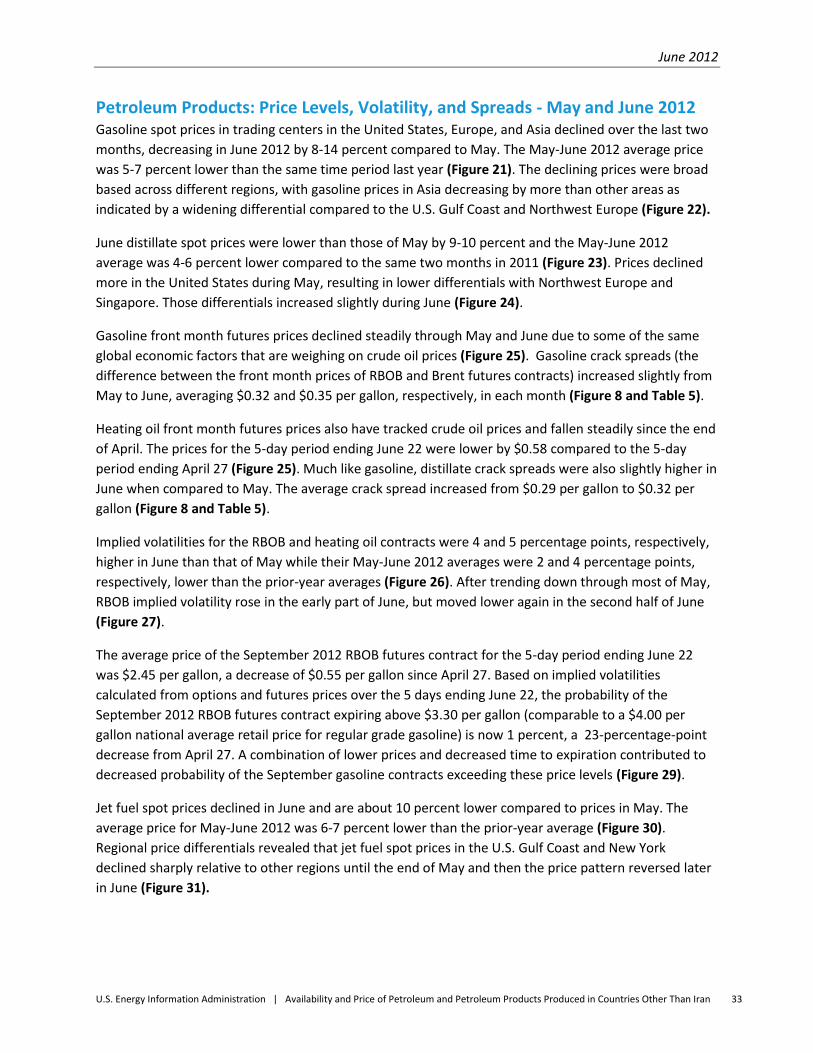
June 2012
U.S. Energy Information Administration | Availability and Price of Petroleum and Petroleum Products Produced in Countries Other Than Iran 33
Petroleum Products: Price Levels, Volatility, and Spreads - May and June 2012 Gasoline spot prices in trading centers in the United States, Europe, and Asia declined over the last two
months, decreasing in June 2012 by 8-14 percent compared to May. The May-June 2012 average price
was 5-7 percent lower than the same time period last year (Figure 21). The declining prices were broad
based across different regions, with gasoline prices in Asia decreasing by more than other areas as
indicated by a widening differential compared to the U.S. Gulf Coast and Northwest Europe (Figure 22).
June distillate spot prices were lower than those of May by 9-10 percent and the May-June 2012
average was 4-6 percent lower compared to the same two months in 2011 (Figure 23). Prices declined
more in the United States during May, resulting in lower differentials with Northwest Europe and
Singapore. Those differentials increased slightly during June (Figure 24).
Gasoline front month futures prices declined steadily through May and June due to some of the same
global economic factors that are weighing on crude oil prices (Figure 25). Gasoline crack spreads (the
difference between the front month prices of RBOB and Brent futures contracts) increased slightly from
May to June, averaging $0.32 and $0.35 per gallon, respectively, in each month (Figure 8 and Table 5).
Heating oil front month futures prices also have tracked crude oil prices and fallen steadily since the end
of April. The prices for the 5-day period ending June 22 were lower by $0.58 compared to the 5-day
period ending April 27 (Figure 25). Much like gasoline, distillate crack spreads were also slightly higher in
June when compared to May. The average crack spread increased from $0.29 per gallon to $0.32 per
gallon (Figure 8 and Table 5).
Implied volatilities for the RBOB and heating oil contracts were 4 and 5 percentage points, respectively,
higher in June than that of May while their May-June 2012 averages were 2 and 4 percentage points,
respectively, lower than the prior-year averages (Figure 26). After trending down through most of May,
RBOB implied volatility rose in the early part of June, but moved lower again in the second half of June
(Figure 27).
The average price of the September 2012 RBOB futures contract for the 5-day period ending June 22
was $2.45 per gallon, a decrease of $0.55 per gallon since April 27. Based on implied volatilities
calculated from options and futures prices over the 5 days ending June 22, the probability of the
September 2012 RBOB futures contract expiring above $3.30 per gallon (comparable to a $4.00 per
gallon national average retail price for regular grade gasoline) is now 1 percent, a 23-percentage-point
decrease from April 27. A combination of lower prices and decreased time to expiration contributed to
decreased probability of the September gasoline contracts exceeding these price levels (Figure 29).
Jet fuel spot prices declined in June and are about 10 percent lower compared to prices in May. The
average price for May-June 2012 was 6-7 percent lower than the prior-year average (Figure 30).
Regional price differentials revealed that jet fuel spot prices in the U.S. Gulf Coast and New York
declined sharply relative to other regions until the end of May and then the price pattern reversed later
in June (Figure 31).

June 2012
U.S. Energy Information Administration | Availability and Price of Petroleum and Petroleum Products Produced in Countries Other Than Iran 34
Figure 21. Global Gasoline Spot Price Averages
Source: U.S. Energy Information Administration, based on Bloomberg, L.P.
Figure 22. Global Gasoline Spot Price Differentials
Note: All prices represent rolling 5-day averages.
Source: U.S. Energy Information Administration, based on Bloomberg, L.P.
2.40
2.50
2.60
2.70
2.80
2.90
3.00
3.10
3.20
RBOB87 New York Harbor
RBOB87 U.S. Gulf Coast
Eurobob85 NW Europe
Gasoline92 Singapore
May and June 2011 average May 2012 average June 2012 average
spot price (dollars per gallon)
-0.30
-0.20
-0.10
0.00
0.10
0.20
0.30
0.40
12/28/2011 2/10/2012 3/25/2012 5/8/2012 6/21/2012
New York - NW Europe U.S. Gulf Coast - NW Europe U.S. Gulf Coast - Singapore NW Europe - Singapore
dollars per gallon

June 2012
U.S. Energy Information Administration | Availability and Price of Petroleum and Petroleum Products Produced in Countries Other Than Iran 35
Figure 23. Global Distillate Spot Price Averages
Source: U.S. Energy Information Administration, based on Bloomberg, L.P.
Figure 24. Global Distillate Spot Price Differentials
Note: All prices represent rolling 5-day averages.
Source: U.S. Energy Information Administration, based on Bloomberg, L.P.
0.00
0.75
1.50
2.25
3.00
3.75
Distillate New York Harbor
Distillate U.S. Gulf Coast
Gasoil NW Europe Gasoil Singapore
May and June 2011 average
May 2012 average
June 2012 average
spot price (dollars per gallon)
-0.20
-0.10
0.00
0.10
0.20
12/28/2011 2/10/2012 3/25/2012 5/8/2012 6/21/2012
New York - NW Europe U.S. Gulf Coast - NW Europe U.S. Gulf Coast - Singapore NW Europe - Singapore
dollars per gallon

June 2012
U.S. Energy Information Administration | Availability and Price of Petroleum and Petroleum Products Produced in Countries Other Than Iran 36
Figure 25. Front Month RBOB Gasoline and Heating Oil Futures Prices
Note: All prices represent rolling 5-day averages.
Source: U.S. Energy Information Administration, based on Chicago Mercantile Exchange (CME).
Figure 26. Front Month Gasoline and Heating Oil Futures Volatility
Source: U.S. Energy Information Administration, based on Chicago Mercantile Exchange (CME).
2.40
2.60
2.80
3.00
3.20
3.40
3.60
12/28/2011 2/10/2012 3/25/2012 5/8/2012 6/21/2012
RBOB front month futures price Heating Oil front month futures price
dollars per gallon
0
5
10
15
20
25
30
35
40
45
RBOB implied volatility
RBOB historical 30 day volatility
Heating Oil implied volatility
Heating Oil historical 30 day volatility
May and June 2011 average May 2012 average June 2012 average
annualized percent
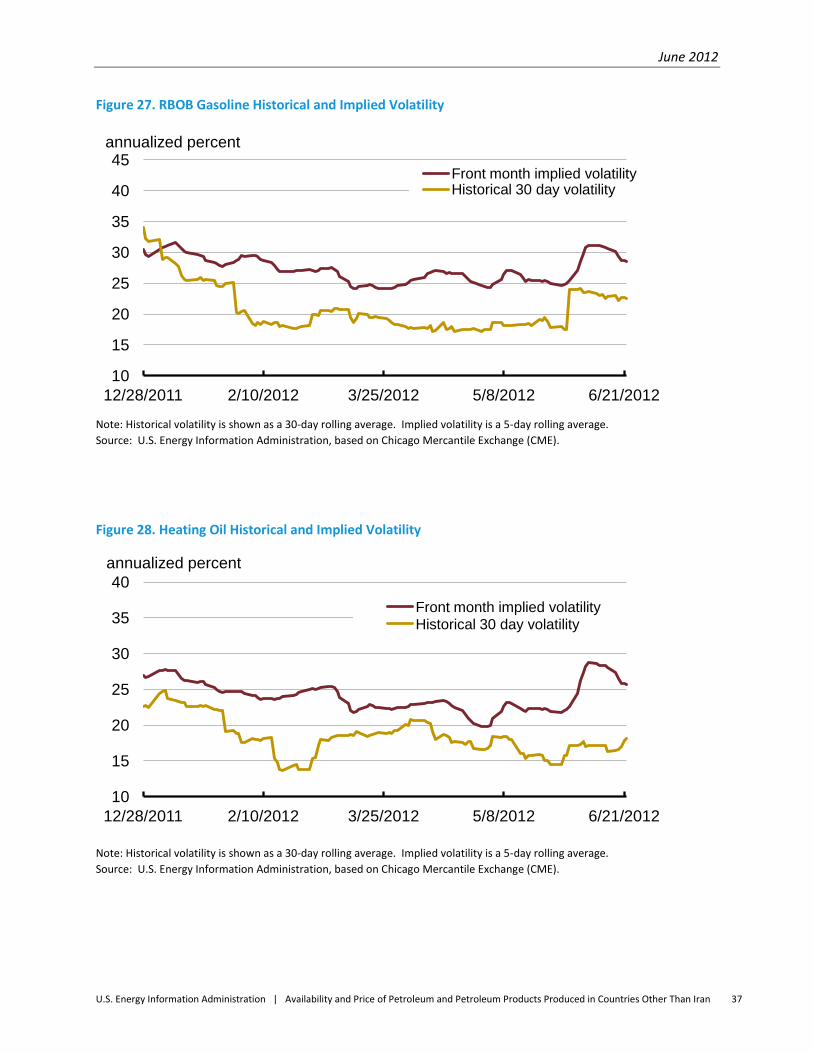
June 2012
U.S. Energy Information Administration | Availability and Price of Petroleum and Petroleum Products Produced in Countries Other Than Iran 37
Figure 27. RBOB Gasoline Historical and Implied Volatility
Note: Historical volatility is shown as a 30-day rolling average. Implied volatility is a 5-day rolling average.
Source: U.S. Energy Information Administration, based on Chicago Mercantile Exchange (CME).
Figure 28. Heating Oil Historical and Implied Volatility
Note: Historical volatility is shown as a 30-day rolling average. Implied volatility is a 5-day rolling average.
Source: U.S. Energy Information Administration, based on Chicago Mercantile Exchange (CME).
10
15
20
25
30
35
40
45
12/28/2011 2/10/2012 3/25/2012 5/8/2012 6/21/2012
Front month implied volatility Historical 30 day volatility
annualized percent
10
15
20
25
30
35
40
12/28/2011 2/10/2012 3/25/2012 5/8/2012 6/21/2012
Front month implied volatility Historical 30 day volatility
annualized percent

June 2012
U.S. Energy Information Administration | Availability and Price of Petroleum and Petroleum Products Produced in Countries Other Than Iran 38
Figure 29. Probability of September 2012 Retail Gasoline Exceeding Different Price Levels at Expiration
Source: U.S. Energy Information Administration, based on Chicago Mercantile Exchange (CME).
Figure 30. Global Jet Fuel Spot Price Averages
Source: U.S. Energy Information Administration, based on Bloomberg, L.P.
0%
20%
40%
60%
80%
100%
2.00 2.50 3.00 3.50 4.00 4.50 5.00
Price (dollars per gallon)
6/22/2012
4/27/2012
percent
Average of the 5 trading days ending on
0.00
0.75
1.50
2.25
3.00
3.75
Jet Fuel New York Harbor
Jet Fuel U.S. Gulf Coast
Jet Fuel NW Europe
Jet Fuel Singapore
May and June 2011 average May 2012 average June 2012 average
spot price (dollars per gallon)

June 2012
U.S. Energy Information Administration | Availability and Price of Petroleum and Petroleum Products Produced in Countries Other Than Iran 39
Figure 31. Global Jet Fuel Spot Price Differentials
Note: All prices represent rolling 5-day averages.
Source: U.S. Energy Information Administration, based on Bloomberg, L.P.
-0.20
-0.10
0.00
0.10
0.20
12/28/2011 2/10/2012 3/25/2012 5/8/2012 6/21/2012
New York - NW Europe U.S. Gulf Coast - NW Europe U.S. Gulf Coast - Singapore NW Europe - Singapore
dollars per gallon