U.S. DEPARTMENT OF THE INTERIOR U.S. … · GENERATION OF MAGMAS OF THE PIONEER BATHOLITH A...
70
U.S. DEPARTMENT OF THE INTERIOR U.S. GEOLOGICAL SURVEY GENERATION OF MAGMAS OF THE PIONEER BATHOLITH A GEOLOGICALLY CONSTRAINED THERMAL MODEL by E-an Zen U.S. Geological Survey I/ Open-File Report 96-98 This report is preliminary and has not been reviewed for conformity with U.S. Geological Survey editorial standards (but has been reviewed for conformity with the North American Stratigraphic Code). Any use of trade, product, or firm names is for description purposes only and does not imply endorsement by the U.S. Government. _!/ Present address: Department of Geology, University of Maryland, College Park, Maryland 20742
Transcript of U.S. DEPARTMENT OF THE INTERIOR U.S. … · GENERATION OF MAGMAS OF THE PIONEER BATHOLITH A...

U.S. DEPARTMENT OF THE INTERIOR
U.S. GEOLOGICAL SURVEY
GENERATION OF MAGMAS OF THE PIONEER BATHOLITH
A GEOLOGICALLY CONSTRAINED THERMAL MODEL
by
E-an Zen
U.S. Geological Survey I/
Open-File Report 96-98
This report is preliminary and has not been reviewed for conformity with U.S. Geological Survey editorial standards (but has been reviewed for conformity with the North American Stratigraphic Code). Any use of trade, product, or firm names is for description purposes only and does not imply endorsement by the U.S. Government.
_!/ Present address: Department of Geology, University of Maryland, College Park, Maryland 20742

TABLE OF CONTENTS
INTRODUCTION 4
ACKNOWLEDGMENTS 6
TECTONIC FRAMEWORK 6
Tectonic Framework for the Pioneer Mountains 6Age and Timing of Tectonism 8Depth of Burial 9Decompression Rate 11
MODELLING; CONSTRAINTS FROM PETROLOGICAL DATA 13
Inferred Nature of the Source Rock 13
Petrographic Information 13Initial Strontium Isotope Ratios 14Lead Isotope Data 15Oxygen Isotope Data 17Some Preliminary Inferences 17
Observed Petrologic Relations 20
MODELLING: CONSTRAINTS FROM ENERGY CONSIDERATIONS 21
Mode of Energy Transport into the Zone of Anatexis 21
Crustal Heat Productivity 22
Redistribution of U, Th and K During Crustal Anatexis 23
SELECTION OF MODEL PARAMETERS 26
Variables, Mainly Tectonic 26
Decompression Rate 26Thrust Advance Rate 26
Variables, Mainly Thermal 27
Depth to the Interface of Thermal Perturbation 27Incubation Period 28Source Rock Heat Productivity 29Estimating the Paleo-Subcrustal Heat Flux 31Estimating the Peclet Number 33Thermal Conductivity 33Site-specific Thermal Parameters 34
Variables, Mainly Concerning Melting Properties 34
Summary of Modelling Procedure 35
MODEL RESULTS 37

FURTHER CONCLUSIONS FROM MODEL RESULTS 39
Subduction versus Mantle Upwelling 39
Significance of the Initial Strontium Ratio Values 40
REFERENCES CITED 42
TABLE CAPTIONS 48
TABLE 1 Models for cooling of plutons at WPRS 49
TABLE 2 Model ages of Source Terranes 50
TABLE 3 Parameters Used in Thermal Modelling and Results 51
TABLE 4 U and Th Contents of Southwest Montana GraniticRocks and Some Comparisons 56
TABLE 5 K2O, U, and Th Contents and Heat Productivityof Pioneer Batholith Rocks 57
FIGURE CAPTIONS 58
Figure 1 Index Map 60
Figure 2 Schematics of Tectonic Events 61
Figure 3 Nominal Cooling History as Functionof Depth of Intrusion 62
Figure 4 SiO2 vs. Th and U Contents 63
Figure 5 Th, U, vs. K2O Contents 64
Figure 6 Wt % SiO2 vs K2O/(K2O+Na2O) 65
Figure 7 SiO2 and K2O vs Heat Productivity 66
Figure 8 Possible distributions of heat productivitywith depth 67
Figure 9 Temperarature Evolution for Model Runs 68

INTRODUCTION
The petrologically complex Pioneer batholith of southwestern
Montana is located several hundred kilometers from the
contemporaneous edge of the North American craton, and was emplaced
during the waning stages of the Late Cretaceous Laramide orogeny.
The Pioneer batholith is one of a group of batholiths the
Philipsburg, the Tobacco Roots, the Sapphire, the Flint Creek, and
the large Boulder batholiths in southwestern Montana that bear
similar geological, age, and petrological stamps. In a setting of
comparative crustal stability, identification of a feasible source
of energy for the generation of voluminous magmas is a problem.
Could heating that resulted from supracrustal thickening by
thrusting (Zen, 1988a; Patifio-Douce and others, 1990) be the cause
of anatexis, or would some other cause be required by the physical,
chemical, and field-based geological and geochronological
constraints? The present study attempts to explore the plausible
thermal causes for the plutonic rocks by one-dimensional thermal
modelling, using the general approach of Zen (1988a), but with model
parameters constrained by field stratigraphic and tectonic relations
as well as by actual chemical, age, and isotopic data that point to
the nature of the source rocks for the magmas.
One-dimensional thermal models have severe limitations because
lateral mass and energy transfer cannot be treated and because
tectonic and intrusive events must be considered as instantaneous
without possibility of premonitory or follow-up effects.
Fortunately, the Pioneer batholith developed on the stable craton,
and the known Cretaceous events can be reasonably assigned to en
bloc vertical motion and to the emplacement of thrust sheets, both
of which, at least on a local scale, can be treated as one-
dimensional problems.
I will first summarize the geological setting of the Pioneer
batholith and next infer, from chemical and petrological data, the
nature and thermal properties of the source terranes. I will then
deduce values of variables to be used in modelling, such as uplift
rates, the nature and number of thrust sheets, and relative timing
of thrust emplacement and intrusion. I will present model results
using reasonable input parameters and will suggest some constraints
on the thermal history leading to the formation of the batholith. I
will argue that shallow subduction cannot cause adequate melting in
any reasonable time frame; upwelling of lithospheric mantle material
is needed even to generate an amount of magma barely adequate to
account for the batholith. Moreover, I will show that the physical
properties of the system are such that the tectonic trigger of the
anatectic event must have preceded the intrusion by several tens of
millions of years. This requirement of a significant time lag
between the triggering tectonism and magmatic events at shallow
crustal levels applies to all regional geologic syntheses that
include crustal derivation of magmas through conductive heating.
Modelling a real geological event by computer is akin to
depicting a wild animal in a stylized frieze. The artist must first
study minutely the anatomy and locomotion of the animal in its
natural setting. Although such mastery does not ensure that he will
capture the animation of a diving eagle or a racing cheetah, without
careful field observation the frieze can never be better than a
caricature. The viewer will have to judge how well I have
succeeded.
ACKNOLEDGMENTS
I thank Simon Peacock, Mike Ryan, and especially Ralph Haugerud
for discussions of the pitfalls and promises awaiting thermal
modellers. Discussions of igneous petrogenesis over the years with
Joe Arth, Fred Barker, Paul Bateman, Zell Peterman, Frank Spera, Bob
Tilling, Pete Toulmin, and Pete Wyllie have been instructive.
Barney Berger, Larry Snee, and Jane Hammarstrom have been fellow
travellers in my study of the Pioneer batholith, and I thank them
for their discussions, help, and unfailing kindnesses. Thorough and
constructive reviews by Bob Tilling and Ralph Haugerud have greatly
improved this paper; Haugerud suggested backarc spreading as an
alternative to subduction as the source of heating. I acknowledge
their help with gratitude.
This manuscript was prepared in 1988-89; decision to place the
report in the public domain through the medium of the Open-File
Report came late. I have made no attempt to bring the data and
interpretation current; however, I refer to reader to a published
paper that is in many ways a summary of the information and ideas
contained in this paper (Zen, 1992).
TECTONIC FRAMEWORK
Tectonic Framework for the Pioneer Mountains
The east and west branches of the Pioneer Mountains are
separated by the aligned valleys of Wise River and Grasshopper Creek
(Figure 1). A short distance east of the valley floor, the Fourth

of July high-angle normal fault downdropped the west side by several
kilometers (and may have produced the graben valley of Wise River).
This fault is the real tectonic boundary; however, for convenience I
will use the physiographic terms to refer to the two tectonic blocks
in the ensuing discussion. Though the two blocks have somewhat
different histories, they are tectonically related; thermal
modelling must consider their shared as well as distinct geology and
chronology.
In the west Pioneer Mountains, two allochthonous sheets of
Proterozoic sedimentary rocks have been thrust over the Phanerozoic
rocks (the higher, Pattengail thrust sheet, PT, and the lower, Wise
River thrust sheet, WRT, Figures 1 and 2) . In the east Pioneer
Mountains, only the Wise River thrust sheet is recognized (Zen,
1988b). Thus, rocks underlying the thrust sheets in the west
Pioneers were tectonically buried deeper; because the thrust sheets
were westerly derived, this tectonic burial also began earlier. The
largest known pluton in the batholith, the Late Cretaceous Uphill
Creek Granodiorite, spans both branches of the Pioneer Mountains
(Snee, 1982). If, as is assumed, the pluton intruded the two parts
simultaneously, then the time period of thermal relaxation between
thrusting and plutonism, prior to regional uplift leading to the
exhumation of the pluton in the Oligocene (Zen, 1988b), would be
longer in the west Pioneers than in the east Pioneers. This timing
difference has significant thermal consequences.
Two reference sites, called the West Pioneer Reference Site
(WPRS) and the East Pioneer Reference Site (EPRS) (see below), were
chosen to model the disparate thermal histories.
Age and Timing of Tectonism
In the east Pioneers, the Wise River thrust sheet predates the
well-dated 72-Ma Uphill Creek Granodiorite and Grayling Lake Granite
(Zen, 1988b; Myers, 1952; Sharp, 1970; Snee, 1978; for ages, see
Marvin and others, 1983; Snee, 1982; Zen and others, 1975). Along
the Wise River, the Stine Creek pluton, having a biotite 40Ar- 9Ar
spectrum age of 74.8 Ma and a biotite K-Ar age of 72.6 Ma (Zen,
1988b; Marvin and others, 1983), cuts the Wise River thrust west of
the Fourth of July fault.
At least in the area of immediate interest, the emplacement of
the Wise River sheet terminated the deposition of the uppermost
Cretaceous sediments that was previously referred to as the Colorado
Group (Zen, 1988b) but that will be denoted in this study as the
undifferentiated Upper Cretaceous Fluviatile Sedimentary Rocks,
UKFS. These sediments do not contain detritus that could be
attributed to the allochthon; conglomerates that could be derived
from the thrust sheets are stratigraphically higher (Zen, 1988b).
Thus, the younger age limit of the pre-thrust sedimentary rocks is
critical in dating the arrival of the thrust sheets.
In the uppermost recognized part of UKFS, palynomorphs were
found in shale beds that indicated a middle Campanian to
Maastrichtian age. Palmer (1983) gave the range of the Campanian
Stage as 84.0-74.5+4 Ma, so that "middle Campanian" should be about
80 Ma. These ages are to be compared with the igneous ages of 72-75
Ma, given above. As both the radiometric ages and the palynomorphic
determination may have an uncertainty of +5 m.y., the time gap

between the end of UKFS sedimentation and the intrusion cutting at
least the Wise River thrust is no more than 10 m.y.. The thrusting
event must fit within this gap, and its thermal role must be
evaluated within this framework.
The Keokirk Quartz Diorite, a small pluton related to the main
granodiorites of the batholith by identical initial strontium ratios
(Arth and others, 1986), was emplaced at about 80 Ma, thus
presumably during deposition of UKFS. The Keokirk, at the present
level of exposure, cuts strata as young as late Paleozoic and
stratigraphically about 3 km below the top of UKFS, so it is a very
shallow intrusion. Clearly, the thrusting event was not the cause
of the magma genesis, even though the thrust sheets, by thickening
the crust by some 6-16 km, would have provided an extra, late-stage
boost of heating for a region already undergoing fusion.
Depth of Burial
Snee (1982) first proposed that the west Pioneers were buried
deeper than the east Pioneers from consideration of 40Ar-39Ar
spectra data. Snee found that the Uphill Creek Granodiorite near
Odell Mountain (the West Pioneer Reference Site, WPRS; Figure 1)
gave a hornblende argon spectrum age older than the biotite argon
spectrum age by 3.9 m.y.. In the Browne's Lake area (the East
Pioneer Reference Site, EPRS; Figure 1), however, the same mineral
pair from the same pluton gave a spectrum discordance of only 1.5
m.y. Intermediate discrepancies characterize the plutons between
these sites. Snee (1982) interpreted the data in terms of the
depth-dependence of the time needed to cool the rocks in each area
through the range of closure temperatures for argon diffusion in

hornblende (about 540°C) and in biotite (about 280°C). Snee's depth
estimates assumed a linear correlation between depth and the time it
took to cool the rocks through the indicated temperature interval.
Taking the emplacement depth at EPRS to be 3 km, Snee estimated that
the pluton now exposed at WPRS was emplaced at a depth of 8 km.
However, the method is sensitive to the reference depth chosen; if
the emplacement depth at EPRS is taken to be 4 km, Snee's method
would then predict WPRS to have been 11 km deep.
I tested Snee's estimate through a series of subsidiary thermal
models. To make geologically useful comparisons of the apparent
argon spectral ages (~thk_bt) , we must take into account the
distance of the sample to its country-rock contact because, other
factors being equal, a sample originally located well within the
pluton would cool more slowly than one located near the contact.
WPRS and EPRS are selected partly because both are situated about
0.5 km from their exposed country rock contacts. In my model
calculations, I assumed a magma body 10 km thick, intruded
instantaneously at 800°C into a static crust (i.e., no uplift) to
produce a roof at a specified depth. I then examined the time
required to cool from 540+20°C to 280+40°C. Figure 3 gives the
calculated cooling curve ("^hb-bt vs. depth to roof) , along with
Snee's linear model for two depths of EPRS, at 3 and at 4 km.
The model computation assumes that heat loss was by conduction;
if convective cooling was significant, the model depth would be too
shallow. Lack of evidence for wholesale hydrothermal alteration of
the rocks in the west Pioneers suggest that convective cooling was
not a major factor.
10

I also modelled the efficacy of a thick blanket of hot volcanic
rock at WPRS to retard cooling of the pluton and result in a longer
"thb-jjt The model blanketing layer of volcanic rocks was emplaced
at the same time as the pluton; it was 3 km thick and initially at
550°C, except its base, which was taken to be initially at 275°C.
The roof of the pluton was at 4 km, as at EPRS, so that a 1 km-thick
layer of sedimentary rocks (at thermal equilibrium just prior to the
magmatic events) intervened between the volcanic pile and the roof
of the pluton. The results (Table 1) show that the increase in -
thb-bt is less than 1 m.y. even in the absence of uplift. A thick
layer of hot volcanic rocks cannot explain the observed "thk-jjt
Snee (1988, oral commun.) estimated that the total pre-erosion
thickness of thrust sheets in the west Pioneers was about 15 km (to
be compared with model thickness of 16 km), implying that about 7 km
of thrust sheets remain at the west Pioneer reference site. These
values are schematically depicted to approximate vertical scale in
Figure 2; the Fourth of July fault is assumed to have taken up all
the relative vertical motion during both thrust loading and
subsequent uplift. More precise definition of crustal uplift-
erosion budget is not justified by the available data.
Decompression Rate
Field data bearing on rates of decompression (taken to equal
erosion balanced by uplift) in the Pioneer Mountains are scanty, and
the estimated rates are necessarily crude. EPRS is located near the
bottom of the U-shaped Rock Creek valley, about 600 m below the
general ridge crest, which is near the base of the Lower Cretaceous
11

Kootenai Formation (Zen, 1988b, cross sections J,L). Most of the
relief of the gorge is the result of Quaternary valley glaciation; I
assume that any pre-Eocene topographic relief did not significantly
affect the thermobarometry of rocks then several kilometers below
the surface. I further assume that, at the time of arrival of the
Wise River thrust sheet, the full thickness of the Kootenai
Formation was still preserved, as was at least part of the next
higher unit, UKFS, that now underlies the allochthon at Morrison
Hill. Thus, at least 1 km of these rocks plus a partial thickness
of the overlying allochthon must be restored. This was the original
basis for estimating a 4-km depth of intrusion. On the ridge east
of Morrison Hill, an erosion surface coated by the 46-50 Ma (middle
Eocene) volcanic rocks was developed on the allochthonous rocks at a
level about 0.4-0.5 km above the thrust fault. These observations
suggest about 2 km of erosion between the emplacement of the pluton
at EPRS and Eocene volcanism about 20-25 m.y. later, yielding an
average decompression rate of about 0.1 km/m.y. between 72 and 50
Ma. For lack of better data, I take this rate to apply to the
period between the thrusting and plutonism as well.
Boulders of granite occur in a sequence of pumiceous ash and
ash-matrix conglomerate on the north side of Fourth of July Ridge
immediately west of the Fourth of July fault (Calbeck, 1975; Zen,
1988b, p. 20). The most probable source of the boulders is the 65-
Ma (Late Cretaceous to Paleocene) Clifford Creek Granite that occurs
just across the Fourth of July fault. Another outcrop of the ash
farther south yielded a zircon fission-track age of 27 Ma (late
Oligocene; Pearson and Zen, 1985). The Clifford Creek is another
12

high-level granite of the Pioneer batholith that cuts the thrust
sheet. If a depth of intrusion of 4 km is assumed, an average
uplift rate of 0.1 km/m.y. would just suffice to unroof the pluton
by Oligocene time.
For WPRS, decompression rates are even harder to estimate. The
overall average decompression rate must be about twice that for EPRS
because the depth of intrusion of the now-exposed plutonic rocks was
about twice as great. For this site, I used a model value of 0.2
km/m.y., though the actual rate during the early Tertiary could have
been quite different.
MODELLING: CONSTRAINTS FROM PETROLOGICAL DATA
Inferred Nature of the Source Rock
Petrographic Information. Rocks of the Pioneer batholith
commonly contain hornblende + biotite; they are metaluminous to
barely peraluminous (the values of the aluminum saturation index,
ASI, are mostly about 1; Zen, 1988c). The only rocks known to have
ASI >1.1 are two late-stage leucocratic dikes (samples 315-1 and
TKds) and a two-mica rock (sample BHS) interpreted to be a local
differentiate of a nearly-metaluminous hornblende-bearing
granodiorite (Zen, 1986). Rocks of the batholith typically contain
abundant mafic inclusions and schlieren, but identifiable
sedimentary xenoliths are rare. They have relatively high Na/K
ratios; their oxide minerals are mainly magnetite (+ sphene) rather
than ilmenite.
The petrography, especially the mafic mineralogy, as well as
the lack of strongly peraluminous plutons suggest a source that was
13

either igneous or was already depleted of its most readily fusible
components during the Cretaceous anatectic event. The emplacement
of the batholith at high and relatively cold levels of the crust (3-
4 km in the east Pioneers, possibly as high as 8 km in the west
Pioneers) shows that the magmas must have been fairly dry until the
end, when miarolitic cavities formed locally (Zen, 1988b), for
otherwise the magmas would have frozen during ascent through
decompression-induced loss of volatiles. These indications of a
relatively nonfertile and dry source are consistent with the nature
of the exposed Proterozoic and late Archaean rocks exposed in
southwestern Montana: these are metasedimentary and metaigneous
rocks now in the upper amphibolite to granulite facies of regional
metamorphism (Sahinen, 1939; James and Hedge, 1980; Giletti, 1966;
Lowell, 1965; Zen, 1988b). Presumably the source rocks were
metamorphosed to at least as high grades as these exposed rocks.
Initial Strontium Isotope Ratios The inference that the source
rocks for the Pioneer batholith must have been fairly dry and
deficient in fertile material is complemented by the initial
strontium ratios (iSr) of the batholith (Arth and others, 1986).
The iSr values of the Pioneer batholith range from a value of
0.7113 (Keokirk Quartz Diorite; Uphill Creek Granodiorite; Clifford
Creek Granite) to 0.7160 (Trapper Tonalite). The highest value,
X).7304, was obtained from the two-mica aplite dike (sample 315-1)
that also records the highest ASI value. These iSr values imply
long crustal residence times for the source materials, and would
seem to exclude appreciable mantle contribution of material to the
magmas.
14
The iSr values of the Pioneer batholith stand in contrast to
those of the Boulder batholith situated to the north-northeast.
Rocks of the two batholiths are petrographically and chemically
similar; they have the same age range and share comparable tectonic
setting and history. The eastern limit of the batholiths together
define a regional alignment; east of this alignment, as will be
discussed, Laramide-age plutonism is negligible. However, the
Boulder batholith (both the "Main Series" and the "Sodic Series" of
Tilling, 1973) has much lower values of iSr (Doe and others, 1968),
ranging from 0.7055 to 0.7092; an isopleth of 0.710 fully separates
the two batholiths and this boundary is in fact mappable, at the
present level of erosion, as the north-northwest-striking Sawmill
Gulch-Trusty Gulch fault system (Figure 1; Zen, 1988b; for
additional data on the satellite bodies of the Boulder batholith
shown in Figure 1, see Arth and others, 1986; Zinter and others,
1983) .
Lead Isotope Data Doe and others (1968) presented data on lead
isotopes from the Boulder batholith. These data are augmented by
new determinations (Doe and others, 1986) for both the Pioneer and
Boulder batholiths. For the Pioneer batholith, the data are in part
on whole rock, in part on feldspar (5 samples from various plutons),
but predominantly on galena (and one cerrusite) from mineralized
bodies associated with the Pioneer igneous event. The whole-rock
sedimentary material were from different geographical areas and
ages; the data form a scattered set. I treated the sets
progressively as follows: (A) Igneous rock feldspar; (B) galena
15

from mineralized veins in igneous rocks; (C) galena and one
cerussite from mineralized veins in country rocks (mainly
sedimentary) adjacent to plutons; (D) sedimentary whole rocks. The
sets are then progressively combined, (E) = (A) + (B); (F) = (E) +
(C); and (G) = (D) + (F). The results (Table 2) show that the data
sets are similar except for (D) which was therefore excluded from
model age calculations. These calculations used the ISOPLOT program
of Ludwig (1988).
The lead isotope data, exclusive of the sedimentary rocks,
suggest a model source age of 1.9+0.2 Ga for the Pioneer batholith.
This is younger than the age of the exposed Precambrian rocks in
southwestern Montana (Giletti, 1966; James and Hedge, 1980) but is
comparable with the age of a supracrustal unit of mixed biotitic
plagioclase gneiss and hornblende-biotite amphibolite exposed in the
area immediately north of the Pioneer batholith in the east Pioneer
Mountains (Zen, 1988b, unit Xga). This unit has a metamorphic age
(age of the last strontium homogenization) of about 1.6 Ga (Zen,
1988b; Arth and others, 1986), consistent with the 1.6-Ga regional
metamorphism in southwestern Montana (Giletti, 1966); Pb-U ages on a
zircon separated from the plagioclase gneiss gave apparent ages
ranging from 1.1 to 1.8 Ga (Zen, 1988b), approaching the model age
based on lead isotope data. The postulated antiquity of the source
rock is compatible with the petrographic and iSr constraints, though
it so far lacks independent support such as Nd/Sm dates.
The lead isotope data of the Boulder batholith (Doe and others,
1968, 1986) were used to calculate its model age. The result,
2.1+0.3 Ga, is not distinguishable from the model age for the
16

Pioneer batholith, and so on this basis the two batholiths could
have had a common source terrane. I will later attempt to explain
their different iSr values.
Oxygen Isotope Data These data are scanty for the Pioneer
batholith. The values of 18O range from 6.8 to 9.3 but are mostly
less than 8 (J.R. O'Neil, 1979, written commun.); they are
compatible with a lower crustal or upper mantle source, but not with
a fertile sedimentary source.
Some Preliminary Inferences To summarize this discussion: it
seems reasonable to assume that the major source of the magmas that
constitute the Pioneer batholith was an old sialic crust. This
source likely was ultimately at least in part sedimentary (to
account for the high iSr), which either had already been depleted of
its most fusible (peraluminous) components previous to the Late
Cretaceous anatectic event, or had little or no peraluminous
component. This source terrane is inferred to have been at the
middle- to lower-crustal levels.
Three kinds of explanations for the different strontium isotope
characteristics of the Boulder and the Pioneer batholiths can be
suggested. The first is that the source terranes were unrelated and
only fortuitously have the same lead isotope model age. The other
explanations assume that the batholiths do share a common ultimate
source, of Late Archaean or older age. The second explanation (see
also Arth and others, 1986) is that the source terrane was
isotopically homogenized during the 1.6 Ga regional thermal event
that produced large-scale partial melting and segregation of the
17

terrane into melt-dominated "leucosomes" and restite-dominated
"melanosomes". Each of these parts had enough volume to supply the
material for a batholith. The leucosome-dominated terrane would0*7
have higher Rb/Sr ratios, a more rapid Sr growth curve, and higher
iSr values in Mesozoic time than would the melanosome-dominated
terrane. These two parts became the sources respectively for the
Pioneer and the Boulder batholiths, and the two sources supplied
magma to discrete areas now separated now by the Trusty Gulch-
Sawmill Gulch fault system.
The third possibility is that the Boulder batholith, with its
lower iSr, incorporates more mantle-derived material during the
Mesozoic anatectic event. The amount of material incorporated was
not enough to affect the lead isotope data because the material is
poor in common lead, but was enough to significantly lower the iSr.
This model, depending on a postulated difference in leakage and
mixing of material from the mantle, implies that energy transfer
leading to the formation of the Boulder magmas was more efficient
(see Huppert and Sparks, 1988) and could help explain the much
larger size of that batholith.
Because the plutons of the Pioneer batholith are dominated by
hornblende-biotite rocks, have an extended silica range typical of
calkalkaline series, show no evidence of H2O saturation except
during the final stages of solidification, and must have been
derived from an old source terrane already chemically depleted, the
solidus temperature must have been at least 800°C, and that melt
generation must have been mostly in a vapour-absent regime, likely
caused by the thermal breakdown of hydrous phases in the source
18
rocks.
The breakdown reactions leading to anatexis were discussed by
many authors; in these discussions, the predicted temperature of
appearance of melt widely varies, depending on the nature of the
hydrous phase, the bulk composition of the system, and the database
used to calculate the thermal stability of the hydrous phases in a
melting situation. For example, Thompson and Tracy (1979) predicted
partial melting of a pelitic system, using muscovite breakdown, in
the temperature interval of 640-720°C, whereas Clemens and Vielzeuf
(1987) predicted temperatures as high as 880-900°C for partial
melting of quartzofeldspathic source rocks having biotite and
hornblende as hydrous phases. They also predicted the production of
large volumes of melt, exceeding 50 volume percent of the original
bulk, mainly in response to biotite breakdown. In contrast, Patino-
Douce and others (1990) predicted much less melt generation for a
similar source rock but having more hydrous phases. These
volumetric estimates are important to our discussion not only
because the plutons are sizable but because the critical melt
fraction for melt separation (that is, the volume proportion of melt
below which no accumulation and segregation as distinct magma bodies
can happen) may be as large as 50% (see Miller and others, 1988;
also Zen, 1988a, for review of experimental data and their
interpretations).
Observed Petrologic Relations
Arth and others (1986) proposed at least three endmember magmas
for the Pioneer batholith, having iSr values of 0.7112, 0.7138, and
0.7160. If these endmembers are real, they presumably were discrete
19

pods of magma formed in different parts of the source terrane.
Mixing of the pods are observed at the level of intrusion, for
example, the first two endmembers, represented by the Grayling Lake
and the Uphill Creek plutons, locally mixed to form rocks of
intermediate iSr along a broad contact zone between these two
plutons (Zen, 1988b). Each magma also differentiated at depth, and
the differentiates were sequentially intruded as more silicic and
more peraluminous magmas; the volumetrically minor, mildly
peraluminous granites (Clifford Creek Granite and some strongly
peraluminous aplitic dikes) are late in the intrusive sequence. In
the east Pioneers, all the plutons produced contact aureoles,
commonly a few hundred meters wide. Taken together, these features
mean that anatexis did not take place at the present level of
erosion, and large magma reservoirs must have existed at some depth
where processes of accumulation and differentiation had occurred.
Another kind of petrological constraint is furnished by the
metamorphic grades of country rocks away from the plutonic contact.
In the east Pioneers, away from the contact the rocks are little
metamorphosed; shales and mudstones in UKFS contain smectite (Janet
Hoffman, 1976, written commun.) and show no evidence of
metamorphism, indicating a maximum temperature, at the present level
of erosion, of no more than about 160°C (compare with model results,
Table 3). In contrast, rocks near WPRS are reported to preserve
pre-intrusion regional metamorphism in the lower amphibolite facies
(L.W. Snee, 1988, oral commun.). However, because of the limited
time available between thrust emplacement and plutonism (5-10 m.y.,
see p. 9), this metamorphism, if regional in extent, is unlikely to
20

be part of a burial-heating episode associated with the arrival of
the thrust sheets. Although this metamorphism cannot provide
effective constraints for thermal modelling, the model results
(Table 3) for WPRS do predict regional temperatures at the present
level of exposure as high as 300°C.
MODELLING: CONSTRAINTS FROM ENERGY CONSIDERATIONS
Mode of Energy Transport Into the Zone of Anatexis
Energy could be carried into the zone of anatexis and
contribute to melting by several processes: Conduction (presumably
from a subcrustal source; from "below" in 1-D modelling); advection,
either as hot mafic magma or as a less viscous fluid phase from a
hot and presumably higher-pressure region; and local production of
heat through decay of radioactive elements, mainly K and the Th and
U series.
For the Pioneer batholith, direct mixing of mantle magma as an
agent of energy transport has already been ruled out on the basis of
the isotope data. Even though the magmas must have been
undersaturated in H20 at the site of fusion, as discussed earlier,
transport of energy by a fluid, possibly an aqueous fluid, from a
hotter and presumably higher pressure region into the melt zone
cannot be excluded a priori. If melting occurred in the lower
crust, at pressures of about 8 kbar, then the experimental data
(Wyllie, 1977a) would suggest no more than about 8-10 weight percent
of H2O in the final melt for hornblende and biotite to be stable but
without a vapour phase. Much of this H2O must be locally obtained
through breakdown of hydrous phases (see Patifio-Douce and others,
21

1990; Vielzeuf and Hollowway, 1988). We will assume the fluid to be
H2O dominated because with its high heat capacity H2O is an
efficient energy carrier. If a source of pure H2O could be found to
contribute energy to the melt, it must also have dissolved in the
understaturated melt in the process. As much as 3 weight percent of
H2O seems a reasonable upper bound for this source of H2O.
Assuming, generously, that this fluid came from a region at 1200°C
and 10 kbar (improbable as this is geologically), about 10 weight
percent of the source rock might be melted if the rock was already
preheated to the solidus temperature (Burnham and others, 1969).
Impressive as the figure may seem, the analysis is of the worst-case
type, and even 10 percent melting, by itself, is not enough to cause
melt mobilization. It would appear that the dominant mode of energy
transport into the zone of anatexis must have been by conduction.
Energy locally generated by radioactive decay is not likely by
itself to cause melting on a crustal scale, but could directly
affect the quantity of melt because it modifies the thermal
structure of the crust. What might be a reasonable value of crustal
energy productivity, A, for the source terrane and for the crust as
a whole?
Crustal Heat Production
The relation between observed surface heat flux and the heat
productivity can be expressed by:
Qf - Qm + A ' D
where Q^ is the observed surface heat flux, Q is the subcrustal
contribution to the flux, A is the heat production rate in a slab of
the crust, and D is a constant. Although in general A varies with
22

depth, a simple interpretation of the relations permitted by the
data is that A is constant and D is the thickness of the heat-
producing slab (Roy and others, 1968). This simple model is the
mainstay of my calculations. The heat production rate, A, is
assumed to extend over the upper 15 km of the original crust; it is
also duplicated in the thrust sheets (Zen, 1988a).
The presence in the plutons of restitic minerals, such as
zircon, that contains heat producing elements shows that the source
region, most probably at depths greater than 15 km during the
anatectic event, was not devoid of heat productivity, so the step-
function relation, showing a sharp cutoff in the middle crust,
cannot be strictly true, and some other distribution relation such
as a logarithmic relation (Lachenbruch, 1970) may be better.
However, changing the functional relation may affect the melt-
producing property of the crust only indirectly. In a later section
I will explore the effect on melt generation of different
distributions of the heat productivity.
Redistribution of U, Th, and K Purina Crustal Anatexis
Of the three principal heat-producing elements in a sialic
crust, potassium is hosted mainly by feldspar and mica (mainly
biotite) at the metamorphic grade expected at an anatectic zone.
These minerals can be expected to heavily dissolve into the melt;
indeed the thermal breakdown of biotite, releasing H2O, may be a
major trigger for the initiation of the melting process (see Patino-
Douce and others, 1990; Vielzeuf and Holloway, 1988). The
partitioning of uranium and thorium between the melt and the
residual material (restite) is less obvious. Comparison of crustal
23
abundance data are risky because these data are for different kinds
and ages of crustal rocks, including both potential source rocks and
igneous rocks that could have been the result of anatexis. Even so,
comparison of the Th and U contents of Archaean metamorphic rocks
from the Beartooth Mountains, Montana that are less mafic than
basalt (Wooden and others, 1988), of Archaean uraniferous granites
of Wyoming (Stuckless and others, 1981), of "average crustal rocks":
rocks of the Canadian shield, "average diorite and quartz diorite",
and "average granodiorite" (all from Clark and others, 1966) with
those of the Pioneer and Boulder batholiths (Table 4) shows similar
values.
Thorium and uranium can be expected to be contained mainly in
accessory phases of the source rocks, such as zircon, allanite,
sphene, monazite, and apatite. These minerals must at least partly
dissolve in an anatectic melt, but some, especially zircon and
allanite, would also be entrained as restite phases. Thus, the
efficacy of the entrainment process, which cannot be measured by
phase-equilibrium studies, must be important in affecting the net
partitioning of the heat producing elements. Empirically, we can
examine the abundances of Th and U in granitic rocks and their
source rocks, provided the petrogenetic connection between them can
be demonstrated: not usually an easy undertaking. Migmatites are
obvious candidates for such analysis if reliable Th and U data for
leucosomes and melanosomes are available, although because of the
small spatial separation of these bodies, segregation of dense
restitic phases such as zircon and allanite through magma transport
probably would not be noticeable.
24

Sawyer (1987) provided chemical data for the leucosome and
melanosome of a migmatite complex in southwestern Ontario. The
leucosome was considered to be the product of equilibrium partial
melting of the source rock, and may include some entrained restite.
The data indicate considerable enrichment of Th and U in the
leucosome. In contrast, Weber and others (1985) showed that these
elements were strongly retained in the melanosome in some migmatites
of St. Malo, France, a finding in agreement with those of Barbey and
others (1989) for the Telohat migmatite of Algeria. These data as a
whole are equivocal.
The Cooma granodiorite complex of the Lachlan Fold Belt in
southeastern Australia provides another view of these murky
relations. The Cooma granodiorite is a small stock that has been
considered to be produced by local anatexis of the Ordovician
pelitic and psammitic sedimentary rocks that surround it, forming an
extensive "regional metamorphic aureole" (Joplin, 1942, 1943; White
and Chappell, 1977). Munksgaard's (1988) chemical data (Table 4)
show virtually no distinction between the igneous and the
sedimentary rocks in their Th and U abundances. These data suggest
that in the anatectic event, Th and U, through dissolution into the
melt and through entrainment in the product magma, was distributed
evenly between the magma and the residual material.
Sawka and Chappell (1986) showed the K, U, and Th contents of
491 I-type and 316 S-type granitic rocks from the Lachlan Fold Belt
of southeastern Australia as a function of the silica contents of
the rocks. There is a slight covariance between Th, U and silica
25

for both rock types, and an expectable strong covariance between K
and silica. These relations are consistent with the inference that
during anatexis these heat-producing elements are at least not
partitioned into the restite portion, so the heat productivity of a
granite provides useful guides to those of the source rocks.
Combined with the tendency for potassium to enter the melt
phase, I adopt as my working hypothesis that the heat productivity
of the anatectic magma furnishes an upper estimate of that of the
source rocks.
SELECTION OF MODEL PARAMETERS
The field and thermal constraints summarized above provide the
basis to select values for variables used in modelling of anatexis
of the Pioneer magmas using the "1DT" program of Haugerud (1986) and
the technique described in Zen (1988a).
Variables, Mainly Tectonic
Decompression Rate As discussed before, the post-intrusion but
pre-Eocene decompression rate at EPRS is estimated to be about 0.1
km/m.y. (0.1 mm/yr). For WPRS, a less-well constrained overall
post-intrusion rate is 0.2 km/m.y. for the comparable time interval.
Thrust Advance Rate The model rate of advance of the thrust
sheet is 7 km/m.y. (7 mm/yr) along the direction between the two
reference sites. Using this value, it took 5 m.y. for the thrust
sheet to traverse the 35 km between WPRS and EPRS. As a result,
there is a 5-m.y.-longer wait between thrusting and magma intrusion
at WPRS. A movement rate much less than 7 km/m.y. would be
inconsistent with the -10-m.y. "window" between cessation of Late
26

Cretaceous sedimentation and plutonism; a rate much greater for
thrust movement seems unlikely. The time lapse between arrival of
the two thrust sheets within the west Pioneers is unknown; an
arbitrary value of 2 m.y. is used in the models. The thrust sheets
are presumed to be surface- and over-stack thrusts; the older, lower
sheet is 6 km thick and the younger, upper sheet is 10 km thick
(Figure 2).
Variables, Mainly Thermal
Depth to the Interface of Thermal Perturbation In the model,
thermal perturbation leading to anatexis is introduced
instantaneously at a specified model depth, across which the new
energy flux streams upward to modify the preexisting thermal
profile. This "effective thermal interface" (ETI), therefore, is
part of the lower boundary condition and is the depth at which the
"mantle flux" is monitored in the computations. Physically, ETI
could correspond to the depth of a subducted slab (Bird, 1988), or
it could be the depth of something else such as the top of a hot
spot representing upwelling of the asthenosphere. The thermal
effect caused by an interface at a depth of 100 km and having a flux
of 75 mWirT2 (e.g., depth of subduction modelled by Bird, 1988) would
not be felt in the sialic crust (assumed to be 30 km thick
initially) in less than about 70 m.y., requiring the subduction
event to be no younger than 140-150 Ma, or Late Jurassic. Even an
ETI of 75 km requires >50 m.y. for significant thermal response in
the crust. It seems far-fetched to assume that a subducted oceanic
slab and its lithosphere could maintain its thermal potency for such
a long time, as a cooling slab would lose its efficacy rapidly.
27

Interface depths between 60 and 46 km (30 km of initial crust
plus 16 km of thrust sheets) initiated about 40 m.y. prior to
thrusting (i.e. -110 Ma, corresponding to the beginning of accretion
of terranes in western Idaho and eastern Oregon and Washington; see
Lund and Snee, 1988) could produce sufficient volume of magma having
the required melting temperature range.
Should there be a finite time lapse between the inception of
ETI at the two reference sites? I modelled two possibilities: One,
ETI began simultaneously at the two sites, and two, the time lag for
ETI between the two sites was same as that for the arrival of the
thrust sheets. For the latter alternative, the period of the first
quiescent heating (incubation period ip^ see below) would be the
same at the two sites. Runs 10A, 10B, and 9G, Table 3, compare
these results.
Incubation Period An incubation period (ip) in the model is
any period when no tectonic event (including decompression) occurs,
and the system undergoes static thermal relaxation to approach a new
steady state. For the models used, the first incubation period,
ip1 , is between the inception of ETI and the arrival of the first
thrust sheet. The second one, ip2 / is between the arrival of the
last thrust sheet and the beginning of decompression, assumed to be
caused by erosion precisely balanced by uplift (Zen, 1988a; Haugerud
and Zen, 1991). For WPRS a third incubation period (ip1 5 )
intervenes between the arrival of the two thrust sheets.
In all the model runs, I arbitrarily set the inception of ETI
at a model time of 3 m.y., assured in the following way. A steady-
28

state continental geotherm, terminating at model time of 3 m.y. , was
calculated and filed. In each subsequent model run, the filed data
are used as the "prescribed geotherm" (Haugerud, 1986) , so that
thermal relaxation under the influence of enhanced mantle flux
begins at 3 m.y. model time. Values of ip.^ used range between 15
and 40 m.y., i.e., thrusting begins between 18 and 43 m.y. into
model time. As discussed already, values of ip2 are 2 m.y. at EPRS
and 5 m.y. at WPRS to assure synchroneity of uplift at the two
sites. Value of ip^ 5 is fixed at 2 m.y.
Source Rock Heat Productivity The observed heat productivity
of the plutons is assumed to be the upper limit for that of the
source rock. No correction is made for the small difference between
Late Cretaceous and modern radiogenic contents because the time
interval is less than 108 years and the half lives of the relevant
radioactive isotopes exceed 10 years.
Figures 4 and 5 give the available data on the K2O, U, and Th
contents of plutonic rocks of the Pioneer batholith. The U and Th
abundances are plotted against SiO2 and against K2O in order to
provide direct comparison with the data for the Boulder batholith
(Tilling and Gottfried, 1969) . For a given silica content, the
maximum U and Th contents of the Pioneer batholith rocks generally
are only about half of those of the Boulder batholith rocks (Figure
4) ; however, on a K2O plot (Figure 5) this difference largely
disappears, especially for Th abundance. This relation is
consistent with the fact that the Pioneer plutons are generally less
potass ic than the "Main Series" of the Boulder batholith and are
chemically similar to the "Sodic Series" (Figure 6; Tilling, 1973) .
29
The low K2O, Th, and U contents of the Pioneer rocks are consistent
with deriving the metaluminous magmas from a radiogenic sialic
source rock already depleted by previous anatexis.
These values are converted to heat productivity (Wetherill,
1966); I made no modification for improved isotopic abundances or
decay constants since that publication. Figure 7 compares the heat
productivity of the Pioneer batholith rocks with the average trend
for the Boulder batholith of Tilling and others (1970). The
unweighted average of the scanty data for the Pioneers is 2.11+1.31
uW.m"3 (N=18), or 1.85+0.73 uW.m"3 if an anomalously high value for
sample BH9850 (a porphyritic border phase of the Grayling Lake
pluton, Zen, 1988b) is excluded. The corresponding unweighted
average content of silica is 69.4% and of K2O is 3.4%; these two
points are marked on Figure 7 by stars. For model use, I assigned a
heat production value, A, of 1 uW.m"3 for the source terrane, which
is about half of the plutonic value. A 15-km thick radiogenic layer
would contribute 15 mW.m"2 to the pre-thrusting surface heat flux.
Finally, the effect of different distributions of the heat
productivity in the crust needs to be explored (Figure 8). Most of
the model runs (Figure 8) use a value of productivity, A=l uWm for
the upper 15 km of the crust, and A=0 for greater depths. If A=0.5
for the entire 30 km of depth (compare Runs N11B and 524, Table 3),
the volume of melt generated within 10 m.y. after uplift begins is
as much as 20% greater. A third distribution, A=l for Z=0,
decreasing linearly to A=0 for Z=30 (thus keeping the total heat
productivity constant; Run 526, Table 3), has intermediate effects
on melt production. These differences are insignificant for our
30

discussion. Figure 8 also shows the exponential distribution of the
same total heat productivity if A=l at Z=0 (Lachenbruch, 1970).
Although I cannot model this distribution, its effect would be
comparable with the third alternative above. Table 3 also shows
(Run 320) what would happen if A=l for the entire 30 km of crust;
the increase in melt production even for such a hot crust is only
about 2/3 again as much.
Estimating the Paleo-Subcrustal Heat Flux Estimation of the
subcrustal flux depends directly on the crustal productivity; it
cannot be independently measured. Sclater and others critically
reviewed existing data on heat flow on the continents and considered
(1980, Table 7) the relation between the age of the craton and the
observed heat flow. For North America as well as for the other
continents, the average surface heat flow value for cratons >1.7 Ga
is 46 mW.m . Sclater and others (1980) also compiled the value of
Qm , the mantle flux, for different areas. For the continental
interior the best value is one that Lachenbruch and Sass (1977)
called the "eastern United States" value, 33 mW.m"2 , which
accommodates observations in the stable central region of the United
States. The difference between this and the cratonal heat flow of
46 mW.m is consistent with the heat production value of 1 uW.m"3
for a 15-km thick productive crust chosen for the models. In round
figures, I used a pre-subduction cratonal subcrustal flux of 30
mW.irT2 .
Another way to estimate the subcrustal heat flux in
southwestern Montana is to consider modern-day values, obtained by
plotting Qf versus A for the rocks related by their common tectonic
31
provenance and extrapolating the data to A=0. No heat flow data
exist for the Pioneer area, but a few data do exist for the Boulder
batholith area (Blackwell and Robertson, 1973). Tilling (1974)
reviewed the data, and showed that they cannot be interpreted
unequivocally: even though the Boulder batholith data might be
extrapolated to give a Qm value of 75 mW.m"2 , they can equally well_2
be interpreted as conforming to the regional Q value of 59 mW.m
appropriate for the Basin and Range province (Lachenbruch and Sass,
1977). These authors pointed out the large scatter in the data for
this province and showed that the entire province is characterized
by anomalously high heat flow. This high regional heat flow for the
Basin and Range province presumably reflects Tertiary and ongoing
crustal extension; its Qm value is not applicable to the Pioneer
region prior to Late Cretaceous subduction.
For post-ETI mantle flux, I use values comparable with modern
oceanic heat flow. The data of von Herzen and Lee (1969) suggest Qm
about 60 mW.m"2 or slightly higher. Sclater and others (1980)
showed the effect of age of the oceanic crust on the heat flow; a
flux of 60 mW.m"2 corresponds to a 45-Ma crust, but a flux of 75
2 .mW.m requires a 15-Ma crust. My modelling results show that a
flux of 60 mW.m"2 would not produce adequate heating to generate
large bodies of melts within the limited timespan required by the
geological data; however, a flux of 75 mW.m"2 does meet the needed
rate of magma production.
Estimating the Peclet Number; Possible Coupling of Thermal and
Tectonic Factors The motion of the thrust sheet might contribute
frictional heat to the thermal regime. Oxburgh and Turcotte (1974)
32

and Peacock (1987) showed this effect to be negligible for all but
the most local situations. However, coupling of conductive heating
from below with convective heat transport by the movement of the
thrust sheets could be important. This effect is evaluated by the
Peclet number,
Pe = U.I /k
where U is the speed of convective transport (here given by the rate
of thrusting), 1 is a characteristic length (here given by the
thickness of the thrust sheet), and k is the thermal diffusivity
(Oxburgh and Turcotte, 1974). Using U of 7 x 10~3 m/year or 2.2 x
10 ° m.s"1 (i.e., a thrust movement rate of 7 mm/year), 1 of 6 x
103 m, and k of 8 x 10~7 m2 .s~1 , Pe becomes 1.6. Coupled energy
transport probably cannot be ignored. Even so, however, if the
fetch of both the ETI and thrusting are considerably greater than
the distance between the two reference sites, as seems plausible,
the thermal perturbation due to thrusting may be reasonably
approximated for each site by a steady-state situation. If so, the
coupled effects should be minor, and I have ignored them.
Thermal Conductivity A thermal conductivity, K, value of 2.00
W.m^K"1 is used throughout. Although this value seems low, it is
within the range of values tested by England and Thompson (1984),
and does lead to slow thermal relaxation after the ETI event,
whereas higher values of K result in lower crustal temperatures and
less magma generation. A value for K=2.00 gives a thermal
diffusivity value of k=8 x 10~7 m2 .s~ 1 . Density of 2780 km.m"3 and
heat capacity of 0.9 kJ.kg"1^1 are used throughout.
Site-specific Thermal Parameters I assume that the crusts
33

underlying both parts of the Pioneer Mountains are substantially
similar, so that the physical properties of the rocks such as
original crustal thickness, thermal diffusivity, and heat
productivity are the same for the two sites. However, the country
rock temperatures at the two reference sites might have differed at
the time of plutonism, as already described. For modelling purposes
I constrain T -160° at the original (pre-thrust) land surface for
EPRS and T >200° at a level of land about 5 km above the original
land surface for WPRS, both at the time of intrusion.
Variables, Mainly Concerning Melting Properties
The melting characteristics of the source terrane and of the
anatectic magma must be estimated. I assume that the pressure of
anatexis and of accumulation was greater than 5 kbar; i.e. at least
15 km below the land surface at that time). The temperature of the
water-saturated solidus then becomes nearly independent of the total
pressure. However, for reasons already discussed, the melt probably
was not H2O saturated, so fluid-absent reactions are envisioned to
dominate the process of magma generation and the solidus must have
been nearer 800°C than 700°C (see Wyllie, 1977a,b).
Considering the extended silica contents of the plutons, I
allowed melting to occur in a temperature interval of 360°C, at 10
fusion steps 40°C apart, using a linear model such that as much as
10% of the rock may melt at each step (Zen, 1988a). Different
solidus temperatures were tested (Table 3).
The heat of fusion used is the parametric value of Zen (1988a);
-hf = -Hf/C , where -Hf is the heat of fusion and C is the heat
34

capacity. A value of -h^=3°C per volumetric percent of melting is
adopted. Heat of fusion prevents the crust from becoming as warm as
it would be otherwise; however, after the crust has attained the
steady-state temperature, in general only about one-third of the
heat flux would be consumed in fusion; the bulk of the flux would be
conducted away (if heat convection is important, then the fraction
converted to latent heat can be expected to be even smaller; Zen,
1988a).
Summary of Modelling Procedure
The events and parameters for the models are sequenced as
follows.
1. A steady state continental thermal profile is established
for the original cratonic crust. The heat productivity, in most
models confined to the upper 15 km, is 1 uW.m"3 ; the mantle flux is
30 mW.m~2 . Thus the initial surface flux is 45 mW.nT2 .
2. The steady state is terminated by the instantaneous
inception, 3 m.y. into model time, of a new and larger subcrustal
thermal flux at a depth called the effective thermal interface, ETI,
producing an upward flux of 75 mW.nT2 .
3. An incubation period, ip17 follows; its duration ranges
from 15 m.y. to 40 m.y., depending on the model, in order to produce
temperatures high enough for anatexis.
4. ip1 is terminated by the instantaneous arrival of the Wise
River thrust sheet, 6 km thick, having physical and thermal
properties of the upper 6 km of the original crust at that moment.
35

This thrust sheet arrived at West Pioneer Reference Site 5 m.y.
earlier than at East Pioneer Reference Site. One set of models
assumes that the inception of the ETI was instantaneous for the
entire Pioneer region, whereas another set of models takes the time
lag of inception of ETI at the two sites to be the same as that for
the arrival of the thrust sheets, so that ip^ was the same for the
two reference sites.
5. A second, higher, Pattengail thrust sheet, 10 km thick,
arrived at WPRS 2 m.y. later (after ip-^ 5 ) , possessing the thermal
regime of the upper 10 km of the combined crust at that time and
place.
6. A brief second period of quiescence, ip2 / followed at both
sites. This period is longer at EPRS because the area did not
receive the Pattengail sheet.
7. Uplift, exactly balanced by erosion, then proceeded in the
entire Pioneer region. The rate is 0.2 km/m.y. for WPRS and 0.1
km/m.y. for EPRS.
The results of the model runs are examined for acceptability by
using the field- and geochronometric constraints. At WPRS, the
temperature at the present land surface (about 5 km above the pre-
thrusting original land surface) may reach 300°C or even higher at
the time of intrusion; however, at EPRS the temperature at the
original land surface must never exceed about 160°.
MODEL RESULTS
Results of the modelling study are summarized in Table 3.
36

These data indicate the relative importance of the variables in
controlling the volume of anatectic melt. Eight runs of Table 3
that produced melt are depicted in Figure 9, where the temperature
record for four selected crustal depths are shown, located at 20,
25, and 30 km below the original surface, as well as right at the
original surface (for EPRS) and at 5 km above the original surface
(for WPRS); each record takes off from the equilibrium continental
geotherm. Figure 9A relates the shape of the thermal curves to the
benchmark tectonic events; from the time ticks on the curves
isochrons can be readily constructed. Figures 9B through 9E show
that if the mantle flux is changed from 75 to 60 mW.m"2 , with all
other variables held the same, a 3-fold decrease in melt volume
results at WPRS (Runs 9G, and 11B), and a nearly 5-fold decrease
results at EPRS (Runs 10A and 11A). Figure 9F (Run 9A) illustrates
the major effect of the depth of the thermal interface at ETI of
36 km, a large volume of melt resulted despite the high temperatures
of the melting interval. Figures 9G (Run 10C) and 9H (Run 10B) and
Figures 9C, 91 (Run 9F), and 9F are sets that show the effect of
melting interval at the two sites. The kinks in the curves within
melting intervals in part reflect the effect of stepwise and
episodic melting (Zen, 1988a). For each run, I have marked the
depth of the ETI and the regions where temperature becomes high
enough to permit melting no more than 10 m.y. after the termination
of ip2 (to be consistent with the age constraints on tectonic
events), using the assumed melting properties.
The volume of magma generated for EPRS, in even the most
favourable models, is surprisingly small. Use of smaller latent
37

heat would increase the magma volume; -hf of 2° would increase the
magma volume by about 50%. One could argue reasonably that the
volume of a typical plutonic rock contains much restite as well as
earlier magmatic crystals whose precipitation "recycled" the thermal
energy and caused continued melting. This is doubtless an important
factor; its inclusion could augment the total magma by an uncertain
but possibly substantial amount. Balanced against this factor,
however, is the uncertain volume of melt that never pooled into the
magma and intruded as part of the batholith. A nonlinear melting
model could also change the volume of melt; the data of Vielzeuf and
Holloway (1988) and of Patino-Douce and others (1990) suggest lesser
initial melt production than predicted by the linear model until
biotite breaks down. The Pioneer batholith is at the eastern limit
of the belt of Laramide-age magmatism; the paucity of model magma
may reflect the reality of passing from a magma-producing to a
magma-nonproducing environment. Moreover, the observed volume of
magma at EPRS could in part reflect lateral magma transport. This
line of argument highlights the weakness of one-dimensional models.
Because of the time constraints, thrusting could not have been
the tectonic trigger for melting. However, during ip-j^ prior to
thrusting, the rate of heating decreases steadily; emplacement of
the thrust sheets rejuvenates that rate and contributes to the
generation of magma in the ensuing few tens of millions of years.
The cessation of magma generation is accelerated by erosion; the
scale of plutonism of a given region must depend on the rate of
cooling and indirectly on the rate of decompression. Regionally,
this factor could contribute to the differences among areas of
38

abundant, moderate, and little magmatism that are otherwise
similarly situated relative to the late Mesozoic tectonic events.
FURTHER CONCLUSIONS FROM MODEL RESULTS
Subduction versus Mantle Upwellina
Bird (1988) provided an interesting two-dimensional model of
tectonic evolution of the western United States between Late
Cretaceous and Eocene time, consistent with known major plate-
tectonic relations and the general tectonic features from the Rocky
Mountains to the present Pacific coastal region. The model invokes
a flat subducting plate, at a depth of about 100 km, that moved in a
generally northeasterly direction; this plate eventually detached
itself from the superjacent crust with the hinge line of detachment
moving retrogressively southwestward during later parts of the
Tertiary.
Bird's model predicts the location, time, and amount of crustal
thickening due to this process; it also gives the arrival time, at
any given spot, of the subducting oceanic lithosphere. For
southwest Montana, Bird's model estimates its arrival between 75 and
60 Ma. These ages are too young to be relevant to the generation
the magmas of the Pioneer batholith.
As my thermal models show, the depth of subduction must have
been less than about 50 km in order to be effective. Because the
Pioneer batholioth was located at least 300 km from the plate margin
at that time (Armstrong and others, 1977; Lund and Snee, 1988), such
a shallow depth would seem geologically and mechanically
unrealistic; equally improbable is the maintenance, for as long as
39

30 m.y., of a subducted slab having the thermal characteristics of
an oceanic crust no older than about 15 m.y. (i.e. flux of energy of
about 75 mW/m3 ; Sclater and others, 1980). I condlude that
subduction was not a plausible cause of the increased subcrustal
flux at the shallow ETI; rather, large-scale and sub-crustal mantle
upwelling must be postulated.
Significance of the Initial Strontium Ratio Values
The initial strontium ratios for rocks of the Pioneer batholith
do not permit much admixture of mantle material. For this
batholith, the interaction between the anatectic zone in the lower
crust and the subcrustal material must be confined to conductive
energy transfer. For the Boulder batholith, in contrast, the
consistently lower values of the initial strontium ratios do permit
limited mixing of mantle material. Such leakage would enhance the
efficiency of energy transfer from below (e.g., Huppert and Sparks,
1988). The average heat productivity of the Boulder batholith,
nearly twice that of the Pioneer batholith, permits larger
productivity value for its source. These two factors, taken
together, could help to explain the much larger size of this
batholith compared to the Pioneer batholith.
East of the alignment of the eastern margin of the two
batholiths, Laramide-age plutonism decreases precipitously. The
most notable exception of an appreciable size is the small Tobacco
Roots batholith, similarly dominated by hornblende-biotite
granodiorites. An initial strontium ratio for this body was
reported (Shuster and others, 1989) to be 0.704, much lower than
those of the two larger batholiths to the west, and well within the
40

range of values for the source regions of oceanic and magmatic-arc
basalts expected for that age (Arth and others, 1986). Could the
magmas of the Tobacco Roots batholith owe their existence to
substantial leakage of mantle material and thus much enhanced
efficiency of energy transfer?
Generation of magmas of the Pioneer and Boulder batholiths may
have involved basically different geological processes than the
vastly larger, tectonically outboard, and petrographically complex
Idaho batholith, despite their comparable isotopic ages. The Idaho
batholith consists largely of hydrous peraluminous (two-mica)
granite (Hyndman, 1983) and has high iSr values (see review by Arth
and others, 1986). I suggest that the Idaho batholith was truly
subduction-related and "skimmed the cream" of the low-melting,
hydrous, peraluminous fractions of the sediments. Such subducted
sediments never reached the more inboard sites of the Pioneer and
Boulder batholiths.
41
REFERENCES CITED
Armstrong, R.L., Taubeneck, W.H., and Hales, P.O., 1977, Rb-Sr and K-Ar geochronometry of Mesozoic granitic rocks and their Sr isotopic composition, Oregon, Washington, and Idaho: Geological Society of America Bulletin, v. 88, p. 397-411.
Arth, J.G., Zen, E-an, Sellers, George, and Hammarstrom, Jane, 1986, High initial Sr isotopic ratios and evidence for magma mixing in the Pioneer batholith of southwest Montana: Journal of Geology, v. 94, p. 419-430.
Barbey, Pierre, Bertrand, Jean-Michel, Angoua, Serge, and Dautel, Dannielle, 1989, Petrology and U/Pb geochronology of the Telohat migmatites, Aleksod, central Hoggar, Algeria: Contributions to Mineralogy and Petrology, v. 101, p. 207-219.
Bird, Peter, 1988, Formation of the Rocky Mountains, western United States: A continuum computer model: Science, v. 239, p. 1501-1507.
Blackwell, D.D., and Robertson, E.G., 1973. Thermal studies of the Boulder batholith and vicinity, Montana: Society of Economic Geologists, Butte [Montana] field meeting, August 1973, guidebook, p. D1-D8.
Burnham, C.W., Holloway, J.R., and Davis, N.F., 1969, Thermodynamic properties of water to 1000°C and 10,000 bars: Geological Society of America Special Paper 132, 96 p.
Calbeck, J.M., 1975, Geology of the central Wise River valley, Pioneer Mountains, Beaverhead County: Missoula, Montana, University of Montana, M.S. thesis, 89 p.
Clark, S.P., Jr., Peterman, Z.E., and Heier, K.S., 1966, Abundances of uranium, thorium, and potassium: p. 521-541 in S.P. Clark, Jr., editor, Handbook of physical constants, revised edition, Geological Society of America Memoir 97, 587 p.
Clemens, J.D., and Vielzeuf, D., 1987, Constraints on melting and magma production in the crust: Earth and Planetary Science Letters, V. 86, p. 287-306.
Doe, B.R., Berger, B.R., and Elliott, J.E., 1986, Lead-isotope evaluation of selected ores and mineral prospects in the Butte and Dillon 1° x 2° quadrangles, Montana: U.S. Geological Survey Open- File Report 86-111, 40 p.
Doe, B.R., Tilling, R.I., Hedge, C.E., and Klepper, M.R., 1968, Lead and strontium isotope studies of the Boulder batholith, southwestern Montana: Economic Geology, v. 63, p. 884-906.
England, P.C., and Thompson, A.B., 1984, Pressure-temperature-time paths of regional metamorphism, Pt. I, Heat transfer during the evolution of regions of thickened crust: Journal of Petrology, v. 25, p. 894-928.
42

Giletti, B.J., 1966, Isotopic ages from southwestern Montana: Journal of Geophysical Research, v. 71, p. 4029-4036.
Haugerud, R.A., 1986, 1DT - an interactive, screen-oriented microcomputer program for simulation of 1-dimensional geotheriaal histories: U.S. Geological Survey Open-File Report 86-511, 18 p.
Haugerud, R.A., and Zen, E-an, 1991, An essay on metamorphic path studies, or, Cassandra in P-T-t space: p. 323-348 in L.L. Perchuk, editor, Progress in metamorphic and magmatic petrology, University of Cambridge Press.
Huppert, H.E., and Sparks, R.S.J., 1988, The generation of granitic magmas by intrusion of basalt into continental crust: Journal of Petrology, v. 29, p. 599-624.
Hyndman, D.W., 1983, The Idaho batholith and associated plutons, Idaho and western Montana: Geological Society of America, Memoir 159, p. 213-240.
James, H.L., and Hedge, C.E., 1980, Age of the basement rocks of southwest Montana: Geological Society of America Bulletin, Pt. I, v. 91, p. 11-15.
Joplin, G.A., 1942, Petrological studies in the Ordovician of New South Wales, I. The Cooma Complex: The Linnean Society of New South Wales, Proceedings, v. 67, p. 156-196.
Joplin, G.A., 1943, Petrological studies in the Ordovician of New South Wales, II. The northern extension of the Cooma Complex: The Linnean Society of New South Wales, Proceedings, v. 68, p. 159-183.
Lachenbruch, A.H. 1970, Crustal temperature and heat production: implications of the linear heat-flow relations: Journal of Geophysical Research, v. 75, p. 3291-3300.
Lachenbruch, A.H., and Sass, J.H., 1977, Heat flow in the United States and the thermal regime of the crust: p. 626-675 in J.G. Heacock, editor, The earth's crust, its nature and physical properties: American Geophysical Union, Geophysical Monograph 20, 754 p.
Lowell, W.R., 1965, Geologic map of the Bannack-Grayling area, Beaverhead County, Montana: U.S. Geological Survey, Miscellaneous Geologic Investigations Map 1-433, scale 1:31,680.
Ludwig, K.R., 1988, Isoplot for MS-DOS, a plotting and regression program for radiogenic-isotope data, for IBM-PC compatible computers, version 1.07: U.S. Geological Survey, Open-File Report 88-557, revised edition of May 2, 1989, 37 p.
Lund, Karen, and Snee, L.W., 1988, Tectonic development of the Salmon River suture zone, western Idaho: Conclusions and questions: Geological Society of America Abstracts with Programs, v. 20, p.
43
429.
Marvin, R.F., Zen, E-an, Hammarstrom, J.M., and Mehnert, H.H. , 1983, Cretaceous and Paleocene potassium-argon ages of the northern Pioneer batholith and nearby igneous rocks in southwest Montana: Isochron/West, no. 38, p. 11-17.
Miller, C.F., Watson, E.B., and Harrison, T.M., 1988, Perspectives on the source, segregation, and transport of granitoid magmas: Royal Society of Edinburgh, Transactions, Earth Sciences, v. 79, p. 135- 156.
Munksgaard, N.C., 1988, Source of the Cooma Granodiorite, New South Wales a possible role of fluid-rock interactions: Australian Journal of Earth Sciences, v. 35, p. 363-377.
Myers, W.B., 1952, Geology and mineral deposits of the northwest quarter, Willis quadrangle and adjacent Brown's Lake area, Beaverhead County, Montana: U.S. Geological Survey Open-File Report 147, 46 p., 2 plates.
Oxburgh, E.R., and Turcotte, D.L., 1974, Thermal gradients and regional metamorphism in overhtrust terrains with special reference to the eastern Alps: Schweizerische Mineralogische und Petrographische Mitteilungen, v. 54, p. 641-662.
Palmer, A.R., 1983, The Decade of North American Geology 1983 geologic time scale: Geology, v. 11, p. 503-504.
Patino-Douce, A.E., Humphreys, E.D., and Johnston, A.D., 1990, Anatexis and metamorphism in tectonically thickened continental crust exemplified by the Sevier hinterland, western North America: Earth and Planetary Sciences Letters, v. 97, p. 290-315.
Peacock, S.M., 1987, Creation and preservation of subduction-related inverted metamorphic gradients: Journal of Geophysical Research, v. 92B, p. 12,763-12,781.
Pearson, R.C., and Zen, E-an, 1985, Geologic map of the east Pioneer Mountains, Beaverhead County, Montana: U.S. Geological Survey Miscellaneous Field Studies Map MF-1806-A, scale 1:50,000, with text.
Roy, R.F., Blackwell, D.D., and Birch, Francis, 1968, Heat generation of plutonic rocks and continental heat flow provinces: Earth and Planetary Science Letters, v. 5, p. 1-12.
Ruppel, E.T., O'Neill, J.M., and Lopez, D.A., 1983, Preliminary geologic map of the Dillon 1° by 2° quadrangle, Montana: U.S. Geological Survey Open-File Report 83-168, 1 sheet, scale 1:250,000.
Sahinen, U.M., 1939, Geology and ore deposits of the Rochester and adjacent mining districts, Madison County, Montana: Montana Bureau of Mines and Geology Memoir 19, 53 p.
44

Sawka, W.N., and Chappell, B.W., 1986, The distribution of radioactive heat production in I- and S-type granites and residual source regions: implications to high heat flow areas in the Lachlan Fold Belt, Australia: Australian Journal of Earth Sciences, v. 33, p. 107-118.
Sawyer, E.W., 1987, The role of partial melting and fractional crystallization in determining discordant migmatite leucosome compositions: Journal of Petrology, v. 28, p. 445-473.
Sclater, J.G., Jaupart, C., and Galson, D., 1980, The heat flowthrough oceanic and continental crust and the heat loss of theearth: Reviews of Geophysics and Space Physics, v. 18, p. 269-311.
Sharp, G.S., 1970, Stratigraphy and structure of the Greenstone Mountain area, Beaverhead County, Montana: Corvallis, Oregon, Oregon State University, M.S. thesis, 121 p.
Shuster, R.D., Mueller, P.A., D'Arcy, K., and Heatherington, A., 1989, Nd evidence of the age and nature of source regions of the northeastern Idaho batholith and Tobacco Root batholith, Montana: Geological Society of America, Abstracts with Programs, v. 21, p. 325.
Snee, L.W., 1978, Petrography, K/Ar ages, and field relations of the igneous rocks of part of the Pioneer batholith, southwestern Montana: M.A. thesis, Ohio State University, 110 p.
Snee, L.W., 1982, Emplacement and cooling of the Pioneer batholith, southwestern Montana: Ph.D. thesis, Ohio State University, 320 p.
Thompson, A.B., and Tracy, R.J., 1979, Model systems for anatexis of pelitic rocks, II, Facies series melting and reactions in the system CaO-KAlO2-NaAlO2-Al2O3-SiO2-H2 O: Contributions to Mineralogy and Petrology, v. 70, p. 429-438.
Tilling, R.I., 1973, Boulder batholith, Montana - a product of two contemporaneous but chemically distinct magma series: Geological Society of America Bulletin, v. 84, p. 3879-3900.
Tilling, R.I., 1974, Estimating the "thickness" of the Boulder batholith, Montana, from heat-flow and heat-productivity data: Geology, v. 2, p. 457-460.
Tilling, R.I., and Gottfried, David, 1969, Distribution of thorium, uranium, and potassium in igneous rocks of the Boulder batholith region, Montana, and its bearing on radiogeneic heat production and heat flow: U.S. Geological Survey Professional Paper 614-E, 29 p.
Tilling, R.I., Gottfried, David, and Dodge, F.C.W., 1970, Radiogenic heat production of contrasting magma series: bearing on interpretation of heat flow: Geological Society of America Bulletin, v. 81, p. 1447-1462.
Vielzeuf, Daniel, and Holloway, J.R., 1988, Experimental
45

determination of the fluid-absent melting relations in the pelitic system: Contributions to Mineralogy and Petrology, v. 98, p. 257- 276.
von Herzen, R.P., and Lee, W.H.K., 1969, Heat flow in oceanic regions: p. 88-95 in P.J. Hart, editor, The earth's crust and upper mantle: American Geophysical Union, Geophysical Monograph 13, 735 P-
Weber, C., Barbey, P., Cuney, M., and Martin, H., 1985, Trace element behaviour during migmatization. Evidence for a complex melt-residuum-fluid interaction in the St. Malo migmatitic dome (France): Contributions to Mineralogy and Petrology, v. 90, p. 52- 62.
Wetherill, G.W., 1966, Radioactive decay constants and energies: p. 514-519 in S.P. Clark, Jr., editor, Handbook of physical constants, revised edition, Geological Society of America Memoir 97, 587 p.
White, A.J.R., and Chappell, B.W, 1977, Ultrametamorphism and granitoid genesis: Tectonophysics, v. 43, p. 7-22.
Wooden, J.L., Mueller, P.A., Mogk, D.A., and Bowes, D.R., 1988, A review of the geochemistry and geochronology of Archean rocks of the Beartooth Mountains, Montana and Wyoming: In S.E. Lewis and R.B. Berg, editors, Precambrian and Mesozoic plate margins: Montana, Idaho and Wyoming: Montana Bureau of Mines and Geology, Special Publication 96, p. 23-42.
Wyllie, P.J., 1977a, Crustal anatexis: an experimental review: Tectonophysics, v. 43, p. 41-71.
Wyllie, P.J., 1977b, From crucibles through subduction to batholiths: p. 389-433 in S.K. Saxena and Somdev Bhattacharji, editors, Energetics of geological processes, New York, Springer- Verlag, 473 p.
Zen, E-an, 1986, Aluminum enrichment in silicate melts by fractional crystallization: some mineralogic and petrographic constraints: Journal of Petrology, v. 27, p. 1095-1117.
Zen, E-an, 1988a, Thermal modelling of stepwise anatexis in a thrust-thickened sialic crust: Royal Society of Edinburgh, Transactions, Earth Sciences, v. 79, p. 223-235.
Zen, E-an, 1988b, Bedrock geology of the Vipond Park 15-minute, Stine Mountain 7-1/2 minute, and Maurice Mountain 7-1/2 minute quadrangles, Pioneer Mountains, Beaverhead County, Montana: U.S. Geological Survey Bulletin 1625, 49 p., 2 plates.
Zen, E-an, 1988c, Phase relations of peraluminous granitic rocks and their petrogenetic implications: Annual Reviews of Earth and Planetary Sciences, v. 16, p. 21-51.
Zen, E-an, 1992, Using granite to image the thermal state of the
46

source terrane: Royal Society of Edinburgh, Transactions, Earth Sciences, v. 83, p. 107-114.
Zen, E-an, Marvin, R.F., and Mehnert, H.H., 1975, Preliminary petrographic, chemical, and age data on some intrusive and associated contact metamorphic rocks, Pioneer Mountains, southwestern Montana: Geological Society of America Bulletin, v. 86, p. 367-370.
Zinter, G.G., Snee, L.W., and Sutter, J.F., 1983, Geology, petrology, and age of emplacement of the Big Hole Canyon intrusion near Dewey, southwest Montana: Geological Society of America, Abstracts with Programs, v. 15, p. 412.
47

TABLE CAPTIONS
Table 1. Comparison of results of a layer of hot volcanic rocks versus deep burial on the expected cooling rate of a pluton, as expressed by the difference in the hornblende and biotite argon cooling ages (^t..) , at the WPRS.
Table 2 . Calculations of model ages of source terranes for the Pioneer and Boulder batholiths, based on lead isotope data. See text for details.
Table 3. Parameters used in thermal modelling calculations, and principal results. See text for discussion.
Table 4 . Crustal abundances of uranium and thorium for various types of material, compared to those of the Pioneer and Boulder batholiths. Sources of data: Boulder batholith, Canadian shield rocks, and average crust, Tilling and Gottfried, 1969. Pioneer batholith, Zen, this study. Archaean granites of Wyoming, Stuckless and others, 1981. Archaean rocks of the Beartooth Mountains, Wooden and others, 1988. Other rocks, Clark and others, 1966. Quetico migmatite, Sawyer, 1987. Cooma granodiorite and metamorphic rocks, Munksgaar d , 1988.
Table 5. K2O, Th, and U contents of rocks of the Pioneer batholith, and heat productivity of the Pioneer batholith rocks, calculated by using the conversion factors of Wetherill (1966) .
48
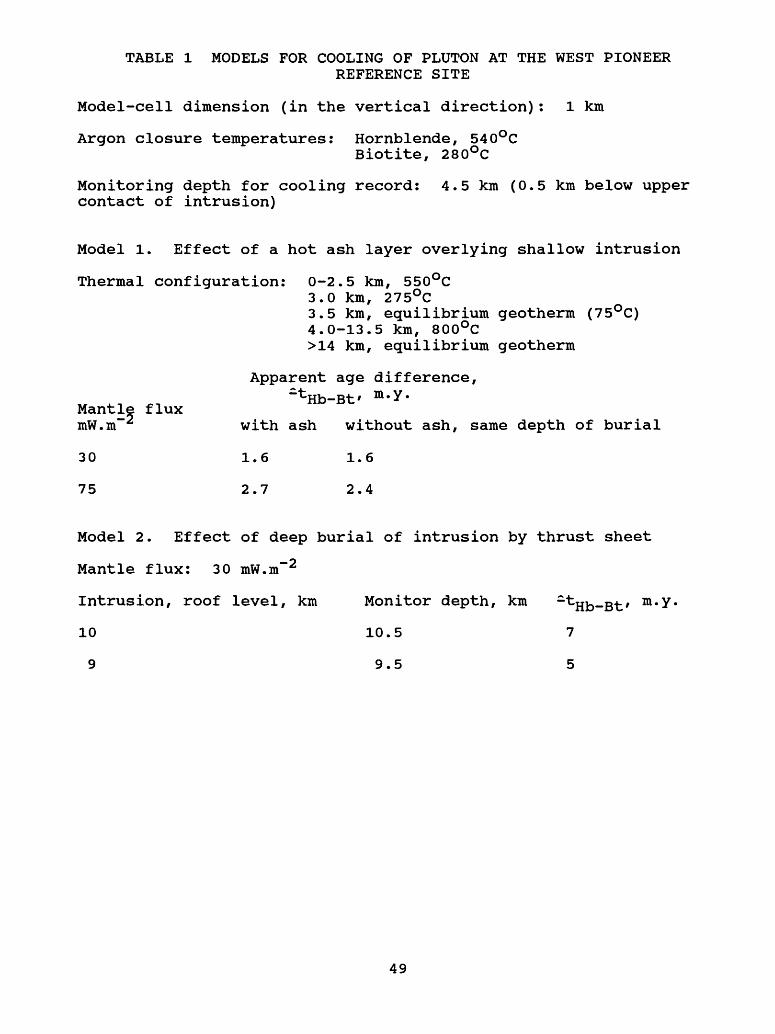
TABLE 1 MODELS FOR COOLING OF PLUTON AT THE WEST PIONEERREFERENCE SITE
Model-cell dimension (in the vertical direction): 1 km
Argon closure temperatures: Hornblende, 540°CBiotite, 280°C
Monitoring depth for cooling record: 4.5 km (0.5 km below upper contact of intrusion)
Model 1. Effect of a hot ash layer overlying shallow intrusion
Thermal configuration: 0-2.5 km, 550°C3.0 km, 275°C3.5 km, equilibrium geotherm (75°C) 4.0-13.5 km, 800°C >14 km, equilibrium geotherm
Apparent age difference,^Hb-Bt' m - v -
Mantle fluxmW.m""2 with ash without ash, same depth of burial
30 1.6 1.6
75 2.7 2.4
Model 2. Effect of deep burial of intrusion by thrust sheet
Mantle flux: 30 mW.nT2
Intrusion, roof level, km Monitor depth, km ~^Hb-Bt' m'Y
10 10.5 7
9 9.5 5
49

TABLE 2. Model ages of source terranes for the Pioneer and the Boulder batholiths
based on lead isotope data.
Pioneer batholith
Type of Number of material samples
A. Igneous 5 rock
B. Vein in 6 igneous rock
C. Vein in 16 sedim. rock
D . Sedimentary 4 wholerock
E. A+B 11
F. E+C 27
G. F+D 31
Model 1
1520 +/- 1100
1680 +/- 710
1560 +/- 550
482 +/- 930
1670 +/- 430
1720 +/- 260
818 +/- 340
Model 2
1760 +/-
1820 +/-
506 +/-
1770 +/-
1850 +/-
1010 +/-
680
470
920
400
240
300
Boulder batholith
(1) Doe and others (1986), vein galena
(2) Doe and others (1968), size-controlled sample
26 1890 +/- 310
1990 +/- 780
2060 +/- 280
50

Table 3 Parameters used in thermal modelling, and principal results
Run No.
Incubation Period, m.y.a/
iPl ip1-5 ip2
Monitor Melting Depth, Interval, kmb/ °C
Maximum Total Fusiond/ Ambient Temp., End of 5 m.y. 10 m.y. °Cc/ ip2 later later
EPRS
N5A
N1A
N6A
N3A
N2A
N4A
625Ae/
625Bf/
N4AAC[/
N4BBh/
527Ai/
10B1/
10A
HAk/
10C
N7A
35
35
35
35
35
35
35
35
35
35
35
35
40
40
35
35
2
2
2
2
2
2
2
2
2
2
2
2
2
2
2
2
36
36
36
46
46
46
46
46
46
46
46
60
60
60
60
60
700-1060
740-1100
800-1160
700-1060
740-1100
800-1160
800-1160
800-1160
800-1160
800-1160
800-1160
700-1060
700-1060
700-1060
740-1100
800-1160
181
182
183
164
165
166
161
162
166
166
149
143
144
133
143
143
4.61
3.73
2.59
2.17
1.61
0.81
1.25
0.96
0.81
0.81
0.03
0.31
0.58
0.01
0.09
0.00
5.88
4.88
3.56
3.15
2.43
1.42
2.00
1.60
1.40
1.42
0.18
0.71
1.10
0.14
0.35
0.05
7.26
6.21
4.71
4.31
3.44
2.24
2.99
2.44
2.23
2.20
0.46
1.34
1.80
0.39
0.82
0.29
51

Table 3 (continued)
Run No.
Incubation Period, m.y._a/
ip, ip, c ip0J. J..3 * A
Monitor Melting Depth, Interval, kmb/ °C
Maximum Total Fusiond/ Ambient Temp., End of 5 m.y. 10 m.y. °C£/ ip« later later
WPRS
N9B
N10B
9A
9B
NUB
320 1/
524m/
526n/
9H
527B
527CO/
9GE/
11BS/
9F
N8B
N12B
9E
N13B
9C
9Dr/
35
35
15
15
35
35
35
35
35
35
35
35
35
35
35
35
35
35
35
35
2
2
2
2
2
2
2
2
2
2
2
2
2
2
2
2
2
2
2
2
5
5
5
5
5
5
5
5
5
5
5
5
5
5
5
5
5
5
5
5
46
46
46
100
46
46
46
46
55
56
56
60
60
60
60
75
75
75
100
100
700-1060
740-1100
800-1160
800-1160
800-1160
800-1160
800-1160
800-1160
700-1060
800-1160
800-1160
700-1060
700-1060
740-1100
800-1160
700-1060
740-1100
800-1160
740-1100
740-1100
260
262
248
170
266
297
247
249
239
241
217
228
228
228
231
202
201
203
169
163
4.11
3.23
0.61
0
2.17
4.65
2.88
2.36
1.74
0.41
0
0.91
0.10
0.54
0.17
0.00
0
0
0
0
6.57
5.43
2.03
0
4.04
7.55
4.89
4.11
3.34
1.33
0.13
2.10
0.54
1.42
0.71
0.24
0.05
0
0
0
9.07
7.90
3.96
0
6.28
10.22
7.26
6.18
5.37
2.70
0.55
3.73
1.29
2.83
1.70
0.80
0.42
0.06
0
0
52
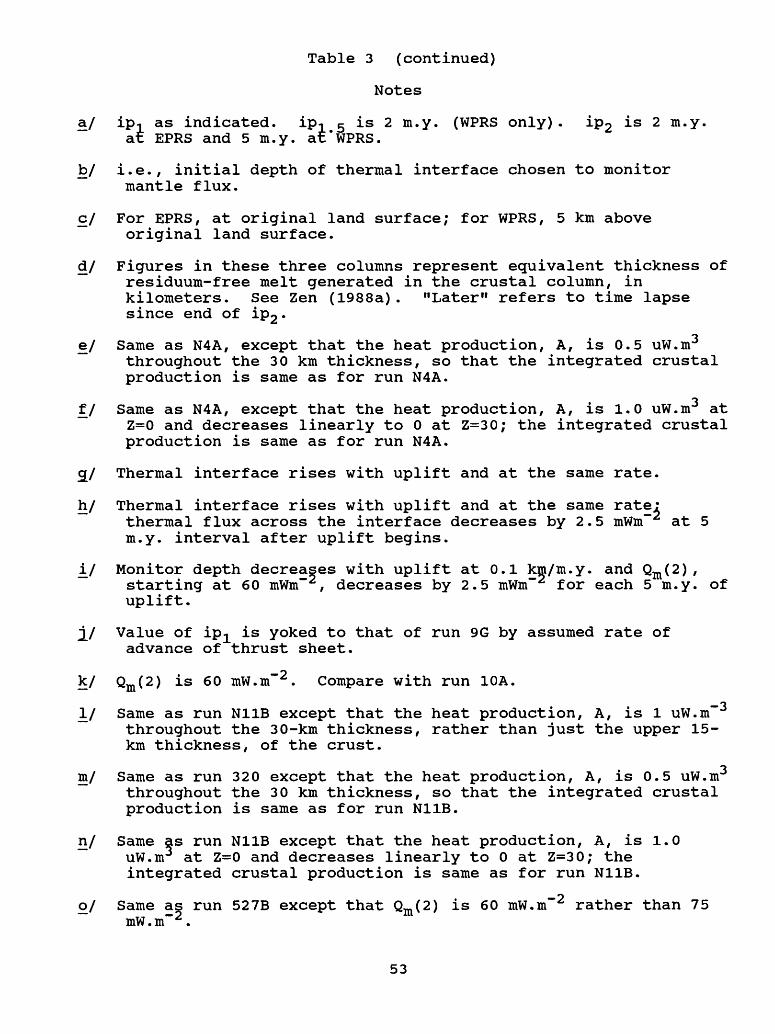
Table 3 (continued)
Notes
a/ ip. as indicated. iPi.5 is 2 ra.y. (WPRS only). ip2 is 2 m.y. at EPRS and 5 m.y. at*WPRS.
b/ i.e., initial depth of thermal interface chosen to monitor mantle flux.
c/ For EPRS, at original land surface; for WPRS, 5 km above original land surface.
d/ Figures in these three columns represent equivalent thickness of residuum-free melt generated in the crustal column, in kilometers. See Zen (1988a). "Later" refers to time lapse since end of ip2 .
e/ Same as N4A, except that the heat production, A, is 0.5 uW.m3throughout the 30 km thickness, so that the integrated crustal production is same as for run N4A.
of_/ Same as N4A, except that the heat production, A, is 1.0 uW.m at
Z=0 and decreases linearly to 0 at Z=30; the integrated crustal production is same as for run N4A.
2/ Thermal interface rises with uplift and at the same rate.
h/ Thermal interface rises with uplift and at the same rate:thermal flux across the interface decreases by 2.5 mWm at 5 m.y. interval after uplift begins.
d./ Monitor depth decreases with uplift at 0.1 km/m.y. and Qm (2) ,starting at 60 mWirT , decreases by 2.5 mWm"2 for each 5 m.y. of uplift.
jy Value of ip.^ is yoked to that of run 9G by assumed rate of advance of thrust sheet.
k/ Qm (2) is 60 mW.m"2 . Compare with run 10A.
3 I/ Same as run N11B except that the heat production, A, is 1 uW.mthroughout the 30-km thickness, rather than just the upper 15- km thickness, of the crust.
3m/ Same as run 320 except that the heat production, A, is 0.5 uW.m throughout the 30 km thickness, so that the integrated crustal production is same as for run N11B.
n/ Same as run N11B except that the heat production, A, is 1.0 uW.irr at Z=0 and decreases linearly to 0 at Z=30; the integrated crustal production is same as for run N11B.
o/ Same as run 527B except that Qm (2) is 60 mW.irT2 rather than 75 mW.m 2 .
53

£/ Value of ip1 is yoked to those of runs 10A and 10B by assumed rate of advance of thrust sheet. See text for discussion.
g/ Qm( 2 ) is 60 mW.m"2 . Compare with run 9G.
r/ Value of thermal conductivity used is 2.5 W.m K .
54

Table 3 (continued)
Other parameters used in modelling:
Dimensions of model cell: 1 km normally; 0.5 km where necessary.
Thermal conductivity: 2 W.m K
Heat production, A (upper 15 km only): 1 uW.m"" 3 .
Heat capacity, 0.9 kJ.kg"" 1 .!^"" 1 .
Bulk density: 2780 kg.m"3 .
Thermal diffusivity, 8 x 10"7 m2 .s"1 .
Mantle flux before to subduction, Qm (l) : 30 mW.m""2 .
Mantle flux after subduction, Qm (2): 75 mW.m"2 . See notes above.
Fusion Step: 40°C.
Parametric heat of fusion, -hf (Zen, 1988a): 300K
Time interval for adjusting thermal profile: 5 m.y.
First thrust sheet is 6 km thick; second thrust sheet is 10 km thick and is present only at WPRS.
Decompression (uplift balanced by erosion) rate for EPRS is 0.1 km/m.y.; for WPRS is 0.2 m.y.
55
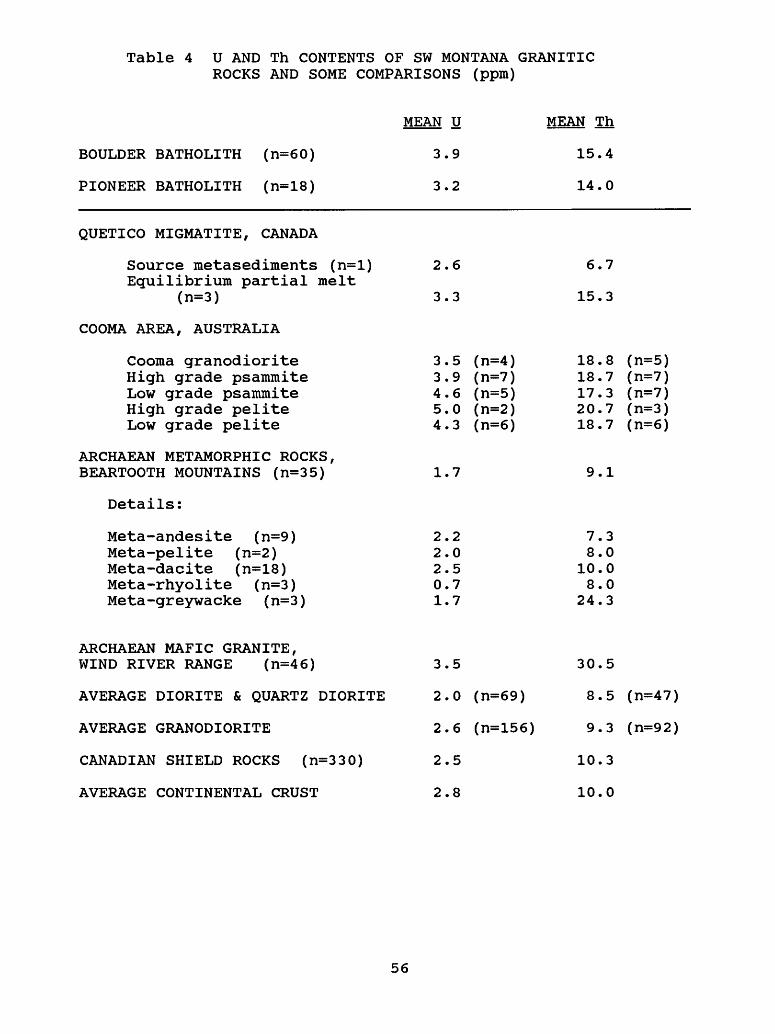
Table 4 U AND Th CONTENTS OF SW MONTANA GRANITIC ROCKS AND SOME COMPARISONS (ppm)
BOULDER BATHOLITH (n=60)
PIONEER BATHOLITH (n=18)
[BAN U
3.9
3.2
MEAN Th
15.4
14.0
QUETICO MIGMATITE, CANADA
Source metasediments (n=l) Equilibrium partial melt
(n=3)
COOMA AREA, AUSTRALIA
Cooma granodiorite High grade psammite Low grade psammite High grade pelite Low grade pelite
ARCHAEAN METAMORPHIC ROCKS, BEARTOOTH MOUNTAINS (n=35)
Details:
Meta-andesite (n=9) Meta-pelite (n=2) Meta-dacite (n=18) Meta-rhyolite (n=3) Meta-greywacke (n=3)
2.6
3.3
1.7
2.2 2.0 2.5 0.7 1.7
6.7
15.3
3.5 (n=4) 3.9 (n=7) 4.6 (n=5) 5.0 (n=2) 4.3 (n=6)
18.8 (n=5) 18.7 (n=7) 17.3 (n=7) 20.7 (n=3) 18.7 (n=6)
9.1
7.38.0
10.08.0
24.3
ARCHAEAN MAFIC GRANITE, WIND RIVER RANGE (n=46)
AVERAGE DIORITE & QUARTZ DIORITE
AVERAGE GRANODIORITE
CANADIAN SHIELD ROCKS (n=330)
AVERAGE CONTINENTAL CRUST
3.5
2.0 (n=69)
2.6 (n=156)
2.5
2.8
30.5
8.5 (n=47)
9.3 (n=92)
10.3
10.0
56
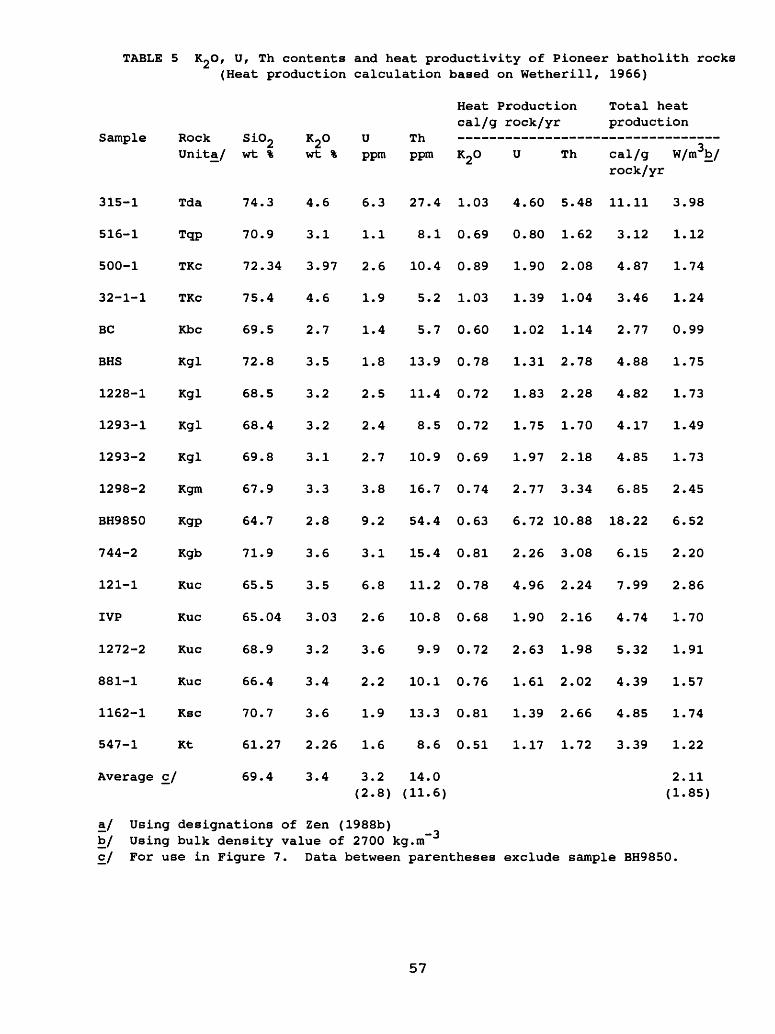
TABLE 5 J^O, U, Th contents and heat productivity of Pioneer batholith rocks (Heat production calculation based on Wetherill, 1966)
Heat Production
Sample
315-1
516-1
500-1
32-1-1
BC
BHS
1228-1
1293-1
1293-2
1298-2
BH9850
744-2
121-1
IVP
1272-2
881-1
1162-1
547-1
Average
Rock Unita/
Tda
Tqp
TKc
TKc
Kbc
Kgl
Kgl
Kgl
Kgl
Kgm
Kgp
Kgb
Kuc
Kuc
Kuc
Kuc
Ksc
Kt
£/
SiO2 wt %
74.3
70.9
72.34
75.4
69.5
72.8
68.5
68.4
69.8
67.9
64.7
71.9
65.5
65.04
68.9
66.4
70.7
61.27
69.4
K2°wt %
4.6
3.1
3.97
4.6
2.7
3.5
3.2
3.2
3.1
3.3
2.8
3.6
3.5
3.03
3.2
3.4
3.6
2.26
3.4
Uppm
6.3
1.1
2.6
1.9
1.4
1.8
2.5
2.4
2.7
3.8
9.2
3.1
6.8
2.6
3.6
2.2
1.9
1.6
3.2(2.8)
Th ppm
27.4
8.1
10.4
5.2
5.7
13.9
11.4
8.5
10.9
16.7
54.4
15.4
11.2
10.8
9.9
10.1
13.3
8.6
14.0(11.6)
cal/g
K20
1.03
0.69
0.89
1.03
0.60
0.78
0.72
0.72
0.69
0.74
0.63
0.81
0.78
0.68
0.72
0.76
0.81
0.51
rock/yr
U
4.60
0.80
1.90
1.39
1.02
1.31
1.83
1.75
1.97
2.77
6.72
2.26
4.96
1.90
2.63
1.61
1.39
1.17
Th
5.48
1.62
2.08
1.04
1.14
2.78
2.28
1.70
2.18
3.34
10.88
3.08
2.24
2.16
1.98
2.02
2.66
1.72
Total heatproduction
cal/g rock/yr
11
3
4
3
2
4
4
4
4
6
18
6
7
4
5
4
4
3
.11
.12
.87
.46
.77
.88
.82
.17
.85
.85
.22
.15
.99
.74
.32
.39
.85
.39
W/m3b/
3.98
1.12
1.74
1.24
0.99
1.75
1.73
1.49
1.73
2.45
6.52
2.20
2.86
1.70
1.91
1.57
1.74
1.22
2.11(1.85)
a/ Using designations of Zen (1988b)b/ Using bulk density value of 2700 kg.m£/ For use in Figure 7. Data between parentheses exclude sample BH9850.
57

FIGURE CAPTIONS
Figure 1. Index map showing distribution of plutons and other geological features referred to in the text. The East Pioneer Reference Site (EPRS) and the West Pioneer Reference Site (WPRS) are indicated. Geological features in the area between 45 30' and 45°45'N and between 112°45' and 113 O7'30"W are generalized from Zen (1988b); areas outside are generalized from Ruppel and others (1983), and from Snee (1982). Area underlain by plutons are ornamented. Areas underlain by rocks of the Wise River thrust sheet (WRT) are shown separately only east of the Fourth of July fault system.
Figure 2. Schematic representation of the sequence of thrusting, erosion, igneous intrusion, and high-angle faulting in the Pioneer Mountains. (A), arrival of the thrust sheets. (B) , emplacement of the plutons; their tops are arbitrarily set at the present level of erosion. (C) , displacement on the Fourth of July fault system downdropping the west Pioneer block. (D) , erosion to the present time. EPRS and WPRS are the two reference sites. Dotted lines schematically connect the panels for the west and east Pioneers. Long dashed lines on (B) are the original surfaces of the thrust sheets, and the distance between a given dashed line and the next lower solid line defines the amount of crust removed by erosion up to the specified time. The upper thrust plate rests on the Pattengail thrust (PT) ; the lower thrust plate rests on the Wise River thrust (WRT; Zen, 1988b) , which rests on the autochthon (AC) .
Figure 3. Nominal cooling history of a pluton given by the difference between the argon spectrum ages of hornblende and biotite ("t^vj-kt) / as a function of depth of intrusion. Distance from sample location (WPRS) to the margin of the pluton, assumed to be the roof, is 0.5 km. Solid curve, calculated from conduction model of heat flow. Dashed curves, linear cooling model used by Snee (1982) .
Figure 4. SiO^ versus thorium and uranium contents of the Pioneer batholith rocks, and comparison with the Boulder batholith rocks shown generalized as a distribution field (Tilling and Gottfried, 1969) .
Figure 5. Thorium and uranium contents versus K2O content of Pioneer batholith, and comparison with the Boulder batholith rocks shown generalized as a distribution field (Tilling and Gottfried, 1969) . The number "3" refers to triplication of data points.
Figure 6. Weight percent SiO^ versus K^O/ (K2O+Na2O) plot of Pioneer batholith rocks (circles) and or the Proterozoic gneiss- and-amphibolite unit (Xga, crosses) , compared to the Main Series (solid line) and the Sodic Series (dashed line) of the Boulder batholith (Tilling, 1973) . The number "2" refers to duplication of data points.
58

Figure 7. (A) SiO2 and (B) K^O contents versus heat productivity. Comparison of Pioneer batholith rocks with those of the Boulder batholith, shown as the trend line given by Tilling and others (1970). Average values for the Pioneer batholith rocks (n=17) excluding one anomalous value are given by stars.
Figure 8. Four possible distributions of heat productivity, A, in the crust. (A), A=l uW.m , confined to the upper 15 km only, A=0 below that depth. (B), A=0.5 uW.m , distributed throughout the 30 km of crust, so that the integrated value of A for the entire crust remains the same. (C), A=l uW.m at Z=0, decreasing linearly to A=0 at Z=30, so that the integrated value of A for the entire crust remains the same. (D), A=AQe~ z ' D ; where AQ=1 uW.m and D=18.825, so that the integrated value of A for the entire crust remains the same.
Figure 9. Temperature evolution at chosen depths for selected runs. (A), key that relates tectonic events and incubation periods to changes in the curves. (B), Run 10A. (C), Run 9G. (D), Run 11A. (E), Run 11B. (F), Run 9A. (G), Run 10C. (H), Run 10B. (I), Run 9F. See text for discussion; see Table 3 for model parameters.
59
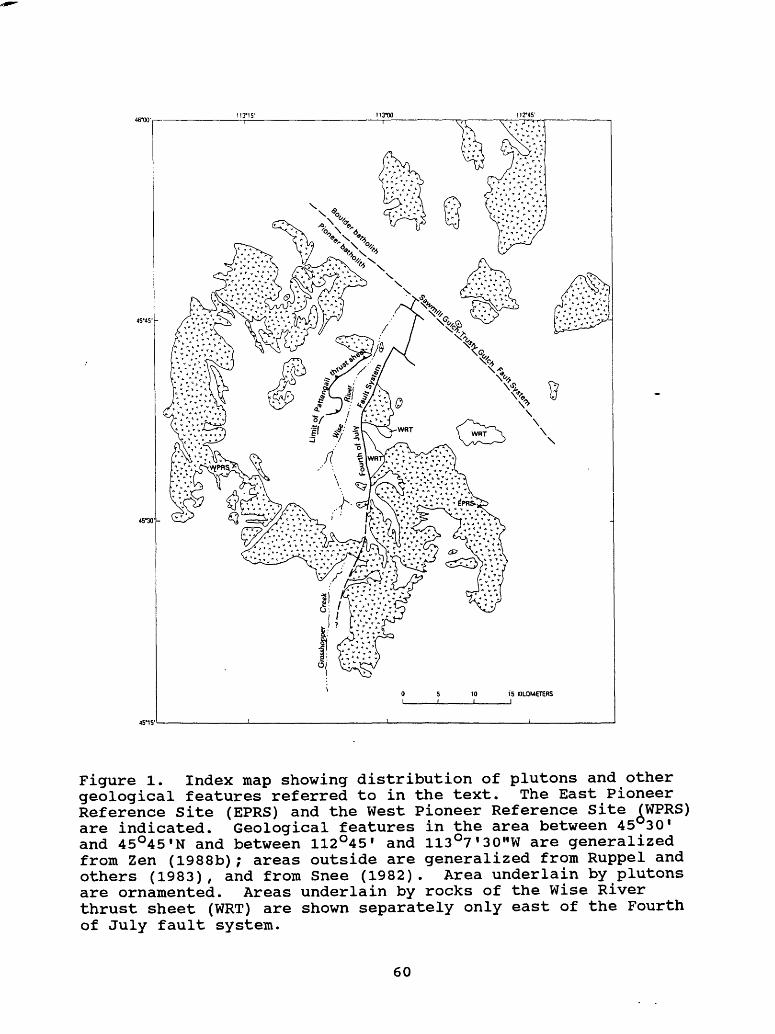
Figure 1. Index map showing distribution of plutons and other geological features referred to in the text. The East Pioneer Reference Site (EPRS) and the West Pioneer Reference Site (WPRS) are indicated. Geological features in the area between 45 30 and 45°45'N and between 112O45* and 113°7 I 30"W are generalized from Zen (1988b); areas outside are generalized from Ruppel and others (1983), and from Snee (1982). Area underlain by plutons are ornamented. Areas underlain by rocks of the Wise River thrust sheet (WRT) are shown separately only east of the Fourth of July fault system.
60

w
Pattengail thrust
E
-76 Ma
Wise River thrust WRTAutochthon Autochthon
-73 Ma
WRT
Figure 2. Schematic representation of the sequence of thrusting, erosion, igneous intrusion, and high-angle faulting in the Pioneer Mountains. (A), arrival of the thrust sheets. (B), emplacement of the plutons; their tops are arbitrarily set at the present level of erosion. (C), displacement on the Fourth of July fault system downdropping the west Pioneer block. (D), erosion to the present time. EPRS and WPRS are the two reference sites. Dotted lines schematically connect the panels for the west and east Pioneers. Long dashed lines on (B) are the original surfaces of the thrust sheets, and the distance between a given dashed line and the next lower solid line defines the amount of crust removed by erosion up to the specified time. The upper thrust plate rests on the Pattengail thrust (PT); the lower thrust plate rests on the Wise River thrust (WRT; Zen, 1988b), which rests on the autochthon (AC).
61

10
EPRS = 4 km.
10 12 14
Depth in km. of top of a 10- km. thick pluton
Figure 3. Nominal cooling history of a pluton given by the difference between the argon spectrum ages of hornblende and biotite (~thb_bt), as a function of depth of intrusion. Distance from sample location (WPRS) to the margin of the pluton, assumed to be the roof, is 0.5 km. Solid curve, calculated from conduction model of heat flow. Dashed curves, linear cooling model used by Snee (1982).
62

40
35
30
E 25a a
jE 20
15
45 50 55 60 65 70 75 80
55 60 65
SiO2, wt %
Figure 4. SiO2 versus thorium and uranium contents of the Pioneer batholith rocks, and comparison with the Boulder batholith rocks shown generalized as a distribution field (Tilling and Gottfried, 1969).
63

Figure 5. Thorium and uranium contents versus K2O content of Pioneer batholith, and comparison with the Boulder batholith rocks shown generalized as a distribution field (Tilling and Gottfried, 1969). The number "3" refers to triplication of data points.
64

0.8
0.6
0.4
0.2
0.050 60
Si02, wt %
70 80
Figure 6. Weight percent SiO2 versus K^O/(K2O+Na2O) plot of Pioneer batholith rocks (circles) and of the Proterozoic gneiss- and-amphibolite unit (Xga, crosses), compared to the Main Series (solid line) and the Sodic Series (dashed line) of the Boulder batholith (Tilling, 1973). The number "2" refers to duplication of data points.
65
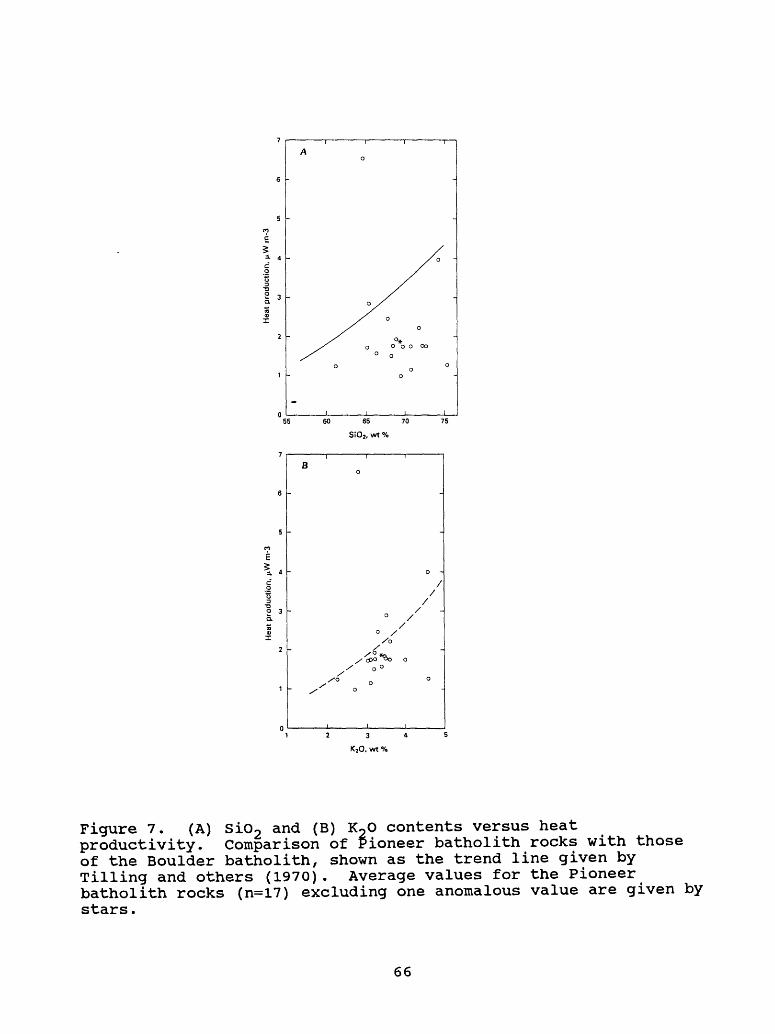
2 3
60 65 70
SiO2, wt %
o
/
0 //o
2 3
KjO, wt %
Figure 7. (A) SiO2 and (B) K2 <D contents versus heat productivity. Comparison of Pioneer batholith rocks with those of the Boulder batholith, shown as the trend line given by Tilling and others (1970). Average values for the Pioneer batholith rocks (n=17) excluding one anomalous value are given by stars.
66

A, juWnrr3
0.5 1.0
10
E ^M
20
30
Figure 8. Four possible distributions of heat productivity, A, in the crust. (A), A=l uW.m , confined to the upper 15 km only, A=Q below that depth. (B), A=0.5 uW.m", distributed throughout the 30 km of crust, so that the integrated value of A for the entire crust remains the same. (C), A=l uW.nT3 at Z=0, decreasing linearly to A=0 at Z=30, so that the integrated value of A for the entire crust remains the same. (D), A=AQ& ' ; where AQ=1 uW.m" 3 and 0=18.825, so that the integrated value of A for the entire crust remains the same.
67

ip(2)
Figure 9 (A). Key relating tectonic events and incubation periods to changes in the curves for temperature evolution at chosen depths. See text for discussion; see Table 3 for model parameters.
68

H>
^j
O
H-
M>
hO
CD
W ^-s
(D
WM
(D O
ft
ft
!*
(D
h
& O
WW
^^
i n
-
(D
Dep
th,
kmD
epth
, km
Ok 10
H f
tO
£>
H
(D (D*O
O H
- o
10 P
J O
rt
O !*^ O
a w
^ (
D
Dep
th,
km
&
&!
S
S
S~\
i i
r
a
s
T
Dep
th,
km
£
(D

H
H)
>7J
O
O
H-
td n
<JQ
£
H)
4
O
(D
j_j
W ^
(D
*d
fl>
O ft
rt U
(D
^a o
W ^
fl> fl>
Dep
th,
kmD
epth
, km
ou
io
0
100
200
300
400
500
600
700
600
900
10001100
/rature
evolutio
n at
chosen
dept
hs n 9A.
(G
) , Ru
n 10C.
(H)
, Run
Dep
th,
km
' 8
J
' '
ft
' ^x
-^
" 1
- °
% £
^-'
CA
*
: ! <
f^*'
r
& (
B. "1»
- fi
I ,\
8
:«
^il
\
» f
- 1 \
s
^s-!
a