U.S. Department of Energy: State of Clean Cities Program ... · State of Clean Cities Program...
27
U.S. Department of Energy: State of Clean Cities Program Vehicle Technology Deployment Efforts Mike Scarpino National Energy Technology Laboratory Clean Cities Team Leader February 28, 2008
-
Upload
truongtuyen -
Category
Documents
-
view
217 -
download
1
Transcript of U.S. Department of Energy: State of Clean Cities Program ... · State of Clean Cities Program...

U.S. Department of Energy:State of Clean Cities Program
Vehicle Technology Deployment Efforts
Mike ScarpinoNational Energy Technology Laboratory
Clean Cities Team Leader
February 28, 2008

Goal: Petroleum ReductionGoal: Petroleum Reduction
How to Achieve the Goal …
Redu
ceReplace
Eliminate

Clean Cities Clean Cities A voluntary, locallyA voluntary, locally--based government/industry partnershipbased government/industry partnership
• Established in 1993 in response to the Energy Policy Act (EPAct) of 1992
• Companion program to the EPACT mandates requiring certain fleets to acquire AFVs (Federal, State, and Fuel provider fleets)
Mission: To advance the energy, economic, and environmental security of the U.S. by supporting local decisionsto adopt practices that contribute to the reduction of petroleum
consumption in the transportation sector.

Clean Cities Today: 85+ Active Coalitions in 45 States


National Renewable Energy Lab (NREL – Colorado) – Clean Cities Core program technical support , AFDC, technical communications,publications, Clean Cities Web sites, Hotline Response Service
Oak Ridge National Lab (ORNL - Tennessee) – Federal Fuel Economy Guide, FuelEconomy.Gov websites, National Fuel Economy consumer education and outreach efforts
Brookhaven National Lab (BNL – New York) - BioMethane and Land fill gas recovery
Argonne National Lab (ANL – Illinois) - Emissions Modeling (GREET and AIRCRED) and Idle Reduction analysis
National Energy Technology Lab (NETL – Project Management and Regional coordination of key Clean Cities activities)
National Laboratory Support

Clean Cities Program Structure

VT Deployment Focus AreasVT Deployment Focus Areas
1.1. Accelerated Biofuels InitiativeAccelerated Biofuels Initiative-- Accelerate BioFuels Infrastructure Development Efforts, Consumer Outreach, and Technical Support Efforts.
2.2. Technology Deployment & DemonstrationsTechnology Deployment & Demonstrations-- Niche Market Fleet, Adv Vehicle Demos (PHEVs, HD HEVs, FCVs, Clean diesel)
3.3. Consumer Information & EducationConsumer Information & Education-- Fuel Economy.Gov (General outreach activities for consumers to make educated choices for new vehicle purchases
4.4. Strengthening CoalitionsStrengthening Coalitions-- RDS contract, specialized training & workshops
5.5. Expanded National PartnershipsExpanded National Partnerships-- Work w/ Verizon, Enterprise, Kroger, etc.
6.6. Addressing Technical Barriers & Technical Assistance for Early Addressing Technical Barriers & Technical Assistance for Early AdoptersAdopters-- Coordinate specialized training and outreach to public safety officials, first responders, fleet maintenance personnel, etc. Distribute incident response procedures and guidelines. UL certifications. CNG Cylinder Program.

Clean Cities Technology PortfolioClean Cities Technology Portfolio(Fuel/Technology Neutral Approach)(Fuel/Technology Neutral Approach)Alternative FuelsIncrease vehicle & infrastructure• Electricity• Ethanol• Propane• Natural Gas • Hydrogen• Biodiesel (B100)
Idle ReductionIncrease Technology Use/Practices• Heavy-duty trucks• Transit/School Buses• Adoption of Idle Reduction
policies and practices
Blended FuelsIncrease Use of BlendsLow levels of alternative fuels with conventional fuels (B2, B5 and B20)
HybridsExpanding Market for vehiclesLight- and heavy-duty hybrids
Fuel EconomyIncrease fuel efficient technologies and practicesMore Fuel-efficient vehicles, light weight materials, behavioral changes, vehicle maintenance initiatives, etc.

VT (Clean Cities) Deployment BudgetVT (Clean Cities) Deployment Budget$ Millions
0
2
4
6
8
10
12
14
FY-00 FY-01 FY-02 FY-03 FY-04 FY-05 FY-06 FY-07 FY-08 FY-09
Appropriated Request

2006 Portfolio Performance2006 Portfolio Performance• 2006 is the third year of the expanded Clean Cities
portfolio and the online data reporting system• Note: In 2005 the Clean Cities’ annual fuel
displacement potential was estimated to be roughly 2.5 billion GGE per year in 2020
• 2006 survey results exceeded goal for the year– Goal for 2006 was 292 million GGE displaced– Actually achieved 360 million GGE displaced through
coalition and ORNL fuel economy efforts• 83 coalitions submitted reports with an average of
3.5 million GGE displaced per coalition

2006 Petroleum Reduction Breakdown 2006 Petroleum Reduction Breakdown (in millions of (in millions of GGEsGGEs))
• AFVs continue to account for lion’s share of the displacement• Fuel Economy is next, with significant potential for growth
*Data as of 9-19-07In 2004, Clean Cities Celebrated Beyond A Billion.
The program should surpass 2 Billion in 2008
Technology GGEs Percentage of TotalAFVs 253 70%HEVs 9 2%Blends 10 3%Fuel Economy 80 22%Truck Electrification 8 2%Total 360 100%

Electric, 2.1%
LNG, 5.9%
B100, 6.5%
LPG, 15.1%
B20, 16.5%E85, 24.2%
CNG, 29.7%
Clean Cities and Alternative FuelsClean Cities and Alternative Fuels• During 2006, Clean Cities
efforts led to the displacement of 360 million gallons of petroleum– 50% increase from 2005
• Alternative fuels and AFVs represent 70% of displacement– Number of refueling stations
offering E-85 doubled in 2006, and continues to increase
– CNG contribution mainly from HD trucks and transit buses

B20, 21.1%
CNG, 34.9%
LPG, 20.1%
E85, 15.6%
Electric, 2.0%
B100, 1.1%
LNG, 5.2%
0.0% 5.0% 10.0% 15.0% 20.0% 25.0% 30.0% 35.0% 40.0%
B100
Electric
LNG
E85
LPG
B20
CNG
AFV Petroleum Displacement TrendsAFV Petroleum Displacement Trends
2006
2005
E85, 24.2%
CNG, 29.7%
B20, 16.5%
LPG, 15.1%
LNG, 5.9%
Electric, 2.1%
B100, 6.5%
0.0% 5.0% 10.0% 15.0% 20.0% 25.0% 30.0% 35.0% 40.0%
Electric
LNG
B100
LPG
B20
E85
CNG
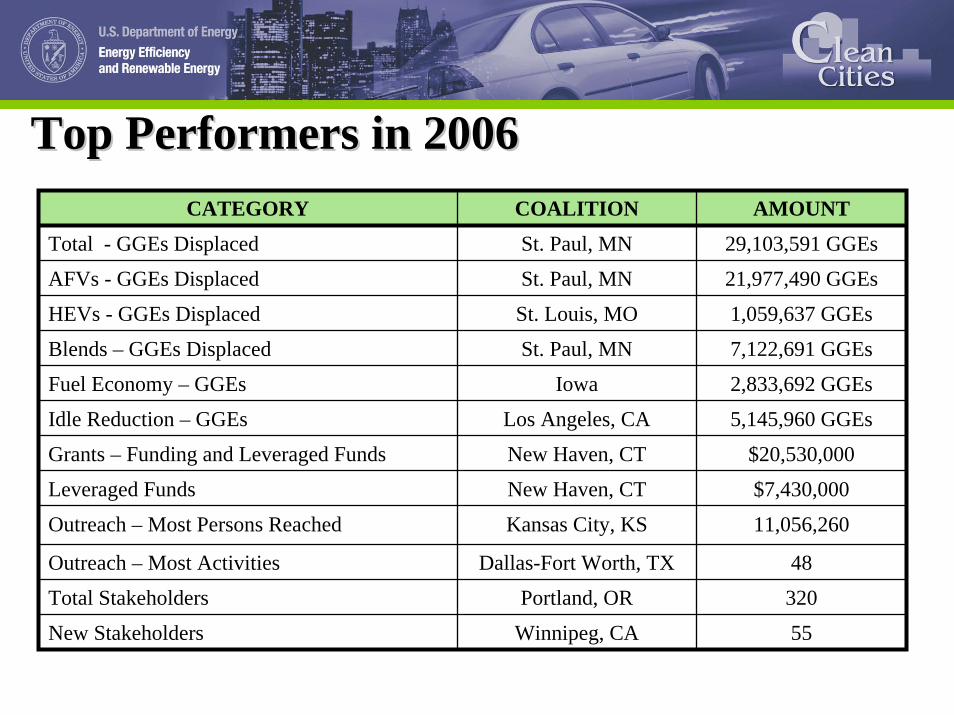
Top Performers in 2006Top Performers in 2006CATEGORY COALITION AMOUNT
Total - GGEs Displaced St. Paul, MN 29,103,591 GGEs
AFVs - GGEs Displaced St. Paul, MN 21,977,490 GGEs
HEVs - GGEs Displaced St. Louis, MO 1,059,637 GGEs
Blends – GGEs Displaced St. Paul, MN 7,122,691 GGEs
Fuel Economy – GGEs Iowa 2,833,692 GGEs
Idle Reduction – GGEs Los Angeles, CA 5,145,960 GGEs
Grants – Funding and Leveraged Funds New Haven, CT $20,530,000
Leveraged Funds New Haven, CT $7,430,000
Outreach – Most Persons Reached Kansas City, KS 11,056,260
Outreach – Most Activities Dallas-Fort Worth, TX 48
Total Stakeholders Portland, OR 320
New Stakeholders Winnipeg, CA 55

Technology Demonstrations:Technology Demonstrations:
DOE is investing $8.6 million (from 2006-2008) in cooperative agreements with Clean Cities Partners:
– E85 refueling projects in CA, OR, CO, IA, IN, KY, TN, AL, VA, MD, DC, NC,SC, GA and NY
– Ethanol, biodiesel, natural gas and propane infrastructure and vehicle acquisition.
– Partners are investing >$16 million in these projects for a total of more than $25 million

Consumer Information and Education
(tools & services)
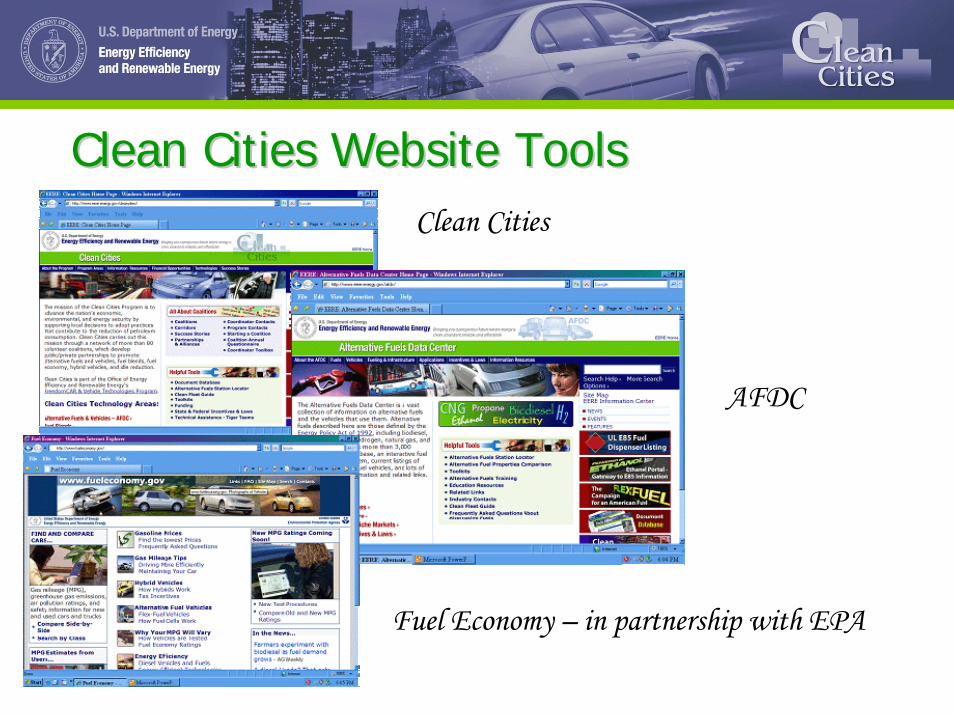
Clean Cities Website ToolsClean Cities Website ToolsClean Cities
AFDC
Fuel Economy – in partnership with EPA

Alternative Fuels HotlineAlternative Fuels Hotline• 1-877-337-3463• Available 9:00 a.m. – 6:00 p.m. EST• [email protected]


New Features
•Energy Impact Score
•Carbon Footprint
(created to help emphasize the benefits of alternative fuels and petroleum reduction)

Fuel economy goes mobile at fueleconomy.gov/m
• New mobile site designed for access via PDA, cell phones, and other mobile devices
• Access fuel economy and related information at your convenience anywhere, anytime
• View– EPA mileage ratings for all cars and
light trucks sold in the U.S. back to model year 1985
– Annual fuel cost estimates– Annual petroleum use (barrels of
domestic & imported petroleum)– Carbon footprint (tons of carbon
dioxide emitted annually)

FuelEconomy.gov/mat a glance

-- BioTownBioTown USAUSA-- Ethanol Goes Racing !Ethanol Goes Racing !-- Vehicle Road Tests with new emphasis Vehicle Road Tests with new emphasis
on Fuel Economy and Energy Securityon Fuel Economy and Energy Security-- Alternative Fuels Motor NewsAlternative Fuels Motor News
DOE Relationship with PBS since 2001DOE Relationship with PBS since 2001(airs weekly on PBS, SPEED, AF Network)(airs weekly on PBS, SPEED, AF Network)
Past Show Topics:Past Show Topics:(over 50 show topics featuring DOE focus areas)(over 50 show topics featuring DOE focus areas)
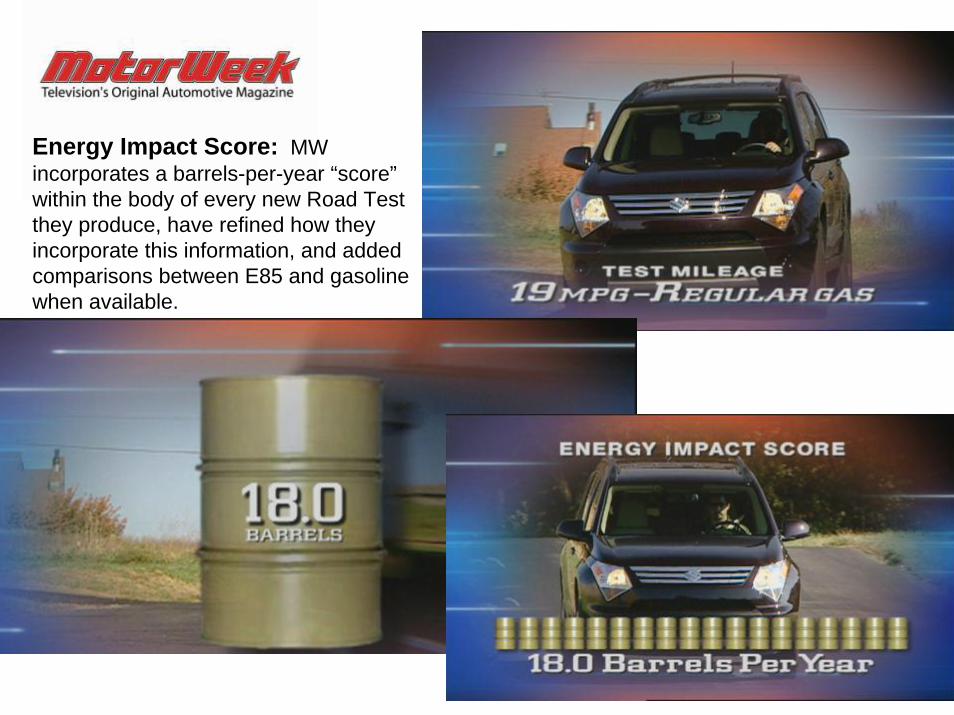
Energy Impact Score: MW incorporates a barrels-per-year “score”within the body of every new Road Test they produce, have refined how they incorporate this information, and added comparisons between E85 and gasoline when available.

QUESTIONSQUESTIONS&&
DISCUSSIONDISCUSSION

Contact Information:Contact Information:
Mike ScarpinoU.S. Department of EnergyNational Energy Technology LaboratoryOffice: 412-386-4726E-mail: [email protected]
Website: www.eere.energy.gov/cleancities/Clean Cities Hotline: 1-800-CCITIES