US Department of Agriculture Forest Service Cle Elum ......portion of what was the Wenatchee...
26
US Department of Agriculture Forest Service Pacific Northwest Research Station Cle Elum Spotted Owl Demography Study 2017 Annual Report January, 2018 1. Title Demography of Spotted Owls on the East Slope of the Cascade Range, Washington, 1989-2017. 2. Principal Investigator and Research Team Dr. Damon Lesmeister (PI), USDA Forest Service, Pacific Northwest Research Station and Department of Fisheries and Wildlife, Oregon State University, Corvallis, OR. Lead Biologist: S. Sovern, Department of Fisheries and Wildlife, Oregon State University, Corvallis, Oregon. Biologist: A. Mikkelsen, Department of Fisheries and Wildlife, Oregon State University, Corvallis, Oregon; 3. Introduction Background and potential benefits or utility of the study This study is one of eight long-term demographic studies in the Regional Monitoring Program for the northern spotted owl (Lint et al. 1999). The study was initiated in 1989. This study was designed to collect long-term information on survival and reproductive rates of spotted owls on the east slope of the Cascade Mountains in Washington. This information is needed to assess the status of the owl population in this province. In combination with data from other study areas in Washington and Oregon, information from the Cle Elum Study Area is used to assess region-wide trends in the spotted owl population (Forsman et al. 1996, Franklin et al. 1999, Lint et al. 1999, Anthony et al., 2006, Forsman et al. 2011, Dugger et al. 2016). In addition, the long-term dataset obtained during this study has provided the baseline for a pilot study of the effect of barred owl removal on spotted owl demographics (see below). Study Objectives Determine demographic trends of spotted owls on the east slope of the Cascade Range in Washington, to include age-and-sex-specific survival rates, reproductive rates, and overall population trend. 4. Study Area The Cle Elum Study Area includes a 1,787 km 2 General Study Area (GSA), and a 204 km 2 Density Study Area (DSA) that is contained within the GSA (Figure 1). The U. S. Forest Service currently administers approximately 60% of the area within the GSA. The GSA and DSA are composed of 34% and 88% designated Late Successional Reserves (LSR), respectively. These LSR’s were allocated by the Northwest Forest Plan to benefit species associated with late successional forest (USDA and USDI 1994). In October 2013, the Washington State Department of Natural Resources purchased more than 20,000 ha (~50,000 acres) of private land located mostly in the Teanaway river drainage.
Transcript of US Department of Agriculture Forest Service Cle Elum ......portion of what was the Wenatchee...
US Department of Agriculture Forest Service
Pacific Northwest Research Station
Cle Elum Spotted Owl Demography Study
2017 Annual Report
January, 2018
1. Title
Demography of Spotted Owls on the East Slope of the Cascade Range, Washington, 1989-2017.
2. Principal Investigator and Research Team Dr. Damon Lesmeister (PI), USDA Forest
Service, Pacific Northwest Research Station and Department of Fisheries and Wildlife, Oregon
State University, Corvallis, OR.
Lead Biologist: S. Sovern, Department of Fisheries and Wildlife, Oregon State University,
Corvallis, Oregon.
Biologist: A. Mikkelsen, Department of Fisheries and Wildlife, Oregon State University,
Corvallis, Oregon;
3. Introduction
Background and potential benefits or utility of the study
This study is one of eight long-term demographic studies in the Regional Monitoring
Program for the northern spotted owl (Lint et al. 1999). The study was initiated in 1989. This
study was designed to collect long-term information on survival and reproductive rates of spotted
owls on the east slope of the Cascade Mountains in Washington. This information is needed to
assess the status of the owl population in this province. In combination with data from other
study areas in Washington and Oregon, information from the Cle Elum Study Area is used to
assess region-wide trends in the spotted owl population (Forsman et al. 1996, Franklin et al.
1999, Lint et al. 1999, Anthony et al., 2006, Forsman et al. 2011, Dugger et al. 2016). In
addition, the long-term dataset obtained during this study has provided the baseline for a pilot
study of the effect of barred owl removal on spotted owl demographics (see below).
Study Objectives
Determine demographic trends of spotted owls on the east slope of the Cascade Range in
Washington, to include age-and-sex-specific survival rates, reproductive rates, and overall
population trend.
4. Study Area
The Cle Elum Study Area includes a 1,787 km2 General Study Area (GSA), and a 204
km2 Density Study Area (DSA) that is contained within the GSA (Figure 1). The U. S. Forest
Service currently administers approximately 60% of the area within the GSA. The GSA and
DSA are composed of 34% and 88% designated Late Successional Reserves (LSR), respectively.
These LSR’s were allocated by the Northwest Forest Plan to benefit species associated with late
successional forest (USDA and USDI 1994).
In October 2013, the Washington State Department of Natural Resources purchased more
than 20,000 ha (~50,000 acres) of private land located mostly in the Teanaway river drainage.

The most recent landowner of these parcels was American Forest Holdings LLC., but the land
was originally owned by Boise Cascade Corp. In October, 2014, The Nature Conservancy
purchased over 19,000 ha (~48,000 acres) of land formerly owned by Plum Cr. Timber. These 2
purchases effectively assigned the management of nearly all private lands within the GSA to
these 2 entities.
5. Methods
Survey design
Within the GSA we surveyed all historic owl territories each year using standard
protocols to locate and confirm previously banded owls, and to determine the number of young
produced at each territory (Forsman 1983, Franklin, et al., 1996, Lint et al., 1999). The extent of
the survey of owl territories accounted for neighboring owls, but generally encompassed
approximately a 2.5 km radius around historic territory centers. Any new owls as well as young
of the year were banded for mark-recapture analysis. We attempted a complete count of Spotted
Owls in the DSA each year beginning in 1991. The DSA survey involved reproducing spotted
owl calls at each established call station on 3 occasions during the March–August field season
(Forsman 1983, Lint et al. 1999, Reid et al. 1999). Call stations were positioned to achieve a
100% auditory coverage of the entire DSA.
Field methods
Our owl surveys consisted of broadcasting or imitating owl calls at mapped calling
stations distributed throughout the study area. Calling stations lasted 10 minutes. Usually initial
calling stations were surveyed at night, but in some cases, such as poor access or other safety or
logistical concerns, stations were surveyed during the day only. When spotted owls were heard
responding to our calls at night, we returned for a follow-up visit, usually the next day, to attempt
to locate the owl. If we located owls during daytime visits, we offered the owl mice and
attempted to capture and band the owl, if necessary. By offering the owls mice, we were
generally able to determine nesting status and locate fledglings. Our field protocols can be found
in Franklin, et al. (1996) and Lint et al. (1999).
Owls were captured with a noose pole (Forsman 1983), and banded with a numbered
USFWS 7B locking aluminum band and a colored plastic band. This banding method generally
allowed us to determine the identity of owls in successive years without having to recapture
them. During handling, owls were weighed and a variety of measurements were taken. Owls
were released within 20 minutes in the immediate vicinity of where they were captured.
The range of the barred owl now overlaps the range of the northern spotted owl, and the
potential for the barred owl to negatively affect the spotted owl population has been a concern
for many years (Taylor and Forsman 1976, Courtney et al. 2004). Kelly et al. (2003) found that
apparent occupancy and reproduction of spotted owls were lower when barred owls were
detected nearby, and recent analyses have documented competition between barred owls and
spotted owls (Dugger et al. 2011, Sovern et al. 2014, Wiens et al. 2014, Dugger et al. 2016).
Thus, monitoring the number of inhabited barred owl territories is an important index to measure
the effect of barred owls on spotted owl population trends (Olson et al. 2005). During our
spotted owl surveys, we recorded data for barredoOwl responses, as well as other owl species.
Analytical methods
Every 5 years, a meta-analysis of mark-recapture data of spotted owls from 11 study
areas is conducted as a component of effectiveness monitoring of the Northwest Forest Plan.

The meta-analysis includes Cormack-Jolly_Seber open population modeling of mark-recapture
data (Lebreton et al. 1992), a reparameterization of the Jolly-Seber capture- recapture model to
estimate annual population change and recruitment (Pradel 1996), a mixed effects linear model
of reproductive data, and a 2-species territory occupancy model (MacKenzie et al. 2002). The
results of the most recent workshop can be found in Dugger et al. (2016). The previous
workshop occurred in 2009, and the results from that analysis were published in Forsman et al.
(2011).
A USGS study to test the response of the spotted owl population to the removal of barred
owls began on the GSA in 2015 (USFWS 2011). This study involved surveying the entire GSA
for barred owls by broadcasting barred owl calls, and removing barred owls from a portion of the
GSA while monitoring the population throughout the GSA (a Before-After-Control-Impact study
design).
6. Results Population trends
Key findings of the 2014 meta-analysis of spotted owl demography data (Dugger et al.
2016) were: 1) there was strong evidence of population declines in spotted owls on most study
areas examined (including the Cle Elum Study Area); and 2) barred owl presence had a generally
negative effect on demographic rates of spotted owls. The estimate of mean annual rate of
population change (λ) for the Cle Elum Study Area was 0.916 (95% CI 0.894 – 0.938),
indicating an annual population decline of 8.4% (95% CI 6.2 – 10.6%). This estimate shows a
steeper decline in spotted owl numbers than the estimate in Forsman et al. 2011 (6.3%).
Number of territories where spotted owls were detected
General Study Area
In 2017, we banded 7 juvenile owls, bringing the total number of owls banded during
1989-2017 to 882 (168 adults, 70 subadults, and 644 juveniles, Table 1). Our monitoring effort
has remained relatively consistent after 1992, except for 7-10 territories we began monitoring
with only 1 visit per year beginning in 2002. None of these “minimum-protocol” territories
contained owls in 2017. We confirmed the bands of 15 spotted owls, and detected 21 spotted
owls on 16 territories (Figure 2). This compares to a high of 120 owls on 64 territories in the
same area in 1992 (a decline of approximately 83%, Figure 2, Table 2). The ratio of
males:females has increased again in the last 3 years (Figure 8).
Elsewhere on the Okanogan-Wenatchee National Forest, we continued banding owls on a
portion of what was the Wenatchee Demography Study Area (WEN). The WEN was monitored
by National Council for Air and Stream Improvement from 1990-2003, in cooperation with the
Wenatchee National Forest. We banded 1 new owl at 10 inhabited territories on the WEN, and
changed bands or confirmed bands on 7 non-juvenile owls. We surveyed 33 territories to
protocol.
Density Study Area
We detected 5 spotted owls on the DSA in 2017. The DSA survey data indicate an
overall decline in the number of owls detected since 1991. However, we have noted a slight
increase in numbers since the low in 2011 (Figure 3).
Age distribution

We can accurately age spotted owls if they are originally banded as fledglings or
subadults. We can only estimate the age of unbanded adult immigrants. Figure 7a shows the
relative number of known-age spotted owls in each age class in each year. A notable feature in
Figure 7a is the very low number of females in the young age classes in the sample in 2000-
2006. This is likely because the last high overall reproductive year was 1998. After 1998, there
were several years with below average reproductive output (Figure 4) in conjunction with a
severe population decline (Figure 2), where the empirical estimate of population size went from
78 in 1998 to 44 in 2002 (a decline of approximately 43%). Male numbers do not follow the
same trend—males in the younger age classes were still recruited into the sample during this
period. Figure 7b shows the average age of spotted owls in the sample by year. In order to
minimize the bias against the older age classes in early years of the study, Figure 7b shows the
average age of owls of each sex starting with the year when owls below the 90th percentile of
maximum age (males = 12, females = 14) would likely have died. The estimates of average age
are sensitive to cases where we do not detect a few of the older owls in the population, and then
detect them in later years where they increase the average. Also, owls that immigrate into the
population as adults do not get counted in this subsample, because in most cases, we cannot
determine their precise age. There is some indication that the average age for females has
increased 2003-2017, but male average age does not appear to have increased.
Barred owls
General Study Area
We recorded 27 barred owl responses in the GSA in 2017 during our spotted owl surveys.
Based on how these responses were situated temporally and/or geographically, we believe the
responses represent 21 inhabited barred owl territories. Due to limited resources, we did not
attempt to determine whether the responses represented nesting pairs. The proportion of spotted
owl territories where we detected at least 1 barred owl has increased through time on the Cle
Elum Study Area. However, the increase is not as sharp as in other study areas within the range
of the spotted owl (Dugger et al. 2016).
The barred owl removal project crew removed 125 barred owls from the treatment
portion of the Cle Elum Study Area in winter, 2015–2016, and another 84 barred owls in winter
2016–2017. Our estimates of the number of pairs of barred owls in the General Study Area
showed less barred owl pairs in 2016 and 2017 compared to 2015.
Density Study Area
By completely surveying the DSA each year, we were able to estimate which portions of
the DSA were inhabited by barred owls and/or spotted owls. We detected barred owls on 11
occasions in the DSA in 2017. Based on how these responses were distributed spatially and/or
temporarily, we estimate there were 10 inhabited barred owl territories in the DSA. The barred
owl territories overlap 6 spotted owl territories as defined by Dugger et al. (2016). Barred owls
have occupied more spotted owl territories in the DSA than spotted owls in many years (Figure
6). The DSA is within the treatment portion of the barred owl removal study, and it is likely that
barred owl removals account for most of the decrease in our barred owl detections noted since
2015.
Spotted-Barred Owl Hybrids
Although we have detected Barred Owls on the GSA since 1989, we documented our
first case of a Spotted Owl/Barred Owl pair in 2009. The pair included a male Spotted Owl and
a female Barred Owl—the most common pair formation when Spotted Owls and Barred Owls
hybridize (Haig et al. 2004, Kelly et al. 2004). The pair nested and produced 2 young. We
found one of the hybrid offspring (a male) from this pair on our study area in 2011. This owl
dispersed about 44 km. In 2014, we detected a hybrid Spotted x Barred male at night but were
unable to determine if it was from the 2009 hybrid pair. A hybrid male was again detected at
night 2015–2016. We did not detect this hybrid this year during our Spotted Owl surveys, but
the Barred Owl survey crew did detect him.
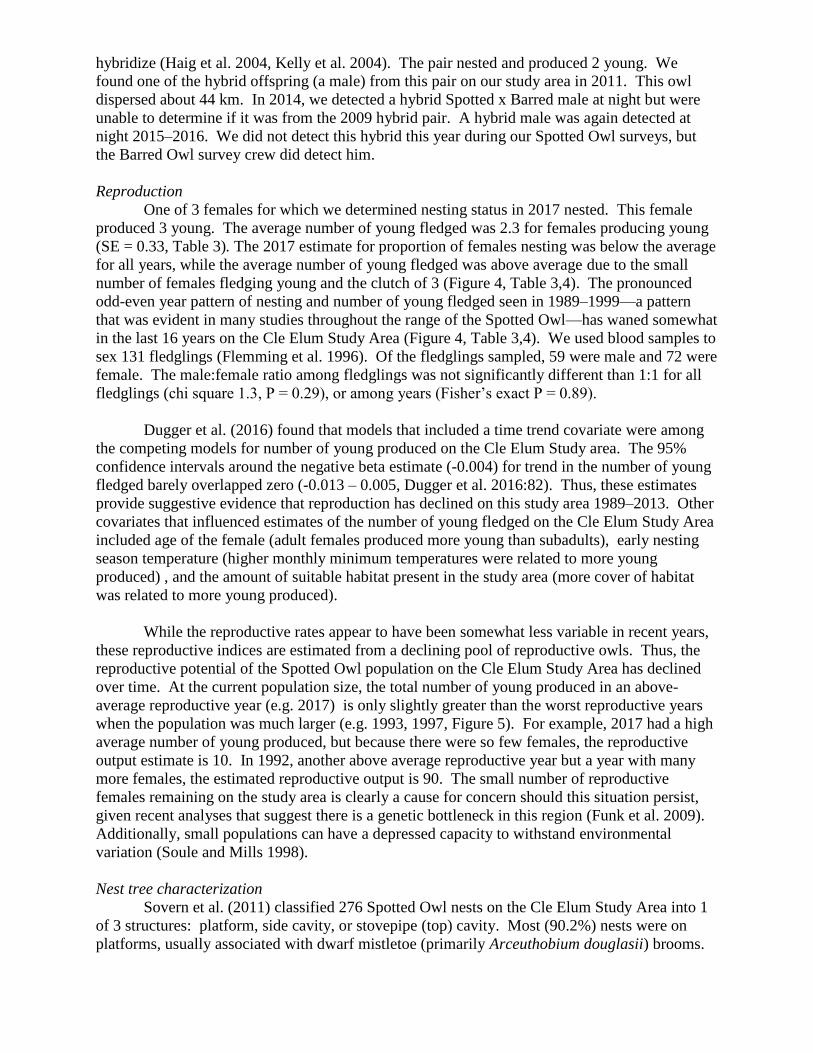
Reproduction
One of 3 females for which we determined nesting status in 2017 nested. This female
produced 3 young. The average number of young fledged was 2.3 for females producing young
(SE = 0.33, Table 3). The 2017 estimate for proportion of females nesting was below the average
for all years, while the average number of young fledged was above average due to the small
number of females fledging young and the clutch of 3 (Figure 4, Table 3,4). The pronounced
odd-even year pattern of nesting and number of young fledged seen in 1989–1999—a pattern
that was evident in many studies throughout the range of the Spotted Owl—has waned somewhat
in the last 16 years on the Cle Elum Study Area (Figure 4, Table 3,4). We used blood samples to
sex 131 fledglings (Flemming et al. 1996). Of the fledglings sampled, 59 were male and 72 were
female. The male:female ratio among fledglings was not significantly different than 1:1 for all
fledglings (chi square 1.3, P = 0.29), or among years (Fisher’s exact P = 0.89).
Dugger et al. (2016) found that models that included a time trend covariate were among
the competing models for number of young produced on the Cle Elum Study area. The 95%
confidence intervals around the negative beta estimate (-0.004) for trend in the number of young
fledged barely overlapped zero (-0.013 – 0.005, Dugger et al. 2016:82). Thus, these estimates
provide suggestive evidence that reproduction has declined on this study area 1989–2013. Other
covariates that influenced estimates of the number of young fledged on the Cle Elum Study Area
included age of the female (adult females produced more young than subadults), early nesting
season temperature (higher monthly minimum temperatures were related to more young
produced) , and the amount of suitable habitat present in the study area (more cover of habitat
was related to more young produced).
While the reproductive rates appear to have been somewhat less variable in recent years,
these reproductive indices are estimated from a declining pool of reproductive owls. Thus, the
reproductive potential of the Spotted Owl population on the Cle Elum Study Area has declined
over time. At the current population size, the total number of young produced in an above-
average reproductive year (e.g. 2017) is only slightly greater than the worst reproductive years
when the population was much larger (e.g. 1993, 1997, Figure 5). For example, 2017 had a high
average number of young produced, but because there were so few females, the reproductive
output estimate is 10. In 1992, another above average reproductive year but a year with many
more females, the estimated reproductive output is 90. The small number of reproductive
females remaining on the study area is clearly a cause for concern should this situation persist,
given recent analyses that suggest there is a genetic bottleneck in this region (Funk et al. 2009).
Additionally, small populations can have a depressed capacity to withstand environmental
variation (Soule and Mills 1998).
Nest tree characterization
Sovern et al. (2011) classified 276 Spotted Owl nests on the Cle Elum Study Area into 1
of 3 structures: platform, side cavity, or stovepipe (top) cavity. Most (90.2%) nests were on
platforms, usually associated with dwarf mistletoe (primarily Arceuthobium douglasii) brooms.

In 250 cases where the species of nest tree was recorded, most (89.6%) nests were in Douglas-fir
(Pseudotsuga menziesii) trees. In sequential nesting attempts, owls used different nests 81% of
the time, but switched to nests known to have been used previously 19.2% of the time. Owls
were more likely to reuse cavity nests in sequential nesting attempts than other nest types (odds
4.7 times greater, 95% CI 2 – 11 times).
Diet
Forsman et al. (2001) analyzed prey remains in pellets collected at 34 Spotted Owl
territories in the eastern Cascades of Washington, and determined most (85%) of the diet was
mammals. Of the mammals consumed, 40.7 % of prey numbers and 52.5% of prey biomass was
Northern flying squirrels (Glaucomys sabrinus). Woodrats (Neotoma cinerea) were the 2nd most
important mammal by number and biomass. Nearly all (92.1%) of the mammals consumed were
nocturnal. Insects (mostly Cyphoderris monstrosa and Ergates spiculatus) accounted for 10.6 %
of prey items by number, but only 0.7 % of prey by biomass. We have found pellets composed
almost entirely of insect exoskeletons, probably C. monstrosa remains, indicating that these
insects are an important prey item in the eastern Cascades, at least when they are available. We
continue to collect pellets whenever possible.
Study area specific results
An outbreak of the western spruce budworm (Choristoneura occidentalis) began on the
Cle Elum Study Area in 2001. Aerial detection surveys by Washington Department of Natural
Resources recorded heavy spruce budworm damage on as much as 20% of the GSA in at least 1
year in 2001-2014 (WDNR 2015). The mean percentage of owl core areas recorded with heavy
budworm defoliation was 37% (SE = 2.9, range 0 - 96%). Defoliation by the budworm could
reduce Spotted Owl habitat quality by decreasing canopy closure and affecting recruitment of
younger trees, particularly in stands that are dominated by Douglas-fir (Pseudotsuga menzesii)
and grand fir (Abies grandis). Currently, the effect of budworm defoliation on owl habitat
quality is highly variable among owl core areas depending on the magnitude and duration of
budworm defoliation, and the species and age composition of the stands. Yearly defoliation was
less noticeable in 2013-2017, and aerial surveys in 2014 recorded less area as heavily damaged
by spruce budworm compared to previous years. Thus, it appears the spruce budworm outbreak
is subsiding.
7. Discussion
Trends
Empirical estimates of Spotted Owl population size on the Cle Elum Study Area indicate
a decline in owl numbers since the early 1990’s. These empirical estimates closely parallel
population growth rates estimated by more rigorous analytical methods, which show an annual
population decline of 8.4% in 1989-2013 (95% CI 6.2 – 10.6% Dugger et al. 2016).
Summary
The Cle Elum Study Area is one of 8 study areas conducting long-term monitoring of
Spotted Owl populations. We completed year 29 of monitoring this year, visiting 76 owl
territories, including a 204km2 Density Study Area, which is completely surveyed for Spotted
Owls. The territorial population of Spotted Owls on the Cle Elum Study Area has declined over
80% since the sample of owl territories was established in 1992. The steady decline in estimated
empirical population size appears to have slowed, as the population has remained relatively
stable since 2011. Lingering effects of past events or management can continue to negatively
affect populations after the events cease (Jones et al. 2017). It may be that the population on the
CLE study area will stabilize at this lower level if no unforeseen negative impacts occur in the
future. Barred Owl removals will continue this fall/winter. The next meta-analysis of Spotted
Owl data will occur after the 2018 field season.
8. Acknowledgments
Joan StHilaire and Dale Phipps, USDA Forest Service, surveyed owl territories on the
Naches Ranger District. Organizations that cooperated over the course of the study include Plum
Creek Timber Company, Boise Cascade Corporation, American Forest Resources L.L.C.,
Washington State Department of Natural Resources, Washington State Department of Fish and
Wildlife, and The Nature Conservancy. We received helpful support from the Cle Elum Ranger
District, mostly Aja Woodrow, Jo Ellen Richards, and Patty Garvey-Darda. We are grateful to
Ryan Haugo and Dave Rolph of the Nature Conservancy for facilitating access to Nature
Conservancy lands within the study area. Washington Department of Natural Resources also
granted us access to the Teanaway Community Forest. William Meyer, Scott Downes, and Will
Moore of Washington Department of Fish and Wildlife, and Danielle Munzing of Washington
Department of Natural Resources conducted surveys at several spotted owl territories 2015–
2017. Matt Nickols, Sue Reffler, and Jake Rowe of the USGS Barred Owl Survey crew shared
information about field conditions and assisted with safety check-ins.
9. Literature Cited
Anthony, R. G., E. D. Forsman, A. B. Franklin, D. R. Anderson, K. P. Burnham, G. C. White, C.
J. Schwarz, J. D. Nichols, J. E. Hines, G. S. Olson, S. H. Ackers, L. S. Andrews, B. L.
Biswell, P. C. Carlson, L. V. Diller, K. M. Dugger, K. E. Fehring, T. L. Fleming, R. P.
Gerhardt, S. A. Gremel, R. J. Gutiérrez, P. J. Happe, D. R. Herter, J. M. Higley, R. B.
Horn, L. L. Irwin, P. J. Loschl, J. A. Reid, and S. G. Sovern. 2006. Status and trends in
demography of northern Spotted owls, 1985-2003. Wildlife Monographs 163.
Collett, D. (1991), Modeling Binary Data, London: Chapman & Hall
Courtney, S. Pl, J A Blakesley, R E Bigley, M L Cody, J P Dumbacher, R C Fleischer, A B
Franklin, J F Franklin, R J Gutiérrez, J M Marzluff, L Sztukowski. 2004. Scientific
evaluation of the status of the Northern Spotted Owl. Sustainable Ecosystems Institute,
Portland, Oregon.
Dugger, K. M., R. G. Anthony, and L. S. Andrews. 2011. Transient dynamics of invasive
competition: Barred Owls, Spotted Owls, habitat, and the demons of competition
present. Ecological Applications 21:2459-2468.
Dugger, K. M., E. D. Forsman, A. B. Franklin, R. J. Davis, G. C. White, C. J. Schwarz, K. P.
Burnham, J. D. Nichols, J. E. Hines, C. B. Yackulic, P. F. Doherty, Jr., L. Bailey, D. A.
Clark, S. H. Ackers, L. S. Andrews, B. Augustine, B. L. Biswell, J. Blakesley, P. C.
Carlson, M. J. Clement, L. V. Diller, E. M. Glenn, A. Green, S. A. Gremel, D. R. Herter,
J. M. Higley, J. Hobson, R. B. Horn, K. P. Huyvaert, C. McCafferty, T. McDonald, K.
McDonnell, G. S. Olson, J. A. Reid, J. Rockweit, V, Ruiz, J. Saenz, S. G. Sovern. 2016.
The effects of habitat, climate, and Barred Owls on long-term demography of Northern
Spotted Owls. Condor 118:57-116. DOI: 10.1650/CONDOR-15-24.1.

Fleming, T. L., J. L. Halverson, and J. B. Buchanan. 1996. Use of DNA analysis to identify sex
of Northern Spotted Owls (Strix occidentalis caurina). Journal of Raptor Research
30:118-122.
Forsman, E. D. 1983. Methods and materials for locating and studying Spotted Owls. Gen. Tech.
Rep. PNW-162. U.S. Department of Agriculture, Forest Service, Pacific Northwest
Research Station. 8 pp.
Forsman, E. D., DeStefano, S., Raphael, M. G., and Gutiérrez, R. J., Eds. 1996. Demography of
the northern Spotted Owl. Studies in Avian Biology 17. 122 pp.
Forsman, E. D., I. A. Otto, S. G. Sovern, M. Taylor, D. W. Hays, H. Allen, S. L. Roberts, D. E.
Seaman. 2001. Spatial and temporal variation in diets of Spotted Owls in Washington.
Journal of Raptor Research 35:141-150.
Forsman, E. D., R. G. Anthony, J. A. Reid, P. J. Loschl, S. G. Sovern, M. Taylor, B. L. Biswell,
A. Ellingson, E. C. Meslow, G. S. Miller, K. A. Swindle, J. A. Thrailkill, F. F. Wagner,
and D. E. Seaman. 2002. Natal and breeding dispersal of Northern Spotted Owls.
Wildlife Monographs 149. 35 pp.
Forsman, E.D., R. G. Anthony, K. M. Dugger, E. M. Glenn, A.B. Franklin, G.C. White, C. J.
Schwarz, K. P. Burnham, D. R. Anderson, J. D. Nichols, J. E. Hines, J. B. Lint, R.J.
Davis, S. H. Ackers, L. S. Andrews, B.L. Biswell, P. C. Carlson, L. V. Diller, S.
A.Gremel, D. R. Herter, J.M. Higley, R. B. Horn, J.A. Reid, J. Rockweit, J. P. Schaberl,
T.J. Snetsinger, and S.G. Sovern. 2011. Population demography of northern spotted owls.
Studies in Avian Biology 40.
Franklin, A. B., D. R. Anderson, E. D. Forsman, K. P. Burnham and F. W. Wagner. 1996.
Methods for collecting and analyzing demographic data on the Northern Spotted Owl.
Studies in Avian Biology 17:12-20.
Franklin, A. B., Burnham, K. P., White, G. C., Anthony, R. G., Forsman, E. D., Schwartz, C.,
Nichols, J. D., and Hines, J. 1999. Range-wide status and trends in northern Spotted Owl
populations. Unpublished report. 71 pp.
Funk, W. C., E. D. Forsman, M. Johnson, T. D. Mullins, and S. M. Haig. 2009. Evidence for
recent population bottlenecks in northern Spotted Owls (Strix occidentalis caurina).
Conservation Genetics DOI 10.1007/s10592-009-9946-5.
Haig, S. M., T. D. Mullins, E. D. Forsman, P. W. Trail, and L. Wennerberg. 2004. Genetic
identification of Spotted Owls, Barred Owls, and their hybrids: legal implications of
hybrid identity. Conservation Biology 18: 1347-1357.
Jones, G. M., J. J. Keane, R. J. Gutiérrez, and M. Z. Peery. 2017. Declining old-forest species
as a legacy of large trees lost. Diversity and Distribution. 2017;1–11.
https://doi.org/10.1111/ddi.12682
Kelly, E. G., E. D. Forsman, and R. G. Anthony. 2003. Are Barred Owls displacing Spotted
Owls? Condor 105:45-53.

Kelly, E. G., and E. D. Forsman. 2004. Recent records of hybridization between Barred Owls
(Strix varia) and Northern Spotted Owls (S. occidentalis caurina). Auk 121:806-810.
Lebreton, J. D., K. P. Burnham, J. Clobert, and D. R. Anderson. 1992. Modeling survival and
testing biological hypotheses using marked animals: A unified approach with case
studies. Ecological Monographs 62:67-118.
Lint, J., Noon, B., Anthony, R., Forsman, E., Raphael, M., Collopy, M., and Starkey, E. 1999.
Northern Spotted Owl effectiveness monitoring plan for the Northwest Forest Plan. Gen.
Tech. Rep. PNW-GTR-440. Portland, OR: U.S. Department of Agriculture, Forest
Service, Pacific Northwest Research Station. 43p.
MacKenzie, D. I., J. D. Nichols, G. B. Lachman, S. Droege, J. A. Royle, and C. A. Langtimm.
2002. Estimating site occupancy rates when detection probabilities are less than one.
Ecology 83:2248–2255.
Olson, G. S., R. G. Anthony, E. D.Forsman, S. H. Ackers, P. J. Loschl, J. A. Reid, K. M.
Dugger, E. M. Glenn, W. J. Ripple. 2005. Modeling of site occupancy dynamics for
Northern Spotted Owls, with emphasis on the effects of Barred Owls. Journal of Wildlife
Management 69:918-932.
Pradel, R. 1996. Utilizatoin of capture-mark-recapture for the study of recruitment and
population growth rate. Biometrics 52:703-709.
Reid, J. R., R. B. Horn, and E. D. Forsman. 1999. Detection rates of Spotted Owls based on
acoustic-lure and live-lure surveys. Wildl. Soc. Bull. 27:986-990.
Soule, M. E., and L. S. Mills. 1998. No need to isolate genetics. Science 282:1658-1659. doi:
10.1126/science.282.5394.1658
Sovern, S. G., E. D. Forsman, G. S. Olson, B. L. Biswell, M. Taylor, and R. G. Anthony. Barred
Owls and landscape attributes influence territory occupancy of Northern Spotted Owls.
Journal of Wildlife Management 78:1436-1443.
Sovern, S. G., M. Taylor, and E. D. Forsman. 2011. Nest reuse by Northern Spotted Owls on
the east slope of the Cascade range, Washington. Northwestern Naturalist 92:101-106.
Taylor, A. L., and E. D. Forsman. 1976. Recent range extensions of the Barred Owl in western
North America, including the first records for Oregon. Condor 78:560-561.
U.S. Department of Agriculture, Forest Service, and U. S. Department of the Interior, Bureau of
Land Management [USDA and USDI]. 1994. Record of decision for amendments to
Forest Service and Bureau of Land Management planning documents within the range of
the northern Spotted Owl. 74pp.
U.S. Fish and Wildlife Service (USFWS). 2013. Experimental removal of barred owls to benefit
threatened northern Spotted Owls; Record of decision for final environmental impact
statement. Federal Register 78:57171-57173.

U.S. Fish and Wildlife Service (USFWS). 2011. Protocol for surveying proposed management
activities that may impact Spotted Owls. USDI Fish and Wildlife Service, Portland, OR.
38 pp.
Washington State Department of Natural Resources (WDNR). 2015. GIS data center.
http://fortress.wa.gov/dnr/app1/dataweb/dmmatrix.html.
Wiens, J. D., R. G. Anthony, and E. D. Forsman. 2014. Competitive interactions and resource
partitioning between Northern Spotted Owls and Barred Owls in western Oregon.
Wildlife Monographs 185. 50pp.

10. Tables
Table 1. Number of male (M) and female (F) adult (Ad), subadult (S-Ad), and juvenile (Juv)
Spotted Owls banded each year on the Cle Elum Study Area, Okanogan-Wenatchee National
Forest, Washington, 1989-2017. Total for juveniles includes 2 hybrid Spotted x Barred Owl
hybrids banded in 2009.
Density Study Area General Study Area
Year Ad (M,F) S-Ad (M,F) Juv Ad (M,F) S-Ad (M,F) Juv Total
1989 12 (7,5) 3 (1,2) 10 16 (10,6) 2 (0,2) 10 53
1990 5 (3,2) 2 (1,1) 12 38 (21,17) 4 (2,2) 28 89
1991 5 (4,1) 2 (2,0) 7 20 (11,9) 12 (3,9) 34 80
1992 0 (0,0) 2 (1,1) 16 16 (7,9) 2 (0,2) 60 96
1993 1 (0,1) 1 (1,0) 2 7 (1,6) 4 (1,3) 8 23
1994 0 (0,0) 1 (1,0) 14 4 (2,2) 2 (1,1) 52 73
1995 0 (0,0) 2 (2,0) 8 4 (3,1) 2 (2,0) 23 39
1996 0 (0,0) 1 (0,1) 12 2 (0,2) 0 (0,0) 39 54
1997 0 (0,0) 0 (0,0) 0 4 (2,2) 3 (2,1) 3 10
1998 0 (0,0) 1 (0,1) 9 2 (1,1) 2 (1,1) 43 57
1999 0 (0,0) 1 (0,1) 7 1 (0,1) 1 (1,0) 8 18
2000 0 (0,0) 2 (2,0) 11 1 (1,0) 3 (0,3) 18 35
2001 1 (1,0) 0 (0,0) 9 2 (1,1) 0 (0,0) 15 27
2002 0 (0,0) 0 (0,0) 5 1 (1,0) 1 (1,0) 11 18
2003 0 (0,0) 1 (1,0) 13 5 (3,2) 1 (1,0) 16 36
2004 0 (0,0) 1 (1,0) 5 2 (0,2) 1 (0,1) 14 23
2005 0 (0,0) 0 (0,0) 7 1 (0,1) 1 (1,0) 11 20
2006 0 (0,0) 1 (1,0) 5 1 (0,1) 0 (0,0) 11 18
2007 1 (1,0) 2 (1,1) 3 3 (3,0) 2 (1,1) 11 22
2008 0 (0,0) 1 (0,1) 3 0 (0,0) 0 (0,0) 6 10
2009 0 (0,0) 0 (0,0) 4 3 (1,2) 1 (1,0) 9 17
2010 0 (0,0) 0 (0,0) 2 0 (0,0) 0 (0,0) 9 11
2011 0 (0,0) 0 (0,0) 2 0 (0,0) 1 (0,1) 7 10
2012 0 (0,0) 0 (0,0) 2 0 (0,0) 0 (0,0) 5 7
2013 0 (0,0) 0 (0,0) 2 1 (1,0) 0 (0,0) 1 4
2014 1 (1,0) 0 (0,0) 0 1 (0,1) 0 (0,0) 5 7
2015 0 (0,0) 0 (0,0) 2 2 (2,0) 0 (0,0) 4 8
2016 1 (1,0) 0 (0,0) 2 4 (3,1) 1 (1,0) 2 10
2017 0 (0,0) 0 (0,0) 0 0 (0,0) 0 (0,0) 7 7
Total 27 (18,9) 24 (15,9) 174 141 (74,67) 46 (19,27) 470 882

Table 2. Number of territories surveyed and Spotted Owls detected by survey effort for the Cle
Elum Study Area, Okanogan-Wenatchee National Forest, Washington, 1989-2017.
Year 1 visita Protocol metb Newc Total detected Territries
inhabitedd
Hybride
1989 0 19 19 36 19 0
1990 0 46 27 83 43 0
1991 0 70 27 107 57 0
1992 0 81 10 120 64 0
1993 0 79 3 99 52 0
1994 0 87 3 98 52 0
1995 0 86 1 92 50 0
1996 0 81 1 81 45 0
1997 0 86 1 68 40 0
1998 0 87 0 78 44 0
1999 0 82 1 73 42 0
2000 0 82 1 68 39 0
2001 0 80 0 56 33 0
2002 8 75 0 44 26 0
2003 10 75 2 50 28 0
2004 8 77 0 49 26 0
2005 8 77 0 46 26 0
2006 8 77 0 46 29 0
2007 9 76 0 40 23 0
2008 8 75 0 36 25 0
2009 8 75 0 31 21 1
2010 8 75 0 26 17 0
2011 8 75 0 21 11 1
2012 8 75 0 20 13 0
2013 8 75 0 21 14 0
2014 8 75 0 18 10 1
2015 6 77 0 27 20 0
2016 7 77 0 18 14 1
2017 7 76 0 21 16 1
a Number of territories visited only one time to meet minimum protocol. b Number of territories surveyed to protocol as outlined in Lint et al. (1999). Includes hybrid territories. c Number of new territories surveyed. d A territory was considered inhabited if one Spotted Owl was detected during the survey period, March-
August. e Number of territories occupied by a pair composed of a Spotted Owl and a Barred Owl, or by a Spotted
Owl/Barred Owl hybrid.

Table 3. Number of young fledged and mean brood size of successful nests of Spotted Owls on
the Cle Elum Study Area, Okanogan-Wenatchee National Forest, Washington, 1989-2017.
a Sample size (N) includes those females checked for reproductive status by August 31. b Mean brood size of nests that produced at least 1 young, and where the number of fledged
young was determined by August 31.
Values have changed from previous versions due to excluding owls wearing tail-mount
transmitters.
Number of young fledged Mean brood size
Year Na Mean SE Nb Mean SE
1989 11 1.55 0.25 9 1.89 0.11
1990 31 1.32 0.16 23 1.78 0.09
1991 46 0.89 0.14 24 1.71 0.11
1992 50 1.58 0.12 42 1.88 0.09
1993 43 0.23 0.09 6 1.67 0.21
1994 40 1.48 0.19 27 2.19 0.13
1995 38 0.84 0.14 20 1.60 0.11
1996 33 1.52 0.14 28 1.79 0.09
1997 33 0.12 0.07 3 1.33 0.33
1998 36 1.44 0.17 27 1.93 0.13
1999 27 0.59 0.16 10 1.60 0.16
2000 31 1.03 0.16 20 1.60 0.11
2001 26 1.00 0.18 16 1.63 0.13
2002 19 0.84 0.22 9 1.78 0.15
2003 22 1.32 0.20 16 1.81 0.14
2004 23 0.96 0.19 13 1.69 0.13
2005 20 1.00 0.22 11 1.82 0.12
2006 15 1.13 0.24 10 1.70 0.15
2007 16 0.94 0.23 9 1.67 0.17
2008 10 0.90 0.31 5 1.80 0.20
2009 10 1.10 0.31 6 1.83 0.17
2010 8 1.50 0.33 6 2.00 0.00
2011 10 1.10 0.31 6 1.83 0.17
2012 6 1.17 0.31 5 1.40 0.24
2013 7 0.71 0.36 3 1.67 0.33
2014 6 1.67 0.42 5 2.00 0.32
2015 8 0.75 0.37 3 2.00 0.00
2016 4 1.00 0.58 2 2.00 0.00
2017 5 1.40 0.60 3 2.33 0.33
Total 636 1.04 0.04 367 1.80 0.03

Table 4. Proportion of female Spotted Owls that nested on the Cle Elum Study Area, Okanogan-
Wenatchee National Forest, Washington, 1989-2017.
a Sample size (N) includes females that were checked for nesting status before June 15. b Exact confidence limits for the binomial proportion using the F distribution, Collett (1991).
Values have changed from previous versions due to excluding owls with tailmount radio-
transmitters in these estimates.
Year Na Proportion 95% CIb
1989 8 0.88 0.47 1.00
1990 21 0.86 0.64 0.97
1991 33 0.64 0.45 0.80
1992 47 1.00 0.92 1.00
1993 39 0.18 0.08 0.34
1994 34 0.91 0.76 0.98
1995 32 0.66 0.47 0.81
1996 32 0.97 0.84 1.00
1997 27 0.15 0.04 0.34
1998 34 0.91 0.76 0.98
1999 20 0.60 0.36 0.81
2000 27 0.81 0.62 0.94
2001 23 0.74 0.52 0.90
2002 17 0.59 0.33 0.82
2003 20 0.95 0.75 1.00
2004 20 0.75 0.51 0.91
2005 19 0.58 0.33 0.80
2006 13 0.92 0.64 1.00
2007 16 0.63 0.35 0.85
2008 6 0.83 0.36 1.00
2009 6 0.83 0.36 1.00
2010 5 1.00 0.48 1.00
2011 5 0.80 0.28 0.99
2012 4 1.00 0.40 1.00
2013 5 0.60 0.15 0.95
2014 5 0.80 0.28 0.99
2015 8 0.63 0.24 0.91
2016 3 0.67 0.09 0.99
2017 3 0.33 0.01 0.91
Total 532 0.75 0.68 0.76
aSample size (N) includes females that were checked for nesting status before June 15. b Exact confidence limits for the binomial proportion using the F distribution, Collett (1991).
Values have changed from previous versions due to excluding owls wearing tail-mount
transmitters.
Year Na Proportion 95% CIb
1989 7 1.00 0.59 1.00
1990 17 0.94 0.71 1.00
1991 21 0.81 0.58 0.95
1992 44 0.86 0.73 0.95
1993 7 0.86 0.42 1.00
1994 31 0.77 0.59 0.90
1995 21 0.90 0.70 0.99
1996 31 0.90 0.74 0.98
1997 4 0.75 0.19 0.99
1998 31 0.84 0.66 0.95
1999 12 0.75 0.43 0.95
2000 22 0.91 0.71 0.99
2001 17 0.82 0.57 0.96
2002 10 0.80 0.44 0.97
2003 18 0.78 0.52 0.94
2004 15 0.80 0.52 0.96
2005 11 0.91 0.59 1.00
2006 12 0.67 0.35 0.90
2007 10 0.90 0.55 1.00
2008 5 0.80 0.28 0.99
2009 5 1.00 0.48 1.00
2010 5 0.80 0.28 0.99
2011 4 0.75 0.19 0.99
2012 4 1.00 0.40 1.00
2013 3 0.67 0.09 0.99
2014 4 1.00 0.40 1.00
2015 5 0.60 0.15 0.95
2016 2 1.00 0.16 1.00
2017 1 1.00 0.03 1.00
Total 379 0.84 0.80 0.88
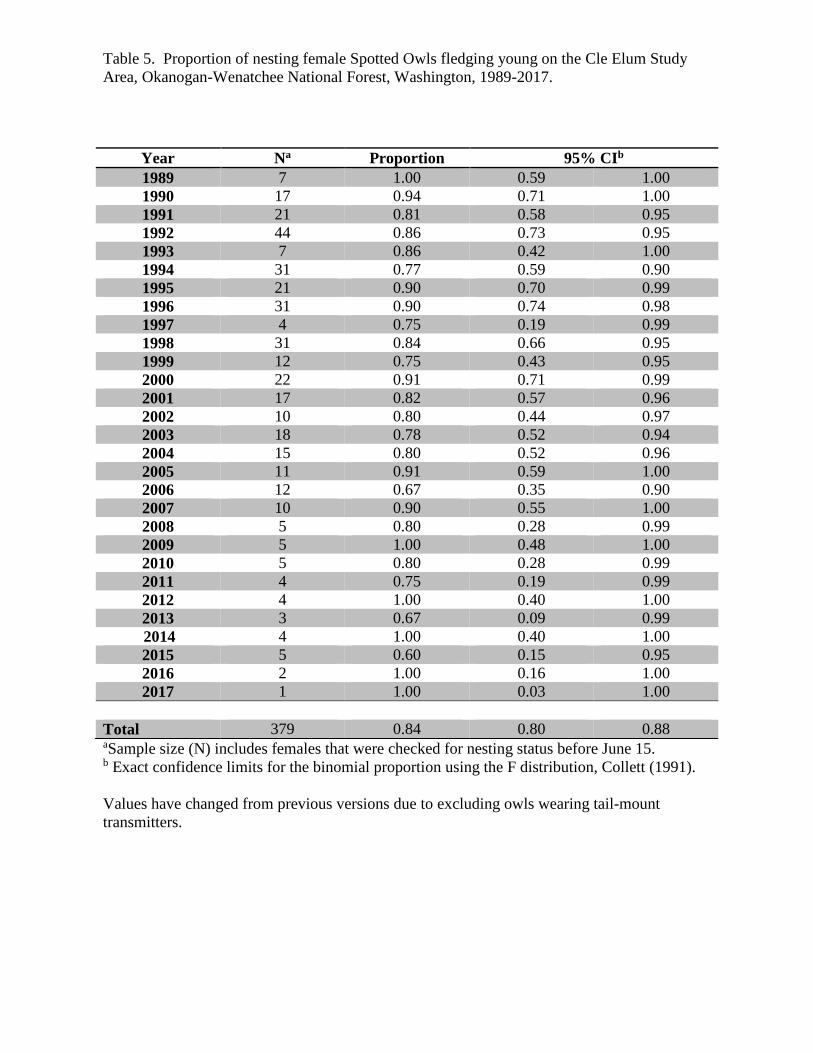
Table 5. Proportion of nesting female Spotted Owls fledging young on the Cle Elum Study
Area, Okanogan-Wenatchee National Forest, Washington, 1989-2017.

a Sample size (N) includes all females that were checked for reproductive status by August 31.
The sample size for this index is commonly larger than other indices because we often cannot
make the required visits to determine nesting status before the June15 cutoff due to limited
access or low response rates for non-nesting females. b Exact confidence limits for the binomial proportion using the F distribution, Collett (1991).
Values have changed from previous versions due to excluding owls wearing tail-mount
transmitters.
Year Na Proportion 95% CIb
1989 11 0.82 0.48 0.98
1990 31 0.74 0.55 0.88
1991 46 0.52 0.37 0.67
1992 50 0.84 0.71 0.93
1993 43 0.14 0.05 0.28
1994 40 0.68 0.51 0.81
1995 38 0.53 0.36 0.69
1996 33 0.85 0.68 0.95
1997 33 0.09 0.02 0.24
1998 36 0.75 0.58 0.88
1999 27 0.37 0.19 0.58
2000 31 0.65 0.45 0.81
2001 26 0.62 0.41 0.80
2002 19 0.47 0.24 0.71
2003 22 0.73 0.50 0.89
2004 23 0.57 0.34 0.77
2005 20 0.55 0.32 0.77
2006 15 0.67 0.38 0.88
2007 16 0.56 0.30 0.80
2008 10 0.50 0.19 0.81
2009 10 0.60 0.26 0.88
2010 8 0.75 0.35 0.97
2011 10 0.60 0.26 0.88
2012 6 0.83 0.36 1.00
2013 7 0.43 0.10 0.82
2014 6 0.83 0.36 1.00
2015 8 0.38 0.09 0.76
2016 4 0.50 0.68 0.93
2017 5 0.60 0.15 0.95
Total 636 0.58 0.54 0.62
Table 6. The proportion of female Spotted Owls fledging young on the Cle Elum Study Area,
Okanogan-Wenatchee National Forest, Washington, 1989-2017.

11. Figures
Figure 1. The Cle Elum Study Area showing General Study Area, (black outline), Density Study
Area (blue outline), and major land owners.

Figure 2. Number of Spotted Owls detected in the General Study Area of the Cle Elum Spotted
Owl Demography Study Area, Okanogan-Wenatchee National Forest, 1989-2017. Minimum
protocol territories were visited once during the survey season. Territories were considered
inhabited if at least 1 Spotted Owl was detected.

Figure 3. Number of owls detected in the 205 km2 Swauk Density Study Area, Cle Elum Study
Area, Okanogan-Wenatchee National Forest, 1991-2017. STOC = Spotted Owl,
STVA/HYBRID = either a Spotted Owl/Barred Owl hybrid (2014, 2016), or a Barred Owl
paired with a Spotted Owl (2009, 2017).

Figure 4. Reproductive indices of Spotted Owls on the Cle Elum Study Area, Okanogan-
Wenatchee National Forest, Washington, 1989-2017. Indicies shown are proportion nesting
(solid black lines) and average number of young fledged per female (solid red lines). The
averages for both these indices are shown as dashed lines.
0
0.2
0.4
0.6
0.8
1
1.2
1.4
1.6
1.8
1989 1991 1993 1995 1997 1999 2001 2003 2005 2007 2009 2011 2013 2015 2017
Pro
po
rtio
n n
est
ing/
nu
mb
er
you
ng
fle
dge
d
Proportion nesting
Average proportion nesting (all years)
Number young fledged
Average number young fledged (all years)

Figure 5. Hypothesized potential female reproductive output (average number of young fledged
per female Spotted Owl * the number of female Spotted Owls present in the population) by year,
Cle Elum Study Area, Okanogan-Wenatchee National forest, Washington, 1989-2017. Points
with red outlines represent years where the average number of young produced per female was
above the average for all years.
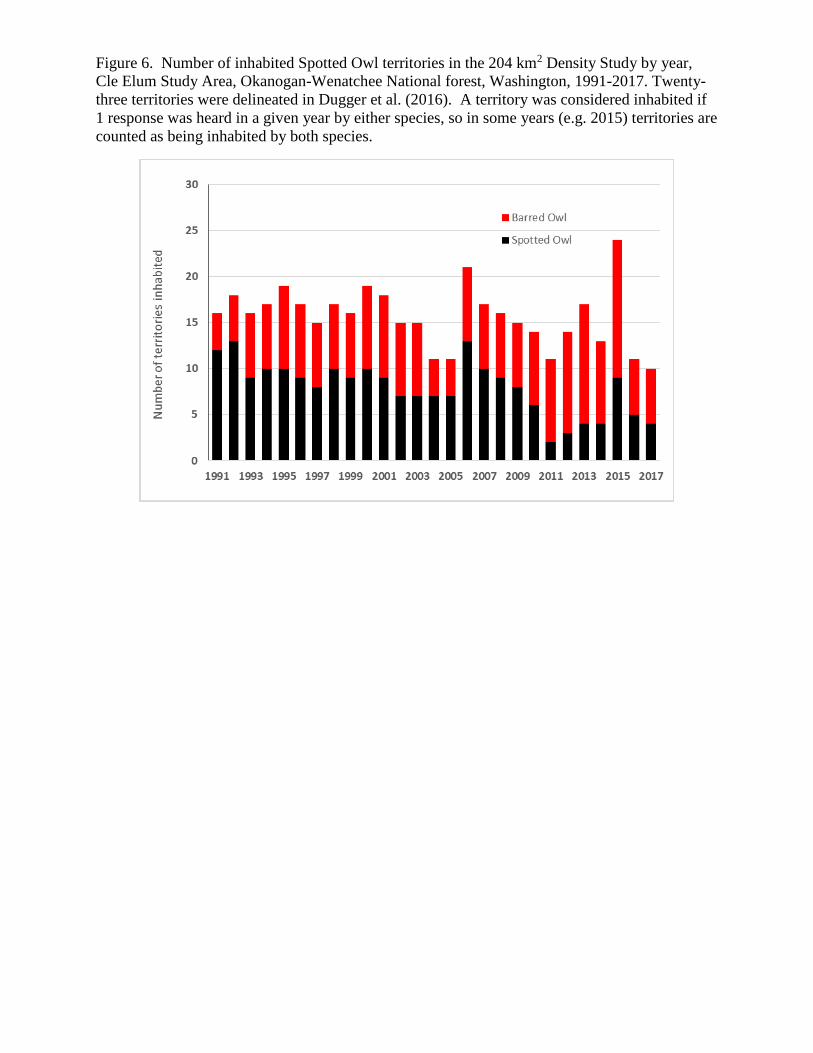
Figure 6. Number of inhabited Spotted Owl territories in the 204 km2 Density Study by year,
Cle Elum Study Area, Okanogan-Wenatchee National forest, Washington, 1991-2017. Twenty-
three territories were delineated in Dugger et al. (2016). A territory was considered inhabited if
1 response was heard in a given year by either species, so in some years (e.g. 2015) territories are
counted as being inhabited by both species.

Figure 7a. Frequency distribution of known-age Spotted Owls on the Cle Elum Demography
Study, Okanogon-Wenatchee National Forest, Washington, 1989-2017. Bubbles represent the
number of known-age owls in each age class in a given year.

Figure 7b. Average age of known-age Spotted Owls on the Cle Elum Demography Study,
Okanogon-Wenatchee National Forest, Washington, 2001-2017. The start year for each sex is
the 90th percentile maximum age in years (males = 12, females = 14) elapsed since 1989, the
beginning of the study. Starting the averages in this way reduces the bias from early years in the
study when it would not be possible for older-aged owls to be present.

Figure 8. The number of Spotted Owls detected on the Cle Elum Study Area, Okanogon-
Wenatchee National Forest, Washington, 1989-2017, divided by sex.
12. Publications, Presentations, and Data Transfer during Fiscal Year 2017 The Cle Elum Ranger District staff was given weekly updates of our owl surveys and
information as needed in support of District projects.
We worked closely with the USGS Barred Owl removal crew, sharing field conditions
and assisting with logistics.
Sovern, S. G., D. B. Lesmeister, K. M. Dugger, M. S. Pruett, R. J. Davis, and J. M.
Jenkins. Forest canopy cover at Northern Spotted Owl activity centers. In prep.
13. Interesting Observations and Problems Encountered
Interesting observations
A male owl that had not been detected since 2005 was detected at 1 of our historic
territories. This owl moved approximately 23km. We had a male response at this territory in
2015, but were unable to determine the bird’s identity. This male nested as a 2-yr-old in 2004 at
the previous territory, but was apparently single in 2005. His mate was at least 18 years old in
2004, and we did not detect her again. She had been at the same territory for 16 years. The site
has not been occupied by a pair since 2004, but we did detect a male at night in 2 separate years.
Problems encountered
We were unable to survey on 11 scheduled survey days and/or nights due to inclement
weather, resulting in a loss of 16 person-days of survey. This is slightly more than the average
number of days we lose each year due to weather.
We were unable to access 4 survey areas for our third visit due to closures associated
with the 14,899 ha Jolly Mountain fire, which started August 11. The final perimeter of the Jolly
Mountain fire intersects 13 of our owl territories. These territories sustained varying amounts of
fire effects, according to Forest Service Soil Burn Severity data.
Reduced maintenance and decommission of Forest Service roads continues to reduce
vehicle access. This often necessitates other means of travel (e.g. foot, bicycle, ATV) to our
calling stations, which often increases time spent for each survey.
As owl territories have become vacant, we have had to increase our number of nocturnal
visits in order to achieve valid surveys. In addition, surveys done by cooperating organizations
to monitor owl territories in our sample have largely ceased. The combination of these 2
developments has increased the overall workload for accomplishing this study. These
difficulties are not likely to change in the near future, however, once again this year, the
Washington State Department of Wildlife and Washington Department of Natural Resources
surveyed several owl territories.
14. No Appendices