
US Consumer Analysis: Apparel and Footwear
28
US Consumer Analysis: Apparel and Footwear February, 2017
-
Upload
deborah-weinswig -
Category
Retail
-
view
1.867 -
download
0
Transcript of US Consumer Analysis: Apparel and Footwear

US Consumer Analysis:Apparel and FootwearFebruary, 2017

2
US Consumer Analysis:Apparel and Footwear
Influences on Apparel and Footwear Purchases
About this Report
Key Takeaways and Market Overview
Purchase Behavior: Apparel and Footwear
01
02
03
04
3
About this Report
About this ReportThis report is a collaboration between Fung Global Retail & Technology and Prosper Insights & Analytics. It uses propriety data from surveys conducted by Prosper in the US that track shopping behaviors and the future purchase intentions of consumers.
Survey MethodologyThe Prosper Insights & Analytics Monthly Consumer Survey provides insights into the US consumer market from multiple datasets and multiple sources. It surveys more than 6,000 consumers 18+ in the US on an ongoing basis.

4
Key Takeaways: Brick-and-Mortar to Remain the Dominant Transaction Channel for US Apparel and Footwear
1. The majority of US consumers have purchased apparel both online and offline, however, brick-and-mortar is still the dominant transaction channel.
2. In fact, US consumers’ attitude towards fashion and their purchase behavior has changed little over the past five years.
3. We expect brick-and-mortar to remain the dominant store format for US apparel and footwear retail in the near future.

5
Key Takeaways: Social Media has Become a Major Influencer in Apparel Purchases Among Millennials
1. As retailers have shifted their budgets to digital advertising, the influence of all major media channels has decreased in the past five years, except for social media and mobile video.
2. Among millennials, the influence of social media on apparel purchases is on par with traditional media like TV and magazines.

6
Consumer and Category Insights

7
US Consumer Confidence Solid in 2016, Following an Improvement in 2013–2015
Jan-11 Jan-12 Jan-13 Jan-14 Jan-15 Jan-16 Jan-1720%
30%
40%
50%
60%
52%
Source: Prosper Monthly Consumer Survey – US/University of Michigan/US Census Bureau/US Department of Commerce
% of Respondents Feeling Confident or Very Confident in the Economy in the Next 6 Months
Jan-11 Jan-12 Jan-13 Jan-14 Jan-15 Jan-16 Jan-1750
60
70
80
90
100 98.5Index of Consumer Sentiment (University of Michigan)
2011 2012 2013 2014 2015 20163.0
3.5
4.0
4.5
5.0 4.85US Retail Sales (US$ trillion)
2011 2012 2013 2014 2015 2016100
105
110
115
110.7
US Personal Consumption Expenditures Price Index (2009=100)

8
2011 2012 2013 2014 2015 20160
100
200
300
400
278 282 285 287 293 292
26 30 34 39 46 55310 317 324 331 343 353
Column2
Other nonstore-based retailing
Online (Internet retailing)
The Internet is Not Yet a Significantly Large Channel in Terms of Apparel and Footwear Purchases
Size of US Apparel and Footwear Market (US$ billion)
Source: Euromonitor
15.5%

9
But it Increasingly Influences How Consumers Shop for Apparel Offline
2011 2012 2013 2014 2015 20160%
20%
40%
60%
80%
100%
49% 44% 38% 32% 26% 20%
40% 45% 50% 55% 61% 66%
11% 12% 12% 13% 14% 14%
Online
Web-influenced offline
Offline only
Apparel Retail Sales in the US, by Type
Source: Think with Google

10
Nov-11 May-12 Nov-12 May-13 Nov-13 May-14 Nov-14 May-15 Nov-15 May-16 Nov-1640
60
80
100
120
105
85
76
8786
78
Children’s Clothing
Men’s Clothing
Men’s Dress Clothing
Shoes
Women’s Casual Clothing
Women’s Dress Clothing
Children’s Clothing Shows the Most Seasonality in Apparel, Affected by Back-to-School and Holiday Shopping
Spending Score of Respective Apparel Category
Source: Prosper Monthly Consumer Survey – US
A spending score higher than 100 means more consumers are planning to spend more on that category over the next 90 days than are planning to spend less on it.
11
Consumer Purchase Behavior: Online or Offline

12
The Majority of Consumers Search and Purchase Some of Their Apparel Online
78% of Consumers Searched forClothing/Footwear Online
Frequency of Clothing/Footwear Online Search (Jan 2016)*
25%
53%
22%
Regularly Occasionally Never
80% of Consumers Who Purchase Children’s Clothing Shop Online
% of Respective Item Purchased Online (2016)
Women’s Clothing
Men’s Clothing
Children’s Clothing
Footwear
29%
33%
20%
47%
43%
39%
43%
29%
28%
28%
37%
23%
Source: Prosper Monthly Consumer Survey – US
* No significant changes in the past five years * Sample: Moms with kids aged 9 and below
0% (do not buy online) 1%–50% bought online 51%–100% bought online
13
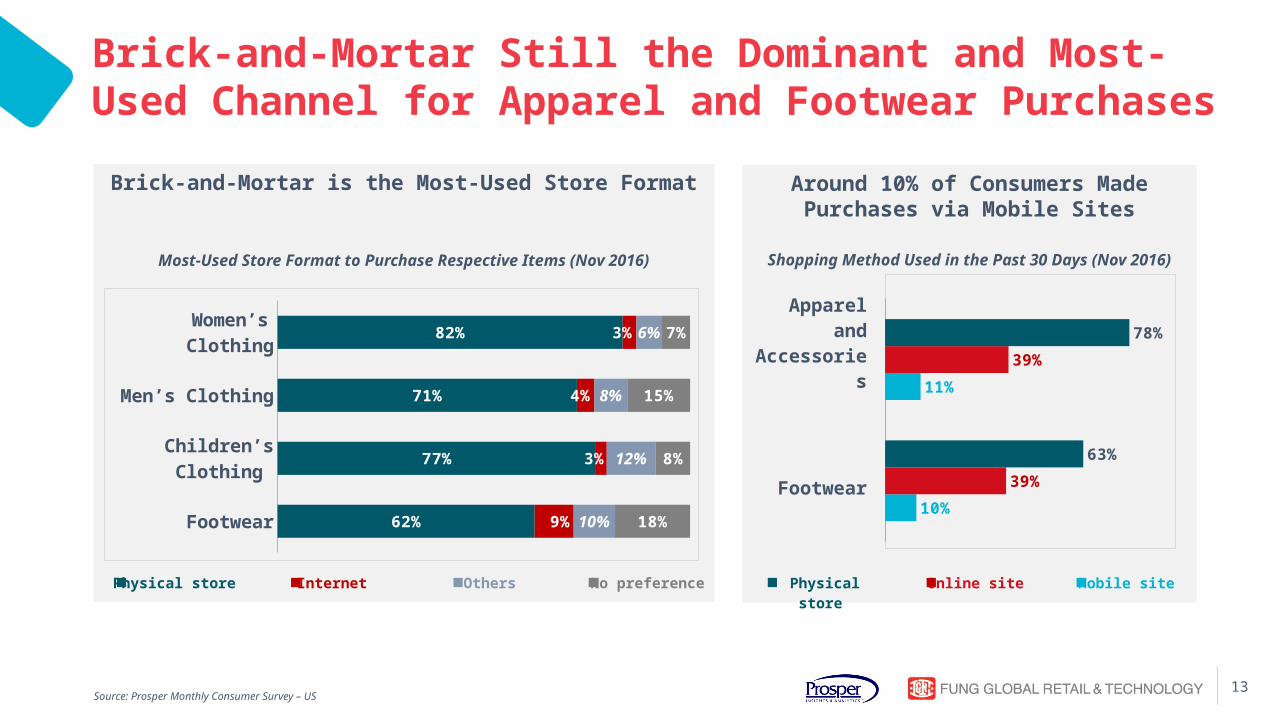
Brick-and-Mortar Still the Dominant and Most-Used Channel for Apparel and Footwear Purchases
Around 10% of Consumers Made Purchases via Mobile Sites
Shopping Method Used in the Past 30 Days (Nov 2016)
10%
11%
39%
39%
63%
78%Apparel and Accessories
Footwear
Brick-and-Mortar is the Most-Used Store Format
Women’s Clothing
Men’s Clothing
Children’s Clothing
Footwear
82%
71%
77%
62%
3%
4%
3%
9%
6%
8%
12%
10%
7%
15%
8%
18%
Source: Prosper Monthly Consumer Survey – US
Physical store Online site Mobile site Physical store Internet Others No preference
Most-Used Store Format to Purchase Respective Items (Nov 2016)

14
Women’s Clothing Men’s Clothing Children’s Clothing Footwear
More Consumers Use the Internet the Most Often to Purchase Apparel, but are Still a Niche Segment
1%
3%
1%
4%
1%
3%
4%9%
Nov 2011 Nov 2016
Those Who Use the Internet the Most to Purchase Respective Items (Nov 2011 and Nov 2016)
Sample: Women’s Clothing: All Women / Men’s Clothing: All Men / Children’s Clothing: Moms with kids aged 9 or below / Shoes: All respondentsSource: Prosper Monthly Consumer Survey – US
15
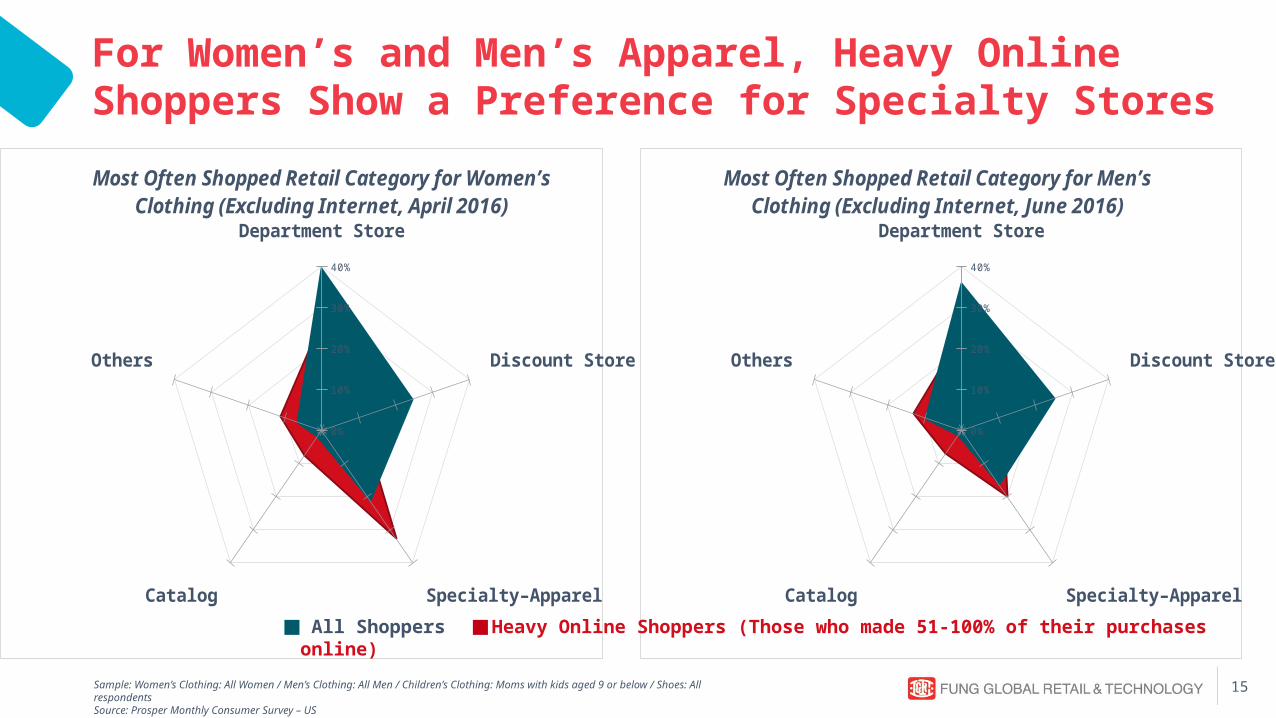
For Women’s and Men’s Apparel, Heavy Online Shoppers Show a Preference for Specialty Stores
Sample: Women’s Clothing: All Women / Men’s Clothing: All Men / Children’s Clothing: Moms with kids aged 9 or below / Shoes: All respondentsSource: Prosper Monthly Consumer Survey – US
Department Store
Discount Store
Specialty–ApparelCatalog
Others
0%
10%
20%
30%
40%
Most Often Shopped Retail Category for Women’s Cloth-ing (Excluding Internet, April 2016)
Department Store
Discount Store
Specialty–ApparelCatalog
Others
0%
10%
20%
30%
40%
Most Often Shopped Retail Category for Men’s Clothing (Excluding Internet, June 2016)
All Shoppers Heavy Online Shoppers (Those who made 51-100% of their purchases online)

16
Heavy Online Shoppers Also Show a Preference for Specialty Stores in Children’s Apparel and Footwear
Sample: Women’s Clothing: All Women / Men’s Clothing: All Men / Children’s Clothing: Moms with kids aged 9 or below / Shoes: All respondentsSource: Prosper Monthly Consumer Survey – US
Department Store
Discount Store
Specialty–ApparelCatalog
Others
0%
10%
20%
30%
40%
Most Often Shopped Retail Category for Children’s Cloth-ing (Excluding Internet, October 2016)
Department Store
Discount Store
Specialty–ApparelCatalog
Others
0%
10%
20%
30%
40%
Most Often Shopped Retail Category for Footwear (Excluding Internet, July 2016)
All Shoppers Heavy Online Shoppers (Those who made 51-100% of their purchases online)
17
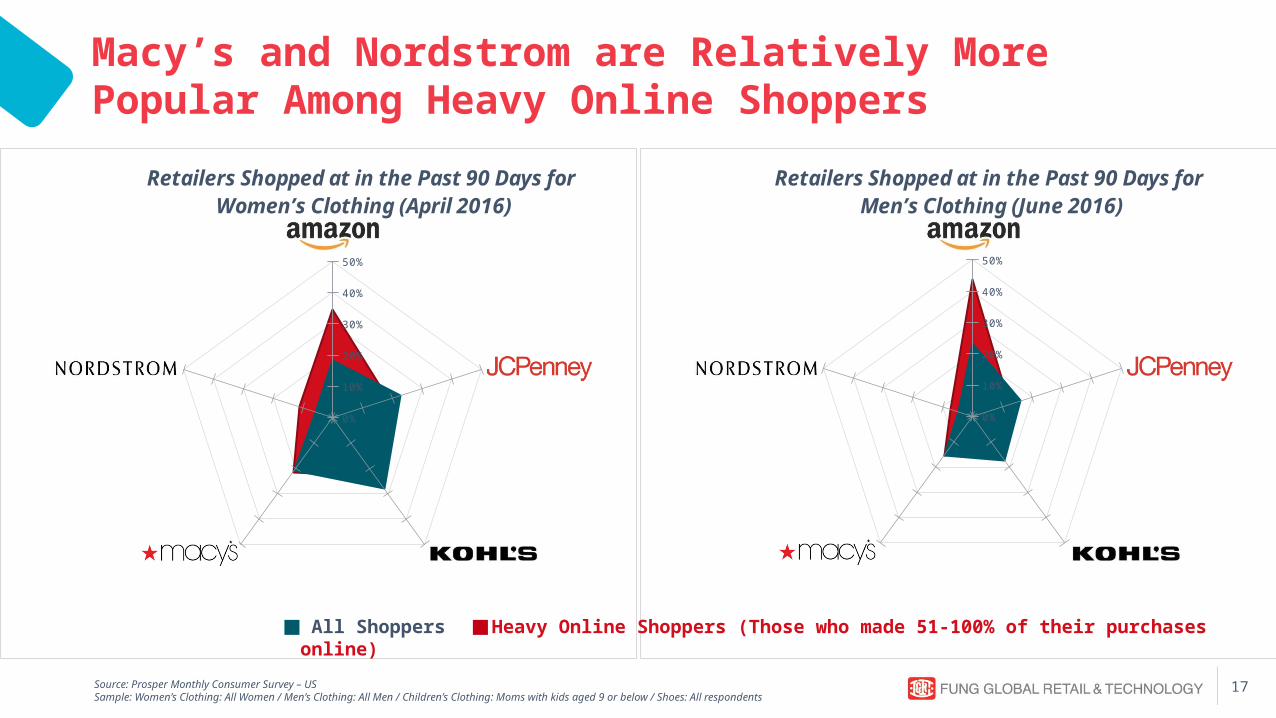
Macy’s and Nordstrom are Relatively More Popular Among Heavy Online Shoppers
Source: Prosper Monthly Consumer Survey – USSample: Women’s Clothing: All Women / Men’s Clothing: All Men / Children’s Clothing: Moms with kids aged 9 or below / Shoes: All respondents
0%
10%
20%
30%
40%
50%
Retailers Shopped at in the Past 90 Days for Women’s Clothing (April 2016)
0%
10%
20%
30%
40%
50%
Retailers Shopped at in the Past 90 Days for Men’s Clothing (June 2016)
All Shoppers Heavy Online Shoppers (Those who made 51-100% of their purchases online)

18
In the Children’s Clothing Category, Specialty Stores are Relatively More Popular Among Heavy Online Shoppers
Source: Prosper Monthly Consumer Survey – USSample: Women’s Clothing: All Women / Men’s Clothing: All Men / Children’s Clothing: Moms with kids aged 9 or below / Shoes: All respondents
0%
10%
20%
30%
40%
50%
Retailers Shopped at in the Past 90 Days for Children’s Clothing (October 2016)
0%
10%
20%
30%
40%
50%
Retailers Shopped at in the Past 90 Days for Footwear (July 2016)
All Shoppers Heavy Online Shoppers (Those who made 51-100% of their purchases online)
19
Consumer Purchase Behavior: Attitudes

20
Nov-11 Nov-12 Nov-13 Nov-14 Nov-15 Nov-16
44% 43% 42% 43% 44% 43%
37% 38% 38% 39% 37% 38%
19% 19% 21% 18% 19% 19%
Newest trends and styles are important to me
I prefer a traditional conser-vative look
Fashion is less important than value and comfort to me
Consumers’ Attitude Toward Fashion has Changed Little in the Past Five Years
Feelings about Fashion (2011–2016)
Source: Prosper Monthly Consumer Survey – US

21
Nov-11 Nov-12 Nov-13 Nov-14 Nov-15 Nov-16
50% 50% 49% 50% 50% 47%
50% 50% 51% 50% 50% 53%
Important
Not important
Slightly More Consumers Regard Labels as Important Compared With Last Year
Importance of Labels When Buying Clothes (2011–2016)
Source: Prosper Monthly Consumer Survey – US

22
Nov-11 Nov-12 Nov-13 Nov-14 Nov-15 Nov-16
23% 23% 22% 22% 23% 22%
63% 62% 61% 63% 62% 62%
13% 15% 16% 15% 15% 16%
Sales are not important to me when buying clothing
I usually buy clothing when it is on sale
I only buy clothing when it is on sale
The Majority of Consumers Usually Buy Clothing When it is On Sale
Importance of Sales (2011–2016)
Source: Prosper Monthly Consumer Survey – US

23
Media Influence on Apparel Purchases

24
Retailers are Shifting Their Focus to Digital Advertising
Advertising Spending of the US Retail Industry, 2013 vs. 2015 (US$ million)
Source: Total Advertising Spend - Kantar Media
2013 20150
5,000
10,000
15,000
42% 38%
25%15%
11%9%
8%
6%
10% 27%4%
4% 11,827
13,295
Column2
Other
Internet display
Magazine
Radio
Newspaper
25
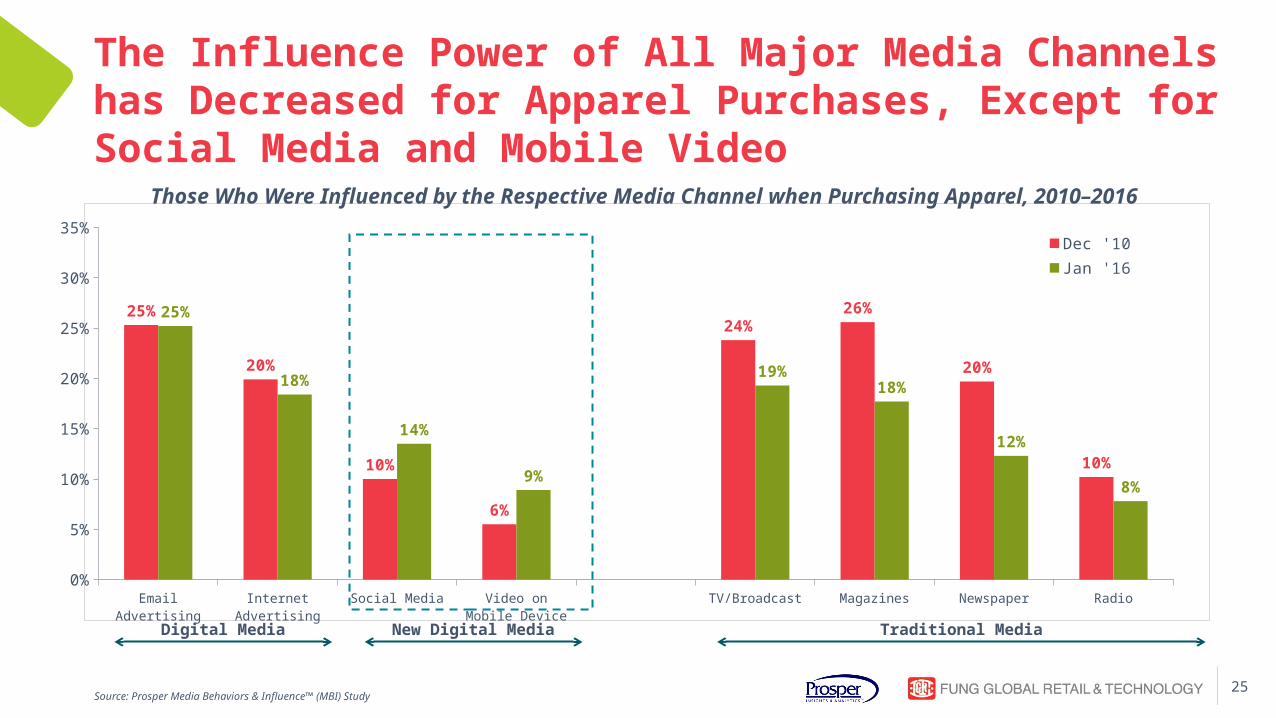
The Influence Power of All Major Media Channels has Decreased for Apparel Purchases, Except for Social Media and Mobile Video
Source: Prosper Media Behaviors & Influence™ (MBI) Study
Email Advertising Internet Advertising Social Media Video on Mobile Device
TV/Broadcast Magazines Newspaper Radio0%
5%
10%
15%
20%
25%
30%
35%
25%
20%
10%
6%
24%26%
20%
10%
25%
18%
14%
9%
19%18%
12%
8%
Dec '10Jan '16
Those Who Were Influenced by the Respective Media Channel when Purchasing Apparel, 2010–2016
Digital Media Traditional MediaNew Digital Media

26
Email Advertising Internet Advertising Social Media Video on Mobile Device
TV/Broadcast Magazines Newspaper Radio0%
5%
10%
15%
20%
25%
30%
35%
25%
18%
14%
9%
19%18%
12%
8%
32%
26%
23%
18%
22%23%
11%12%
All Respondents
18–34 (Millennials)
Influence of Social Media is On Par with TV and Magazines Among Millennials
Source: Prosper Media Behaviors & Influence™ (MBI) Study
Those Who Were Influenced by the Respective Media Channel when Purchasing Apparel, Jan 2016
Traditional MediaDigital Media New Digital Media
27
Email Advertising Internet Advertising Social Media Video on Mobile Device
TV/Broadcast Magazines Newspaper Radio0%
5%
10%
15%
20%
25%
30%
35%
25%
18%
14%
9%
19%18%
12%
8%
18%
12%
5%
2%
15%13%
16%
4%
All Respondents
55+ (Boomers and Silvers)
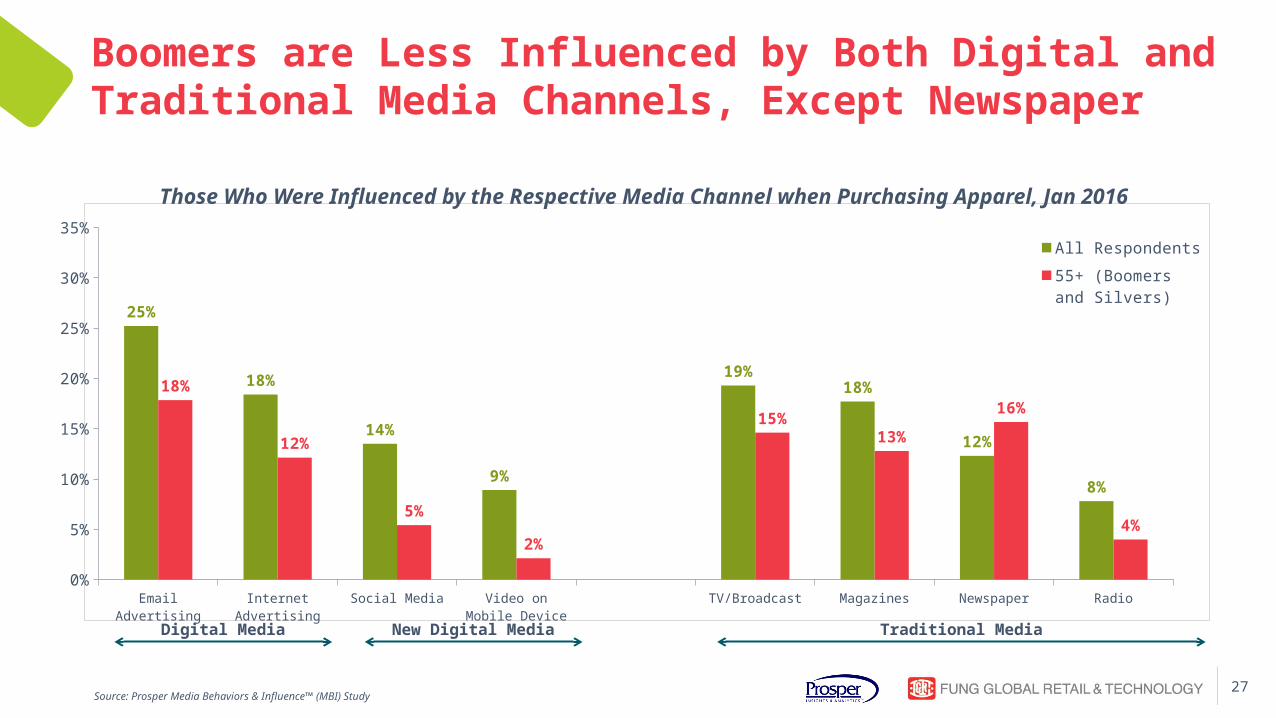
Boomers are Less Influenced by Both Digital and Traditional Media Channels, Except Newspaper
Source: Prosper Media Behaviors & Influence™ (MBI) Study
Those Who Were Influenced by the Respective Media Channel when Purchasing Apparel, Jan 2016
Traditional MediaDigital Media New Digital Media