U.S. Commodity Futures Trading Commissionvs....
23
2011 International Food and Agribusiness Management Association (IFAMA). All rights reserved 179 International Food and Agribusiness Management Review Volume 14, Issue 3, 2011 U.S. Commodity Futures Trading Commission vs. Marketing Advisory Services, Inc.: A Case Study Dennis M. Conley Professor and Director, Graduate Program in Agribusiness, Department of Agricultural Economics, University of Nebraska-Lincoln, 308 Filley Hall, Lincoln, Nebraska, 68583-0922, U.S.A. Abstract Students are asked to evaluate the merits of a lawsuit that agricultural producers filed, along with the U.S. Commodity Futures Trading Commission (CFTC), against their marketing ad- visory service. The lawsuit was motivated by apparent losses in their commodity accounts allegedly caused by speculative trading. Keywords: risk management, lawsuit, agricultural commodities, CFTC, hedging, speculation Corresponding author: Tel: + 402.472.3401 Email: [email protected] IFAMA Agribusiness Case 14.3B This case was prepared for class discussion rather than to illustrate either effective or ineffective handling of an agribusi- ness management situation. The author(s) may have disguised names and other identifying information presented in the case in order to protect confidentiality. IFAMA prohibits any form of reproduction, storage or transmittal without its written permission. To request Teaching Notes, order copies or request permission to reproduce, please contact the IFAMA Busi- ness Office. Click here to view authors’ intro video
Transcript of U.S. Commodity Futures Trading Commissionvs....

2011 International Food and Agribusiness Management Association (IFAMA). All rights reserved
179
International Food and Agribusiness Management Review Volume 14, Issue 3, 2011
U.S. Commodity Futures Trading Commission vs. Marketing Advisory Services, Inc.: A Case Study
Dennis M. Conley
Professor and Director, Graduate Program in Agribusiness, Department of Agricultural Economics,
University of Nebraska-Lincoln, 308 Filley Hall, Lincoln, Nebraska, 68583-0922, U.S.A.
Abstract
Students are asked to evaluate the merits of a lawsuit that agricultural producers filed, along with the U.S. Commodity Futures Trading Commission (CFTC), against their marketing ad-visory service. The lawsuit was motivated by apparent losses in their commodity accounts allegedly caused by speculative trading. Keywords: risk management, lawsuit, agricultural commodities, CFTC, hedging, speculation
Corresponding author: Tel: + 402.472.3401
Email: [email protected]
IFAMA Agribusiness Case 14.3B
This case was prepared for class discussion rather than to illustrate either effective or ineffective handling of an agribusi-ness management situation. The author(s) may have disguised names and other identifying information presented in the case in order to protect confidentiality. IFAMA prohibits any form of reproduction, storage or transmittal without its written permission. To request Teaching Notes, order copies or request permission to reproduce, please contact the IFAMA Busi-ness Office.
Click here to view authors’ intro video

Conley / International Food and Agribusiness Management Review / Volume 14, Issue 3, 2011
2011 International Food and Agribusiness Management Association (IFAMA). All rights reserved.
180
Dennis Hollingsworth received the following statement in the mail. It had more than 40 en-tries under the headings of YOUR ACTIVITY THIS MONTH and POSITIONS IN YOUR ACCOUNT. Listed on the right side were DEBITs and CREDITs.
Figure 1. Dennis Hollingsworth’s Statement of Account

Conley / International Food and Agribusiness Management Review / Volume 14, Issue 3, 2011
2011 International Food and Agribusiness Management Association (IFAMA). All rights reserved.
181
At the end of the statement was an account summary. A few of the lines showed large posi-tive dollar figures, but many lines were negative – and they were large. The difference be-tween lines labeled BEGINNING and ENDING BALANCE was a minus $30,317.02. The combined value of FUTURES OPEN TRADE EQUITY and OPTIONS MARKET VALUE exceeded a negative $100,000. Dennis didn’t know what the entries on the activities and po-sitions meant, and the negative dollar figures in the account summary were a concern, but he didn’t know why they should be. Table 1. FCM Statement, ACCOUNT SUMMARY Almost every Wednesday morning around 7:00 AM, Dennis and other farmers gathered for coffee at the local Ampride C-Store. Dennis initiated a conversation about the statement he had received to see if any of his friends could explain what was going on. His nearby neigh-bors Jim Olson, Dave Trask and Rod Beem said they had received similar statements and didn’t know how to read theirs either. Like Dennis, their statements had many entries and negative dollar figures in the account summary. After they finished their coffee, Jim and Dennis drove their pickups to the offices of Market Advisory Services, Inc. There they met with Wes Rogers, the general manager. They had known Rogers for a number of years. Theirs kids played summer baseball together and their families went to the same church. Rogers offered them coffee but Jim and Dennis said they had already reached their limit for the morning. Rogers explained that the negative figures in an account showed paper losses in the futures and options markets. Those would be offset by the gains in value of their physical commodity, in this case, corn. They were told not to wor-ry their accounts were in good shape. Background Two years before, Marketing Advisory Services, Inc. (the Company), began a trading pro-gram for the benefit of agricultural producers by purchasing and selling futures and options contracts associated with their production and marketing of corn. The Company explained to producers that the trading program was intended to hedge the market risk of a fall in the price of corn. The Company used agreement forms with official language recognized by the U.S. Commodity Futures Trading Commission stating that "the purpose of the trading program was to hedge the risk associated with the ownership and marketing of corn". Approximately 100 agricultural producers, including Dennis, Jim, Dave and Rod, had signed a hedge agree-ment. As a producer of agricultural commodities the Hollingsworth farm is a large family business. It includes Dennis, his wife Marsha, a son at home, and daughter away at college. In a nor-mal year, they plant 1,200 acres of corn and an equal amount of soybeans. The scale of the operation requires the family to spend long hours involved in the preparation of farm ground, planting, spraying and harvesting. Center pivot irrigation is used during the summer months

Conley / International Food and Agribusiness Management Review / Volume 14, Issue 3, 2011
2011 International Food and Agribusiness Management Association (IFAMA). All rights reserved.
182
and the weather must be monitored continuously. Dennis checks commodity prices on the Internet, but because he spends so much time and effort on production activities, typically the corn and soybeans are sold at harvest taking the available price. Sometimes he stores the commodities for a later sale but this worries him about the financial loss that would come if there were a fall in prices. Dennis thought it would be beneficial to contract with the Compa-ny to handle the price risk management for his corn. That way he and his family could con-centrate on the production activities, and he could sleep at nights. While the farm sizes vary, Jim, Dave, Rod and the other agricultural producers were similar to Hollingsworth farm in their business activity. Since receiving the initial statements in the mail, a few months went by and subsequent statements continued to show negative figures. Dennis' concerns grew each time he was re-quired to deposit additional funds into the account. He didn’t understand why hedging 190,000 bushels of corn would require such a large amount of money. Dennis had gone to Iowa State University years before and learned about the concept of hedging. He vaguely understood margin calls. But, he thought those happened when prices were going up and a hedge had already locked in a price. The price of corn was not going up and yet he was add-ing more funds to his account. One day Jim approached Dennis recalling their earlier conversation in the coffee shop. He said a number of producers were worried. Jim explained that they all have concerns about the negative figures and the amount of money being required in their brokerage accounts. No one was satisfied with the explanation coming from Rogers, the general manager at the Com-pany. Subsequently, Dennis, Jim, Dave, Rod and a group of producers met to discuss their collective situation. They decided to engage an attorney, John Casper. Dennis and Jim had known John since childhood. They had been in cub scouts together and later on played high school football on the same team. They also contacted the U.S. Commodity Futures Trading Commission (CFTC) to see if experts there could shed some light on the situation. Dennis thought to himself, “Nobody said managing a business was going to be this complicated”! Two months went by and John called all of them to a meeting. He, along with the CFTC, had drafted a lawsuit alleging the Company and general manager had speculated with their cus-tomers accounts. It was at this time that some producers felt they could not participate in the lawsuit because of their long-time personal and family relationships with Wes Rogers. John showed them the following document.
UNITED STATES DISTRICT COURT
UNITED STATES COMMODITY ) FUTURES TRADING COMMISSION, ) Dennis Hollingsworth, Jim Olson, Dave ) Trask, Rod Beem, et al. ) Plaintiffs ) v. ) ) MARKETING ADVISORY SERVICES, ) INC., Wes Rogers ) Defendants )
Marketing Advisory Services and the Manager Allegedly Made Unauthorized, Speculative
Trades in Commodity Hedge Accounts that Caused Producers $5 Million in Losses

Conley / International Food and Agribusiness Management Review / Volume 14, Issue 3, 2011
2011 International Food and Agribusiness Management Association (IFAMA). All rights reserved.
183
Specifically, the lawsuit alleges that defendants were engaged to manage hedge accounts for the producers. As further alleged, without approval from the producers, and rather than fol-lowing the explicit instructions in the producers’ hedge account agreements, defendants exe-cuted a speculative trading strategy that resulted in approximately $5.1 million in trading losses for those producers. According to the lawsuit, defendants consistently led the produc-ers to believe that the defendants’ trading strategy would reduce the producers’ trading risks when, in fact, the trading strategy substantially increased the producers’ risks and their ulti-mate exposure to adverse price fluctuations. Commodity Futures Trading Commission Professor Chet Hill's phone rang in the early afternoon that day when the end of spring se-mester was about three weeks away.
"Hello, this is Robin Henke from the Division of Enforcement of the Commodity Futures Trading Commission in Washington, DC. I have on the line with me, Scott Robert, and we are attorneys investigating the case of a company in your state called Marketing Advisory Services, Inc. We got your name from an Internet search and understand you are an ex-pert on commodity futures and options. We see that you teach a graduate course for fi-nance students. Is that correct?" Chet responded, "Yes, you have the right person." Robin continued, "We would like to engage you, or someone you recommend, as an ex-pert to help us untangle and evaluate the complicated trades that took place in the accounts of agricultural producers who were customers of Marketing Advisory Services. A poten-tial lawsuit could take place in the District Court in your state and the expert would need to explain to a jury what happened and why. Are you interested?" After some additional conversation Chet said, "Please send me any information you think would help me understand the situation. I will keep it confidential and let you know in about two weeks, if that works for you?" "That's fine,” said Robin. “I'll send the details electronically and talk to you in about two weeks."
Chet Hill reviewed the material and thought he could untangle the multiple positions record-ed on the futures commission merchants statements. The CFTC wanted to know which of the positions, if any, were speculative and which ones were hedges. Two weeks later he called Robin and expressed an interest in being an expert for the case. Subsequently, Chet, Robin and Scott flew to Chicago and met at the offices of the CFTC. The purpose was two-fold. The attorneys wanted to personally evaluate the communication skills and maturity of Hill to see if he would be a capable expert on the witness stand in a court room. They knew he had a good intellectual quotient (IQ) but wanted to evaluate his emotional quotient (EQ). Sometimes an academic can go off on an argumentative, emotional tangent - a behavior that a skillful defense attorney might provoke and exploit. They also wanted to see how he would present an analysis to a jury. Futures and options transactions are complicated. Explaining hedging and speculation to someone who has no background or experience with the same can be a daunting task. The attorneys were comfort-

Conley / International Food and Agribusiness Management Review / Volume 14, Issue 3, 2011
2011 International Food and Agribusiness Management Association (IFAMA). All rights reserved.
184
ed when Hill expressed his expectation that a jury's comprehension level was at the same lev-el as a twelve-year old. Any written material or verbal presentations had to be pitched at the same level as a Reader's Digest magazine. Hill showed the attorneys some examples of how he would evaluate the futures and options positions on the futures commission merchant statements similar to ones Dennis, Jim, Dave and Rod had received. In presenting the results to a jury, he would translate positions into simple graphs showing when a downward price move in the cash market would be offset by a hedge protecting the value of a producer’s commodity. He would use the same graphical analysis to show any positions offering no downward price protection resulting in specula-tion. A week after the meeting in Chicago, Robin called Chet and invited him to be their ex-pert. Exhibits Dr. Hill prepared a detailed, written report and summary evaluation of the 13 months of trad-ing positions placed by Marketing Advisory Services, Inc. on behalf of their 100 customers. The report included supporting documentation and was 250 pages in length. In early Octo-ber, Robin Henke and Scott Robert came from Washington, DC to Dr. Hill's university. Chet met them at the airport, got them checked into the hotel, stopped at a deli for sandwiches to go, and they all sat down to work going through the report in detail. The attorneys for the CFTC wanted a clear determination on which, if any, trade activity and positions in an account were speculative. If any positions were speculative, then the defend-ants could be charged with breach of contract, at a minimum, and there would be civil penal-ties. If defendants had producers sign the hedge agreement and knowingly intended to take speculative positions, then fraud was possible as a criminal offense and the penalties would be much higher. In preparation for a possible jury trial, the following exhibits developed by Dr. Hill are attached.
Exhibit A: Interpretation of the Commodity Futures Trading Commission’s Definition of Hedging Exhibit B: Futures Contract Exhibit C: Options Exhibit D: Gains and Losses on Positions in the Cash, Futures & Options Markets
Opening Questions for the Case Once Dennis, Jim, Dave and Rod along with other producers, saw the proposed lawsuit against Marketing Advisory Services, Inc. and the general manager, they were unsure of what to do.
• Should they go ahead and file the lawsuit? • Even with the CFTCs participation in the lawsuit, does the case have merit? • Were they going to have financial losses from the trading activity?

Conley / International Food and Agribusiness Management Review / Volume 14, Issue 3, 2011
2011 International Food and Agribusiness Management Association (IFAMA). All rights reserved.
185
Exhibit A: Interpretation of the Commodity Futures Trading Commission’s Definition of Hedging It is necessary to understand the components that make up the definition of hedging and that apply in this case. The CFTC definition in 1.3(z) has the following text:
Bona fide hedging transactions and positions … shall mean transac-tions or positions in a contract for future delivery on any contract mar-ket, or in a commodity option,
The text “transactions or positions in a contract for future delivery on any contract market” means that the customer bought or sold a futures contract on a board of trade designated by the CFTC as a contract market. An example would be the sale on July 15 of a December 2010 corn futures contract on the CBOT. If the customer still holds the December futures contract when it expires, typically in late November, then the customer is obligated to deliver corn to Chicago. The text “or in a commodity option” means that the customer bought or sold an option con-tract. An example would be to buy a December 2010 put for corn. This gives the customer the right, but not the obligation, to exercise the option and sell a December corn futures con-tract. The same delivery conditions apply as above if the option is exercised and the futures contract is held until expiration. The next component in the definition of hedging adds to the text above. It is critical to de-termining if a transaction or position is a bona fide hedge and is as follows:
where such transactions or positions normally represent a substitute for transactions to be made or positions to be taken at a later time in a physical marketing channel,
This means that the customer has taken a position in the futures or options market as a substi-tute for a corresponding type of transaction to be made later on in a physical market. An ex-ample would be to sell a December 2010 corn futures contract on July 15 of 2010. This sale in the futures market is often called the sale of “paper bushels”. The futures market sale of “paper bushels” serves as a substitute for the sale of physical bushels at a later time in the lo-cal cash market. The physical bushels would normally be available for sale after harvest. The same could be done using a commodity option. An example would be to buy a Decem-ber 2010 put. This put gives the customer the right, but not the obligation, to sell a December 2010 futures contract. Either the put option or the futures contract would serve as a substitute for the sale at a later time of physical corn in the local cash market. The next component of the definition of hedging adds to the text above:
and where they are economically appropriate to the reduction of risks in the conduct and management of a commercial enterprise,
The “they” refers to the hedging transactions or positions taken in the futures or options mar-ket as in the examples given above. And, those transactions or positions reduce the economic risks associated with a commercial business, such as a farm operation. An example of eco-

Conley / International Food and Agribusiness Management Review / Volume 14, Issue 3, 2011
2011 International Food and Agribusiness Management Association (IFAMA). All rights reserved.
186
nomic risk for a farm is the variability of corn prices over time. Any corn owned or being produced by the farmer is not priced until it is sold. A position in the futures or options mar-ket is one way to fix the price of the corn so the farmer has some assurance of knowing what price will be received for the corn. Fixing the price of corn reduces the economic risk. The next component of the definitions follows the text above, and where they arise from:
(i) The potential change in the value of assets which a person owns, produces,
manufactures, processes, or merchandises or anticipates owning, producing, manufacturing, processing, or merchandising,
The “they” again refers to the hedging transactions or positions taken in the futures or options market. The need for the positions arises from “the potential change in the value of assets which a person owns,” etc. An example in this case is that corn owned or being produced by a farmer is an asset. Text for the definition of hedging continues as follows:
(ii) The potential change in the value of liabilities which a person owns or anticipates incurring, or
(iii) The potential change in the value of services which a person provides, purchases, or anticipates providing or purchasing.
This text refers to liabilities or services and does not apply in this case. Additional clarifica-tion on hedging continues with the following text:
Notwithstanding the foregoing, no transactions or positions shall be classified as bona fide hedging unless their purpose is to offset price risks incidental to commercial cash or spot operations and such positions are established and liquidated in an orderly manner in accordance with sound commercial practices and, for transactions or positions on contract markets subject to trading and position limits in effect pursuant to section 4a of the Act, unless the provisions of paragraphs (z)(2) and (3) of this section and §§ 1.47 and 1.48 of the regulations have been satisfied.
Exhibit B: Futures Contract Examples of Hedging Using Futures Contracts One of the functions of a futures market is to manage price level risk for a commercial hedger by transferring it to a second party. This can be done with hedging. Example 1: The goal is to fix the price of an anticipated transaction in the cash market – one that will oc-cur at some future date. The transaction in the futures market acts as a temporary substitute for a cash sale that will happen later. On May 1 a farmer has finished planting corn that will be harvested in the fall around October 15. The farmer wants to avoid the economic risk from the variability of corn prices during the season so a decision is made to fix the price. The following table shows the entries for the CASH and FUTURES markets, and the BASIS.

Conley / International Food and Agribusiness Management Review / Volume 14, Issue 3, 2011
2011 International Food and Agribusiness Management Association (IFAMA). All rights reserved.
187
Date Cash Futures Basis May 1 Plants corn for target
price $2.50 Sell December futures at $2.70
$0.20 under
October 15 Sell cash corn for $2.18 Buy December future at $2.38
$0.20 under
-$0.32 +$0.32 $0.00 On May 1 the quote for the December futures price on the Chicago Board of Trade (CBOT) is $2.70 per bushel as shown in the FUTURES column. The farmer knows from past history that the local cash price at harvest is normally 20 cents under the December futures price. This is shown in the Basis column for May 1. Using this information the farmer calculates a local target price of $2.50 ($2.70 December futures on May 1 less the expected 20 cents dif-ference between the futures and cash price at harvest). This is shown in the CASH column. The farmer’s goal on May 1 is to fix the price at $2.50. In order to fix the price, the farmer has a broker sell a December futures contract for corn on the Chicago Board of Trade (CBOT) at the current quote of $2.70 on May 1. The sale of the December futures contract is a substitute for the cash sale that will occur later in the fall. In the fall the farmer harvests the corn and decides to sell it in the local market on October 15. The local cash price is $2.18 showing a decline of $0.32 from the target price of $2.50 hoped for on May 1. Without a hedge, the decline in the local cash price would have resulted in a revenue loss to the farmer. At the same time as the cash sale on October 15, the farmer is ready to offset the May 1 sale of the December futures contract. On October 15 the farmer has the broker buy a December futures contract on the CBOT at a price of $2.38, and this clears out the farmer’s position in the futures market. The gain in the futures market is $0.32. This comes from the May 1 sale of the December contract at $2.70 and the purchase of an offsetting contract on October 15 at $2.38. In this example, there is no change in the basis over the time period. On October 15 the actu-al difference between the December futures price and the local cash price (BASIS) remains at $0.20 under. The final selling price on October 15 for the corn is $2.50 (the $2.18 cash price received on October 15 plus $0.32 from futures market). The sale of the December futures contract on May 1 served as a substitute for the cash sale that came later on October 15. Once the cash sale was made, the buying of a December futures contract offset the May 1 position in the futures market. By fixing the price for corn in early May, the farmer reduced the economic risk from price variability. Example 2 – Basis Gain: Local cash prices in Nebraska and the December futures prices on the CBOT do not always move up or down in exact parallel. Local supply and demand conditions affect the local price. Expectations about future supply and demand at the U.S. and world level affect futures prices. As a result the BASIS can change. This hedge removes the price level risk the same as in Example 1, but the basis changes.

Conley / International Food and Agribusiness Management Review / Volume 14, Issue 3, 2011
2011 International Food and Agribusiness Management Association (IFAMA). All rights reserved.
188
Date Cash Futures Basis May 1 Plants corn for target
price $2.50 Sell December futures at $2.70
$0.20 under
October 15 Sell cash corn for $2.18 Buy December futures at $2.35
$0.17 under
-$0.32 +$0.35 + $0.03 The final selling price for the corn on Oct 15 is $2.53 (the $2.18 cash price received on Oct 15 plus $0.35 from the futures market). The change in the basis added 3 cents to the original target price of $2.50. Example 3 – Basis Loss: Date Cash Futures Basis May 1 Plants corn for target
price $2.50 Sell December futures at $2.70
$0.20 under
October 15 Sell cash corn for $2.18 Buy December futures at $2.41
$0.23 under
-$0.32 +$0.29 - $0.03 The final selling price on October 15 for the corn is $2.47 (the $2.18 price received on Octo-ber 15 plus $0.29 from the futures market). The change in the basis reduced the target price by $0.03. Graphic Analysis One way to understand hedging using futures contracts can be shown with the help of Figure 2. In the earlier examples two specific dates were used - May 1 and October 15, when look-ing at the cash and futures prices. This graphic analysis shows what happens over a range of prices.
Figure 2. Long Cash and Short December Futures
-$0.80
-$0.60
-$0.40
-$0.20
$0.00
$0.20
$0.40
$0.60
$0.80
$1.60 $1.80 $2.00 $2.20 $2.40 $2.60
Cash Prices with $0.40 Basis
$ / b
ushe
l
Long Cash at $2.00
Short Dec Futures at $2.40

Conley / International Food and Agribusiness Management Review / Volume 14, Issue 3, 2011
2011 International Food and Agribusiness Management Association (IFAMA). All rights reserved.
189
In this example, a farmer who owns corn is defined as being in a “long” position. The goal is to lock in a local cash price of $2.00 so the legend on the graph shows “Long Cash at $2.00”. The sale of a December futures contract is defined as being in a “short” position. The differ-ence in price between the December futures contract and the local cash price is 40 cents – recall this is the basis. The legend on the graph shows “Short Dec Futures at $2.40”. The hedge table using the May 1 date starts out as follows: Date Cash Futures Basis May 1 Long (own) corn at $2.00 Short (sell) December
futures at $2.40 $0.40 under
In Figure 3, the local cash price increases over time from $2.00 to $2.20 on the x-axis. The intersection of the $2.20 price level with the Long Cash line results in a cash market gain of $0.20. This is shown on the y-axis.
Figure 3. Long Cash and Short December Futures Assuming no change in the basis, the December futures price will also increase in parallel with the cash price going from $2.40 to $2.60. This is equivalent to the cash price moving from $2.00 to $2.20 as is shown on the x-axis. However, the sale of a futures contract results in a loss of $0.20. The gain in the local cash market is equally offset by the loss in the futures market. The net price remains locked in at $2.00. This is shown in the figure by the line “Gain/Loss on Cash Price”. The gain or loss was zero and the farmer ends up with a final selling price of $2.00 ($2.20 from the cash sale less $0.20 in the futures market). The complete hedge table is as follows:
-$0.80
-$0.60
-$0.40
-$0.20
$0.00
$0.20
$0.40
$0.60
$0.80
$1.60 $1.80 $2.00 $2.20 $2.40 $2.60
Cash Prices with $0.40 Basis
$ / b
ushe
l
Long Cash at $2.00Short Dec Futures at $2.40Gain/Loss on Cash Price

Conley / International Food and Agribusiness Management Review / Volume 14, Issue 3, 2011
2011 International Food and Agribusiness Management Association (IFAMA). All rights reserved.
190
Date Cash Futures Basis May 1 Long (own) corn at $2.00 Short (sell) December
futures at $2.40 $0.40 under
October 15 Sell cash corn for $2.20 Long (buy) December futures at $2.60
$0.40 under
+$0.20 -$0.20 $0.00 If the local cash price moves down over time, say to a $1.70, then the loss without hedging is $0.30. Placing a hedge using the December futures contract would result in a gain of $0.30 to offset the loss, and the final selling price remains at $2.00. This is shown in Figure 4.
Figure 4. Long Cash and Short December Futures In the first scenario the local cash price moved up from $2.00 to $2.20. If the farmer had not hedged and chosen to not fix the price, then this would be considered a speculative gain real-ized from continuing to take the economic risk associated with market price variability. In the second scenario the local cash price went down from $2.00 to $1.70. Without the hedge there would be a speculative loss. The benefit from hedging, the matching of a long position in the local cash market with a corresponding short position in the futures market, is to reduce the economic risk of price variability. Exhibit C: Options The word “option” helps describe what is involved with an option contract. By paying a price, called a premium, a person can buy an option that gives them the choice of acquiring an asset or not. If acquiring the asset becomes attractive, the person can choose to exercise the option. Otherwise the person can let the option expire and the only cost is the premium paid.
-$0.80
-$0.60
-$0.40
-$0.20
$0.00
$0.20
$0.40
$0.60
$0.80
$1.60 $1.80 $2.00 $2.20 $2.40 $2.60
Cash Prices with $0.40 Basis
$ / b
ushe
l
Long Cash at $2.00Short Dec Futures at $2.40Gain/Loss on Cash Price

Conley / International Food and Agribusiness Management Review / Volume 14, Issue 3, 2011
2011 International Food and Agribusiness Management Association (IFAMA). All rights reserved.
191
A person cannot only buy an option on an asset, but can also sell an option for which a pre-mium is received. Under the contract, the person is obligated to deliver the asset if the option is exercised. Either way, the seller of the option gets to keep the premium. Insurance Analogy Using options to reduce price risk by farmers is somewhat the same as buying car insurance. We pay a premium to insure against the risk of an accident or damage to our car. The insur-ance company’s role is to reduce the financial costs of an accident or damage to our car, if that happens. If no claims are made, then our cost is the premium. If we have a claim, we recover an amount to pay for the damages – an amount that is typically much greater than the premium. We are reducing our risk and the insurance company is assuming the risk. It does so by collectively pooling the premiums from many customers knowing that only a few will suffer from an accident. A farmer hedges a price and reduces the economic risk by paying a premium for an option contract. The option contract is like an insurance policy. If the price of the corn goes up, the farmer has no financial loss and may receive a gain. If the price of the corn goes down in the cash market this creates a loss of revenue. The option contract becomes worth more and up-on exercising the option, the farmer can recover a payment to offset the loss in the physical market. When a farmer buys a PUT option the risk of economic loss is reduced. The farmer is selling the risk to someone else who is willing to assume the risk for a price – the price of the option. That someone else is like the insurance company and the farmer is like the insurance custom-er. However, when selling an option, either a PUT or a CALL, the farmer is taking on the role of the insurance company. The farmer is assuming someone else’s risk, rather than reducing his or her own risk, and collecting a premium for it.
Options Terminology An option contract gives the owner:
• The right to: Buy (referred to as a CALL option), or Sell (referred to as a PUT option)
• An underlying asset (e.g., futures contract) • For a certain agreed upon price • Called an exercise or strike price • For a limited period of time
Examples of buying and selling option contracts using the following table will help explain the terminology.

Conley / International Food and Agribusiness Management Review / Volume 14, Issue 3, 2011
2011 International Food and Agribusiness Management Association (IFAMA). All rights reserved.
192
Table 2. Relationship between Strike Prices and Option Premiums
Buying a PUT Option Buying a PUT option gives the owner the right, but not the obligation, to a short position in the underlying futures contract. Buying a PUT gives the owner the right to sell a futures con-tract. The decision to buy a PUT option involves choosing the futures contract month and a strike price. See the above table. In this example, the contract month is for the December futures, and on this particular day the futures price is $2.20. In the options market a number of strike prices are established on either side of the underlying futures price. Here they range from a low of $1.90 to a high of $2.50 shown at 10-cent intervals. In the PUTs column are quoted market-determined premiums for either buying or selling a PUT. The premium for a chosen strike price of $2.20 is $0.05. This means a customer will need to pay $0.05 per bushel ($250 for a 5,000 bushel contract) for the PUT option. Owner-ship gives the customer the right to exercise the option. If the underlying December futures price declines, then the option may become more valua-ble and the customer will need to decide whether or not to exercise it. December futures prices would need to be at or below $2.15 ($2.20 minus the $0.05 premium cost) for the cus-tomer to consider exercising the option. See the following Figure 5. Let’s say December futures prices dropped to $2.05 and the customer exercised the option. The customer’s account receives a short December futures contract at $2.20. To offset that position the customer can now buy a December futures contract for $2.05. The net gain is $0.10 and is calculated as follows: $2.20 minus $0.05 for the option premium and minus $2.05 for the purchase cost of the more recent December futures contract. For a 5,000 bush-el contract the net gain would be $500 above the $250 cost of the option. Commission and fees charged by the broker are not included in these calculations.
Strike PremiumsPrices PUTs CALLs
Underlying $2.50 $0.33 $0.01December $2.40 $0.24 in-the-money $0.03 out-of-the-moneycorn futures $2.30 $0.15 $0.04at $2.20/bu. $2.20 $0.05 at-the-money $0.05 at-the-money
$2.10 $0.04 $0.15$2.00 $0.03 out-of-the-money $0.24 in-the-money$1.90 $0.01 $0.33

Conley / International Food and Agribusiness Management Review / Volume 14, Issue 3, 2011
2011 International Food and Agribusiness Management Association (IFAMA). All rights reserved.
193
Figure 5. Long Put Option If the December futures price stays above $2.15 for the time period involved, the customer has no financial incentive to exercise the option and lets it expire. See the above figure. The out-of-pocket cost is $0.05 or $250 on a 5,000-bushel contract plus commission and fees. The purchase of the December PUT option at a strike price of $2.20 for a $0.05/bu. premium is shown as being “at-the-money”. This means that the strike price is the same as the price of the underlying December futures contract. Not considering the premium cost, the $2.20 strike price is at a financial breakeven point. With the underlying December futures price of $2.20, the purchase of a PUT option at a higher strike price, for example $2.40 is “in-the-money”. The customer can exercise the op-tion and receive a short December futures contract that has a price of $2.40. One could im-mediately offset that short position with a long December futures contract at the current price of $2.20, and receive a net gain of $0.20 ($2.40 - $2.20). The option with a $2.40 strike price is “in-the-money” by $0.20. At the $2.50 strike price the option is “in-the-money” by $0.30. The PUT option premium at the $2.20 strike price is $0.24. This is made up of the $0.20 “in-the-money” value (formally called the intrinsic value) of the option, and the remaining $0.04 reflects the markets determination of value until the option is no longer traded on the ex-change (formally called the time value). In a similar manner, when the strike price is below the underlying futures price, then the val-ue of the option is “out-of-the-money”. The strike price of $2.00 is $0.20 below the underly-ing futures price of $2.20. Exercising the option would generate a loss of $0.20. That is, be-ing short a December futures contract at $2.00 and offsetting it with the purchase (long) De-cember futures at $2.20. Plus, one would also be out the option premium of $0.03. There is no financial incentive to exercise the option as long as the underlying December futures price remains above $1.97 ($2.00 strike price - $0.03 premium).
Hedging with a PUT Option The previous section tells about buying a PUT option and the decision to exercise it or not depending on profitability. The buying of a PUT option can also be used to hedge the price of corn owned in the local market. An example is shown in the following table.
Profit Futures price 0 $2.15 X Premium $0.05 X = Strike price $2.20 Loss

Conley / International Food and Agribusiness Management Review / Volume 14, Issue 3, 2011
2011 International Food and Agribusiness Management Association (IFAMA). All rights reserved.
194
Table 3. Establish a floor prices with a PUT option and exercise the option when the price declines. Date Local
Market Cash Price Futures
Price Basis Options Strike minus
Futures Price Premium
4/19 own $2.00 $2.20 $0.20 Buy December PUT $2.40 Strike Price
$0.20 $0.24
10/30 sell $1.70 $1.90 $0.20 Exercise December PUT
$0.50
Net Changes -$0.30 $0.30 $0.00
Cash price: $1.70 Minimum Price
Final price with exercised options:
$1.70 + $0.50 - $0.24 = $1.96
Cash price less premium:
$1.70 - $0.24 = $1.46
On April 19 a grower of corn owns the commodity in the local market somewhere in storage. The local cash price is $2.00 per bushel. The December futures price is $2.20, which is $0.20 above the local cash price as shown by the basis. The owner wants to fix a minimum or floor price to avoid any economic loss in value below that price. At the same time the owner wants the opportunity to gain from a price increase should that occur. A decision is made to buy a PUT option on the December futures contract at a strike price of $2.40. The premium cost is $0.24 per bushel. On October 30, the owner decides to sell the corn out of storage into the local market. The local cash price has declined to $1.70, and the December futures price moved down with it by the same amount - thus the basis remained at $0.20. By not exercising the December PUT option the owner would receive a net price of $1.46 ($1.70 - $0.24). Exercising the option gives the owner the right to a short position in the futures market. The owner receives a short December futures contract priced at the original strike price of $2.40. The actual December futures price on October 30 is $1.90. The owner buys a December fu-tures at $1.90 to offset the short December futures at $2.40, and receives a gain of $0.50 from the transaction. The final net price received is $1.96, and is made up of the $1.70 from the cash sale, plus the $0.50 from the options and December futures transactions, less the $0.24 premium cost of the option contract. The $1.96 price is in contrast to the cash price of $1.70 without an options position. In addition, the $1.96 price is considered a minimum or floor price. Even if the cash price declined to $1.60 or even to $1.50, the owner would still receive the floor price of $1.96. (This assumes that the basis does not change so the futures price declines by the same amount as the cash price.) As an example, let the local cash price be $1.55. The December futures contract would be bought for $1.75 to offset the short position of $2.40 from exercising the option. The final net

Conley / International Food and Agribusiness Management Review / Volume 14, Issue 3, 2011
2011 International Food and Agribusiness Management Association (IFAMA). All rights reserved.
195
price received of $1.96 would be made up of $1.55 from the cash sale, plus $0.65 from the options and December futures transactions, less the $0.24 premium. What happens when the cash price increases from $2.00 to $2.30? Table 4. Hedging with a PUT option and letting it expire when the price increases. Date Local
Market Cash Price Futures
Price Basis Options Strike minus
Futures Price Premium
4/19 own $2.00 $2.20 $0.20 Buy December PUT $2.40 Strike Price
$0.20 $0.24
10/30 sell $2.30 $2.50 $0.20 Exercise December PUT
-$0.10
Net Changes $0.30 -$0.30 $0.00
Cash price: $2.30 Minimum Price
Final price with exercised options:
$2.30 -$0.10 - $0.24 = $1.96
Cash price less premium:
$2.30 - $0.24 = $2.06
If the option were exercised, then the final price would be $1.96 or the minimum price. The best decision would be to let the option expire because the net price received would be $2.06 (cash price of $2.30 minus premium cost of $0.24). The placing of a hedge with the purchase of the PUT option helps reduce the economic risk that can occur with declining prices. In addition, a PUT option can capture some of the price increase, if that occurs. These two features show the advantage of a PUT option over the use of a futures contract. What happens if there is no change in the cash and futures prices? The following table shows that in this case the best decision is to exercise the option to regain $0.20 of the premium since the strike price was in-the-money. Table 5. Hedging with a PUT option and exercising it even with no price change. Date Local
Market Cash Price Futures
Price Basis Options Strike minus
Futures Price Premium
4/19 own $2.00 $2.20 $0.20 Buy December PUT $2.40 Strike Price
$0.20 $0.24
10/30 sell $2.00 $2.20 $0.20 Exercise December PUT
$0.20
Net Changes $0.00 $0.00 $0.00
Cash price: $2.00 Minimum Price
Final price with exercised options:
$2.00 + $0.20 - $0.24 = $1.96
Cash price less premium:
$2.00 - $0.24 = $1.76
However, if the original PUT option had a strike price of $2.10 that was out-of-the-money by $0.10, then the best decision would be to let the option expire and receive $1.97 as shown in the following table.

Conley / International Food and Agribusiness Management Review / Volume 14, Issue 3, 2011
2011 International Food and Agribusiness Management Association (IFAMA). All rights reserved.
196
Table 6. Hedging with a PUT option and letting it expire when prices do not change. Date Local
Market Cash Price Futures
Price Basis Options Strike minus
Futures Price Premium
4/19 own $2.00 $2.20 $0.20 Buy December PUT $2.10 Strike Price
-$0.10 $0.03
10/30 sell $2.00 $2.20 $0.20 December PUT Expire
-$0.10
Net Changes $0.00 $0.00 $0.00 Cash price: $2.00 Minimum Price
Final price with exercised options:
$2.00 -$0.10 - $0.03 = $1.87
Cash price less premium:
$2.00 - $0.03 = $1.97
Graphic Analysis for Options The understanding of options contracts and positions can be shown with the help of the fol-lowing figure. In the earlier tables on hedging two specific dates were used – April 19 and October 30, when comparing the cash price to the net price received using options. The fol-lowing graphic analysis shows what happens over a range of prices.
Figure 6. Long Cash with December PUT Option As the cash price ranges from $1.50 to $2.60, the line “Long Cash at $2.00” shows the difference from the initial cash price of $2.00 to be hedged on April 19. For example, if the cash price after April 19 is $1.60, then the difference shown on the y-axis is a minus $0.40. The strike price on the December PUT option was $2.40 and the premium was $0.24. At a cash price of $2.20, and given the basis of $0.20, the December futures price would match the
-$0.80
-$0.60
-$0.40
-$0.20
$0.00
$0.20
$0.40
$0.60
$0.80
$1.50 $1.60 $1.70 $1.80 $1.90 $2.00 $2.10 $2.20 $2.30 $2.40 $2.50 $2.60
Diff
eren
ce fr
om C
ash
Pric
e of
$2.
00/b
ushe
l
Cash Prices with $0.20 Basis
Long Cash at $2.00Gain/Loss Dec PUT $2.40 Gain/Loss Cash + PUT Option

Conley / International Food and Agribusiness Management Review / Volume 14, Issue 3, 2011
2011 International Food and Agribusiness Management Association (IFAMA). All rights reserved.
197
option strike price. The option would still be out-of-the money by $0.24, the cost of the op-tion. The line “Gain/Loss Dec PUT $2.40” shows the $0.24 loss on the y-axis at the $2.20 cash price. At the lower cash price of $1.60 and a December futures price of $1.80, the option would be in-the-money by $0.36. The option would be exercised and the hedger would receive a short position in a December futures contract at $2.40. A December long position is bought at $1.80 to offset the short position for a gross gain of $0.60. Subtracting the $0.24 cost of the PUT option results in a net gain of $0.36 as shown on the y-axis. The combination of the lines “Long Cash at $2.00” and “Gain/Loss Dec PUT $2.40” is shown by the line “Gain/Loss Cash + PUT Option”. At the $1.60 cash price, the final net price received would be $1.96 ($1.60 plus $0.36 from the option). This is the minimum or floor price. The difference of minus $0.04 from the desired $2.00 cash price is shown on the y-axis. If the cash price moves above $2.20, then the line “Gain/Loss Cash + PUT Option” moves in a positive direction and the difference shown on the y-axis turns positive. At a cash price of $2.30, the difference from the $2.00 hedge price is a positive $0.06. The final net price re-ceived would be $2.06 ($2.30 from the cash price less the premium cost of $0.24). As de-scribed in a previous table for a price increase, the option would not be exercised in this case and allowed to expire. The following figure shows the net price received over the range of cash prices.
Figure 7. Net Price Received Using a PUT Option. On the x-axis at the cash price of $2.00 being hedged on April 19, the minimum or floor price that would be received is $1.96 as shown on the y-axis. The same holds for any decline in cash prices between April 19 and October 30. If cash prices increase to $2.20, the same floor price would be received.
$1.60
$1.80
$2.00
$2.20
$2.40
$2.60
$1.60 $1.80 $2.00 $2.20 $2.40 $2.60
Cash Prices with $0.20 Basis Dec
Net
Pric
e R
ecei
ved
($ /
bush
el)

Conley / International Food and Agribusiness Management Review / Volume 14, Issue 3, 2011
2011 International Food and Agribusiness Management Association (IFAMA). All rights reserved.
198
Above the $2.20 cash price, the net price received moves above the $1.96 floor as shown by the upward sloping line. At $2.24 cash, the arrow shows the price received would equal the desired hedge price of $2.00. Above $2.24 the price received exceeds the hedge price of $2.00 and illustrates the motiva-tion for using PUT options to hedge. The owner of corn can have a floor price that reduces the economic risk of declining prices, and at the same time be in a position to receive a higher price if prices go up. Buying a CALL Option Buying a CALL option gives the owner the right, but not the obligation, to a long position in the underlying futures contract. Buying a CALL gives the owner the right to buy a futures contract. The procedures that apply to buying a PUT option also apply for buying a CALL option. For example, buying a December CALL option at a strike price of $2.00 gives the owner the right to exercise the option and receive a long December futures contract with a price of $2.00. It is “in-the-money” because an offsetting futures contract can be sold for $2.20. It is in-the-money by $0.20 (long futures at $2.00 and sell at $2.20). The decision to exercise the option also needs to take into account the premium cost. In this example it is $0.24. As shown in Figure 8, it becomes profitable to exercise the option when the futures price goes above $2.24. Otherwise, the owner would let it expire.
Figure 8. Long Call Option
Selling a PUT Option Selling a PUT option can obligate the seller to place the buyer in a short position in the un-derlying futures contract. The seller is placed in a long position opposite the one given to the buyer. This can happen at any time when the buyer exercises the option. Selling a PUT gives the buyer a right to a short position in the futures contract, if the buyer exercises the option.
Profit Current futures price $2.20 $2.24 0 $0.24 Premium X Futures price X = Strike price $2.00 Loss

Conley / International Food and Agribusiness Management Review / Volume 14, Issue 3, 2011
2011 International Food and Agribusiness Management Association (IFAMA). All rights reserved.
199
A person that sells a PUT option with a strike price of $2.40 will receive a premium of $0.24/bu. ($1,200 for a 5,000 bu. contract). This is similar to an insurance company that sells insurance contracts for a premium. The buyer of the PUT, similar to the insurance customer, paid $0.24 and has the right to a short position in the December futures contract at $2.40. What happens if the underlying December futures price declines? If the futures price does go below $2.16 then there is a financial incentive for the PUT buyer to exercise it. For example, if the December futures price goes to $2.10, then the PUT buyer can realize a net gain of $0.06. The buyer exercises the option and receives a short December futures contract at $2.40, buys an offsetting contract for $2.10, subtracts the $0.24 premium cost and ends up with a $0.06 gain not counting commission and fees. The seller of the PUT option is placed in a long position in the futures contract opposite the short position provided the buyer. The seller is long December futures at $2.40. To offset this position, the seller goes short a December futures at the current price of $2.10. The loss to the seller is $0.06 (long at $2.40 minus the short sale at $2.10, plus the premium received of $0.24). See the following figure that shows the situation for the seller.
Figure 9. Short Put Option Selling a PUT option has a certain amount of downside risk. Hypothetically if the December futures price went to zero dollars, then the seller’s loss would be a maximum of $2.16 in this example. That is, long at $2.40 minus a short sale at $0.00, plus the premium received of $0.24. The seller of the PUT is betting that the underlying December futures price will not decline below $2.16 ($2.40 strike price - $0.24 premium cost to the buyer). The buyer will let the option expire and the seller will get to keep the premium. Selling a CALL Option Selling a CALL option can obligate the seller to place the buyer in a long position in the un-derlying futures contract. The seller is placed in a short position opposite the one given to the buyer. This can happen at any time when the buyer exercises the option. Selling a CALL
Short Put Option Profit $2.16 Premium $0.24 0 Futures price X X = Strike price $2.40 Loss
Conley / International Food and Agribusiness Management Review / Volume 14, Issue 3, 2011
2011 International Food and Agribusiness Management Association (IFAMA). All rights reserved.
200
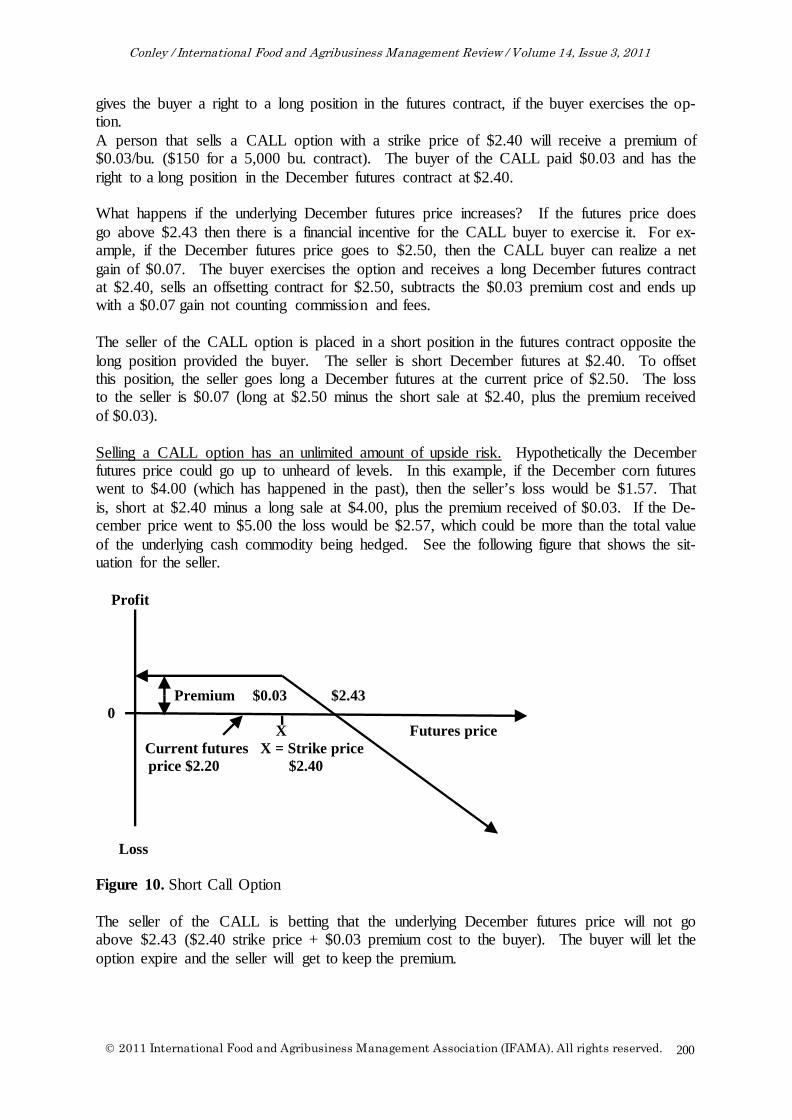
gives the buyer a right to a long position in the futures contract, if the buyer exercises the op-tion. A person that sells a CALL option with a strike price of $2.40 will receive a premium of $0.03/bu. ($150 for a 5,000 bu. contract). The buyer of the CALL paid $0.03 and has the right to a long position in the December futures contract at $2.40. What happens if the underlying December futures price increases? If the futures price does go above $2.43 then there is a financial incentive for the CALL buyer to exercise it. For ex-ample, if the December futures price goes to $2.50, then the CALL buyer can realize a net gain of $0.07. The buyer exercises the option and receives a long December futures contract at $2.40, sells an offsetting contract for $2.50, subtracts the $0.03 premium cost and ends up with a $0.07 gain not counting commission and fees. The seller of the CALL option is placed in a short position in the futures contract opposite the long position provided the buyer. The seller is short December futures at $2.40. To offset this position, the seller goes long a December futures at the current price of $2.50. The loss to the seller is $0.07 (long at $2.50 minus the short sale at $2.40, plus the premium received of $0.03). Selling a CALL option has an unlimited amount of upside risk. Hypothetically the December futures price could go up to unheard of levels. In this example, if the December corn futures went to $4.00 (which has happened in the past), then the seller’s loss would be $1.57. That is, short at $2.40 minus a long sale at $4.00, plus the premium received of $0.03. If the De-cember price went to $5.00 the loss would be $2.57, which could be more than the total value of the underlying cash commodity being hedged. See the following figure that shows the sit-uation for the seller.
Figure 10. Short Call Option The seller of the CALL is betting that the underlying December futures price will not go above $2.43 ($2.40 strike price + $0.03 premium cost to the buyer). The buyer will let the option expire and the seller will get to keep the premium.
Profit Premium $0.03 $2.43 0 X Futures price Current futures X = Strike price price $2.20 $2.40 Loss

Conley / International Food and Agribusiness Management Review / Volume 14, Issue 3, 2011
2011 International Food and Agribusiness Management Association (IFAMA). All rights reserved.
201
Differences between an option contract and a futures contract:
• The owner of an option contract has the right but not the obligation to buy or sell at the strike price.
• Exercising the option contract and taking a position in the underlying asset (futures
contract) is at the owner’s discretion.
• The decision to exercise the option will depend on the financial incen-tives/disincentives associated with the option contract and the underlying asset.
• The buyer of an option (put or call) makes only one premium payment.
• There is no margin account, initial margin or margin call.
• If the option expires without being exercised the owner does not make or take deliv-
ery of the asset in the underlying futures contract.
• The downside loss on an option contract is limited to the premium payment.
• The upside gain is unlimited depending on what happens to the underlying asset (fu-tures contract), and the underlying commodity associated with the futures contract.
Exhibit D: Gains and Losses on Positions in the Cash, Futures and Options Markets
Figure 11. May, June, July, August and September 2002.
-$1.60
-$1.20
-$0.80
-$0.40
$0.00
$0.40
$0.80
$1.20
$1.50 $1.60 $1.70 $1.80 $1.90 $2.00 $2.10 $2.20 $2.30 $2.40 $2.50 $2.60
$ / b
ushe
l
Cash Prices with $0.40 Basis
Long Cash at $2.00Gain/Loss w/ Options & FuturesGain/Loss Cash + Options & Futures


![Conley s Motion[1]](https://static.fdocuments.us/doc/165x107/577d358a1a28ab3a6b90bbc2/conley-s-motion1.jpg)