U.S.- China Relations · From Washington to Main Street: The U.S. Turns on China % Source: Pew...
23
Unsustainable Codependency: From Trade War to Cold War? Stephen S. Roach American Economic Challenges Symposium University of Wisconsin October 11, 2019 U.S.- China Relations
Transcript of U.S.- China Relations · From Washington to Main Street: The U.S. Turns on China % Source: Pew...

Unsustainable Codependency:
From Trade War to Cold War?
Stephen S. Roach
American Economic Challenges Symposium
University of Wisconsin
October 11, 2019
U.S.- China Relations
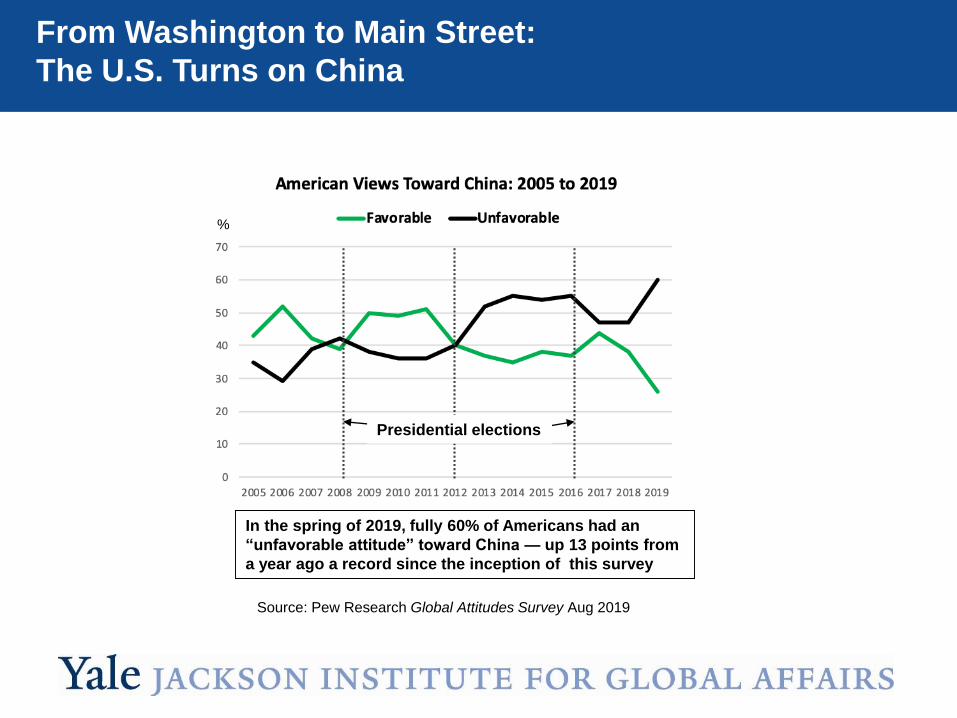
From Washington to Main Street:
The U.S. Turns on China
%
Source: Pew Research Global Attitudes Survey Aug 2019
In the spring of 2019, fully 60% of Americans had an
“unfavorable attitude” toward China — up 13 points from
a year ago a record since the inception of this survey
Presidential elections
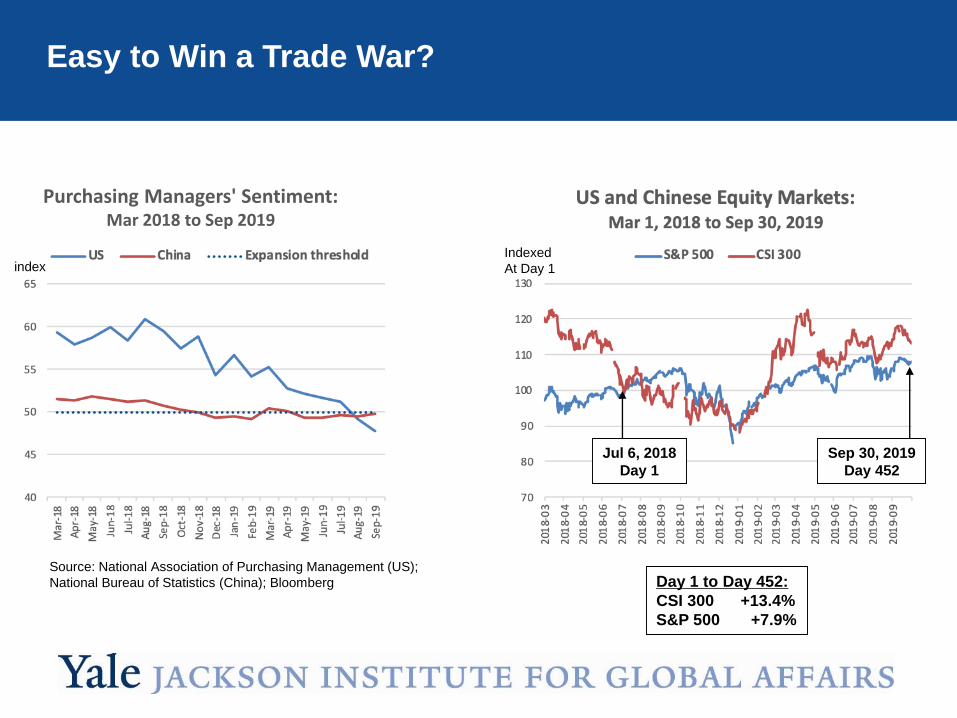
Easy to Win a Trade War?
Source: National Association of Purchasing Management (US);
National Bureau of Statistics (China); Bloomberg
index
Purchasing Managers' Sentiment:Mar 2018 to Sep 2019
Indexed
At Day 1
Jul 6, 2018
Day 1
Sep 30, 2019
Day 452
Day 1 to Day 452:
CSI 300 +13.4%
S&P 500 +7.9%
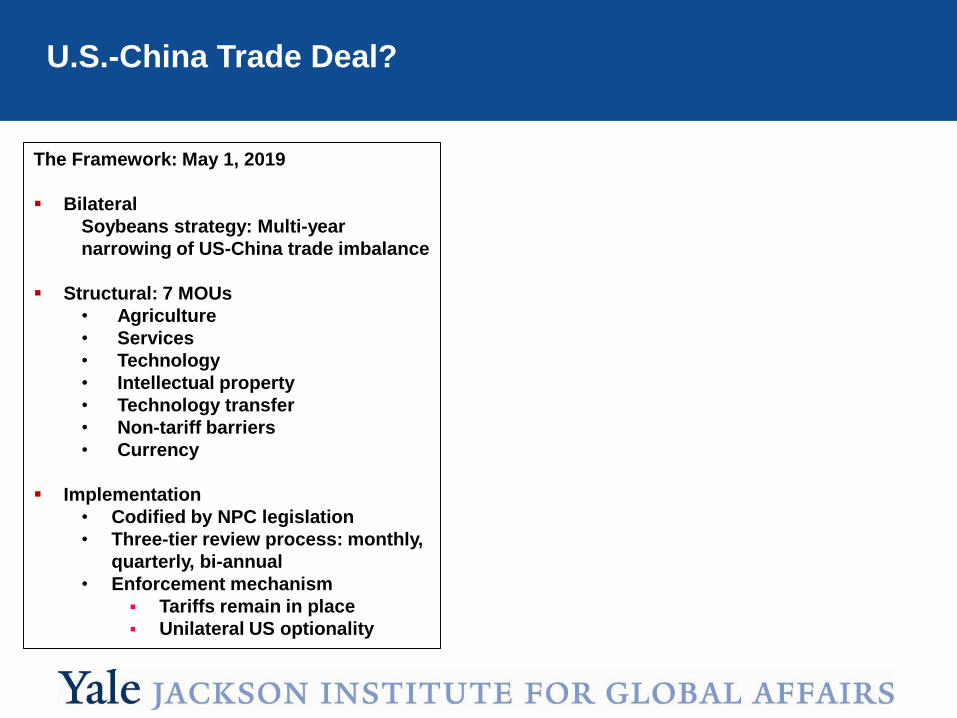
U.S.-China Trade Deal?
The Framework: May 1, 2019
Bilateral
Soybeans strategy: Multi-year
narrowing of US-China trade imbalance
Structural: 7 MOUs
• Agriculture
• Services
• Technology
• Intellectual property
• Technology transfer
• Non-tariff barriers
• Currency
Implementation
• Codified by NPC legislation
• Three-tier review process: monthly,
quarterly, bi-annual
• Enforcement mechanism
Tariffs remain in place
Unilateral US optionality

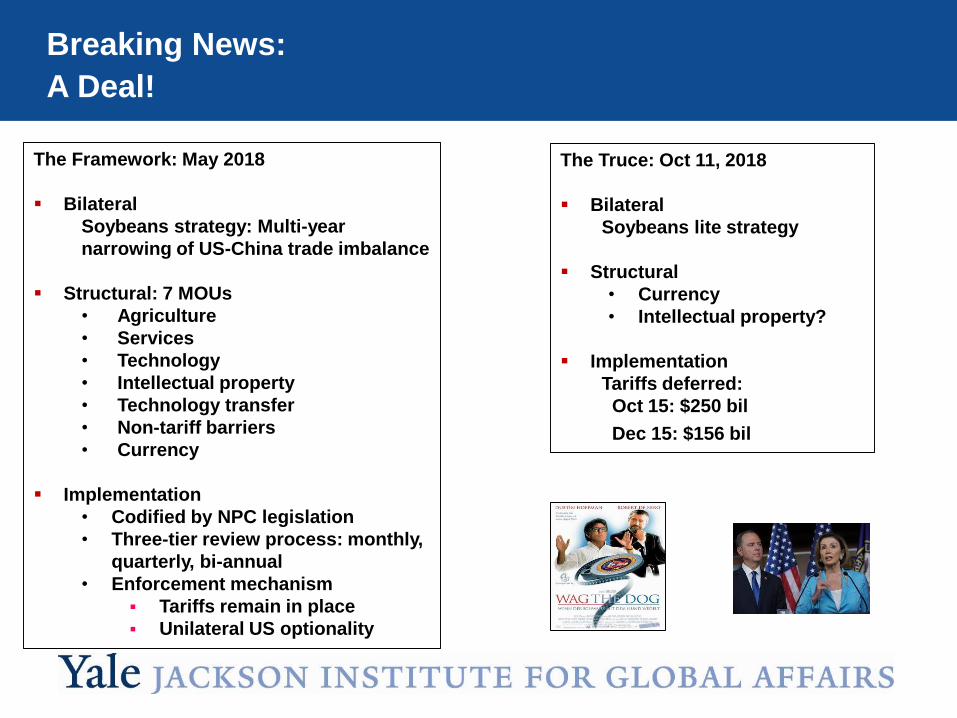
Breaking News:
A Deal!
The Framework: May 1, 2018
Bilateral
Soybeans strategy: Multi-year
narrowing of US-China trade imbalance
Structural: 7 MOUs
• Agriculture
• Services
• Technology
• Intellectual property
• Technology transfer
• Non-tariff barriers
• Currency
Implementation
• Codified by NPC legislation
• Three-tier review process: monthly,
quarterly, bi-annual
• Enforcement mechanism
Tariffs remain in place
Unilateral US optionality
The Truce: Oct. 11, 2018
Bilateral
Soybeans “lite” strategy
Structural
• Currency
• Intellectual property?
Implementation
Tariffs deferred:
Oct 15: $250 bil
Dec 15: $156 bil
What changed?
Breaking News:
A Deal!
The Framework: May 2018
Bilateral
Soybeans strategy: Multi-year
narrowing of US-China trade imbalance
Structural: 7 MOUs
• Agriculture
• Services
• Technology
• Intellectual property
• Technology transfer
• Non-tariff barriers
• Currency
Implementation
• Codified by NPC legislation
• Three-tier review process: monthly,
quarterly, bi-annual
• Enforcement mechanism
Tariffs remain in place
Unilateral US optionality
The Truce: Oct 11, 2018
Bilateral
Soybeans lite strategy
Structural
• Currency
• Intellectual property?
Implementation
Tariffs deferred:
Oct 15: $250 bil
Dec 15: $156 bil
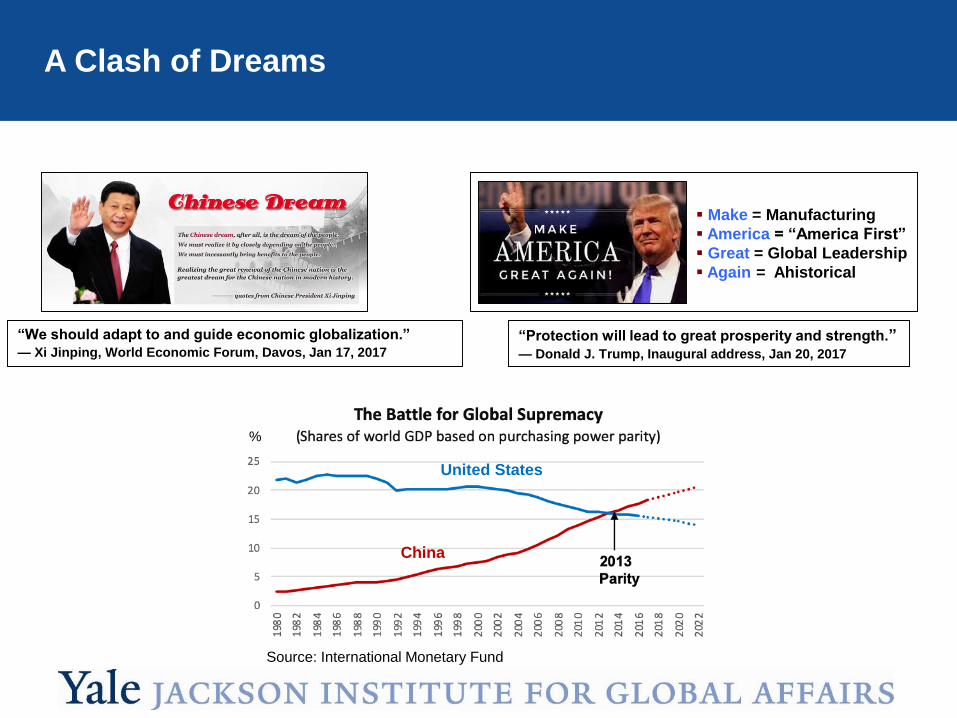
A Clash of Dreams
Make = Manufacturing
America = “America First”
Great = Global Leadership
Again = Ahistorical
“Protection will lead to great prosperity and strength.”— Donald J. Trump, Inaugural address, Jan 20, 2017
“We should adapt to and guide economic globalization.”
— Xi Jinping, World Economic Forum, Davos, Jan 17, 2017
%
Source: International Monetary Fund
China
United States

America’s Case for Conflict
%
%
Source: US Bureau of Labor Statistics and BEA
China WTO
accession
Jobs Share
Peak (1953) 16.3 m 32.4%
Latest (2019) 12.9 m 8.5%
China WTO
accession
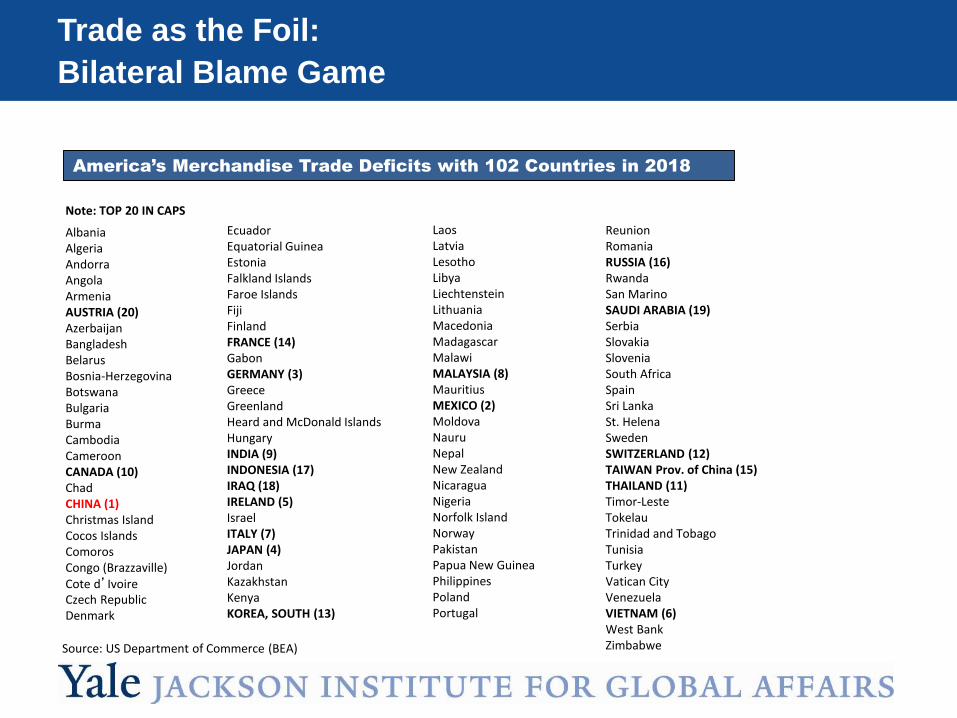
EcuadorEquatorial GuineaEstoniaFalkland IslandsFaroe IslandsFijiFinlandFRANCE (14)GabonGERMANY (3)GreeceGreenlandHeard and McDonald IslandsHungaryINDIA (9)INDONESIA (17)IRAQ (18)IRELAND (5)IsraelITALY (7)JAPAN (4)JordanKazakhstanKenyaKOREA, SOUTH (13)
LaosLatviaLesothoLibyaLiechtensteinLithuaniaMacedoniaMadagascarMalawiMALAYSIA (8)MauritiusMEXICO (2)MoldovaNauruNepalNew ZealandNicaragua NigeriaNorfolk IslandNorwayPakistanPapua New GuineaPhilippinesPolandPortugal
AlbaniaAlgeriaAndorraAngolaArmeniaAUSTRIA (20)AzerbaijanBangladeshBelarusBosnia-HerzegovinaBotswanaBulgariaBurmaCambodiaCameroonCANADA (10)ChadCHINA (1)Christmas IslandCocos IslandsComorosCongo (Brazzaville)Cote d’IvoireCzech RepublicDenmark
ReunionRomaniaRUSSIA (16)RwandaSan MarinoSAUDI ARABIA (19)SerbiaSlovakiaSloveniaSouth AfricaSpainSri LankaSt. HelenaSwedenSWITZERLAND (12)TAIWAN Prov. of China (15)THAILAND (11)Timor-LesteTokelauTrinidad and TobagoTunisiaTurkeyVatican CityVenezuelaVIETNAM (6)West BankZimbabwe
Note: TOP 20 IN CAPS
America’s Merchandise Trade Deficits with 102 Countries in 2018
Trade as the Foil:
Bilateral Blame Game
Source: US Department of Commerce (BEA)
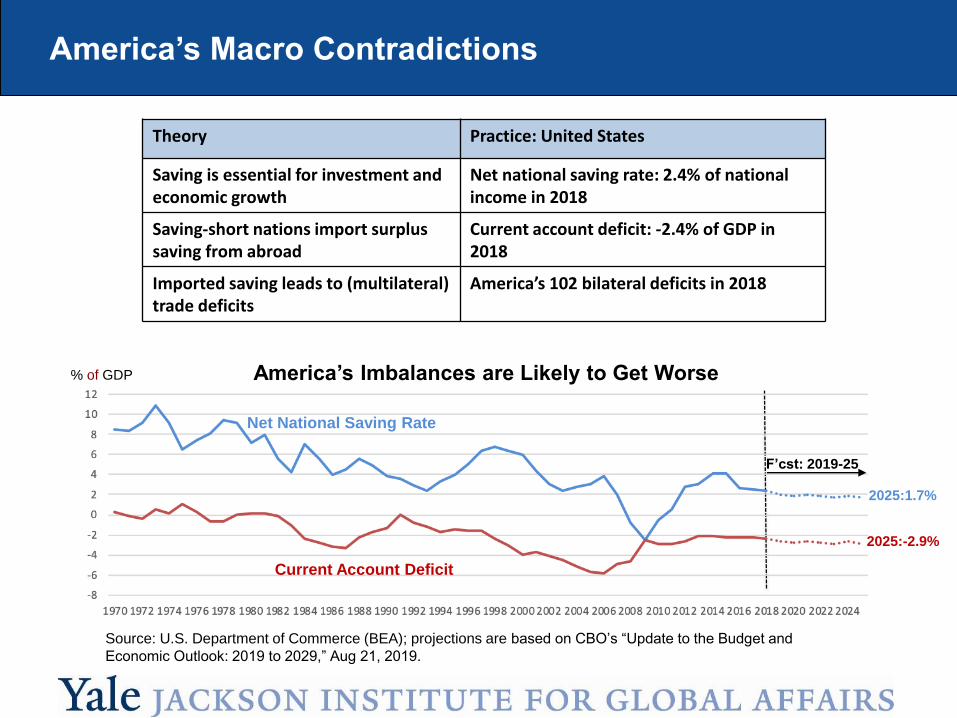
America’s Macro Contradictions
America’s Imbalances are Likely to Get Worse% of GDP
Source: U.S. Department of Commerce (BEA); projections are based on CBO’s “Update to the Budget and
Economic Outlook: 2019 to 2029,” Aug 21, 2019.
Theory Practice: United States
Saving is essential for investment and economic growth
Net national saving rate: 2.4% of national income in 2018
Saving-short nations import surplus saving from abroad
Current account deficit: -2.4% of GDP in 2018
Imported saving leads to (multilateral) trade deficits
America’s 102 bilateral deficits in 2018
Net National Saving Rate
Current Account Deficit
F’cst: 2019-25
2025:1.7%
2025:-2.9%

China’s Contradictions
%%
Source: National Bureau of Statistics (China)
Easier to boost services and urbanization … … Than to increase personal consumption
Strategic contradiction Resolution Tradeoff
Structural rebalancing Supply-side: Productivity Demand-side: Consumer
Ownership transition SOE Reforms State vs. markets
Debt intensity Deleveraging Stability vs. growth
Middle-income trap Imported to indigenous innovation
Trade conflicts
Household Consumption Share of
Chinese GDP
Urban share of
Chinese population
Tertiary Share of
Chinese GDP
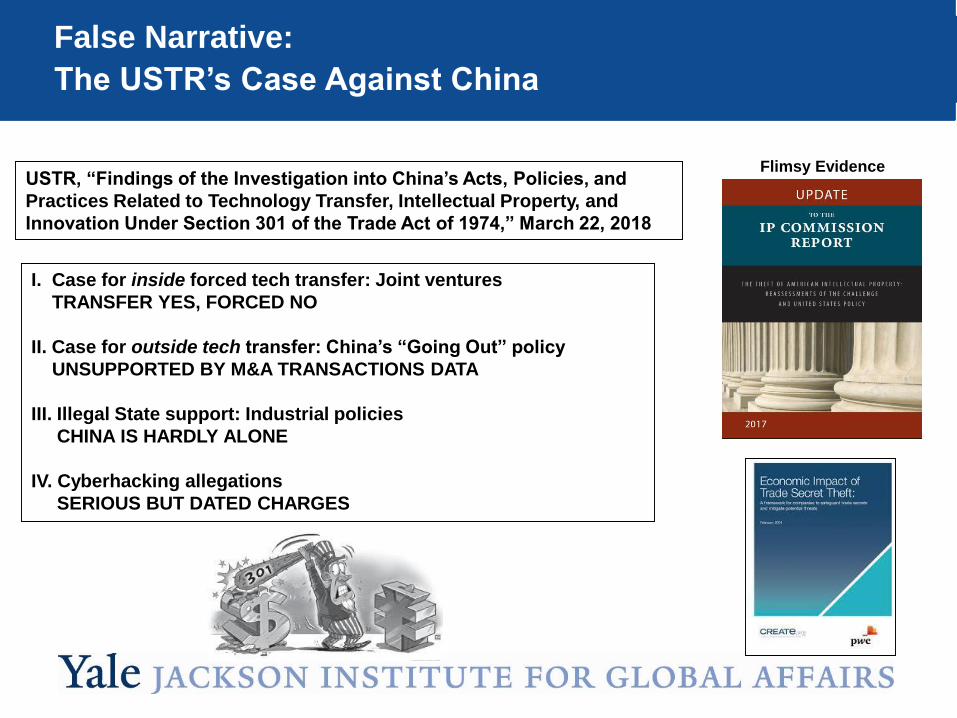
False Narrative:
The USTR’s Case Against China
I. Case for inside forced tech transfer: Joint ventures
TRANSFER YES, FORCED NO
II. Case for outside tech transfer: China’s “Going Out” policy
UNSUPPORTED BY M&A TRANSACTIONS DATA
III. Illegal State support: Industrial policies
CHINA IS HARDLY ALONE
IV. Cyberhacking allegations
SERIOUS BUT DATED CHARGES
Flimsy EvidenceUSTR, “Findings of the Investigation into China’s Acts, Policies, and
Practices Related to Technology Transfer, Intellectual Property, and
Innovation Under Section 301 of the Trade Act of 1974,” March 22, 2018

Trump‘s Tariffs
President Donald Trump
August 1, 2019
“Don’t let them tell you, the fact is … that China’s paying for those
tariffs. Until such a time there is a deal, we will be taxing the hell out
of China.”
Source: PIIE and US Department of Commerce
$ bil
2017 2018 2019 2019 2019 May 10 Oct 15 Dec 15
Average Tariff Rate on US Imports from China
Deferred: Oct 11
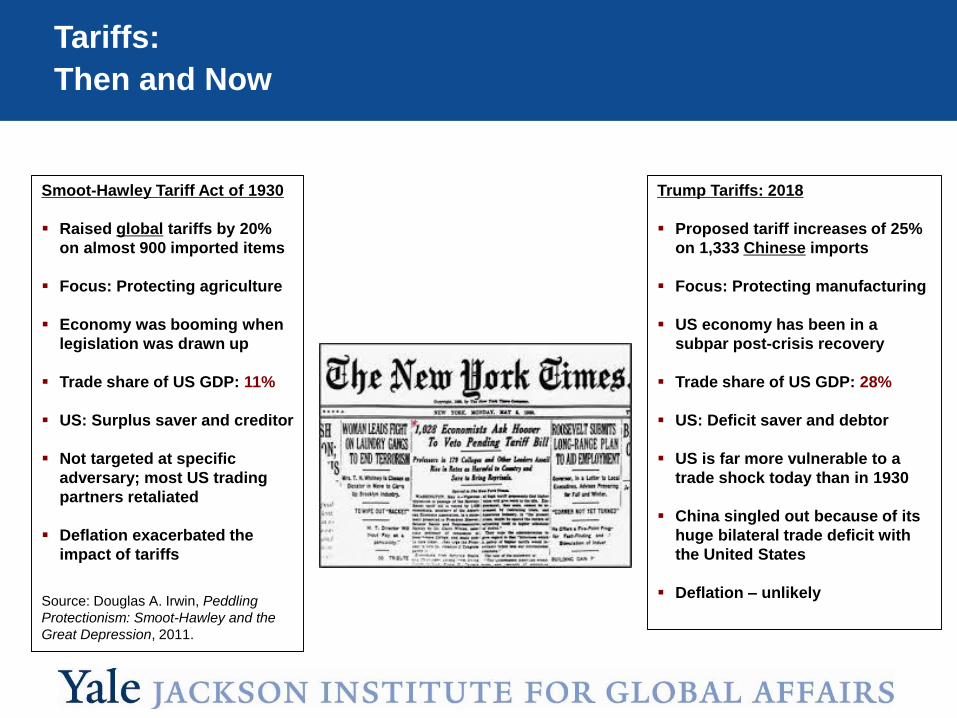
Tariffs:
Then and Now
Smoot-Hawley Tariff Act of 1930
Raised global tariffs by 20%
on almost 900 imported items
Focus: Protecting agriculture
Economy was booming when
legislation was drawn up
Trade share of US GDP: 11%
US: Surplus saver and creditor
Not targeted at specific
adversary; most US trading
partners retaliated
Deflation exacerbated the
impact of tariffs
Source: Douglas A. Irwin, Peddling
Protectionism: Smoot-Hawley and the
Great Depression, 2011.
Trump Tariffs: 2018
Proposed tariff increases of 25%
on 1,333 Chinese imports
Focus: Protecting manufacturing
US economy has been in a
subpar post-crisis recovery
Trade share of US GDP: 28%
US: Deficit saver and debtor
US is far more vulnerable to a
trade shock today than in 1930
China singled out because of its
huge bilateral trade deficit with
the United States
Deflation – unlikely

Structural Conflict:
America’s Fears
Source: Cornell, INSEAD, and WIPO, Global
Innovation Index 2019
Technology and innovation as the
means to economic prosperity
US has been unrivaled as global
technology leader post-World War II
Ancient China’s technological
prowess failed to accelerate after the
14th century
Modern China’s push to indigenous
innovation key to centenary 2049
growth objectives
A zero-sum or win-win outcome for
the US and China?
United States
China
Other BRICS
“China has targeted America’s industries of the future … if China successfully
captures these emerging industries, America will have no economic future.”
— Peter Navarro June 2018
Highest rank
Lowest rank
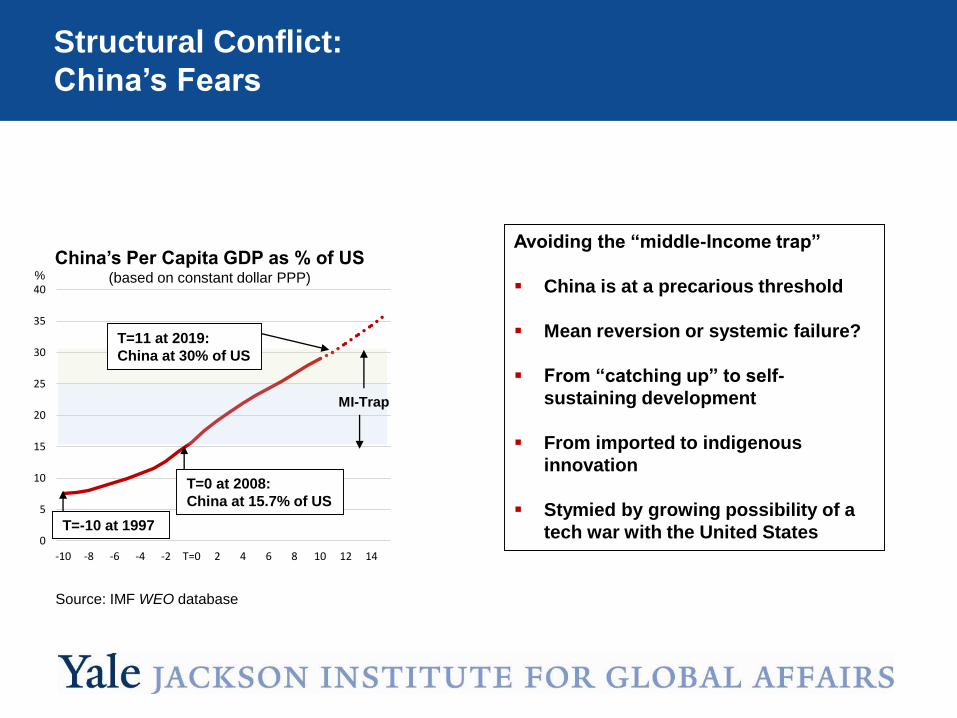
Structural Conflict:
China’s Fears
0
5
10
15
20
25
30
35
40
-10 -8 -6 -4 -2 T=0 2 4 6 8 10 12 14
T=0 at 2008:
China at 15.7% of US
T=11 at 2019:
China at 30% of US
China’s Per Capita GDP as % of US(based on constant dollar PPP)%
MI-Trap
Source: IMF WEO database
T=-10 at 1997
Avoiding the “middle-Income trap”
China is at a precarious threshold
Mean reversion or systemic failure?
From “catching up” to self-
sustaining development
From imported to indigenous
innovation
Stymied by growing possibility of a
tech war with the United States
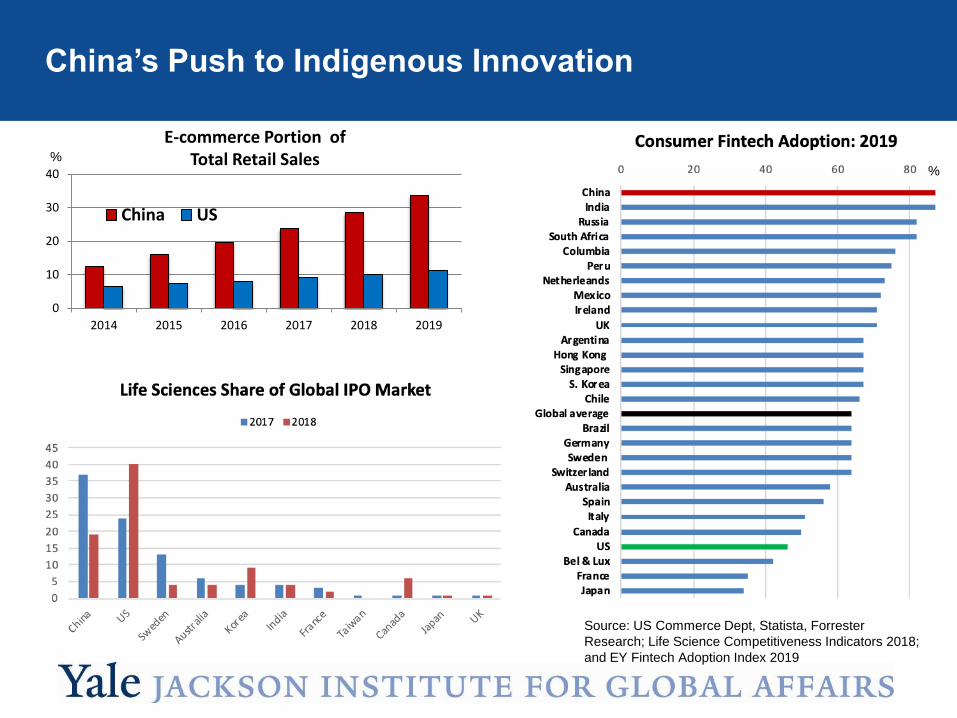
China’s Push to Indigenous Innovation
0
10
20
30
40
2014 2015 2016 2017 2018 2019
China US
E-commerce Portion of Total Retail Sales
Source: US Commerce Dept, Statista, Forrester
Research; Life Science Competitiveness Indicators 2018;
and EY Fintech Adoption Index 2019
%%
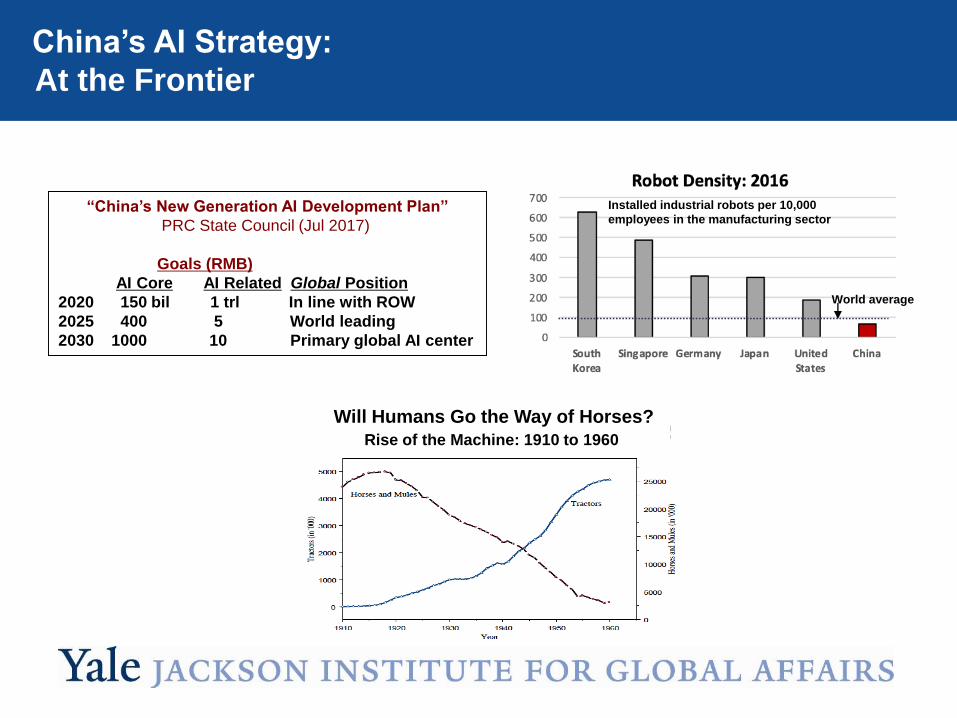
China’s AI Strategy:
At the Frontier
“China’s New Generation AI Development Plan”
PRC State Council (Jul 2017)
Goals (RMB)
AI Core AI Related Global Position
2020 150 bil 1 trl In line with ROW
2025 400 5 World leading
2030 1000 10 Primary global AI center
World average
Installed industrial robots per 10,000
employees in the manufacturing sector
Will Humans Go the Way of Horses?
Rise of the Machine: 1910 to 1960
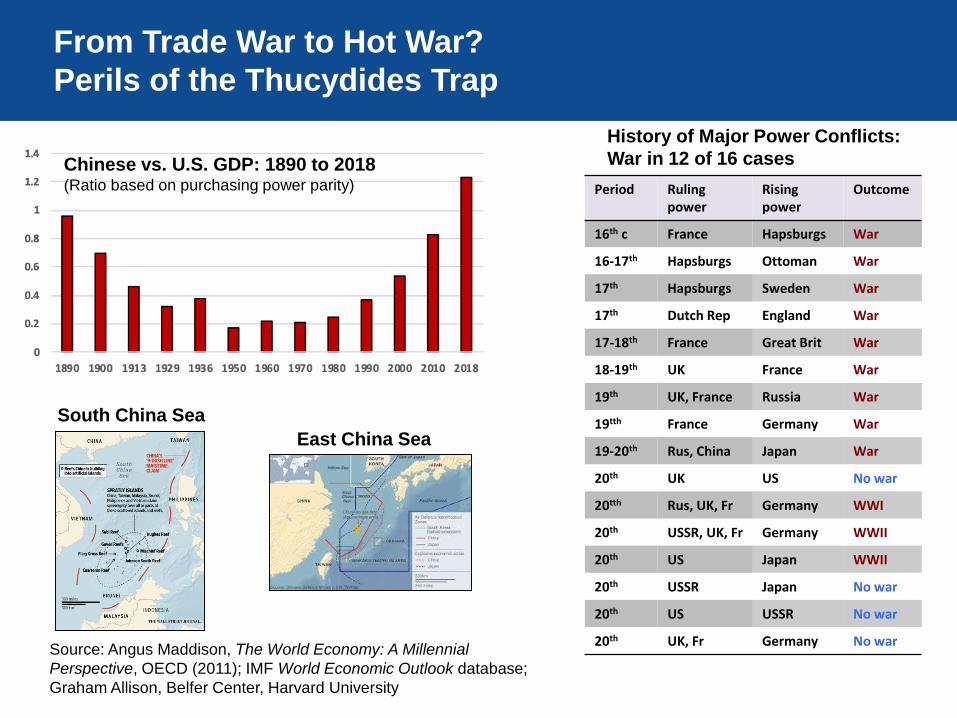
From Trade War to Hot War?
Perils of the Thucydides Trap
South China Sea
Period Ruling power
Rising power
Outcome
16th c France Hapsburgs War
16-17th Hapsburgs Ottoman War
17th Hapsburgs Sweden War
17th Dutch Rep England War
17-18th France Great Brit War
18-19th UK France War
19th UK, France Russia War
19tth France Germany War
19-20th Rus, China Japan War
20th UK US No war
20tth Rus, UK, Fr Germany WWI
20th USSR, UK, Fr Germany WWII
20th US Japan WWII
20th USSR Japan No war
20th US USSR No war
20th UK, Fr Germany No war
History of Major Power Conflicts:
War in 12 of 16 cases
Source: Angus Maddison, The World Economy: A Millennial
Perspective, OECD (2011); IMF World Economic Outlook database;
Graham Allison, Belfer Center, Harvard University
East China Sea
Chinese vs. U.S. GDP: 1890 to 2018(Ratio based on purchasing power parity)

From Trade War to Cold War 2.0?
New York Times, October 5, 2018
Existential Fears
China’s Perspective
US containment strategy
Tariffs and trade war
Clash of two systems
America’s Perspective
Bilateral MAGA imperatives
Innovation and prosperity
Global hegemony
Cold War with USSR (1947 to 1991) Soviet threat after WWII
USSR and US 2.1%/ yr. per capita GDP growth
Over 1985-91: Soviet growth fell by 1.1%/ yr.
Postwar strength of US economy
US economy Then:1947-91
Now:2010-18
Real GDP growth 3.5% 2.3%
Net national saving rate 8.8% 2.5%
Productivity growth 2.2% 1.1%
Fading Strength
Source: Cornell, INSEAD, and WIPO, Global Innovation
Index 2019 ; US Department of Commerce and US
Bureau of Labor Statistics

Lasting Resolution:
From Art of the Deal to Wisdom of the Compromise
Market access: Bilateral Investment Treaty (BIT)
• Eliminate foreign ownerships caps
• Addresses JVs and forced technology transfer
• US play on consumer-led Chinese rebalancing
• CFIUS import restrictions lifted
• BIT tally: China (145); US (42); Global (⍨3000)
Saving: From Unbalanced to Rebalanced
• US needs more
Budget deficits and subpar domestic saving
Multilateral fix for bilateral trade tensions
• China needs less
Surplus saving to saving absorption
Funds social safety net and boosts consumption
Cyber: Battleground of the Information Age
From bilateral to global
Paris-Accord-like cyber attack targets
WTO-like dispute and enforcement mechanism
US-China Dialogue: From reactive to proactive engagement
From episodic to ongoing
From S&ED-type framework to a permanent secretariat
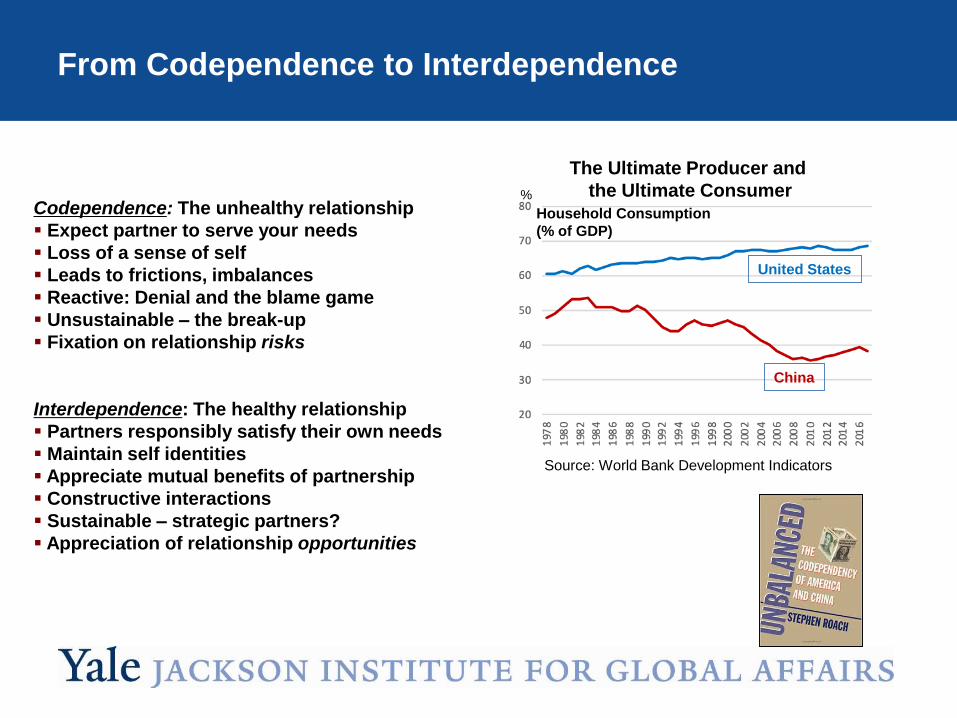
From Codependence to Interdependence
Codependence: The unhealthy relationship
Expect partner to serve your needs
Loss of a sense of self
Leads to frictions, imbalances
Reactive: Denial and the blame game
Unsustainable – the break-up
Fixation on relationship risks
Interdependence: The healthy relationship
Partners responsibly satisfy their own needs
Maintain self identities
Appreciate mutual benefits of partnership
Constructive interactions
Sustainable – strategic partners?
Appreciation of relationship opportunities
The Ultimate Producer and
the Ultimate Consumer%
Household Consumption
(% of GDP)
United States
China
Source: World Bank Development Indicators
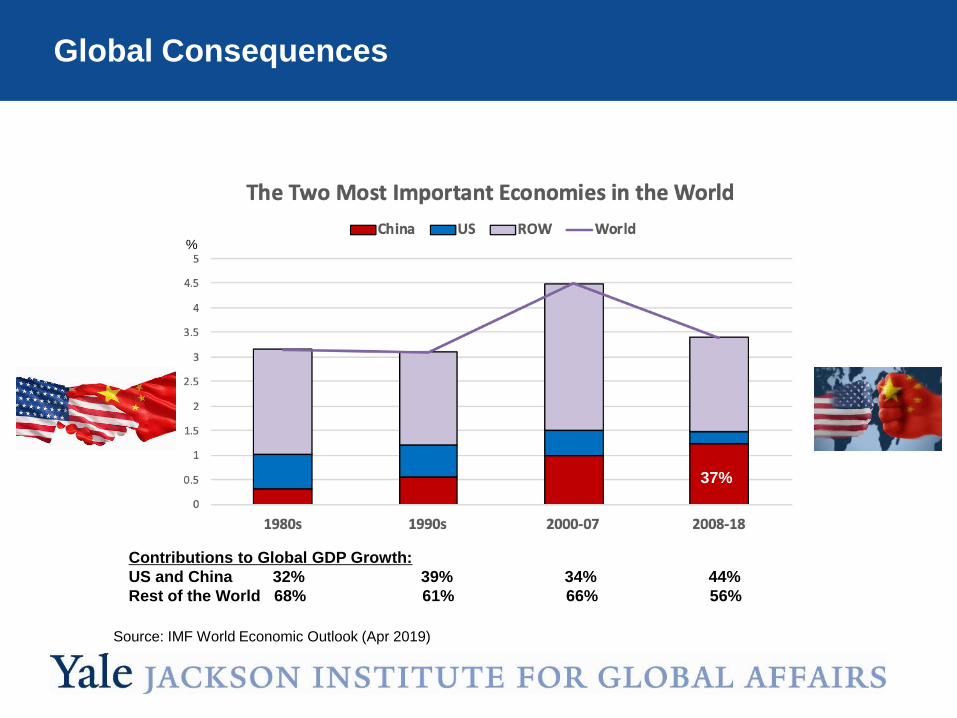
Global Consequences
Source: IMF World Economic Outlook (Apr 2019)
%
Contributions to Global GDP Growth:
US and China 32% 39% 34% 44%
Rest of the World 68% 61% 66% 56%
37%