US-CERT Security Trends Report: 2012 in Retrospect · US-CERT Security Trends Report: 2012 in...
36
US-CERT Security Trends Report: 2012 in Retrospect
Transcript of US-CERT Security Trends Report: 2012 in Retrospect · US-CERT Security Trends Report: 2012 in...

US-CERT Security Trends Report:2012 in Retrospect
II
US-CERT Security Trends Report: 2012 in Retrospect
US-CERT Security Trends Report: 2012 in Retrospect . . . . . . . . . . . . . . . . . . . . . . . . . . . . . . . . . . . . . . . . . . .IIHow to Read This Document . . . . . . . . . . . . . . . . . . . . . . . . . . . . . . . . . . . . . . . . . . . . . . . . . . . . . . . . . . . . .1Contributors to This Document . . . . . . . . . . . . . . . . . . . . . . . . . . . . . . . . . . . . . . . . . . . . . . . . . . . . . . . . . . .1About US-CERT . . . . . . . . . . . . . . . . . . . . . . . . . . . . . . . . . . . . . . . . . . . . . . . . . . . . . . . . . . . . . . . . . . . . .2Summary . . . . . . . . . . . . . . . . . . . . . . . . . . . . . . . . . . . . . . . . . . . . . . . . . . . . . . . . . . . . . . . . . . . . .2 Malicious Software (malware) [Section 1] . . . . . . . . . . . . . . . . . . . . . . . . . . . . . . . . . . . . . . . . . . . . . .2 Malware Analysis/Characterization [Section 2] . . . . . . . . . . . . . . . . . . . . . . . . . . . . . . . . . . . . . . . . . . .3 Phishing [Section 3] . . . . . . . . . . . . . . . . . . . . . . . . . . . . . . . . . . . . . . . . . . . . . . . . . . . . . . . . . . . . . . .4 Network Scanning/Reconnaissance Statistics [Section 4] . . . . . . . . . . . . . . . . . . . . . . . . . . . . . . . . . . .4 Routing Statistics [Section 5] . . . . . . . . . . . . . . . . . . . . . . . . . . . . . . . . . . . . . . . . . . . . . . . . . . . . . . . .4Introduction . . . . . . . . . . . . . . . . . . . . . . . . . . . . . . . . . . . . . . . . . . . . . . . . . . . . . . . . . . . . . . . . . . . . .5Scope . . . . . . . . . . . . . . . . . . . . . . . . . . . . . . . . . . . . . . . . . . . . . . . . . . . . . . . . . . . . . . . . . . . . .5 1 . Malicious Software (Malware) . . . . . . . . . . . . . . . . . . . . . . . . . . . . . . . . . . . . . . . . . . . . . . . . . . . . .6 1a . Vulnerabilities . . . . . . . . . . . . . . . . . . . . . . . . . . . . . . . . . . . . . . . . . . . . . . . . . . . . . . . . . . .6 1b . Top Malware Threats in 2012 . . . . . . . . . . . . . . . . . . . . . . . . . . . . . . . . . . . . . . . . . . . . . . .10 1 . Sality . . . . . . . . . . . . . . . . . . . . . . . . . . . . . . . . . . . . . . . . . . . . . . . . . . . . . . . . . . . . . .10 2 . ZeroAccess . . . . . . . . . . . . . . . . . . . . . . . . . . . . . . . . . . . . . . . . . . . . . . . . . . . . . . . . . .10 3 . Win32/Brontok . . . . . . . . . . . . . . . . . . . . . . . . . . . . . . . . . . . . . . . . . . . . . . . . . . . . . .11 4 . Conficker . . . . . . . . . . . . . . . . . . . . . . . . . . . . . . . . . . . . . . . . . . . . . . . . . . . . . . . . . . .11 5 . Ramnit . . . . . . . . . . . . . . . . . . . . . . . . . . . . . . . . . . . . . . . . . . . . . . . . . . . . . . . . . . . . .11 6 . Alureon/TDSS/Tidserv . . . . . . . . . . . . . . . . . . . . . . . . . . . . . . . . . . . . . . . . . . . . . . . . .12 7 . Zeus/Citadel (Zbot) . . . . . . . . . . . . . . . . . . . . . . . . . . . . . . . . . . . . . . . . . . . . . . . . . . .12 1c . Observed Banking Trojans . . . . . . . . . . . . . . . . . . . . . . . . . . . . . . . . . . . . . . . . . . . . . . . . .12 1 . Zeus . . . . . . . . . . . . . . . . . . . . . . . . . . . . . . . . . . . . . . . . . . . . . . . . . . . . . . . . . . . . . . .12 2 . GameOver Zeus . . . . . . . . . . . . . . . . . . . . . . . . . . . . . . . . . . . . . . . . . . . . . . . . . . . . . .13 3 . Ice IX . . . . . . . . . . . . . . . . . . . . . . . . . . . . . . . . . . . . . . . . . . . . . . . . . . . . . . . . . . . . . .13 4 . Citadel . . . . . . . . . . . . . . . . . . . . . . . . . . . . . . . . . . . . . . . . . . . . . . . . . . . . . . . . . . . . .14 2 . Malware Analysis/Characterization . . . . . . . . . . . . . . . . . . . . . . . . . . . . . . . . . . . . . . . . . . . . . . . . .15 2a . Top-Level Domain Distribution . . . . . . . . . . . . . . . . . . . . . . . . . . . . . . . . . . . . . . . . . . . . . .16 2b . Geo-Location of IP Addresses Used by Malware . . . . . . . . . . . . . . . . . . . . . . . . . . . . . . . . .17 2c . IP Addresses Per Malicious Domain . . . . . . . . . . . . . . . . . . . . . . . . . . . . . . . . . . . . . . . . . .18 2d . Number of Domains Used by a Malware Artifact . . . . . . . . . . . . . . . . . . . . . . . . . . . . . . . .19 2e . User-Agent Strings . . . . . . . . . . . . . . . . . . . . . . . . . . . . . . . . . . . . . . . . . . . . . . . . . . . . . . .19 2f . Botnet Statistics . . . . . . . . . . . . . . . . . . . . . . . . . . . . . . . . . . . . . . . . . . . . . . . . . . . . . . . . . .23 3 . Phishing 24 3a . Maliciously Registered Phishing Domains . . . . . . . . . . . . . . . . . . . . . . . . . . . . . . . . . . . . .24 3b . Observed Spam Themes . . . . . . . . . . . . . . . . . . . . . . . . . . . . . . . . . . . . . . . . . . . . . . . . . . .25 4 . Network Scanning/Reconnaissance Statistics . . . . . . . . . . . . . . . . . . . . . . . . . . . . . . . . . . . . . . . . .27 5 . Routing Statistics . . . . . . . . . . . . . . . . . . . . . . . . . . . . . . . . . . . . . . . . . . . . . . . . . . . . . . . . . . . . . .29 5a . Announcing U .S . Government IP Space . . . . . . . . . . . . . . . . . . . . . . . . . . . . . . . . . . . . . . . .29 5b . Centrality of U .S . Networks . . . . . . . . . . . . . . . . . . . . . . . . . . . . . . . . . . . . . . . . . . . . . . . .30 5c . Service Providers Used by U .S . Government . . . . . . . . . . . . . . . . . . . . . . . . . . . . . . . . . . . .31 5d . IPv6 Usage in U .S . Government . . . . . . . . . . . . . . . . . . . . . . . . . . . . . . . . . . . . . . . . . . . . .32 6 . Conclusions . . . . . . . . . . . . . . . . . . . . . . . . . . . . . . . . . . . . . . . . . . . . . . . . . . . . . . . . . . . . . . . . . .33 7 . Further Information . . . . . . . . . . . . . . . . . . . . . . . . . . . . . . . . . . . . . . . . . . . . . . . . . . . . . . . . . . . .33Contact Us . . . . . . . . . . . . . . . . . . . . . . . . . . . . . . . . . . . . . . . . . . . . . . . . . . . . . . . . . . . . . . . . . . . .33Feedback . . . . . . . . . . . . . . . . . . . . . . . . . . . . . . . . . . . . . . . . . . . . . . . . . . . . . . . . . . . . . . . . . . . .33Department of Homeland Security Disclaimer . . . . . . . . . . . . . . . . . . . . . . . . . . . . . . . . . . . . . . . . . . . . . . .33
DISCLAIMER: This advisory is provided “as is” for informational purposes only . The Department of Homeland Security (DHS) does not provide any warranties of any kind regarding any information contained within . The DHS does not endorse any commercial product or service, referenced in this advisory or otherwise .
1
How to Read This DocumentThere is growing recognition across all computing sectors of our society of the threat posed by cyber attacks . The need to identify the most prevalent attack vectors offers the opportunity to both identify where we are most vulnerable and inform our response . In our effort to capture prevalent cybersecurity threats and form a basis for annual analysis, US-CERT began to categorize the most frequently observed threats in 2012 .
This document includes a high-level executive summary followed by an introduction to the subject matter and scope of its coverage .
The US-CERT 2012 Security Trends Report consists of five sections that contain a digest of technical and statistical information on the following:
• Malicious Software (malware)
• Malware Analysis/Characterization
• Phishing
• Network Scanning/Reconnaissance Statistics
• Routing Statistics
Conclusions for the trends identified are summarized in Section 6 .
Contributors to This DocumentInformation from the following sources was incorporated into this report .
• Carnegie Mellon University Software Engineering Institute CERT Division
• iSIGHT Partners
• The Shadow Server Foundation
• Invincea
• Sourcefire
• IID
This report was coordinated with the following mission partners:

2
About US-CERTThe United States Computer Emergency Readiness Team (US-CERT) is a 24x7 operational entity focused on collecting and analyzing data and disseminating the information to federal agencies, state and local partners, domestic and international organizations . The US-CERT mission, vision, and goals are as follows:
Mission:Improve the nation’s cybersecurity posture, coordinate cyber information sharing, and proactively manage cyber risks to the nation while protecting the constitutional rights of Americans .
Vision:Be a trusted global leader in cybersecurity—collaborative, agile, and responsive in a complex environment .
Goals:In the upcoming year US-CERT will:•Improveonsiteandremoteassistancecapabilitiestoproviderapidandcomprehensiveoperationalsupportto
our public and private partners; •Partnerwithphysicalfirstresponderstointegratephysicalandcyberinformationsharingandresponse
processes; and •Increaseoutreachtopublic,private,andinternationalpartners.
SummaryThis is the first issuance of the annual NCCIC US-CERT Security Trends Report, which encompasses an analysis of cyber events during 2012 to help support effective decision-making, provide technical details for U .S . network defenders, and support the realization of the evolving threat landscape in the cyber domain . This document is intended to increase information sharing and coordination, infrastructure investment, and transparency . Unless otherwise noted, the statistical data presented in this document is sourced from a compilation of data from US-CERT and contributing industry security partners .
The following summarizes the content of each section in this document:
Malicious Software (malware) [Section 1]Analysis of compiled data indicates that 7 .8 percent of consumer-grade users experienced a malicious software (malware) infection; 20 percent of infections were caused when the user clicked and installed the malicious software . Regardless of infection vector, the data shows that 1 net new infection occurred per 1,000 computers in use per month . The vulnerabilities of client web browsers and the supported applications used to view web and file content (Microsoft Office, Adobe Reader, Java, etc .) lead to the most common means to introduce malware to the computer . Once the malware is installed, it uses the computer’s resources for its own malicious activity . Most often, capable malware will become members of a larger peer-to-peer ‘botnet’1 in which infected computers can communicate directly with any other computer in the botnet . These botnets transcend logical and geographic barriers . All of the browser types listed in this report are exploitable in one form or another . Additionally, not all exploits are browser-based, where three of the top four known attack vectors allowed remote code execution via other applications or the operating system itself .
The most common malware threat was Sality2 at 56 percent prevalence . Sality is a dynamic, enduring, and full-featured application that infects and spreads for the purposes of relaying spam, proxying of communications,
1 http://www.techterms.com/definition/botnet2 http://www.symantec.com/connect/blogs/all-one-malware-overview-sality

3
exfiltrating sensitive data, compromising web servers, and coordinating distributed computing tasks (DDoS/password cracking) . It works by joining compromised computers into large botnets, spreading itself by placing installers on removable, and other discovered drives and stealing e-mail address lists . Sality disables antivirus software and other system protection mechanisms to avoid detection .
At a close second with 54 percent, Zeus3 and its variants (26 identified) compromised financial and banking industry transactions in over 38 countries . Like Sality, Zeus participates in botnets and hides itself by changing its files to avoid detection . Zeus captures, collects, and distributes user IDs and passwords by logging keystrokes when computer users log into a banking website . Sality, Zeus, and the other most observed malware are described in Section 1 .
Malware Analysis/Characterization [Section 2]This report broadly characterizes malware infection rates by statistical distribution found in the top-level domains (TLD) . A TLD is most easily described as the last component of a web address: ‘ .gov’ or ‘ .com’ . The ‘ .com’ domain has the greatest share of malware infection rates, followed closely by ‘ .net’ and ‘ .info’ .
Surprisingly, when malware prevalence is broken out by respective geographic countries and territories, nearly 25 percent of infected computers are geographically unidentifiable—which hinders attribution as third-party infected computers are often used to conduct exploitation and denial of service attacks against new targets . Algeria, the United States, and Morocco have the largest number of IP addresses used by malware .
When distinct IP addresses are looked at with observed known malicious domains, most common malicious domains have only one IP address associated with them . However, several domains are associated with over 100 distinct IP addresses . A small number have over 1,000 distinct IP addresses, making these domains more difficult to de-list from the Domain Name Servers of the Internet and more functionally resilient . Domain Name Servers contain master lists of domain names and their corresponding numeric IP address . The US-CERT website (www .us-cert .gov), for example, has three IPv6 addresses, one IPv4 address, and two aliases .
Roughly 60 percent of malware prevalent in 2012 utilized a single domain name as it established communications with its fellow bots or its controlling servers . Less than 10 percent of malware appeared to use 4 or more domain names, but 4 percent used between 10-1,000 domain names that facilitate communication and persistent communications . Figure 13 in Section 2d shows the proportion of domains that are the most challenging for computer network defenders to block communications to .
The final aspect of externally characterizing how malware operates is evaluating how it communicates . As discussed previously, malware commonly uses Internet web addresses for issuing and receiving command and control messages, updates, and the like . This malware often utilizes modified user-agent strings in browser-to-server and server-to-browser communications . Malware collected and analyzed in a lab environment produced 375,665 user-agent strings—of which 14,719 were unique .
Why are user-agent strings important? User-agent strings are used to negotiate the user experience between the server and the client—often to format content according to the user’s platform (i .e ., server/workstation/tablet/mobile) . When web browsers connect with servers on the Internet, they communicate information about the browser and the computer’s software that is making the connection to a server . Malware often uses unique strings to purposely identify and manage the computers that make up botnets . By changing the user strings, the network devices used to protect computers (proxies) are fooled into allowing a connection that they otherwise would not permit . Research into user-agent strings and their attributes shows that if network defenders blocked each of the unique malformed user-agent strings found in the data set, they would reduce the number of permitted malicious web connections by 49 .6 percent .
3 http://www.techtree.com/content/news/3858/facebook-virus-zeus-devours-bank-accounts.html

4
Phishing [Section 3]A Phishing attack is an attempt by a malicious actor to entice a victim into clicking on a link that appears to originate from a legitimate site, but actually performs a malicious action . Typical phishing attacks attempt to infect computers with malware . In Section 3 Phishing, malicious domain name statistics are assembled and reported across the 34 top-level domains (i .e ., .com, net, .info, .uk, etc .) . Using data from over 200,000 unique phishing attacks, the findings are that the highest percentage of domain names registered for malicious use are: .asia with .035 percent, .ms (the island of Montserrat) with .025 percent, and .tk (Tokelau, a territory of New Zealand) with .024 percent . While the .com domain with .003 percent malicious domain registration has the largest number of domain names dedicated to phishing, it also has an exponentially larger number of total domains registered under it . Section 3 also prioritizes the industry themes and well-known brands that are being used for phishing to attract victims to websites containing malware .
Network Scanning/Reconnaissance Statistics [Section 4]Network scanning tools are commonly used by system and network administrators to assess the security of a network . In the hands of a malicious actor, these tools are used to discover computer systems known to be vulnerable on a target network . Section 4 details the information that DHS’ EINSTEIN tool gathers from NetFlow relating to the number of scans per day and their country of origin . Nearly half of all scans originate from three countries: the United States, China, and the Russian Federation . This information is displayed in a ranking from the highest to the lowest number of instances corresponding to the geographical location from where scans are initiated . This section also identifies the top groups of IP addresses that are under a single control structure, a characteristic often seen in scanning .
Routing Statistics [Section 5]Challenges exist in containing and managing the boundaries of networks that make up the Internet . There exists a problem with the Border Gateway Protocol (BGP)4 that permits Internet-facing routers to advertise incorrect information—whether it be on purpose or by accident . BGP is used by routers to send traffic to the appropriate place . But how does a router know which other router is the proper destination? Because other routers announce networks/domains they control or are routing traffic for . Analyzing data from the RIPE Coordination Center, one of five Regional Internet Registries (RIRs), revealed that persistent erroneous announcements were identified that pertain to U .S . Government networks .
China, Russia, Kazakhstan, South Korea, Canada, France, Bulgaria, and Chile have each announced that U .S . government networks are reachable within these geographically distant autonomous networks for all or part of 2012 . The informed reader can conclude that this is either the result of configuration errors or intended to route U .S . government information flow over these autonomous networks and then to its legitimate destinations .
Traditionally, European, Arab States, and several Asian countries5 have led the way with regard to Internet availability and per capita connections . 2012 saw considerable growth in advertised routes coming to the United States and routes passing through the United States . This factor points to the United States as both an increasing Internet hosting provider with 25 .6 percent annual growth and an ever larger communications pathway for international data traffic at 25 percent annual growth . Only a 3 percent growth of non-U .S . advertised routes was observed in 2012 . While this is promising for Internet sustainability, economic growth, etc ., it also poses increased risks from cyber attacks .
Substantial increases in announcements of IPv6-based networks were also seen in 2012 . Section 5d shows the use of IPv6 within the U .S . government networks has grown from 21 .7 percent to 41 percent while all global adoption has grown from 12 .5 percent to 15 .6 percent . It must be noted that these percentages pertain to the representation of networks that announce IPv6 resources rather than a percentage of all traffic that has transitioned to IPv6 protocol use .
4 http://www.bgpexpert.com/what.php5 http://www.itu.int/en/ITU-D/Statistics/Documents/facts/ICTFactsFigures2013.pdf

5
IntroductionThe Department of Homeland Security (DHS) United States Computer Emergency Readiness Team (US-CERT) interacts with federal agencies, industry, the research community, state and local governments, and others to collect and monitor cybersecurity information as well as track security trends and identify emerging cybersecurity threats . The purpose of this report is to provide information and spread awareness about cyber activity affecting corporate and U .S . federal government networks throughout 2012 .
In order to bolster an effective cybersecurity posture, U .S . network defenders need to understand Internet activity affecting U .S . networks, such as network scanning and reconnaissance . US-CERT surveys trends visible to U .S . civilian government networks to provide such information . This information, coupled with the knowledge of communication protocols and the tactics through which they are established, helps prepare network defenders by providing situational awareness . This report examines the relationship between malware and its domains, IP addresses, user-agent (UA) strings, and geo-location data to shed light on malicious communication traffic . Furthermore, information within this report provides an in-depth look at how U .S . Government data is routed globally—and the protocols through which the routing occurs—to show which geographic points serve as international hubs of information exchange . Additionally, phishing, a common targeting methodology, is analyzed to generalize originating domains and frequent themes . Finally, statistics regarding common banking Trojans such as Zeus, Ice IX, and Citadel demonstrate the prevalence of credential theft malware targeting U .S . government networks .
ScopeThis report presents selected statistics for cybersecurity data analyzed by US-CERT in 2012 . Data was gathered from a variety of public and private data sources, including the EINSTEIN system . This report is not intended to inform policy, but rather to provide overall situational awareness of current cybersecurity trends . The report focuses on the most exploited vulnerabilities; the malware targeting computing systems; how the malware is most commonly delivered (bots and phishing e-mails); and global network data describing where the referenced malware originates .

6
1. Malicious Software (Malware)In 2012, 7 .8 percent of consumer users experienced a malware infection, whereas enterprise users reported a 0 .7 percent infection rate during the same period .
• 1 net new system per 1,000 was compromised per month .
• Only 1 in 5 detection alerts were confirmed infections .
• 20 percent of all infections were user-introduced (e .g ., the user was tricked to click and install) .
• Approximately 70 percent of the time, known malware installed another file that neither was known to be good nor had a signature associated with it (from any vendor) .
• Approximately 75 percent of the time, known malware was installed by a file that neither was known to be good nor had a signature associated with it (from any vendor) .
1a. VulnerabilitiesThe statistics presented above should not be surprising given the continual increase in Internet-ready devices . Most of the classic techniques used by malware involve the exploitation of web-affiliated applications such as browsers and helper/viewer applications (e .g ., Java, Microsoft Excel, and Adobe Reader) . Figure 1 summarizes data collected from endpoint systems . It shows the parent processes of malware and the top threats that exploit them . These threats will be described in greater detail in Section 1b .
explorer.exe73%
�refox.exe17%
chrome.exe3% Other
1%
iexplore.exe6%
Sality56%
ZeroAccess13%
Win32/Brontok12%
Con�cker8%
Ramnit6%
Win32/Alureon3%
Other
2%
Figure 1: Top Parent Processes and Malware Threats
As new vulnerabilities are discovered, the cybersecurity community constantly endeavors to stay ahead of malware developers . This is an arms race between software developers trying to design systems and applications that are not vulnerable to malware infection and the malicious developers trying to exploit said systems . Bug-free applications continue to elude developers, despite efforts to promote secure coding and design practices . Software developers are left to attempt to identify and patch vulnerabilities in deployed software before someone can engineer malware to exploit those vulnerabilities . Another common—but much less desirable—approach is to attempt to identify and characterize malware that is already exploiting an unknown vulnerability . Security researchers characterize the malware to discern where it works (operating systems), what it exploits, and how it operates once active .

7
Successful vulnerability identification and patching does not mean the malicious software will go away . Conficker (8 percent), first identified in late 2008, still remains effective malware . The associated vulnerability, CVE-2008-4250/Microsoft Vulnerability MS08-067,6 still exists on unpatched Microsoft systems today .
Table 1: Top Known Attack Vectors of 2012
CVE Number Description
CVE-2010-2568 Remote shell in select Windows OSs (including Win7 and Server 2008/R2) via a crafted .lnk
not properly handled during icon display through Windows Explorer
CVE-2012-0184 Remote code execution via Microsoft Excel in Windows and MacOS
CVE-2012-2897 Remote code execution via a crafted TrueType font file vulnerability in Windows OSs
CVE-2012-0165 Remote code execution Windows Vista SP2, Server 2008 SP2, and Office applications via a
specially crafted enhanced metafile image
CVE 2010-256891%
Other3%
CVE 2012-01651%
CVE 2012-28972%
CVE 2012-01843%
Figure 2: Malware Attack Vectors from Known CVE Vulnerabilities in 2012
The charts in Figures 3-6 breakdown which versions of the most popular web browsers and helper applications (as described in Figure 1) were the parent processes of malware . Of note is that proper patch management and regular OS/application updates would reduce the attack prevalence, since the most-exploited software continues to be exploited even though there is a patch that would prevent it .
Vulnerabilities in web browsers present a significant attack surface since most computers have some kind of web browser, and the browser itself has access to enough confidential information to make it worth attacking . During 2012, the three web browsers with the largest global market share7 were Firefox (19 .82 percent), Internet Explorer (54 .77 percent), and Chrome (18 .04 percent) . Mozilla Firefox is an open-source web browser that has been in use for several years . Figure 3 displays the most exploited versions of the Firefox web browser in 2012 .
6 http://blog.securestate.com/ms08-067-still-alive-and-kicking/7 http://www.netmarketshare.com/
8
0%
10%
20%
30%
40%
50%
60%
6.14.10.5009
8.0.0.0
9.0.1.0
10.0.2.0
11.0.0.0
12.0.0.0
13.0.1.0
14.0.1.0
15.0.1.0
16.0.2.0
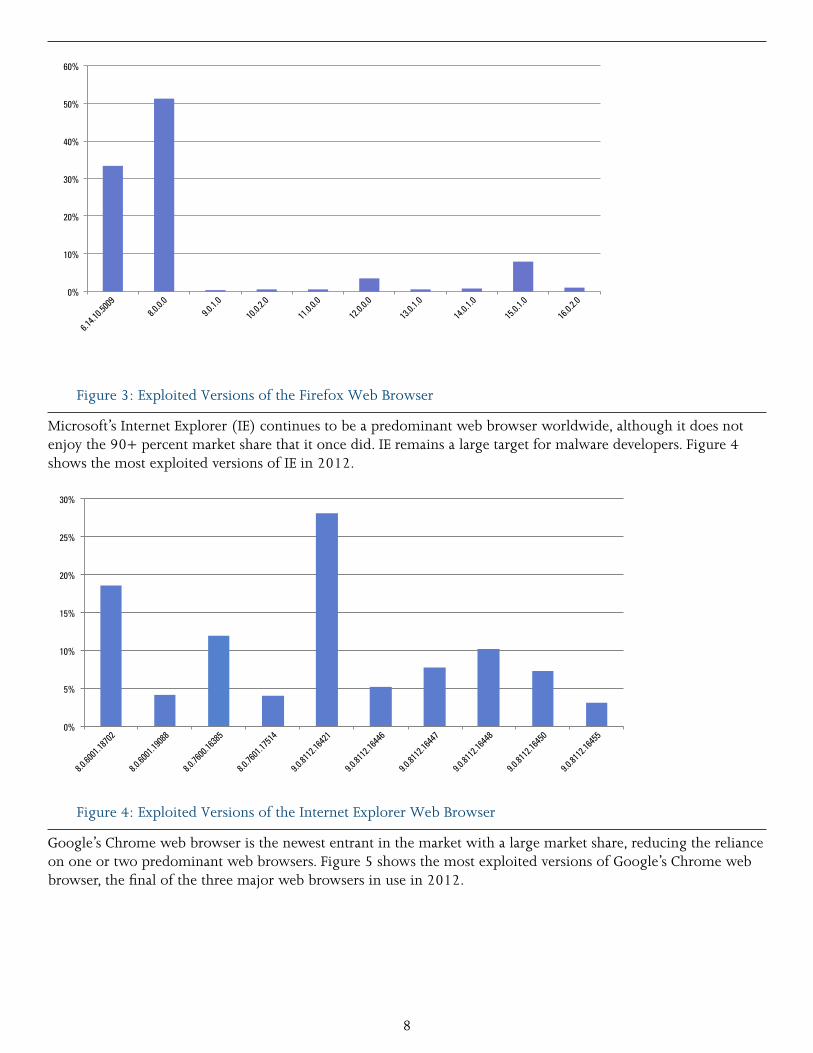
Figure 3: Exploited Versions of the Firefox Web Browser
Microsoft’s Internet Explorer (IE) continues to be a predominant web browser worldwide, although it does not enjoy the 90+ percent market share that it once did . IE remains a large target for malware developers . Figure 4 shows the most exploited versions of IE in 2012 .
0%
5%
10%
15%
20%
25%
30%
8.0.6001.19088
8.0.6001.18702
8.0.7600.16385
8.0.7601.17514
9.0.8112.16421
9.0.8112.16446
9.0.8112.16447
9.0.8112.16448
9.0.8112.16450
9.0.8112.16455
Figure 4: Exploited Versions of the Internet Explorer Web Browser
Google’s Chrome web browser is the newest entrant in the market with a large market share, reducing the reliance on one or two predominant web browsers . Figure 5 shows the most exploited versions of Google’s Chrome web browser, the final of the three major web browsers in use in 2012 .

9
0%
10%
20%
30%
40%
50%
60%
70%
18.0.1025.162
15.0.874.121
18.0.1025.168
19.0.1084.52
19.0.1084.56
21.0.1180.83
21.0.1180.89
22.0.1229.79
22.0.1229.94
23.0.1271.64
Figure 5: Exploited Versions of the Google Chrome Web Browser
The most prolific helper application for web browsers is Java . Java was developed to enrich users’ web experience and deliver dynamic content to every web-enabled platform from servers to mobile devices . It is also vulnerable to attack . Figure 6 shows the most exploited versions of Java in 2012 .
0%
10%
20%
30%
40%
50%
60%
Version 7Version 6Version 5
Figure 6: Exploited Versions of Java

10
1b. Top Malware Threats in 2012The items below represent the top malware threats for 2012 . This malware was observed as successfully infecting endpoints, which were monitored for 2012 . This is an important distinction from detection-focused lists, which center on threats caught successfully in the wild . For the purposes of this review, only malware that was seen to have taken root on an endpoint was counted .
1. SalityThe Sality threat represents a family of threats (or a code base with multiple versions) in very broad circulation in both consumer and enterprise networks . Sality is highly complex with a decentralized peer-to-peer (P2P) command and control (CNC) and update structure . Sality (generally across all or most variants) is highly aggressive after it has infected an endpoint . This threat typically interferes with security applications, injects itself into other legitimate processes, and attempts to spread through open file shares or connected storage devices . Additionally, Sality is capable of reading e-mail address lists from end users and attempting to spread to their trusted contacts over e-mail . Perhaps due to its aggressive spreading techniques, Sality was the number-one threat for consumer users and the second most dangerous threat for enterprise users .
Sality often installs additional malware on endpoints during its tenure of infection . Systems co-opted into Sality botnets install arbitrary third-party connections, process spam campaigns, and send sensitive passwords and other credential data to external hosts .
Initial infection vectors seen during 2012 were largely e-mail based, primarily caused by infected attachments and users opening infected files stored on shared resources within enterprise environments .
Given the prevalence and complexity of Sality, enterprises infected with this malware are at a high risk of secondary infection and possibly subsequent intrusions from actors using the malware as an entry point for further intrusions into the organization .
Reviews of 2013 data at the time of this report indicate that Sality remains a concern, still ranked in the top five largest active malware infections in the field .8
2. ZeroAccessAt 13 percent of observed infections, ZeroAccess was the second most prevalent infection seen in the field for 2012 . ZeroAccess is a master boot record (MBR) level rootkit generally thought to target consumer users to co-opt their systems into click fraud and Bitcoin mining botnets .9
While consumer users may be the focus of this malware, enterprises also experience many infections: 72 percent of enterprises surveyed during 2012 had experienced infections with Zero Access .
The ZeroAccess malware can, and often does, download other component malware . Like Sality, this malware has a decentralized management and communications infrastructure, which makes it difficult to dismantle . ZeroAccess is a fully functional downloader and backdoor with the ability to install arbitrary software on impacted systems and allow for full remote access by third parties .
The majority of infections seen during this period were delivered from classic “drive-by” attacks on users browsing the web who were redirected to malicious sites . The primary ZeroAccess attack vectors are vulnerable versions of Java .
Given its downloader capabilities, enterprises infected with ZeroAccess are at a high risk of further infection from various actors using the malware as an entry point .
Reviews of 2013 data at the time of this report indicate that ZeroAccess remains a concern and is ranked in the top 5 largest active malware infections in the field .
8 http://www.symantec.com/security_response/writeup.jsp?docid=2006-011714-3948-99 9 http://www.fortinet.com/press_releases/2013/fortiguard_threat_landscape_research_team_reports.html
11
3. Win32/BrontokAt 12 percent the diverse Brontok family of malware is delivered over e-mail and removable media devices . Like other threats, which leverage e-mail as a delivery method, the Brontok family uses e-mail contact lists from infected systems and spreads by sending e-mail with infected attachments .
The source of many enterprise infections is believed to be the usage of removable storage that was infected offsite (e .g ., at a user’s home) and then brought into the workplace and plugged into systems .
Some variants of Brontok incorporate limited denial of service (DoS) capabilities focused on attacking a small number of predetermined (i .e ., hard-coded) Internet sites . Brontok is not believed to install backdoor capabilities onto endpoints . Therefore, the presence of this threat does not appear to indicate secondary, additional infections .
Reviews of 2013 data at the time of this report indicate that Brontok is less prevalent in 2013 and is no longer in the top 10 largest active malware infections for the first half of 2013 .
4. ConfickerDespite the concerted effort by the industry over the last four years and, in particular, the Conficker working group (CWG), to eradicate Conficker, multiple variants of the threat remain highly prevalent in both the enterprise and consumer user communities . The Conficker threat appears to no longer have a centralized CNC infrastructure, probably due to the efforts of the CWG to eliminate this infrastructure . However, the threat persists .
It is not believed that this threat is usually leveraged for secondary intrusions based on research and analysis performed by Sourcefire .
Reviews of 2013 data at the time of this report indicate that Conficker remains a concern in 2013, still ranked in the top 10 largest active malware infections in the field .
5. RamnitRamnit is an older threat that saw a substantial resurgence on 2013 . This threat installs highly componentized malware, including a rootkit . In addition to robust capabilities to disable security products, it has the capability to install backdoor access and steal a variety of credentials off the infected system .
Newer versions of Ramnit reportedly send telemetry statistics back to the botnet to which they are connected . This data is used to gauge the quality of the infected host in terms of stability and performance, for example . This sophistication indicates commercial-quality software development, which is not observed in previous versions based on research and analysis performed by Sourcefire .
Due to its rootkit and backdoor capabilities, enterprises infected with Ramnit are at a high risk of further infection from various actors using the malware as an entry point .
Reviews of 2013 data at the time of this report indicate that Ramnit remains a concern in 2013, still ranked in the top five largest active malware infections in the field .
12
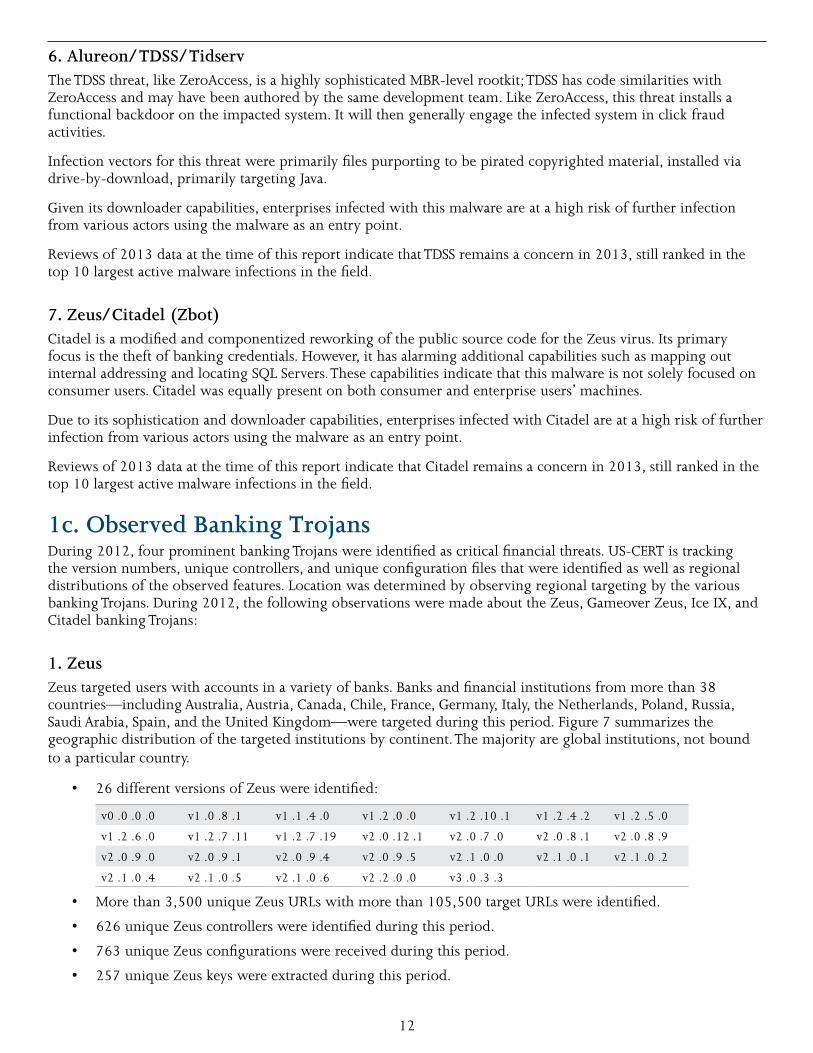
6. Alureon/TDSS/TidservThe TDSS threat, like ZeroAccess, is a highly sophisticated MBR-level rootkit; TDSS has code similarities with ZeroAccess and may have been authored by the same development team . Like ZeroAccess, this threat installs a functional backdoor on the impacted system . It will then generally engage the infected system in click fraud activities .
Infection vectors for this threat were primarily files purporting to be pirated copyrighted material, installed via drive-by-download, primarily targeting Java .
Given its downloader capabilities, enterprises infected with this malware are at a high risk of further infection from various actors using the malware as an entry point .
Reviews of 2013 data at the time of this report indicate that TDSS remains a concern in 2013, still ranked in the top 10 largest active malware infections in the field .
7. Zeus/Citadel (Zbot)Citadel is a modified and componentized reworking of the public source code for the Zeus virus . Its primary focus is the theft of banking credentials . However, it has alarming additional capabilities such as mapping out internal addressing and locating SQL Servers . These capabilities indicate that this malware is not solely focused on consumer users . Citadel was equally present on both consumer and enterprise users’ machines .
Due to its sophistication and downloader capabilities, enterprises infected with Citadel are at a high risk of further infection from various actors using the malware as an entry point .
Reviews of 2013 data at the time of this report indicate that Citadel remains a concern in 2013, still ranked in the top 10 largest active malware infections in the field .
1c. Observed Banking TrojansDuring 2012, four prominent banking Trojans were identified as critical financial threats . US-CERT is tracking the version numbers, unique controllers, and unique configuration files that were identified as well as regional distributions of the observed features . Location was determined by observing regional targeting by the various banking Trojans . During 2012, the following observations were made about the Zeus, Gameover Zeus, Ice IX, and Citadel banking Trojans:
1. ZeusZeus targeted users with accounts in a variety of banks . Banks and financial institutions from more than 38 countries—including Australia, Austria, Canada, Chile, France, Germany, Italy, the Netherlands, Poland, Russia, Saudi Arabia, Spain, and the United Kingdom—were targeted during this period . Figure 7 summarizes the geographic distribution of the targeted institutions by continent . The majority are global institutions, not bound to a particular country .
• 26 different versions of Zeus were identified:
v0 .0 .0 .0 v1 .0 .8 .1 v1 .1 .4 .0 v1 .2 .0 .0 v1 .2 .10 .1 v1 .2 .4 .2 v1 .2 .5 .0
v1 .2 .6 .0 v1 .2 .7 .11 v1 .2 .7 .19 v2 .0 .12 .1 v2 .0 .7 .0 v2 .0 .8 .1 v2 .0 .8 .9
v2 .0 .9 .0 v2 .0 .9 .1 v2 .0 .9 .4 v2 .0 .9 .5 v2 .1 .0 .0 v2 .1 .0 .1 v2 .1 .0 .2
v2 .1 .0 .4 v2 .1 .0 .5 v2 .1 .0 .6 v2 .2 .0 .0 v3 .0 .3 .3
• More than 3,500 unique Zeus URLs with more than 105,500 target URLs were identified .
• 626 unique Zeus controllers were identified during this period .
• 763 unique Zeus configurations were received during this period .
• 257 unique Zeus keys were extracted during this period .

13
54%
33%
5% 5%
2% 1% 0%
Global
Europe
Asia
Australia
South America
North America
Africa
Figure 7: Zeus Targets by Continent
2. GameOver ZeusBanks and financial institutions in Australia, Canada, Germany, Italy, Poland, Saudi Arabia, and South Africa were targeted the most during this period .
• 7,006 GameOver P2P drones were identified during this period .
• More than 540 unique GameOver Zeus URLs with more than 2,100 target URLs were identified .
• One new configuration file was received during this period .
3. Ice IXGlobal banks and financial institutions across more than 33 countries—including Australia, Canada, Chile, Finland, France, Germany, Ireland, Italy, Latvia, the Netherlands, Norway, Russia, Spain, Turkey, and the United Kingdom—were targeted during this period . Figure 8 summarizes the geographic distribution of the targeted institutions by continent . The majority are global institutions, not bound to a particular country .
• 13 different versions of Ice IX were identified:
v1 .2 .1 .0 v1 .2 .6 .0 v1 .1 .8 .0 v1 .2 .7 .0 v1 .2 .5 .0 v1 .1 .0 .0 v1 .2 .7 .19
v1 .2 .2 .0 v1 .1 .5 .0 v2 .0 .8 .1 v1 .1 .7 .0 v1 .1 .9 .0 v1 .2 .0 .0
• More than 1,600 unique Ice IX URLs with more than 5,460 target URLs were identified .
• 121 unique Ice IX controllers were identified during this period .
• 215 unique Ice IX configurations were received during this period .
• 53 unique Ice IX keys were extracted during this period .

14
52%
27%
12%
5%3%
1%
Global
Europe
Australia
Asia
South America
North America
Figure 8: Ice IX Targets by Continent
4. CitadelGlobal banks and financial institutions—including many in Australia, Finland, Germany, Italy, the Netherlands, Norway, Poland, Romania, Russia, Spain, Sweden, Switzerland, and the United Kingdom—were targeted during this period . Figure 9 summarizes the geographic distribution of the targeted institutions by continent . The majority are global institutions, not bound to a particular country .
• 14 different versions of Citadel were identified:
v1 .3 .3 .5 v1 .3 .4 .5 v1 .3 .5 .1 v1 .2 .4 .0 v1 .1 .5 .1 v1 .3 .4 .0 v1 .3 .3 .4
v1 .2 .3 .1 v1 .3 .3 .3 v1 .3 .0 .0 v1 .2 .0 .0 v1 .1 .4 .0 v1 .3 .5 .0 v1 .3 .3 .1
• More than 1,800 unique Citadel URLs with more than 4,200 target URLs were identified .
• 368 unique Citadel controllers were identified during this period .
• 660 unique Citadel configurations were received during this period .
• 145 unique Citadel keys were extracted during this period .

15
49%
35%
12%3%
1%
Global
Europe
Australia
Asia
Other
Figure 9: Citadel Targets by Country
2. Malware Analysis/CharacterizationThe CERT Artifact Catalog (AC) is a collection of malicious artifacts maintained by the CERT Coordination Center (part of the Software Engineering Institute at Carnegie Mellon University) . The catalog contains more than 60 million artifacts collected from thousands of different sources . All malware in the catalog is executed in a sandboxed environment, which records the behavior of the malware, including the domain names with which it attempts to communicate . Domains that are in the Alexa Top One Million (www .alexa .com), as well as those that begin with ntp (as in ntp .example .com), are removed from the results . The remaining domains are then compared against a database of passive Domain Name System (DNS) information to ascertain if the domains are active .
Sections 2a-2d report various features of the domains observed from the CERT Artifact Catalog that were active in the DNS . To be considered active, a domain must be observed in use (that is, there is a record in the passive DNS database that someone successfully resolved the domain), and the domain must not have been designated as a name server . Results from a partner’s sandbox environment were also tested in the same manner and are included when possible . Because there is potential for duplication of malware testing (multiple sources having the same malware sample), data from different sources are independently presented .
Section 2e discusses a different aspect of malicious software: the user-agent string used in web communications . Section 2f discusses the prevalence of different botnets and types of malicious software observed on U .S . systems and networks .

16
2a. Top-Level Domain DistributionFigure 10 shows the distribution of common top-level domains (TLDs) used by malware per quarter, based on the total number of active, fully-qualified domain names .
0%
10%
20%
30%
40%
50%
60%
70%
com net info org biz cc cn Others
CERT AC Q1
CERT AC Q2
CERT AC Q3
CERT AC Q4
Partners CY2012
Figure 10: Top-Level Domains Used by Malware

17
2b. Geo-Location of IP Addresses Used by MalwareFigure 11 shows the country of origin for IP addresses, using data provided by MaxMind (www .maxmind .com) . The IP addresses are derived simply from the A records of the observed active malicious domains in the DNS .10 The data depicted represents not only sources of attacks but also destinations of outbound traffic from compromised systems . For instance, a malware-infected system may be configured to “call home” for additional instructions, for reporting, or to act as a hub for communications to other infected systems . In both the CERT AC and the partner sources, the country with the most IP addresses is Algeria, with the United States and Morocco following closely behind . Roughly 23 percent of IP addresses used by malware were not geographically discernible .
0%
5%
10%
15%
20%
25%
30%
CERT AC Q1 CERT AC Q2 CERT AC Q3 CERT AC Q4 Partners CY2012
Figure 11: Geo-Location of IP Addresses Used by Malware
10 The main purpose of the DNS is to map domain names to IP addresses, so when a domain is active it almost always has an IP address or addresses associated with it. We used any address associated with any active malware domain during 2012.

18
2c. IP Addresses Per Malicious DomainFigure 12 shows the number of distinct IP addresses associated with observed malicious domains . Most malicious domains only ever have one IP address associated with them . However, several domains are successfully resolved to over 100 distinct IP addresses during their lifetimes . A few are resolved to over 1,000 distinct IP addresses .
0%
5%
10%
15%
20%
25%
30%
35%
40%
45%
50%
Distinct IP Addresses
CERT AC Q1CERT AC Q2CERT AC Q3CERT AC Q4Partners CY2012
Figure 12: Number of Distinct IP Addresses Used by Observed Malware Domains

19
2d. Number of Domains Used by a Malware ArtifactFigure 13 shows how many domains a given artifact attempted to contact . Most artifacts attempt to contact only one domain . High numbers indicate malware using domain generation algorithms or similar techniques to facilitate more robust command and control communication .
0%
10%
20%
30%
40%
50%
60%
70%
Number of unique DNS names
Percent of unique domain lookups per artifact
Q1Q2Q3Q4
Figure 13: Percent of Unique Domain Lookups Per Artifact
2e. User-Agent StringsIn computing, a user agent (UA) is software that acts on behalf of a user . In many cases, a user agent acts as a client in a network protocol used in communications with a client-server computing system . In particular, the Hypertext Transfer Protocol (HTTP) identifies the client software originating the request using a user-agent header . When a user agent operates in a network protocol (such as HTTP), it often identifies itself, its application type, operating system, its software vendor, or its software revision by submitting a characteristic identification string from client to server . In HTTP, the UA string is often used for content negotiation from servers and workstations to tablets and other mobile devices .
Malware can use traditional UA strings when it takes over a browser, or it can create its own strings according to its purpose . Partner-contributed data containing UA strings collected during 2012 was analyzed to evaluate trends regarding well-formed UA strings vs . outlying or strange strings .

20
Malware files collected in 2012 and examined in the partner’s runtime environment11 produced 375,665 UA strings observed in HTTP traffic . Accounting for replication, the data set consisted of 14,719 unique UA strings . For each unique string, the following measurements were taken:
• Count: the number of times the string appeared in the data set
• StrLen: the total length of the string (1 to 256 characters)
• Elements: the total number of substring elements, stripped of white space, after separating the string on any of a set of 7 characters: “:” “;” “(“ “)”“/” “{“ “}”
Figure 14 displays a bar plot of counts associated with the 500 most popular UA strings in the data set . Three marked points show changes in the pattern of popularity, which can be used as principled cutoff points for analysis of “typical” vs . “atypical” UA strings .
0 100 200 300 400 500Rank
Coun
t
1
4
16
64
256
1,024
4,096
16,384
65,536
Top 10 Top 50 Top 115
Figure 14: Ranked Count of Unique UA Strings
This bar plot does not appear to have as much of a heavy drop-off as expected, possibly due to minor changes in the string elements, repeated many times . Note that counts are shown, on the log base 2 vertical scale, so even subtle changes in steepness correspond to significantly different patterns of popularity . There are some observable changes in steepness at the top 10, top 50, and top 115 UA strings .
The top 115 unique UA strings make up 88 .4 percent of all instances in the total data set, with the remaining 14,604 UA strings accounting for 11 .6 percent of all instances in the total data set .
The top 115 strings and a random sample of 50 from the remaining 14,604 unique UA strings were processed through an online analyzer and categorized as well-formed or malformed according to the number of recognizable components from the analyzer’s parser . Of the top 115 unique UA strings, 63 percent were classified as malformed; of the random sampling of 50 unique UA strings from the remaining data set, 66 percent were classified as malformed —a nearly identical proportion to the most popular strings . Replications correspond to 47 percent of the instances of the top 115 unique UA strings labeled as “unknown” and about 31 percent of
11 http://www.sourcefire.com/report/2012/DHS_USCERT_Security_Trends

21
the remaining unique UA strings labeled as “unknown .” These rates suggest that the diversity of well-formed UA strings is similar to the diversity of malformed UA strings . For the entire replicated set, approximately 49 .6 percent of UA strings used are malformed .
Much of the diversity of well-formed UA strings comes from the prevalence of Mozilla-compatible strings with recognizable elements that are appended to the end of the string .
For example, a sampled known tail string (1 count) is shown here:
Mozilla/4.0 (compatible; MSIE 7.0; Windows NT 5.1; Trident/4.0; .NET CLR 1.0.3705;
.NET CLR 1.1.4322; Media Center PC 4.0; .NET4.0C; .NET4.0E; .NET CLR 3.0.04506.648; AskT-bORJ/5.13.1.18107; .NET CLR 2.0.50727; .NET CLR 3.0.4506.2152; .NET CLR 3.5.30729)
Compared to the most popular UA string (119,574 counts):
Mozilla/4.0 (compatible; MSIE 6.0; Windows NT 5.1; SV1)
Older OS and browser versions were associated with the less popular UA strings . Some Google search bots showed up in the top 115 UA strings and were labeled as known with some unknown components by the online analyzer . Bot crawlers (e .g ., Yahoo! Slurp China!, Synoobot, Becomebot) were represented in the tail sample: 19 out of 50 sampled tail strings were bots, for an estimated 38 percent of the tail and approximately 4 percent of all replicated UA strings . The following are examples of bot strings:
Mozilla/5.0 (compatible; Synoobot/0.9; http://www.18527z5ri8.com/m229sh/bot.html) Mozilla/5.0 (compatible; SummizeBot +http://www.15k89blyi711.com)
Mozilla/5.0 (compatible; MojeekBot/2.0; http://www.8f5mtkfi0na.com/bot.html)
Mozilla/5.0 (compatible; MSIE 6.0; Podtech Network; [email protected]) Mozilla/5.0 (compatible; MSIE 6.0; Podtech Network; [email protected]) Mozilla/5.0 (compatible; Charlotte/1.0b; [email protected])
Given that all of the UA strings in this sample came from queries made by systems running binaries flagged as malware, it seems reasonably safe to assume that UA strings matching well-known, legitimate bots such as the Googlebot are simply malware authors attempting to avoid detection, and not the creators of those crawlers using malware or grayware to do their work .
Where the bot strings become particularly interesting is the unknown strings, both from detection and malware-author behavioral-analysis perspectives . Detection of malicious network traffic with an Intrusion Detection System (IDS) or proxy is mostly based on signature matches in the traffic . A UA string known nowhere else on the Internet except in a malicious traffic set is typically a good signature to alert on, as its false positive rate in the wild should approach or be zero . There are many difficulties with doing detection using unique, yet transient strings . This problem has been investigated in regards to DNS names . The same challenges would apply to UA strings; however, the most common malicious UAs could be blocked . All of the unique malformed UAs detected in this analysis could be blocked, which would reduce the number of permitted malicious web connections by about half (49 .6 percent) .
Looking at the example bot strings above—which contain domain names that are all absent from the global WHOIS database at the time this report was written—it appears as though the creators of these particular malicious binaries are making work easy for network defenders by providing such unique strings upon which to base detection . If, however, we assume a modicum of professionalism or desire to thwart detection, we must wonder what purposes these random domains serve . Were they perhaps targeted phishing attempts against system administrators, who might click the links in their web server log files out of sheer curiosity, or are they simply noise presented in a fairly standardized format, in an attempt to thwart automated detection of “non-standard” bot strings? This is a question that likely warrants further study but is outside the scope of this particular report .
We can also look at the relationship between total string length and the number of elements, which points out some outliers, especially for strings with fewer than six elements .

22
0
50
100
150
200
250
Number of Elements
Tota
l Str
ing
Leng
th
1 2 3 4 5 6 7 8 9 10 12 14 16 18 20 22 24 26
Median[0.025, 0.975] Bound
Figure 15: Total String Length Vs. Number of Elements
The relationship between total string length and the number of elements identifies some additional outliers, especially for strings with fewer than six elements, as represented in Figure 15 . Strings with small numbers of elements based on the separating characters are generally unknown . In the sample of unique strings (the top 115 plus the 50 randomly sampled), of 77 UA strings with one or two elements, only 2 .5 percent were known (those known were the Googlebot strings) . 58 percent of a total of 72 strings with between 3 and 10 elements were known, and all 16 strings with greater than 10 elements were known . This information, plus the somewhat even distribution of known and unknown strings across popularity, suggests that the number of elements in a string may be a better large-scale indicator than popularity for its custom vs . non-custom utility for the malware author and thus for its utility as a potential detection criterion .
As with a DNS-based blacklist, a UA-based blacklist is likely to be a useful portion of a defense-in-depth strategy . Though less than half of the top 115 strings are potential candidates to use in a blacklist, the frequency of their appearance in the sample set is large enough to indicate that requests made with these malicious UA strings will yield large numbers of detections of infected systems in the wild, spanning different malware families and large periods of time . Combined with relatively rapid updates (which would contain large numbers of temporarily useful detection criteria in the form of infrequently used, but very clearly malicious, UA strings from the tail of our distribution), a properly implemented UA blacklist could prove to be a powerful tool in the fight against modern malware .

23
2f. Botnet StatisticsA “bot” is an industry term for a compromised system; it refers to a machine controlled remotely, usually by an unfriendly controller . Cyber criminals distribute malware with the intent of taking over as many individual computers as possible . Once infected, these computers form a network (a botnet) that often transcends security and geographic boundaries, and is controlled by the bot master . The bot master uses these networks to perform automated tasks on a large scale—all without the owners’ knowledge, such as sending spam or conducting distributed denial of service attacks . Figure 16 shows the top 30 botnets infecting U .S .-based systems in 2012, by both unique IP addresses observed in the botnet and number of connection attempts .
dnschanger
con�cker.abc
traf�cconverter
zeus-p2p
tdss
sinkhole
slenfbot
sality
grum
slenfbot.5050
3322.org-generic
sality-p2p
ircbot
�ashback
pushdo
sality2
zeus
other
avalanche
kelihos
seguranca
ssh-brute-force
yzf
3322.org-pcclient
ransomware
spam
gameover_zeus
virut_botnet
virut botnet
gozi
Botne
t
Average Number of Unique IP Addresses Per Day
1 10 100
1,000
10,00
0
100,0
00
1,000
,000
10,00
0,000
100,0
00,00
0
1,000
,000,0
00
Average Number of Connections Per Day
Figure 16: Top 30 Botnets Infecting U.S. Systems

24
3. Phishing
3a. Maliciously Registered Phishing DomainsPhishing attacks remain a consistent threat to U .S . Internet users . Data from industry partners shows 216,938 unique phishing attacks in 2012, hosted on 153,952 unique domain names . However, not all of these domain names were maliciously registered; many are simply compromised . This determination is generally made based on the past history of the domain; hacked domains have significant previous benign activity . In fact, based on the data provided, only 13,545 of the domains in 2012 seem to have been maliciously registered for the purposes of phishing .
Responding to maliciously registered domains seems to be in the purview of the registrars and registries in a way that responding to compromised domains is not . Compromised domains have legitimate users, and operators have a responsibility for limiting collateral damage . If a domain is registered solely for malicious use, legitimate use is not a concern . Several industry partners have compiled statistics on the top-level domains (TLDs) with the most maliciously registered domains per 10,000 domains in that registry . There are many fewer maliciously registered domains than phishing domains in general, and only 33 of the more than 220 TLDs with phishing reported had more than a few maliciously registered domains in all of 2012 . Further, since the industry partners can reasonably obtain only zone-size estimates and reports from TLDs, these statistics do not include those phishing domains registered in subdomain services or virtual hosting,12 services that represent about 1 in 8 domains in the industry partners’ data set .
After attempting to control for these difficulties, one can calculate the rate at which domains were registered especially for phishing in each TLD . Figure 17 displays the results . The TLDs of .asia, .ms, .tk, and .in stand out in this graphic—the percentage of malicious domains registered in these TLDs is much higher than that of the rest of the TLDs .
The TLD with the highest absolute number of maliciously registered TLDs is still .com; in fact, 51 percent of total phishing domains were hosted in .com . However, .com is at least an order of magnitude larger than the other TLDs, so its ratio of malicious registrations is somewhat less, though the absolute number is large . The high rate of registrations for phishing in .asia, .ms, .tk, and .in may indicate an interesting insight .
0.000
0.005
0.010
0.015
0.020
0.025
0.030
0.035
0.040
Perc
ent o
f Mal
icio
us D
omai
ns
Top Level Domain
Figure 17: Percentage of Maliciously Registered Phishing Domains Per TLD. Note the Y-axis range is 0 to 0.04% (i.e., the max is 4 in 10,000 domains).
12 Both services provide a way to locate or host resources. These resources could be created maliciously and might factor into a discussion of malicious registrations. However, since these services are offered independently by a variety of private organizations, we have no reliable method of assessing the rate of maliciously created material.

25
3b. Observed Spam ThemesSpam lure data was collected during Q2 and the beginning of Q3 2012 to establish a baseline for future trend reporting and to report on readily observable changes in the data during 2012 . Observed samples revealed that the largest portion of spam lure themes occurring during 2012 consisted of the following topics:
• Business logistical operations, such as packaging, shipping, voice and fax messaging services, and online document services
• Financials, such as tax-related subjects
• Claims of either customer complaints or legal filings against a company, such as by the Better Business Bureau (BBB) and other federal and local civilian labor agencies
• Travel
These topics were found to be consistent through Q3 and Q4 2012 but varied in their numbers based on real-world events occurring during those quarters .
As presented in Figure 18, lures spoofing financial institutions were observed as the top spam theme, with 23 percent of spam lures occurring from July through September 2012 . During that same time, packaging and shipping lures made up only about 11 percent of observed themes .
Obse
rvat
ions
%
25%
20%
15%
10%
5%
0%
UPS/FedEx
Financials
Voice/Fax M
essages
BBB
IntuitCNN
Delta
Verizon
Skype
Xerox
IRS/Tax
ACHPayp
alAT&T
Linke
dIn/Careerbuilder
Wire
Transfe
r
VodaphoneFD
IC
Google Drive
Sprint
Discove
r
DocuSign
Pharmaceutic
al
Credit Score
ADP
HP Scan
% (Oct-Dec)
% (July-Sept)
Figure 18: Comparative Change in Spam Theme
26
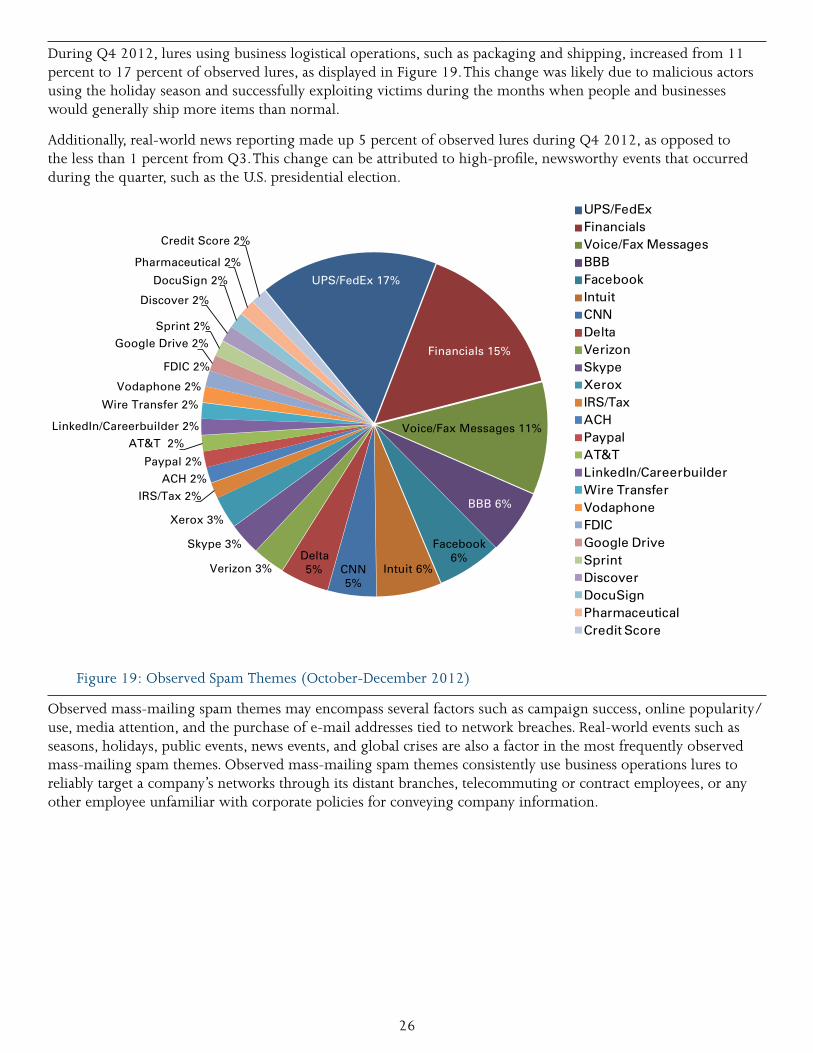
During Q4 2012, lures using business logistical operations, such as packaging and shipping, increased from 11 percent to 17 percent of observed lures, as displayed in Figure 19 . This change was likely due to malicious actors using the holiday season and successfully exploiting victims during the months when people and businesses would generally ship more items than normal .
Additionally, real-world news reporting made up 5 percent of observed lures during Q4 2012, as opposed to the less than 1 percent from Q3 . This change can be attributed to high-profile, newsworthy events that occurred during the quarter, such as the U .S . presidential election .
UPS/FedEx 17%
Financials 15%
Voice/Fax Messages 11%
BBB 6%
Facebook 6%
Intuit 6%CNN5%
Delta 5%Verizon 3%
Skype 3%
Xerox 3%
IRS/Tax 2%
ACH 2%
Paypal 2%
AT&T 2%
LinkedIn/Careerbuilder 2%
Wire Transfer 2%
Vodaphone 2%
FDIC 2%
Google Drive 2%
Sprint 2%
Discover 2%
DocuSign 2%
Pharmaceutical 2%
Credit Score 2%
UPS/FedExFinancialsVoice/Fax MessagesBBBFacebookIntuitCNNDeltaVerizonSkypeXeroxIRS/TaxACHPaypalAT&T LinkedIn/CareerbuilderWire TransferVodaphoneFDICGoogle DriveSprintDiscoverDocuSignPharmaceuticalCredit Score
Figure 19: Observed Spam Themes (October-December 2012)
Observed mass-mailing spam themes may encompass several factors such as campaign success, online popularity/use, media attention, and the purchase of e-mail addresses tied to network breaches . Real-world events such as seasons, holidays, public events, news events, and global crises are also a factor in the most frequently observed mass-mailing spam themes . Observed mass-mailing spam themes consistently use business operations lures to reliably target a company’s networks through its distant branches, telecommuting or contract employees, or any other employee unfamiliar with corporate policies for conveying company information .

27
4. Network Scanning/Reconnaissance StatisticsThe EINSTEIN system, developed in 2003, provides an automated process for collecting, correlating, and analyzing computer network security information from voluntary participating federal executive agencies .13 It works by collecting network flow (NetFlow) records . NetFlow records are records of connections made to a federal executive agency’s IT systems . The records identify the source Internet protocol (IP) address of the computer that connects to the federal system; the port the source uses to communicate; the time the communication occurred; the federal destination IP address; the protocol used to communicate; and the destination port . NetFlow records used by EINSTEIN do not contain any content transmitted over the network .
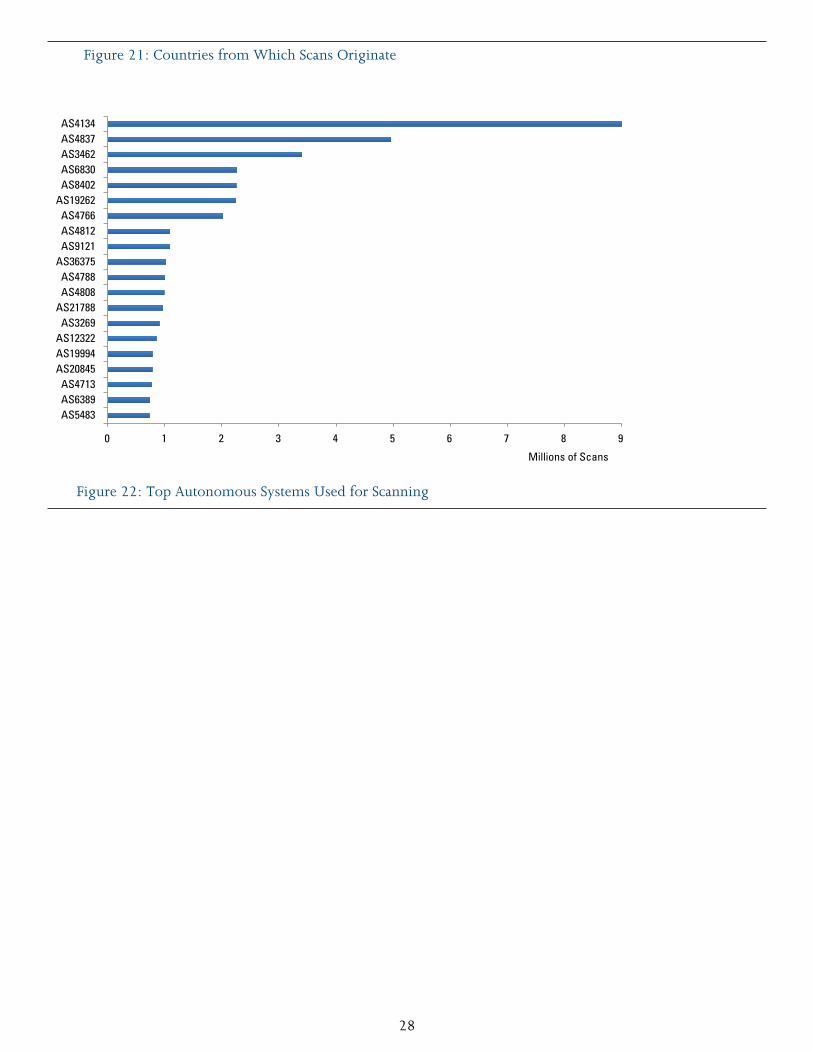
Scanning activity collected from NetFlow records is measured using the Threshold Random Walk14 and the Bayesian Logistic Regression15 scan detection models . The charts below summarize the activity seen in 2012 . Figure 20 displays the number of scans per day . Figure 21 displays the top countries from which scans originated, and Figure 22 demonstrates the top autonomous systems (AS)—groups of IP addresses under a single control structure—used for scanning .
02000004000006000008000001000000
1-Jan 1-Feb 1-Mar 1-Apr 1-May 1-Jun 1-Jul 1-Aug 1-Sep 1-Oct 1-Nov 1-Dec
Figure 20: Scans per Day
0 5 10 15 20
United StatesChina
Russian FederationTaiwan
Korea, Republic ofRomania
BrazilHungary
GermanyJapan
IndiaItaly
BulgariaTurkeyPoland
BulgariaCanadaFrance
SpainUkraine
Millions of Scans
13 http://www.dhs.gov/privacy-documents-national-protection-and-programs-directorate-nppd14 Jung, J.; Paxson, V.; & Berger, A. W. “Fast Portscan Detection Using Sequential Hypothesis Testing.” Proceedings of the 2004 IEEE Symposium on Security and
Privacy. Oakland, CA, 2004. pp. 211-225.15 Gates, C.; McNutt J.; Kadane J.; & Kellner, M. “Scan Detection on Very Large Networks Using Logistic Regression Modeling.” Proceedings of the IEEE
Symposium on Computers and Communications, 2006. pp. 402-408
28
Figure 21: Countries from Which Scans Originate
0 1 2 3 4 5 6 7 8 9
AS4134AS4837AS3462AS6830AS8402
AS19262AS4766AS4812AS9121
AS36375AS4788AS4808
AS21788AS3269
AS12322AS19994AS20845AS4713AS6389AS5483
Millions of Scans
Figure 22: Top Autonomous Systems Used for Scanning

29
5. Routing StatisticsWhile not directly tied to the attack landscape, the shape of the Internet as it stands today is an important part of understanding the field on which network administrators are fighting modern threats to their networks . As such, this section presents some relevant routing information about the way the Internet operates, in particular as it relates to the United States at a commercial and governmental level .
5a. Announcing U.S. Government IP SpaceBorder Gateway Protocol (BGP) is the routing protocol used at the core of the Internet to move packets between autonomous systems . BGP has no built-in security, which means that an autonomous system can announce that it is the appropriate route to networks that it does not own and then hijack traffic . It is impossible to say whether these erroneous announcements are malicious or merely mistakes .
Historical BGP data from the RouteViews and RIPE NCC projects was used to determine which non-U .S . autonomous systems erroneously announced U .S .-government-owned IP space during 2012 . The timeline in Figure 23 illustrates the announcements, which AS issued the erroneous announcement, for which IP block, and for how long . Table 2 supplements this figure by listing the location of the organizations that own the autonomous systems on the timeline .
AS4538155.26.64.0/24, 22.30.204.0/23
AS9198
11.22.33.0/24
AS12389102.13.10.194/29
AS3841021.104.161.248/32
AS577
22.1.1.0/27
AS41313
11.12.13.0/24AS13424
11.0.0.0/24
-2012 02-2012 03-2012 04-2012 05-2012 06-2012 07-2012 08-2012 09-2012 10-2012 11-2012 12-2012 01-2013
AS2208147.104.37.0/24, 147.104.38.0/24, 147.104.39.24
Figure 23: Non-U.S. Autonomous Systems Announcing U.S. Government IP Space

30
Table 2: Autonomous System by Country of Ownership
Autonomous System Country
AS12389 Russia
AS4538 China
AS9198 Kazakhstan
AS38410 South Korea
AS577 Canada
AS2208 France
AS41313 Bulgaria
AS13424 Chile
5b. Centrality of U.S. NetworksThe centrality of U .S .-owned autonomous systems to the Internet at large is demonstrated by the percentage of Internet routes that require a U .S .-owned autonomous system to be complete . To determine this percentage, it is necessary to determine:
(1) The percentage of Internet routes that start outside the United States and then touch a U .S .-owned autonomous system at some point
(2) The percentage of Internet routes that use the United States in transit (i .e ., the path starts outside the United States, touches one or more U .S .-owned autonomous systems, and then exits)
Figure 24 illustrates the centrality of U .S . networks during 2012 based on these percentages .
0
20
40
60
80
100
02-2012 04-2012 06-2012 08-2012 10-2012 12-2012
Percen
tage
Time
Percentage of Routes that Enter the US and ExitPercentage of Routes that Enter the US
Figure 24: Centrality of U.S. Networks

31
The percentage remained relatively stable throughout 2012 in both cases, with a summary of the maximum, minimum, and average found in Table 3 .
Table 3: Percentage of Routes Using U.S. Networks
Type Min Max AverageTransit 47.4% 53.6% 51.8%
Entry 70.4% 74% 72.5%
There was an increase of 28 .6 percent in the number of Internet routes available in 2012 . There were increases in the number of routes entering the United States (25 .6 percent) and in the number of routes that used the United States in transit (25 percent) . The centrality of U .S . networks remained constant through the year, although the global Internet seems to be diversifying slightly .
5c. Service Providers Used by U.S. GovernmentThe U .S . government has peering relationships with autonomous system networks (ASNs) that provide for ingress/egress into the Internet at large . Figure 25 shows which service providers offered egress for the largest amount of government IP addresses during 2012 . This assessment was performed on January 1, 2012 and on December 1, 2012 to show how these numbers changed over the course of the year .
0% 10% 20% 30% 40% 50% 60%
ASN-QWEST-US NOVARTIS-DMZ-US-209
AS1239 SprintLink Global Network-1239
Level 3 Communications-3549
TWTC - tw telecom holdings inc.-4323
ABILENE - Internet2-11537
ESNET - ESnet-293
NLR - National LambdaRail-19401
UUNET - MCI Communications Services Inc.…
ATT-INTERNET4 - AT&T Services Inc.-7018
No IP Whois data-3356
STARTAP - National Center for…
CSUNET-NE - California State University…
AARNET-AS-AP Australian Academic and…
MREN - Metropolitan Research and Education…
other
Percent of Federal Government IP space Advertised
End of 2012
Beginning of 2012
Prov
ider
Nam
e - A
SN
Figure 25: U.S. Government Increase in IPv6 Announcements in 2012

32
5d. IPv6 Usage in U.S. GovernmentDuring 2012, IPv6 announcements became more prevalent in response to the mandate that the U .S . government make all public-facing websites and e-mail services available over IPv6 .
Analysis of government IPv6 announcements into the Internet at large was also performed using data from RouteViews (http://www .routeviews .org) and RIPE (http://ripe .net) . Figure 26 displays the percentage of U .S .-government-owned autonomous system numbers (ASNs) that claim to have endpoints in some amount of IPv6 address space . Overall, there was a growth from 21 .7 percent of U .S .-government-owned ASNs at the beginning of the year to 41 percent at the end of the year . In comparison, out of all ASNs on the Internet, 12 .5 percent announced IPv6 address space at the beginning of the year, and 15 .6 percent at the end . Considering only U .S .-based ASNs, the rates of IPv6 announcements were 5 .4 percent at the beginning of the year and 7 .4 percent at the end of the year .
20
22
24
26
28
30
32
34
36
38
40
42
01-2012 02-2012 03-2012 04-2012 05-2012 06-2012 07-2012 08-2012 09-2012 10-2012 11-2012 12-2012 01-2013
Perc
enta
ge o
f ASN
s
Time
Figure 26: Growth of IPv6
33
6. ConclusionsThe single biggest conclusion we can draw from the data in this report is that the scale of the problem of malicious software continues to grow in nearly every facet: geography, number of domains and IP addresses contacted, the diversity of signatures (on the network and on the host), and the number and breadth of phishing and spam lure campaigns . The defender community must scale its efforts to address, contain, and thwart these activities .
Dedicated financial theft Trojans (Section 1c), including Zeus, Citadel, and Ice IX, continue to grow in popularity . These are kits that are purchased, configured, and launched by a multitude of independent actors . The breadth of targets, the wide variety of versions, and the number of actors using these kits continue to grow as cybercrime’s criminal element grows .
The scale of botnets continues to grow as well . While new botnets have appeared, many of the old botnets such as Conficker, Grum, Virut, and others have not gone away, continuing to strain defenders’ resources . As a point of reference, it took nearly a decade for Code Red to be eradicated from the Internet, and data shows that the SQLSlammer worm can still be found on the Internet . Infected machines have a surprisingly long life, and they continue to cause damage .
Cybercrime is an increasingly global problem, and 2012 statistics show that there is no end in sight . To address the global nature of cybercrime, private industry and security research communities continue to work on international outreach at all levels, with an emphasis on data sharing and collaboration .
This report is the first of a series of annual reports, enabling comparisons of yearly data to reveal new trends, the effects of remediation efforts, and the emergence of new threats .
7. Further Information
Contact UsTo request information or provide suggestions about this report please contact the CERT Coordination Center at cert@cert .org .
FeedbackUS-CERT continuously strives to improve its products and services . You can help by answering a short series of questions about this product at the following URL: https://forms .us-cert .gov/ncsd-feedback/ .
Department of Homeland Security DisclaimerThis report is a non-commercial publication intended to educate and inform personnel engaged in cybersecurity . Further reproduction or redistribution is subject to original copyright restrictions . DHS provides no warranty of ownership of the copyright, or accuracy with respect to the original source material .

US-CERT 2013 Security Trends Report: 2012 in Retrospect