U.S. Bill of Lading Data: Company Profiles Research Papercomprehensive database of merchandise...
28
U.S. Bill of Lading Data: Company Profiles Research Paper Maritime & Trade, 2017 Tim McLaughlin – Sr. Manager, Industry Solutions [email protected] David Riehl – Director, Securities Finance [email protected]
Transcript of U.S. Bill of Lading Data: Company Profiles Research Papercomprehensive database of merchandise...

U.S. Bill of Lading Data:
Company Profiles Research
Paper Maritime & Trade, 2017
Tim McLaughlin – Sr. Manager, Industry Solutions
David Riehl – Director, Securities Finance

IHS Markit: Maritime & Trade – Company Profiles Research
Copyright 2017 © IHS Markit Ltd. All rights reserved. | 2
Abstract 3
Maritime & Trade Overview 3
Long/Short Earnings Strategy 3
Introduction to Maritime & Trade 4
US Import and Export Data Collection Overview 4
Description of the Actual Data 7
Description of the Key Data Fields 8
Description of Company Name Consolidation Process 9
Description of Restricted Data 10
Imports vs. Exports 10
Data Coverage 11
Description of 2013 Automation Change 11
Sector coverage 12
Sample Report 12
Sales Forecasting 13
Single Security example 13
Sector Example 13
Long/Short Earnings Strategy 15
Strategy Description 15
Calculating trailing twelve month growth rates 15
Filtering the data 16
Focusing on Earnings 16
Calculating Monthly Quintile Ranks 17
Quintile Performance 17
Import/Export Composite Signal 18
Performance by Month 19
Conclusion 22
Appendix 23
Top Securities for Q1 2017 (February – April) 23

IHS Markit: Maritime & Trade – Company Profiles Research
Copyright 2017 © IHS Markit Ltd. All rights reserved. | 3
Abstract In this paper, we introduce the Maritime & Trade Bill of Lading data set and describe the
collection methods and data validation process. Next, we present a single security and
sector example to evaluate the value of using shipping volumes when forecasting
corporate sales. Finally, we present an example long/short strategy that buys
companies with increasing shipping volumes and shorts companies with decreasing
volumes.
Maritime & Trade Overview
The Maritime & Trade division of IHS Markit includes four primary data assets, each with
an extensive data history going back at least fifteen years. These data assets include
Sea-Web’s comprehensive ship and ownership data, a database of over 200,000+ ships
and over 600 data points associated to each of those ships. Our AISLive’s vessel
tracking capability provides terrestrial and satellite ship movement intelligence of over
130,000 ships at any given moment in time. We have a Global Trade Atlas database
that compiles official import and export statistics from sources around the world into a
comprehensive database of merchandise trade. Lastly, our Bill of Lading data that
includes transactional level details about waterborne trade for 17 countries. Each of
these data assets is unique, comprehensive, and can potentially be applied to financial
modeling.
The United States Bill of Lading data will be the focus of this research paper. With over
10 years of history and comprehensive coverage, IHS Markit provides the leading data
solution for the global shipping industry.
United States Customs and Border Protection requires disclosure of shipment details for
all vessels coming into or going out of US ports. IHS Markit captures this data and
gathers additional data on-site at major US shipping ports. It employs a rigorous
process to clean and validate the data to improve the timeliness, depth and accuracy of
Bill of Lading data.
In an industry first, IHS Markit is providing Bill of Lading data in a normalized format
that easily integrates with existing financial research systems by providing security
identifiers for all of the companies in the M&T database.
While this data is typically used by participants in the global shipping industry, financial
services companies are evaluating the data as a means to monitor the shipping activity
of the companies they cover and to better understand shipping trends that may help
them identify unforeseen risks and opportunities.
Long/Short Earnings Strategy
To demonstrate the value of M&T data for investment managers, we construct an
example strategy that buys and sells companies based on the change in their quarterly
shipping volumes. We propose a method for filtering the data and evaluated the signal
performance each month, with a focus on companies reporting earnings.
We report strong performance with an average annual return of 11% for a long/short
market-neutral strategy when using a combination of signals for both import and export
activity.

IHS Markit: Maritime & Trade – Company Profiles Research
Copyright 2017 © IHS Markit Ltd. All rights reserved. | 4
Introduction to Maritime & Trade
US Import and Export Data Collection Overview
Maritime transport is crucial to the world’s economy as over 90% of the world’s trade is
carried by sea and it is the most cost-effective way to move goods and raw materials
around the world. The inception of the containerization system in 1956 facilitated
international trade and globalization. Containers have standardized dimensions, and
they can be loaded and unloaded, stacked, transported efficiently over long distances,
and transferred from one mode of transport to another (container ships, rail transport
flatcars, and semi-trailer trucks) without being opened. Goods that travel in containers
can vary, such as cars, apparel, electronic goods, and refrigerated cargo such a meats
and fruits.
Non-containerized vessels known as bulk carriers or tankers are specially designed to
transport unpackaged bulk cargo, such as coal, cement, grains, and ore. Tankers are
used to move large shipments of liquid cargo such as crude oil, liquid natural gas (LNG)
and liquid petroleum gas (LPG). These vessels are designed to maximize capacity,
safety, efficiency, and durability. Bulk vessels make up 15%-17% of the world’s
merchant fleets.
IHS Markit is the only data provider with access to a complete history of U.S. import and
export waterborne trade data, including both containerized and non-containerized
vessels. In 2016 we processed over 20 million bills of lading using our proprietary
process to convert raw data into solutions that deliver decision ready intelligence. We
are well versed in the efficient operation of data collection, standardization, collation,
and dissemination because it has been an integral part of our Journal of Commerce
(JOC) business unit since 1827.
Our US import data is sourced directly from US Customs and Border Protection (CBP) in
a semi-automated fashion. Customs has an advanced filing system set up where major
ocean carriers and third party logistics agencies electronically file their manifest
information via EDI up to 72 hours before a vessel calls a US port. A data file is
produced by CBP six days a week, and collected and ingested by our data operations
team. The majority of the data on an import data file contains shipment information
from 1-5 days prior to the current day. For example, a data file for June 10th 2017 will
mostly contain import shipment information from June 6th through June 9th. An
important point to note is that import data is made available in a linear fashion. For a
given “data month” we anticipate having collected and processed all records in that
month approximately 10 days after the end of the month. For example, our January
2017 import data is deemed “certified” by February 10th, 2017.
EDI Filed Electronically
Shipment arrives at US
port
Data received by IHS
Maritime & Trade
Data "certified" as complete and
accurate
t-3 t+0 t+1 t+10
US Imports Data Collection Timeline

IHS Markit: Maritime & Trade – Company Profiles Research
Copyright 2017 © IHS Markit Ltd. All rights reserved. | 5
US export data is sourced via multiple means due to the manual nature of the filing
process. Primarily data is made available through US Customs “Document Imaging
System” (DIS) program. Customs requires major ocean carriers to file PDFs of bills of
lading via email approximately 7-10 days after a vessel calls a port. CBP collects these
PDFs and distributes them to data subscribers on a weekly basis in an XML file with
PDFs embedded within the XML. IHS Markit extracts the PDFs from the XML, loads them
through an Optical Character Recognition (OCR) process in order to create a data feed
that is then ingested and stored in our database.
Secondarily, there is still bill of lading documentation that is filed manually via paper at
over two dozen ports across the United States. IHS Markit has invested in a network of
employees that are strategically placed at port locations across the US to collect this
paper documentation. Our port employees will collect manifest information at each
location on a daily, weekly, or monthly basis depending on the amount of volume at the
port. The paperwork that is collected on-site is either scanned into our system or
manually data entered into our propriety software application.
Lastly, we obtain weekly or monthly data feeds from many of the top ocean carriers
who are also IHS Markit customers. Leveraging these data feeds allows us to process
the data in a more timely fashion while minimizing the opportunity for error through the
removal of manual intervention. For a given “data month” on US exports we anticipate
having collected and processed all records in that month approximately 35 days after
the end of the month. For example, our January 2017 export data is deemed “certified”
by March 5th 2017. Although most of the data is available within 15-20 days after the
end of the month we still travel to various locations and collect paperwork that is filed
manually.
Shipment departs a US
Port
PDF bill of lading filed with CBP
Majority of data available
Data "certified" as complete and
accurate
t+0 t+7 t+20 t+35
US Exports Data Collection Timeline

IHS Markit: Maritime & Trade – Company Profiles Research
Copyright 2017 © IHS Markit Ltd. All rights reserved. | 6
The chart below depicts the percentage of volume collected by method by looking at the
data through bills of lading, metric tons (bulk shipments), and TEUs (twenty foot
equivalent units – i.e. shipping containers).
The IHS Markit team has several quality control procedures in place to ensure data
quality. Various statistical forecasting and quality control measures are leveraged as
independent checks on overall volume. Additional quality control models are used to
validate shipment volumes by port, shipping line, and commodity. ARIMA modelling is
used to forecast our expected shipment volume to ensure we’re accounting for long-
term trends, seasonality, and month to month variation. When analysing the data prior
to certification, if the actual volume falls out of control limits set by our models it will
prompt an investigation by our quality control team. We also work very closely with our
customers, including many US Ports, top container carriers, and third party logistics
agencies to verify the data on an on-going basis.
US Customs and Border Protection also have measures in place to ensure
documentation is filed accurately with financial penalties in place as a deterrent for
errant filing.
70%
64%
15%
22%
20%
7%
8%
16%
78%
0% 20% 40% 60% 80% 100%
TEUs
Bills
Metric Tons
Centralized US Customs Feed Carrier Data Feeds On Paper in Ports
US Export Data Sourcing

IHS Markit: Maritime & Trade – Company Profiles Research
Copyright 2017 © IHS Markit Ltd. All rights reserved. | 7
Description of the Actual Data
The base document that is filed and reported on is a bill of lading (BOL). Each bill of
lading contains approximately twenty primary data fields and will include but not limited
to:
Bill of Lading Number
U.S. Consignee Name and Address
Foreign Supplier Name and Address
Notify Party Name and Address (Two Notify Party fields per import BOL)
Transportation Companies involved in transaction
Cargo/Commodities being shipped
US Port of Loading (Import/Export)
Foreign Port and Country of Discharge (cargo coming from or going to)
Date of import/export
Vessel Name
US import documentation includes the filing of two types of documentation, “House”
bills of lading and “Master” bills of lading. The filing of the two types of documentation
provides greater insight into the parties involved in the transaction. Key information
about each type of documentation includes:
Master Bill of Lading: cargo receipt filed by the ocean carrier and will include the
parties in the transaction including a third party logistics agency if one is
involved in the shipment. This documentation is filed by the ocean carrier on
behalf of the shipper or third party logistics agency (their customer).
House Bill of Lading: cargo receipt filed by the third party logistics agency on
behalf of the primary party involved in the transaction (shipper).
Understanding the two types of documentation is relevant because it allows users of the
data to discern the relationship between the shipper of the cargo, the third party
logistics agency involved (if applicable), and the ocean carrier involved in shipping the
cargo.
US export documentation only consists of master bills of lading. Third party logistics
agencies are not required to file house bills of lading at this time. This is important to
note because if a third party logistics agency is involved in the transaction they will
show up as the US shipper and not the actual shipper on the bill of lading. The US
shipper will be on the bill of lading documentation for approximately 75% of
transactions (25% of the transactions will have the third party logistics agency).
The US bill of lading data set consists of over 100 data points, including data as filed on
the bill of lading and additional value added fields derived or calculated by our data
processing system.

IHS Markit: Maritime & Trade – Company Profiles Research
Copyright 2017 © IHS Markit Ltd. All rights reserved. | 8
SAMPLE EXPORT BILL OF LADING:
Description of the Key Data Fields
Company Name:
This field is the standardized company name that is filed in any “party” field on a bill
of lading. It is the sum of volume for that entity regardless of if they are the U.S.
Consignee, Foreign Shipper, Notify Party #1 or Notify Party #2.
TEU’s (Twenty Foot Equivalent Units):
This is a common transportation industry measurement for the number of containers
that are being shipped. Containers can be various sizes including 20 foot, 40 foot, 53
foot, etc. The TEU field is a calculated field that is determined based on the number
of containers and their length as filed on the bill of lading. For example, a 40 foot
container would be considering 2 TEUs. Metric Tons:
A unit of mass equal to 1,000 kilograms (2,205 lbs). Shipments:
This field is a count of distinct bills of lading filed by a particular entity.
Container
Carrier
Company
details
Shipment
details
Shipment
date
Port of
Origin/Destination

IHS Markit: Maritime & Trade – Company Profiles Research
Copyright 2017 © IHS Markit Ltd. All rights reserved. | 9
CUSIP Number (Committee of Uniform Securities Identification Procedures):
The CUSIP number consists of a combination of nine characters, both letters, and
numbers, which act as a unique identifier for the type of security issued by a
company. The first six characters identify the issuer and are assigned in an
alphabetical fashion; the seventh and eighth characters (which can be alphabetical
or numerical) identify the type of issue, and the last digit is used as a check digit. ISIN Number (International Securities Identification Number):
This number uniquely identifies a security. Its structure is defined in ISO 6166.
Securities for which ISINs are issued include bonds, commercial paper, stocks, and
warrants.
Description of Company Name Consolidation Process
There are several opportunities for a company name to appear on the documentation
used in the maritime import/export filing process. A company can appear as the US
Consignee (US buyer), Foreign Supplier (imports only), Notify Party #1, and Notify
Party #2. The documentation process is often decentralized for an organization that is
performing the filing, which leads to a significant amount of variation in company names
that show up on a bill of lading. Measures have been put in place during inline data
processing to account for name variation. However unaccounted for, new variants can
enter or company name reference data on a daily basis. There are 2.2 million different
company names per year in the source data; although we estimate less than 200,000
U.S. companies are trading outside North America.
Our reference data consolidation process plays an integral role in providing clear and
concise data to our customers. There are three primary steps that take place during this
process:
1) Company name cleansing
a. Elimination of duplicate names
b. Use regex to remove excess info (email addresses, phone numbers, legal
terms, extraneous words, etc.)
c. Standardization of common terms
2) Name grouping based on similarity
a. Programmatically score names and measure the similarity between each
pair of names that are scored based on the number of words they have in
common
b. Focus on “high quality matches” that exceed a determined quality
threshold
c. “Clusters” of the company names are then grouped together using the
statistical programming language ‘R’.
3) Determine the group’s display name
a. Choosing the representative name in the group that has appeared the
most frequently over the last five years of data
The reference data consolidation process is mostly automated through a machine
learning algorithm but manual intervention is needed for additional validation of
selected names and removal of false positives.

IHS Markit: Maritime & Trade – Company Profiles Research
Copyright 2017 © IHS Markit Ltd. All rights reserved. | 10
Once our reference data has been standardized to display a single variation of an entity
name we cross reference that data with Russell 3000 list. For the resulting matches we
add additional financial data points such as CUSIP, ISIN, Industry, Sector, etc.
Description of Restricted Data
US Customs and Border Protection allows for shippers of cargo to participate in a
“Restricted Parties” program. If a shipper fills out the appropriate documentation and is
approved by US Customs their company name and address will be redacted from
information that is published by Customs. All other information on the bill of lading will
be made available, except for the company name and address information. In the place
of the company name Customs will redact the information using the term “ORDER”. A
company can begin participating in this program at any time and their participation in
the program will be accepted for a period of 24 months. If the company does not
reapply for restricted status by the end of the term, their information will be made
available in import/export data once the 24 month term is up.
*Note: data subscribers are not allowed to disclose the names of entities on the
restricted parties list as per U.S. Customs regulations.
Imports vs. Exports
There are two primary reasons to note the difference between import data and export
data:
1) The level of transparency into the parties involved in the transaction (as
previously noted). Access to both “house” and “master” bills of lading provide
more information regarding the parties involved in the transaction whether they
be the US shipper, foreign supplier, financial institution involved, etc. Also
important to note, due to US government regulations export documentation only
includes the US exporter and not the party receiving the cargo. On US imports
we have access to both foreign supplier and US buyer.
2) US import data are more current than export data due to the nature of the filing
process. Documentation for imports is required to be filed prior to calling the port
where, for exports, the documentation can be filed after the export occurs.
Import documentation is also filed via EDI where export bills of lading are still
mostly filed via emailed PDF or physically on-site at the port location and need to
be collected manually.

IHS Markit: Maritime & Trade – Company Profiles Research
Copyright 2017 © IHS Markit Ltd. All rights reserved. | 11
Data Coverage
The table below outlines the percentage of coverage for the Russell 3000. The matches
include companies that have physically shipped cargo in or out of the United States
within the past 10 years.
% Russell 3000
Total Matches 43%
Matches with over 50 Shipments 24%
Matches with over 100 Shipments 23%
*Note: MTONs on secondary vertical axis
Description of 2013 Automation Change
Starting in Q3 2013 the business rolled out a mostly automated system to ingest and
process all data. This is important to note for a few reasons, primarily because it
removed the reliance on manual intervention when processing the data, improving data
quality. For example, a quality check was put in place to account for weights that were
filed incorrectly on bill of lading documentation. Additional reference data is now used
that leverages the dead weight tonnage of a vessel to cap any weight filed that may
exceed that limit. Improved quality checks such as this have led to less volatility in data
output.

IHS Markit: Maritime & Trade – Company Profiles Research
Copyright 2017 © IHS Markit Ltd. All rights reserved. | 12
Sector coverage
The data table below depicts the shipment volume for the Russell 3000 by sector ranked
by most shipments. Additional columns outline the percentage of overall volume for
each sector and how much of that sector has an entity of the US Customs “Restricted
Parties List”.
Sample Report
Below is a sample report that outlines aggregated TEU volume from 2016 over a weekly
time series. The complete report includes volume from 2007 to date and includes
additional fields such as industry, sector, metric tons, and shipments.
SECTOR
Total
Shipments
Sector % of
Volume
% of Sector
Restricted
Consumer Services 1,762,719 27.29% 75.1%
Capital Goods 1,143,620 17.70% 51.6%
Consumer Non-Durables 1,120,228 17.34% 18.4%
Basic Industries 1,021,439 15.81% 55.0%
Consumer Durables 512,179 7.93% 58.0%
Energy 238,867 3.70% 44.2%
Health Care 238,684 3.69% 55.9%
Transportation 132,893 2.06% 1.2%
Technology 120,905 1.87% 28.0%
Finance 84,771 1.31% 24.9%
Miscellaneous 54,976 0.85% 93.4%
Public Utilities 27,605 0.43% 48.2%
Utilities 810 0.01% 0.0%
Services 62 0.00% 0.0%
Healthcare 5 0.00% 0.0%
Grand Total 6,460,335 100% 51.7%
COMPANY
IHS MARKIT
TICKER EXCHANGE CUSIP ISIN W1 W2 W3 W4 W5 W6 W7
PROCTER & GAMBLE CO PG NYSE 742718109 US7427181091 856 707 656 601 734 748 629
GENERAL MOTORS CO GENMC NYSE 37045V100 US37045V1008 532 668 677 526 565 574 833
TYSON FOODS INC TSN NYSE 902494103 US9024941034 896 824 887 724 984 850 818
PRICESMART INC PRICEIN NASDAQ 741511109 US7415111092 795 675 632 673 699 642 559
C H ROBINSON WORLDWIDE CHRW NASDAQ 12541W209 US12541W2098 912 885 843 876 996 939 1,012
ARCHER DANIELS MIDLAND ADM NYSE 39483102 US0394831020 838 904 1,023 624 1,934 1,531 1,468
FORD MOTOR CO F NYSE 345370860 US3453708600 994 684 593 696 779 854 801
PIER 1 IMPORTS INC PIERIMP NYSE 720279108 US7202791080 278 50 154 192 102 190 159
UNDER ARMOUR CLASS A UARM NYSE 904311206 US9043112062 596 704 368 321 347 308 441
PILGRIMS PRIDE CORP CHX NASDAQ 72147K108 US72147K1088 215 305 306 188 287 277 235
MICHAEL KORS HLDGS LTD MICHKOR NYSE G60754101 VGG607541015 207 249 253 436 289 331 281
DELTA APPAREL INC DELTAPP AMEX 247368103 US2473681037 100 119 143 127 177 156 150
HARLEY DAVIDSON INC HDI NYSE 412822108 US4128221086 90 119 201 121 91 193 187
COMPANY SHIPMENT VOLUME - TEU'S BY WEEK
2016

IHS Markit: Maritime & Trade – Company Profiles Research
Copyright 2017 © IHS Markit Ltd. All rights reserved. | 13
Sales Forecasting Using import and export data can lead to better earnings forecasts. Using weekly data,
we analyzed the correlation of trailing twelve month import activity measured in twenty-
foot equivalent units (TEUS) representing the number of containers imported to US
ports. We show examples for both a single security as well as a sector. For each
example, we lag the import data by 10 days to adjust for any look-ahead bias in the
historical data.
Single Security example
Each company has a unique supply chain and sales distribution network. In some
instances, imports lag sales while in others, they tend to lead them. In the example
below, we show the correlation of the trailing twelve month imports and the trailing
twelve month reported sales numbers for a clothing and accessory retailer:
This is a strong example of a situation where having frequent access to import activity
would be highly relevant to tracking the company’s sales activity in higher frequency
than available from quarterly reports. This could be used as an early indicator of
potential risks to the business, or as a check against corporate guidance and sell-side
estimates.
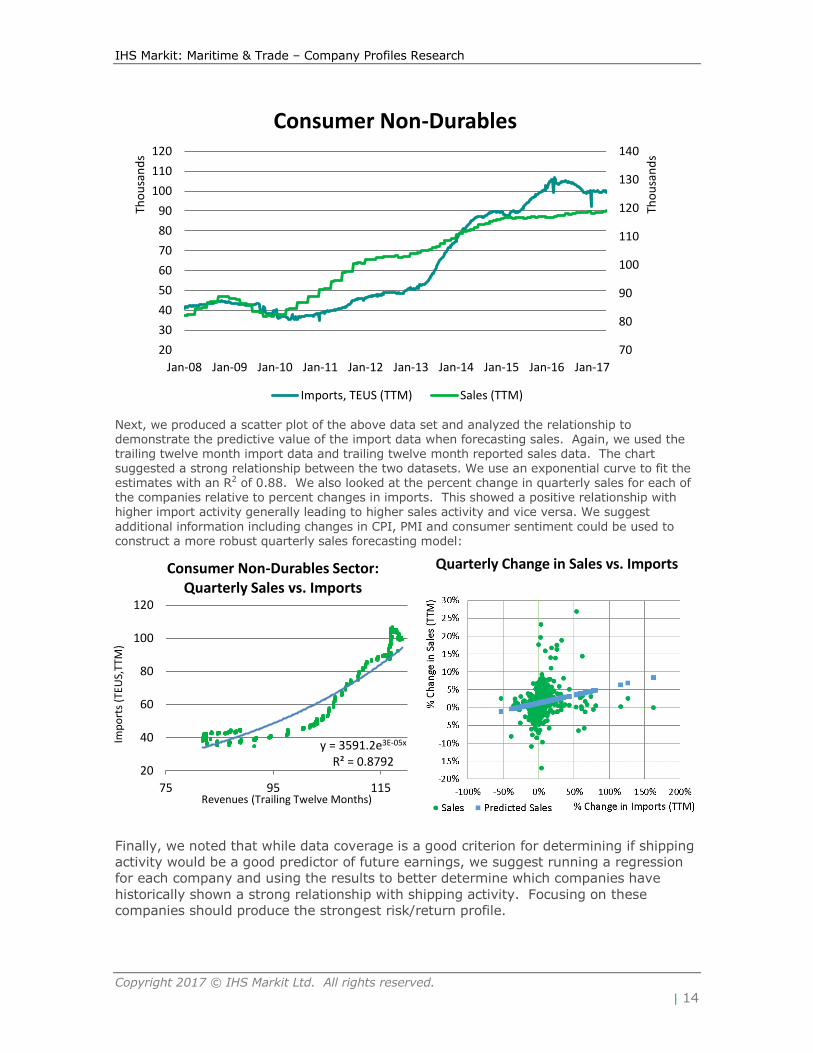
Sector Example
While information on a single security is helpful, we also analyzed the information at the
sector level. Here, we took the sum of the trailing twelve month sales figures for the
top 20 Consumer Non-Durable companies that demonstrated the highest overall
coverage in import data for the past ten years. We noted a correlation of 0.92 between
the import data and the sales data for the twenty companies analyzed. The results are
shown in the next chart:
1
1.5
2
2.5
3
3.5
4
4.5
5
0
2
4
6
8
10
12
14
Sep
-12
De
c-1
2
Mar
-13
Jun
-13
Sep
-13
De
c-1
3
Mar
-14
Jun
-14
Sep
-14
De
c-1
4
Mar
-15
Jun
-15
Sep
-15
De
c-1
5
Mar
-16
Jun
-16
Sep
-16
De
c-1
6
Mar
-17
Tho
usa
nd
s
Tho
usa
nd
s
Michael Kors
Import TEUS (TTM) Sales (TTM)
IHS Markit: Maritime & Trade – Company Profiles Research
Copyright 2017 © IHS Markit Ltd. All rights reserved. | 14
Next, we produced a scatter plot of the above data set and analyzed the relationship to demonstrate the predictive value of the import data when forecasting sales. Again, we used the trailing twelve month import data and trailing twelve month reported sales data. The chart suggested a strong relationship between the two datasets. We use an exponential curve to fit the estimates with an R2 of 0.88. We also looked at the percent change in quarterly sales for each of the companies relative to percent changes in imports. This showed a positive relationship with higher import activity generally leading to higher sales activity and vice versa. We suggest
additional information including changes in CPI, PMI and consumer sentiment could be used to construct a more robust quarterly sales forecasting model:
Finally, we noted that while data coverage is a good criterion for determining if shipping
activity would be a good predictor of future earnings, we suggest running a regression
for each company and using the results to better determine which companies have
historically shown a strong relationship with shipping activity. Focusing on these
companies should produce the strongest risk/return profile.
70
80
90
100
110
120
130
140
20
30
40
50
60
70
80
90
100
110
120
Jan-08 Jan-09 Jan-10 Jan-11 Jan-12 Jan-13 Jan-14 Jan-15 Jan-16 Jan-17
Tho
usa
nd
s
Tho
usa
nd
s Consumer Non-Durables
Imports, TEUS (TTM) Sales (TTM)
y = 3591.2e3E-05x R² = 0.8792
20
40
60
80
100
120
75 95 115
Imp
ort
s (T
EUS,
TTM
)
Revenues (Trailing Twelve Months)
Consumer Non-Durables Sector: Quarterly Sales vs. Imports
Quarterly Change in Sales vs. Imports

IHS Markit: Maritime & Trade – Company Profiles Research
Copyright 2017 © IHS Markit Ltd. All rights reserved. | 15
Long/Short Earnings Strategy
Strategy Description
The predictive value in forecasting earnings was described in the previous section. In
this section, we construct a strategy that buys shares of companies with increasing
shipping activity and shorts the stock of companies with decreasing shipping activity.
We then compared the results of our longs and shorts each month.
To identify companies with the largest changes in shipping activity, we rank securities
each month using the change in quarterly imports and exports using the TEUS
measurement (twenty foot equivalent units, a standard measure for a container) and
the shipping volumes as measured by the number of bills.
To avoid look-ahead bias, we lag the import data by 10 days and the export data by 35
days to account for the longer time it takes to certify export data due to the manual
process of collecting and analysing bill information.
The paper uses the current members of the Russell 3000 and will therefore suffer from
survivorship bias as additional work is needed to map delisted and merged securities to
the Maritime & Trade database. This will lead to outperformance of the universe relative
to an historical benchmark. However, the difference in annual returns between the long
and short portfolios will provide insight into the relative performance of companies with
increasing shipping activity compared to decreasing.
Calculating trailing twelve month growth rates
To adjust for seasonality in the data, we compute a trailing twelve month measurement
of shipping activity and calculate a quarterly growth rate each month. We limit the
analysis to companies with at least 15 months of trailing activity.
Computing trailing twelve month growth for each quarter:
This approach was used both for its simplicity and to smooth out volatility in the data
that may be observed when calculating year-over-year growth (Q1 this year compared
to Q1 in the prior year, for example). Other sophisticated statistical procedures may be
useful to identify or adjust for seasonality in the data, but this approach is easy to
replicate and achieves the goal of comparing the growth in shipping activity on a quarter
by quarter basis.
January to December shipping activity
April to March shipping activity

IHS Markit: Maritime & Trade – Company Profiles Research
Copyright 2017 © IHS Markit Ltd. All rights reserved. | 16
Filtering the data
While some data sources may be useful for evaluating all listed companies (for example,
P/E ratio or price momentum), shipping activity will be most useful for companies that
have significant shipping activity and operate in sectors where shipping activity may be
a good indicator of a company’s overall economic activity.
To focus the research on companies most likely to produce strong investment signals
from shipping activity, we exclude companies in the Finance and Private Utilities sectors.
When evaluating the import data, we also limit the analysis to companies with an
average of 75 shipments per quarter for the prior 4 quarters. This focused the research
on larger companies that are likely to be more liquid, and also removed companies with
inconsistent shipping activity.
Due to the lower export activity, we decreased the minimum shipping requirement to 25
shipments per quarter for the prior 4 quarters. We noted strong performance generally
in the export data due to the difficulty in acquiring accurate and complete data. This is
one of the advantages of the IHS Markit Maritime & Trade data, as their process
involves a number of quality checks and manual processes to increase both the
accuracy and coverage of available data.
The filtered universe yielded approximately 150-200 companies per quarter and
approximately 30-40 longs and shorts each quarter. Alternative filtering approaches
including using information from public filings or using historical correlations between
shipping activity and earnings may increase overall coverage and returns. For the
purpose of this paper, we sought to establish a base case that was easy for clients to
replicate by using the minimum number of shipments each quarter.
Limiting the universe by the number of shipments should also decrease the number of
restricted companies that are included in the analysis. Additional work needs to be
done to fully remove these effects, however, and researchers should be aware of this.
Finally, we limited the analysis period from 2010 to 2017 using trailing data from Q4
2008 onwards. While the data is available from 2007, we wanted to limit any bias
introduced from activity in prior economic regimes including the global financial crisis.
Performance during the crisis was positive in general, but introduced additional
volatility. Limiting the timeframe also limited some of the survivorship bias that would
have been introduced in 2008.
Focusing on Earnings
Next, we limit the analysis to companies reporting earnings in the current month. We
use the lagged data that would have been available at the beginning of the month and
assume a holding period of one month and include any dividends received.
Unlike a traditional quantitative strategy, this approach only trades when a company is
expected to report earnings in the current month. This limits the number of companies
in each portfolio (quintile) in any given month.
The returns may also be stronger for more nimble traders who trade mid-month and are
able to optimize the timing for the maximum amount of data available prior to earnings.

IHS Markit: Maritime & Trade – Company Profiles Research
Copyright 2017 © IHS Markit Ltd. All rights reserved. | 17
However, for easier comparison of returns, we assume all trades occurred at the
beginning of the month using the data that would have been certified at that time (10
day lag for imports, 35 day lag for exports).
Calculating Monthly Quintile Ranks
At the beginning of each month, companies reporting earnings in the current month
were ranked from 1-100 using either the number of containers imported over the
quarter (TEUS) or the number of shipments exported. These percentile ranks are then
converted into quintiles (ranks 1-5) ranked by the change in shipping activity as
measured by the trailing twelve month activity at the beginning of the month compared
to the trailing twelve month activity calculated in the previous quarter.
An additional average shipping activity rank was constructed to increase coverage as
well as provide signals from both import and export activity. This was calculated as the
simple average percentile rank of both the import and export signals to create a new
percentile rank that was then bucketed into quintiles (ranks 1-5).
The top 20% of companies are ranked 5, while the worst 20% of companies as
measured by the change in shipping activity are ranked 1. If a company was not
reporting earnings in the current month or did not meet the minimum shipping
requirements (average 75 shipments per quarter for imports), the company was not
given a rank in that month.
Quintile Performance
Monthly Performance by Quintile, Jan 2010 to April 2017:
The top ranked quintile (Q5) produced an average monthly return of 2%. This was in
contrast to the worst ranked quintile (Q1) that produced an average monthly return of
1.3%. This suggests that companies with increasing quarterly shipping volumes tended
to outperform companies with decreasing shipping volumes during the month when
they reported earnings.
1.28%
1.74%
1.47%
2.27%
1.92%
0.00%
0.50%
1.00%
1.50%
2.00%
2.50%
1M Total Returns
Imports - TEUS
Q1 Q2 Q3 Q4 Q5

IHS Markit: Maritime & Trade – Company Profiles Research
Copyright 2017 © IHS Markit Ltd. All rights reserved. | 18
Monthly Performance by Quintile, Jan 2010 to April 2017:
We note similar performance for the export data with the first quintile generally
underperforming the last quintile, showing the average outperformance of companies
with increasing quarterly shipping activity and the relative underperformance of
companies with decreasing shipping activity.
Import/Export Composite Signal
Next, we combine the import and export ranks to create an average rank. The
correlation of the ranks for the two datasets was approximately 0.70, and there was
generally more import data available than export. This approach improved both overall
returns and coverage:
Monthly Performance by Quintile, Jan 2010 to April 2017:
The top quintile outperformed the bottom quintile by 100 bps per month for the
companies analyzed. As will be seen in the next section, this resulted in strong
performance for the long/short market-neutral strategy.
1.57%
1.93% 2.10%
1.21%
2.28%
0.00%
0.50%
1.00%
1.50%
2.00%
2.50%
1M Total Returns
Exports - Shipments
Q1 Q2 Q3 Q4 Q5
1.33%
2.05%
1.69% 1.64%
2.33%
0.00%
0.50%
1.00%
1.50%
2.00%
2.50%
1M Total Returns
Combined - Exports & Imports
Q1 Q2 Q3 Q4 Q5

IHS Markit: Maritime & Trade – Company Profiles Research
Copyright 2017 © IHS Markit Ltd. All rights reserved. | 19
Performance by Month
Quintile 1 2 3 4 5 L/S (Q5-Q1)
GeoMean 1.28% 1.74% 1.47% 2.27% 1.92% 0.54%
CAGR 16.48% 23.06% 19.16% 30.91% 25.70% 6.71%
StDev 0.20 0.24 0.20 0.25 0.24 0.20
IR 0.83 0.97 0.98 1.22 1.09 0.33
Max Down -13.89% -18.83% -10.89% -14.72% -16.32% -12.28%
The import data was very informative, and produced an average long/short return of
nearly 7% per year. The lowest ranked stocks (Q1) significantly underperformed all of
the other stocks, demonstrating the value of import activity when forecasting one-
month forward returns.
0
100
200
300
400
500
600
700
800
Jan
-10
May
-10
Sep
-10
Jan
-11
May
-11
Sep
-11
Jan
-12
May
-12
Sep
-12
Jan
-13
May
-13
Sep
-13
Jan
-14
May
-14
Sep
-14
Jan
-15
May
-15
Sep
-15
Jan
-16
May
-16
Sep
-16
Jan
-17
May
-17
Imports - TEUS
Q1 Q2 Q3 Q4 Q5 L/S

IHS Markit: Maritime & Trade – Company Profiles Research
Copyright 2017 © IHS Markit Ltd. All rights reserved. | 20
Quintile 1 2 3 4 5 L/S (Q5-Q1)
GeoMean 1.57% 1.93% 2.10% 1.21% 2.28% 0.56%
CAGR 20.58% 25.77% 28.33% 15.48% 31.12% 6.91%
StDev 0.20 0.21 0.24 0.23 0.25 0.25
IR 1.02 1.23 1.21 0.68 1.24 0.28
Max Down -9.86% -13.01% -20.64% -18.25% -13.59% -13.88%
Similar to the import data, the export data produced strong performance for the top
ranked stocks and demonstrated underperformance for the lower ranked stocks. The
long/short returns were higher, with an average annual return of 7%, but with slightly
higher volatility than the import data.
0
100
200
300
400
500
600
700
800Ja
n-1
0
May
-10
Sep
-10
Jan
-11
May
-11
Sep
-11
Jan
-12
May
-12
Sep
-12
Jan
-13
May
-13
Sep
-13
Jan
-14
May
-14
Sep
-14
Jan
-15
May
-15
Sep
-15
Jan
-16
May
-16
Sep
-16
Jan
-17
May
-17
Export - Shipments
Q1 Q2 Q3 Q4 Q5 L/S

IHS Markit: Maritime & Trade – Company Profiles Research
Copyright 2017 © IHS Markit Ltd. All rights reserved. | 21
Quintile 1 2 3 4 5 L/S (Q5-Q1)
GeoMean 1.33% 2.05% 1.69% 1.64% 2.33% 0.87%
CAGR 17.13% 27.53% 22.25% 21.59% 31.77% 10.98%
StDev 0.20 0.19 0.21 0.23 0.22 0.19
IR 0.85 1.49 1.08 0.95 1.48 0.57
Max Down -13.89% -7.39% -9.79% -16.49% -10.95% -12.67%
The combined strategy produced the strongest returns, with an average return of 11%
for the long/short portfolio produced with relatively low volatility in returns resulting in
an information ratio of 0.57. This approach was the most robust, as it included
information from both the import and export data.
0
100
200
300
400
500
600
700
800Ja
n-1
0
May
-10
Sep
-10
Jan
-11
May
-11
Sep
-11
Jan
-12
May
-12
Sep
-12
Jan
-13
May
-13
Sep
-13
Jan
-14
May
-14
Sep
-14
Jan
-15
May
-15
Sep
-15
Jan
-16
May
-16
Sep
-16
Jan
-17
May
-17
Combined - Imports & Exports
Q1 Q2 Q3 Q4 Q5 L/S

IHS Markit: Maritime & Trade – Company Profiles Research
Copyright 2017 © IHS Markit Ltd. All rights reserved. | 22
Conclusion In this paper, we introduced the Maritime & Trade data and described the data fields
available, collection method, historical data and how the data has been mapped to
individual securities.
Next, we analyzed the import data and demonstrated how the data may be used to
improve earnings forecasts. We then created an aggregate metric for the Consumer
Non-Durables sector and noted the strong correlation with trailing twelve month
corporate sales.
Finally, we evaluated the performance of a long/short investment strategy that bought
shares of companies with increasing quarterly shipments and shorted companies with
decreasing shipping activity. We then combined data from both imports and exports
data to produce a new composite shipping signal.
The strategy produced an average annual return for a long/short market-neutral
strategy of 11% with an information ratio of 0.57 (returns/volatility).
We suggested areas for future research including constructing security-specific
company earnings models using the Maritime & Trade data, mapping the historical
data to delisted or merged securities to avoid survivorship bias and developing
algorithms to exclude companies from the analysis where data is likely restricted.

IHS Markit: Maritime & Trade – Company Profiles Research
Copyright 2017 © IHS Markit Ltd. All rights reserved. | 23
Appendix
Top Securities for Q1 2017 (February – April)
Long Portfolio (Q5): Company Quintile 5 (top) 1M Total Return
ACUITY BRANDS INC 5 -13.61
ADVANCE AUTO PARTS INC 5 -4.55
AES CORP 5 1.58
ALLISON TRANSMISSION 5 2.59
BAKER HUGHES INC 5 -0.75
BOISE CASCADE COMPANY 5 10.87
CABOT MICROELECTRONICS 5 2.27
CHILDRENS PLACE INC 5 20.05
CONSTELLATION BRANDS 5 6.46
DARLING INGREDIENTS INC 5 15.73
DOLLAR GENERAL CORP 5 -4.64
DOMTAR CORPORATION 5 -12.66
ENPRO INDUSTRIES INC 5 -3.27
FERRO CORP 5 10.14
ICU MEDICAL INC 5 6.75
ILLINOIS TOOL WORKS INC 5 4.24
INTERFACE INC 5 7.29
INTL FLAVORS & FRAGRANCE 5 6.06
INVENTURE FOODS INC 5 -16.76
JAKKS PACIFIC INC 5 4.90

IHS Markit: Maritime & Trade – Company Profiles Research
Copyright 2017 © IHS Markit Ltd. All rights reserved. | 24
KROGER CO 5 -12.55
MARTIN MARIETTA MTLS 5 -5.54
MEAD JOHNSON NUTRITION 5 -0.40
MOHAWK INDUSTRIES INC 5 2.31
PARKER HANNIFIN CORP 5 0.30
PILGRIMS PRIDE CORP 5 7.88
RESTORATION HARDWARE 5 48.27
SANMINA CORPORATION 5 -8.25
SKECHERS USA INC 5 -8.01
SUPERVALU INC 5 6.22
TARGET CORP 5 -9.10
THERMO FISHER SCIENTIFIC 5 7.64
TJX COMPANIES INC 5 0.33
TRACTOR SUPPLY CO 5 -10.24
XPO LOGISTICS INC 5 12.48

IHS Markit: Maritime & Trade – Company Profiles Research
Copyright 2017 © IHS Markit Ltd. All rights reserved. | 25
Short Portfolio (Q1):
Company Quintile 1 (bottom) 1M Total Return
AGCO CORP 1 1.90
ARMSTRONG WORLD INDS INC 1 21.87
AVERY DENNISON CORP 1 3.24
AVON PRODUCTS INC 1 -24.35
BOSTON BEER INC 1 1.94
BRIGGS & STRATTON CO 1 11.31
BUILD A BEAR WORKSHOP 1 -24.26
CALGON CARBON CORP 1 -12.65
COCA COLA BOTTLING 1 18.21
DUNKIN BRANDS GROUP INC 1 6.20
EASTMAN CHEMICAL CO 1 -1.30
EXXON MOBIL CORP 1 -0.44
FMC TECHNOLOGIES INC 1 -16.47
FORD MOTOR CO 1 -0.17
GRAPHIC PACKAGING HOLDING 1 5.22
HORMEL FOODS CORP 1 -2.13
INVACARE CORP 1 3.91
JABIL CIRCUIT INC 1 11.40
JOHNSON & JOHNSON 1 -0.87
KELLOGG CO 1 2.22
LINCOLN ELECTRIC HOLDINGS 1 2.50
MCCORMICK & CO INC 1 -1.89

IHS Markit: Maritime & Trade – Company Profiles Research
Copyright 2017 © IHS Markit Ltd. All rights reserved. | 26
OIL DRI CORP OF AMERICA 1 8.79
ROSS STORES INC 1 1.68
SCHLUMBERGER LTD 1 -7.06
SCHNITZER STEEL INDUSTRIES 1 -8.47
SONOCO PRODUCTS CO 1 -1.30
STANLEY BLACK & DECKER 1 2.47
STARBUCKS CORP 1 2.86
TESLA MOTORS INC 1 0.10
WHIRLPOOL CORP 1 8.38
WILLIAMS SONOMA INC 1 6.52

IHS Markit: Maritime & Trade – Company Profiles Research
Copyright 2017 © IHS Markit Ltd. All rights reserved. | 27
Legal Disclaimer
Although IHS Markit has made every effort to ensure the information and data herein are correct, nevertheless no guarantee is given as to their accuracy or completeness. All opinions, views and estimates expressed herein are those of IHS Markit on the date it was prepared and are subject to
change without notice; however no such opinions, views or estimates constitute legal, investment or other advice. You must therefore seek independent legal, investment or other appropriate advice from a
suitably qualified and/or authorised and regulated adviser prior to making any legal investment or other decision. This material is intended for information purposes only and is not intended as an offer or recommendation to buy, sell or otherwise deal in securities.

About IHS Markit
IHS Markit (Nasdaq: INFO) is a world leader in critical
information, analytics and solutions for the major industries
and markets that drive economies worldwide. The company
delivers next-generation information, analytics and
solutions to customers in business, finance and
government, improving their operational efficiency and
providing deep insights that lead to well-informed,
confident decisions. IHS Markit has more than 50,000 key
business and government customers, including 85 percent
of the Fortune Global 500 and the world’s leading financial
institutions. Headquartered in London, IHS Markit is
committed to sustainable, profitable growth.
CUSTOMER CARE AMERICAS
T +1 212 931 4900
CUSTOMER CARE EUROPE, MIDDLE EAST, AFRICA
T +44 20 7260 2000
CUSTOMER CARE ASIA PACIFIC
T +65 6922 4200
ihs.com/industry/maritime.html
IHS Markit makes no warranty, expressed or implied, as to accuracy, completeness or timeliness, or as to the results to be obtained by use of the products and services described herein, and shall not in any way be liable for any inaccuracies, errors or omissions therein. IHS Markit is a registered trademark of IHS Markit Ltd and/ or one of its group companies. All other company and product names may be trademarks of their respective owners © 2017 IHS Markit. All rights reserved.
ihsmarkit.com