U.S. Banking Deregulation, Small Businesses, and ...bsorense/DOS_JF2007.pdf · Effects of...
39
THE JOURNAL OF FINANCE • VOL. LXII, NO. 6 • DECEMBER 2007 U.S. Banking Deregulation, Small Businesses, and Interstate Insurance of Personal Income YULIYA DEMYANYK, CHARLOTTE OSTERGAARD, and BENT E. SØRENSEN ∗ ABSTRACT We estimate the effects of deregulation of U.S. banking restrictions on interstate per- sonal income insurance for the period 1970 to 2001. Interstate income insurance occurs when personal income reacts less than one-to-one to state-specific output shocks. We find that insurance improved after banking deregulation, with a larger effect in states where small businesses are more important and on proprietors’ income than on other components of personal income. Our explanation centers on the role of banks as a prime source of small business finance and on the close intertwining of the personal and business finances of small business owners. SINCE THE 1970S, THE STRUCTURE OF THE U.S. banking industry has changed con- siderably following the deregulation of restrictions on branching and interstate banking. The ensuing wave of consolidation has increased the average bank’s size and allowed banks to expand into new geographical markets by operat- ing larger branch networks or bank holding companies. Because banks play a central role in the allocation of capital in the economy and are the prime source of finance to small businesses, we examine if these changes in bank market structure have had real effects for small business owners. 1 In partic- ular, we examine whether interstate personal income insurance is higher af- ter deregulation, where by income insurance, we refer to the extent to which, ∗ Yuliya Demyanyk is at the Federal Reserve Bank of St. Louis. Charlotte Ostergaard is at the Norwegian School of Management and Norges Bank. Bent Sørensen is at the University of Houston and the CEPR. We thank an anonymous referee for very constructive comments. For further comments and discussions we thank the Editor, an anonymous Associate Editor, Allen Berger, Arnoud Boot, Ralf Elsas, Dmytro Holod, Joe Mason, Mitchell Petersen, Richard Rosen, and Stijn Van Nieuwerburgh, and seminar and conference participants at the University of Vienna, the University of Zurich, the 2004 European Finance Association Meetings in Maastricht, the 2004 University of Houston/Dallas Federal Reserve conference “International Financial Integration and Risk Sharing” in Houston, the 2005 CFS conference “Risk Transfer Between (Re-) Insurers, Banks, and Markets” in Frankfurt, the 2005 Econometric Society Meetings in Philadelphia, and the 2006 FIRS Conference on Banking, Corporate Finance, and Intermediation in Shanghai. We thank Pat Reilich and Lindsay Ludwig at the FDIC for help with Call Report data and Philip Strahan for sharing his measures of bank integration. Sørensen thanks Norges Bank for its hospitality. The views expressed in this paper are those of the individual authors and do not necessarily ref lect the position of the Federal Reserve Bank of St. Louis or the Federal Reserve System. 1 We define small businesses as those having less than 100 employees. Based upon this definition, small businesses comprise an important part of the economy. In the average state, businesses with less than 100 employees made up 58% of total employment in 1978. (The Small Business Administration defines small businesses as having less than 500 full-time equivalent employees.) 2763
Transcript of U.S. Banking Deregulation, Small Businesses, and ...bsorense/DOS_JF2007.pdf · Effects of...

THE JOURNAL OF FINANCE • VOL. LXII, NO. 6 • DECEMBER 2007
U.S. Banking Deregulation, Small Businesses,and Interstate Insurance of Personal Income
YULIYA DEMYANYK, CHARLOTTE OSTERGAARD, and BENT E. SØRENSEN∗
ABSTRACT
We estimate the effects of deregulation of U.S. banking restrictions on interstate per-sonal income insurance for the period 1970 to 2001. Interstate income insurance occurswhen personal income reacts less than one-to-one to state-specific output shocks. Wefind that insurance improved after banking deregulation, with a larger effect in stateswhere small businesses are more important and on proprietors’ income than on othercomponents of personal income. Our explanation centers on the role of banks as aprime source of small business finance and on the close intertwining of the personaland business finances of small business owners.
SINCE THE 1970S, THE STRUCTURE OF THE U.S. banking industry has changed con-siderably following the deregulation of restrictions on branching and interstatebanking. The ensuing wave of consolidation has increased the average bank’ssize and allowed banks to expand into new geographical markets by operat-ing larger branch networks or bank holding companies. Because banks playa central role in the allocation of capital in the economy and are the primesource of finance to small businesses, we examine if these changes in bankmarket structure have had real effects for small business owners.1 In partic-ular, we examine whether interstate personal income insurance is higher af-ter deregulation, where by income insurance, we refer to the extent to which,
∗Yuliya Demyanyk is at the Federal Reserve Bank of St. Louis. Charlotte Ostergaard is atthe Norwegian School of Management and Norges Bank. Bent Sørensen is at the University ofHouston and the CEPR. We thank an anonymous referee for very constructive comments. Forfurther comments and discussions we thank the Editor, an anonymous Associate Editor, AllenBerger, Arnoud Boot, Ralf Elsas, Dmytro Holod, Joe Mason, Mitchell Petersen, Richard Rosen, andStijn Van Nieuwerburgh, and seminar and conference participants at the University of Vienna,the University of Zurich, the 2004 European Finance Association Meetings in Maastricht, the 2004University of Houston/Dallas Federal Reserve conference “International Financial Integration andRisk Sharing” in Houston, the 2005 CFS conference “Risk Transfer Between (Re-) Insurers, Banks,and Markets” in Frankfurt, the 2005 Econometric Society Meetings in Philadelphia, and the 2006FIRS Conference on Banking, Corporate Finance, and Intermediation in Shanghai. We thank PatReilich and Lindsay Ludwig at the FDIC for help with Call Report data and Philip Strahan forsharing his measures of bank integration. Sørensen thanks Norges Bank for its hospitality. Theviews expressed in this paper are those of the individual authors and do not necessarily reflect theposition of the Federal Reserve Bank of St. Louis or the Federal Reserve System.
1 We define small businesses as those having less than 100 employees. Based upon this definition,small businesses comprise an important part of the economy. In the average state, businesseswith less than 100 employees made up 58% of total employment in 1978. (The Small BusinessAdministration defines small businesses as having less than 500 full-time equivalent employees.)
2763

2764 The Journal of Finance
in a given state, state-specific personal income fluctuates with state-specificshocks to output. In states that are financially integrated with other states,agents may trade claims on output (e.g., equity or direct investments) acrossstate borders, sharing state-specific risks with residents of other states andhence partly insulating personal income from fluctuations in state-level out-put. However, through transactions with intermediaries such as banks, agentsmay also share output risks indirectly as the banks assume some of the riskand then share this risk with agents in other states. We therefore posit thatinterstate income insurance may have improved with deregulation as bankingderegulation has improved integration of previously separated bank markets.
We estimate the effect of banking deregulation on income insurance using an-nual state-level data for the period 1970 to 2001. Our primary findings are asfollows. First, we establish that banking deregulation has a positive effect on in-come insurance overall using four alternative measures of deregulation—twomeasures of intrastate banking deregulation and two measures of interstatebanking deregulation. Based on regressions that do not control for other po-tential determinants of risk sharing, the marginal effect of deregulation is inexcess of 10 percentage points, which means that a state-specific output shockis smoothed by 10% or more on average after deregulation. Second, we findthat the impact of deregulation is larger in states in which small businessesare more prevalent: In states with many small businesses, the improvement inincome insurance is on the order of 20 percentage points. Our results suggestthat bank consolidation within deregulated states is an important driver of thedisproportionately large effect for small businesses. When we explore whetherother contemporaneous developments in financial markets may explain the es-timated increase in risk sharing, we find that the higher impact of deregulationon risk sharing in states with more small businesses continues to hold. Finally,we provide additional evidence for our hypothesis by showing that the impactof banking reform is considerably larger for proprietors’ income than for othercomponents of personal income.
The informational opaqueness of small businesses without an establishedreputation for quality prevents them from raising arm’s-length finance in pub-lic markets. However, banks can mitigate such informational asymmetriesthrough repeated interaction and monitoring (Diamond (1984, 1991) and Rajan(1992)). When a bank provides finance to a firm, it shares risk with the firm’sowners by bearing a part of the firm’s output risk; in contrast, when a businessis entirely owner-financed, the owner bears all output risk himself and can-not insure his personal income from shocks to his business. This is consistentwith Agronin (2003), who finds that income insurance is lower in states whereproprietors’ income makes up a larger share of personal income. We documentthat states with many small businesses exhibit a lower average level of incomeinsurance.
The banking reforms under study consist mainly of two types of deregulation,namely, intrastate deregulation, which allows banks to branch statewide, andinterstate deregulation, which allows the formation of multistate bank hold-ing companies. While this description may suggest that interstate deregulation

Effects of Deregulation of U.S. Banking 2765
should be the main determinant of interstate risk sharing, intrastate bankingderegulation may also affect risk sharing between states, if it allows for betterrisk sharing between small firms and their banks or among unaffiliated bankslocated in different states. We discuss these dimensions in turn.
Because intrastate banking deregulation has removed barriers to competitionamong banks, banking deregulation may have improved the insurance of per-sonal income by increasing the availability of small business finance, whetherto new or existing borrowers. Alternatively, banking deregulation may have al-tered banks’ pattern of lending, such that they allow small business owners tofurther the separation of their personal finances from those of their firm. Thislatter channel would point to the importance of bank–borrower relationshipsfor the efficiency of the capital allocation process. In a valuable bank–borrowerrelationship, the bank may have incentives to offer (self-enforcing) implicit con-tracts that facilitate insurance, for example, through the continued extension ofcredit during bad times (Allen and Gale (2000) and Boot (2000)). Each of thesetwo channels would work to lower the correlation between output and personalincome. Thus, intrastate banking deregulation is likely to be particularly rel-evant for small business lending. Intrastate mergers create larger banks thatare typically more integrated in national markets than small local banks. Forexample, a large bank has extensive nation-wide (indeed, world-wide) opera-tions compared to a small town community bank. Furthermore, banks sharethe risk with other banks and financial institutions by borrowing and lendingin national interbank and money markets, that is, banks may borrow and lendout-of-state in order to help stabilize income of small business owners.2 Hence,banking deregulation may affect income insurance without explicit multistatecross-ownership between banks.3
Along the interstate dimension, banking reform has affected interbank risksharing as a result of mergers and acquisitions across state borders and theformation of multistate bank holding companies that manage capital and liq-uidity at the consolidated level (Houston, James, and Marcus (1997)). Further,interstate banking deregulation had effects on the average size of banks withsimilar effects as those discussed for intrastate banking deregulation.
The disproportionate increase in income insurance that we find for stateswith many small businesses is striking. We conjecture that deregulation may
2 For example, banks in an agricultural state can stabilize income in that state by borrowing inthe face of adverse weather shocks.
3 Banking deregulation may have affected interstate income insurance in other ways that arenot necessarily related to small businesses. One channel may work through the capital income ofhouseholds. Personal income may be smoothed through households’ capital income if changes in thesize of bank organizations smooth income streams earned by owners of securities issued by banks.Banks are owned, perhaps indirectly, by individual stock holders who ultimately bear the risk of thebanks’ operations. When stockholders live out-of-state, this results in interstate income insurance.Alternatively, multistate bank organizations may disperse the effect of state-specific shocks to thebanking industry itself throughout the organization. For example, following losses in one state,layoffs and cost cuttings may be extended to subsidiaries and branches in other states. Further,if bank finance makes it easier for firms to raise external nonbank finance, banking deregulationmay have helped smooth dividends paid by such firms.
2766 The Journal of Finance
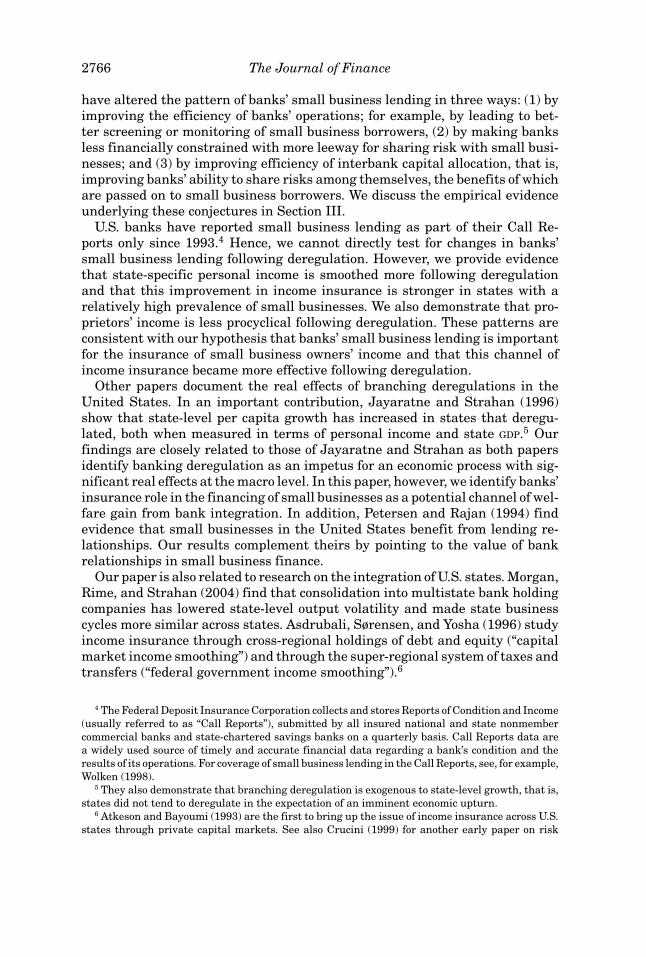
have altered the pattern of banks’ small business lending in three ways: (1) byimproving the efficiency of banks’ operations; for example, by leading to bet-ter screening or monitoring of small business borrowers, (2) by making banksless financially constrained with more leeway for sharing risk with small busi-nesses; and (3) by improving efficiency of interbank capital allocation, that is,improving banks’ ability to share risks among themselves, the benefits of whichare passed on to small business borrowers. We discuss the empirical evidenceunderlying these conjectures in Section III.
U.S. banks have reported small business lending as part of their Call Re-ports only since 1993.4 Hence, we cannot directly test for changes in banks’small business lending following deregulation. However, we provide evidencethat state-specific personal income is smoothed more following deregulationand that this improvement in income insurance is stronger in states with arelatively high prevalence of small businesses. We also demonstrate that pro-prietors’ income is less procyclical following deregulation. These patterns areconsistent with our hypothesis that banks’ small business lending is importantfor the insurance of small business owners’ income and that this channel ofincome insurance became more effective following deregulation.
Other papers document the real effects of branching deregulations in theUnited States. In an important contribution, Jayaratne and Strahan (1996)show that state-level per capita growth has increased in states that deregu-lated, both when measured in terms of personal income and state GDP.5 Ourfindings are closely related to those of Jayaratne and Strahan as both papersidentify banking deregulation as an impetus for an economic process with sig-nificant real effects at the macro level. In this paper, however, we identify banks’insurance role in the financing of small businesses as a potential channel of wel-fare gain from bank integration. In addition, Petersen and Rajan (1994) findevidence that small businesses in the United States benefit from lending re-lationships. Our results complement theirs by pointing to the value of bankrelationships in small business finance.
Our paper is also related to research on the integration of U.S. states. Morgan,Rime, and Strahan (2004) find that consolidation into multistate bank holdingcompanies has lowered state-level output volatility and made state businesscycles more similar across states. Asdrubali, Sørensen, and Yosha (1996) studyincome insurance through cross-regional holdings of debt and equity (“capitalmarket income smoothing”) and through the super-regional system of taxes andtransfers (“federal government income smoothing”).6
4 The Federal Deposit Insurance Corporation collects and stores Reports of Condition and Income(usually referred to as “Call Reports”), submitted by all insured national and state nonmembercommercial banks and state-chartered savings banks on a quarterly basis. Call Reports data area widely used source of timely and accurate financial data regarding a bank’s condition and theresults of its operations. For coverage of small business lending in the Call Reports, see, for example,Wolken (1998).
5 They also demonstrate that branching deregulation is exogenous to state-level growth, that is,states did not tend to deregulate in the expectation of an imminent economic upturn.
6 Atkeson and Bayoumi (1993) are the first to bring up the issue of income insurance across U.S.states through private capital markets. See also Crucini (1999) for another early paper on risk
Effects of Deregulation of U.S. Banking 2767
The rest of the paper is organized as follows. Section I discusses the premisesfor our hypothesis that the effect of banking deregulation on interstate incomeinsurance is particularly strong for small business owners. Section II brieflypresents the history of banking deregulation in the United States. Section IIIdiscusses in more detail the channels through which deregulation may affectthe insurance of state-specific personal income, and Section IV considers ro-bustness issues. Section V describes our data, Section VI presents our measureof interstate income insurance, and Section VII presents the empirical results.Section VIII concludes.
I. Small Business Finance and U.S. Evidence
Our hypothesis that personal income insurance has improved with bank-ing deregulation through its effects on banks’ small business lending buildson two fundamental observations: (1) Small firms depend heavily on bank-intermediated finance, and (2) the financial position of business owners isclosely intertwined with that of their businesses.7 In the following, we discussthese observations and their relation to our hypothesis.
It is well established empirically that bank-intermediated finance is one ofthe main sources of small business funding in the United States. For example,Berger and Udell (1998) present evidence from the 1993 National Survey ofSmall Business Finance (NSSBF), which demonstrates that small businessesrely heavily on commercial bank finance from their very first years. Accordingto the survey, bank debt constitutes 16% of total assets for “infant” firms (0 to 2years old), and 31% of total assets for “adolescent” firms (3 to 4 years old). Forolder firms, the ratio is 17% on average. This compares to total equity stakesof 48%, 39%, and 52%, respectively (Berger and Udell (1998), Table 1, p. 620).Overall, commercial bank debt is the most important external source of financefor small businesses.8
An important characteristic of small business finance is the intertwiningof business owners’ financial position with that of their businesses. Fundsprovided by the principal owner (mostly in the form of equity) are the mostimportant source of financial capital, amounting to 35% of all funding. Fur-ther, outside finance often has personal commitments attached. Avery, Bostic,and Samolyk (1999) report that of the small firms that have loans, 80% haveloans with personal commitments.9 Ang (1992) reports that about 40% of smallbusiness loans and 60% of loan dollars are guaranteed and/or secured by
sharing across U.S. states. Sala-i-Martin and Sachs (1992) suggest that the U.S. federal govern-ment provides substantial income insurance to states through procyclical taxes and countercyclicaltransfers. That paper, and many following it, focus on U.S. states as members of a successful cur-rency union (the United States) that should be studied as a model for the formation of currencyunions such as the European Monetary Union.
7 Ang (1992), Berger and Udell (1998), and Avery, Bostic, and Samolyk (1999).8 The most common form of small business debt supplied by commercial banks—constituting
56% of total small business debt—is that of lines of credit. The next most important loan types aremortgage and equipment loans, at 15% and 10%, respectively (Berger and Udell (1998)).
9 That is, loans with either personal collateral or a personal guarantee attached. In the case ofpersonal collateral, the creditor holds a prioritized claim on specific assets of the borrower and
2768 The Journal of Finance
personal assets. Berger and Udell (1998) find that 90% of commercial bankdebt is secured.
Note that the 1993 NSSBF also documents the importance of insider sourcesof funding, especially equity, other than the owner, such as family, friends, andother people involved in the business. Such equity is the second most importantsource of funding, constituting 13% of total assets (Berger and Udell (1998)).Trade credit is the third most important source of funding.
The above observations are consistent with the notion that agency conflictsrooted in asymmetries of information are severe for small businesses. As notedabove, the interpretation of our results centers on the dependency of smallbusinesses on bank-intermediated finance.10 It is precisely because the aver-age small business has no real substitutes for bank finance other than theowner’s own funds or funds raised from family and friends that part of theefficiency gains from banking deregulation are likely to work through smallbusinesses. Through the requirements of partial self-financing, collateral, andguarantees, and through monitoring and repeated interaction over time, banksmay mitigate problems of adverse selection and moral hazard.11
We conjecture that banking deregulation is likely to have improved personalincome insurance by increasing the availability of small business loans or byaltering the lending pattern of banks. Consider an entirely self-financed soleproprietorship. In this case, the small business owner bears all the firm’s out-put risk himself—shocks to the surplus created in the firm will be transferredone-to-one to the owner’s personal income. However, when the owner obtainsexternal finance, the linkage between his personal finances and those of thebusiness is relaxed and the covariation of personal income with output may fall.Banks may share risk with the owner when the business hits hard times by al-lowing the borrower to fall behind with payments of interest and installments,thereby avoiding initiation of formal bankruptcy procedures or liquidation ofassets.12 Banks may also share risk by absorbing part of the losses that resultwhen a business defaults. Furthermore, the availability of external finance mayhelp small business owners smooth their income to the extent that it facilitatesdiversification of the owners’ sources of income: External finance may facili-tate accumulation of savings outside the business; for example, in housing orfinancial investments, generating a stream of future income that is less thanperfectly correlated with the success of the business.
controls the use of the assets. A personal guarantee is a more general claim on personal wealththat places fewer restrictions on the guarantor’s use of his wealth. The figures are based on the1987 and 1993 NSSBF and the Survey of Consumer Finances.
10 Although venture and angel finance are substitutes for some small firms, the above studiesshow that in terms of magnitude, these sources do not represent a real alternative to bank financefor the average firm.
11 See, for example, Leland and Pyle (1977), Bester (1985), Besanko and Thakor (1987), andHolmstrom and Tirole (1997).
12 In a study of U.K. firms in distress, Franks and Sussman (2005) find that banks typicallyattempt to rescue firms rather than initiate immediate liquidation. However, banks often contractlending during distress. While the U.K. may differ from the United States due to differences inbankruptcy laws, this direct evidence is at least suggestive of the potential for such behavior in theUnited States.

Effects of Deregulation of U.S. Banking 2769
II. The History of U.S. Banking Deregulation
Banks’ ability to operate branch networks and holding company structureshas been subject to state legislation since the 1920s.13 Many states imposedrestrictions on these banking activities both within and across state borders.During the 1980s and 1990s, however, such restrictions were gradually liftedin almost all states.
Until the 1980s, most states imposed some form of intrastate branching re-strictions. Typically, these restrictions either completely prohibited branchingwithin the state or restricted the geographical area in which a bank could openbranches; for example, branching might be allowed in the county of the headoffice only. In 1985, statewide branching was limited in 26 states. Even in thesecond half of the 1990s, several states still maintained branch banking restric-tions.14
Branching restrictions took two main forms: The first was directed at the abil-ity of banks to branch through mergers and acquisitions, preventing a bank ora bank holding company from acquiring another bank and converting it into abranch. A bank holding company may establish a group of subsidiary banks asa substitute for a branching network, but with several drawbacks. Subsidiarybanks must operate separate boards and be individually capitalized, which re-stricts loan limits. Also, the holding company structure incurs certain admin-istrative costs associated with regulatory filing requirements (Amel and Liang(1992)). Thus, a branching network can realize economies of scale that a hold-ing company structure cannot.15 The second form of branch banking regulationsimposed limits on the opening of new (de novo) branches, protecting existingbanks from entry by outside banks.
Differences in states’ willingness to allow branch networks led to the develop-ment of very differently structured banking systems across states. For instance,while some states allowed only unit banking, other states permitted statewidebranching. Branching restrictions, especially on de novo branching, often tookthe form of home office protection laws, prohibiting a bank from establishinga branch in an area in which the principal (home) office of another bank waslocated without the written consent of that bank. Areas with home office protec-tion were typically small towns or rural areas with a population below a certainnumber.16 Such laws gave many small community banks home turf, shielding
13 The McFadden Act of 1927 essentially prohibited intrastate branching by subjecting thebranches of national banks to state authority. The Douglas Amendment to the Bank Holding com-pany Act of 1956 further restricted interstate expansion by barring bank holding companies fromacquisitions in another state unless specifically authorized by that state.
14 See Table I.15 In fact, several states also prohibited the formation of (intrastate) multi-bank holding compa-
nies during the first half of the sample. Except for Missouri all states had removed such prohibitionsby 1985.
16 For example, in Connecticut, home office protection applied to de novo branching but notto branching through mergers and acquisitions. In 1986, statewide branching was allowed onlyin towns with a population of 100,000 or more. In 1987, the limit was lowered to 60,000 andit was completely removed in 1988. In 1977, Minnesota permitted two detached facilities in themunicipality of the principal office or within 25 miles of the principal office, unless such location

2770 The Journal of Finance
them from competitive pressures. At the same time, banks’ inability to diver-sify their portfolios geographically created a close interdependency between thelocal economy and the health of local banks.
When states began relaxing branching restrictions, branching by mergersor acquisitions was often authorized earlier than de novo branching. In fact,as many as 10 states did not permit statewide de novo branching well intothe 1990s.17 Considerable consolidation therefore occurred—predominantlythrough mergers and acquisitions. Many bank holding companies jumped atthe opportunity to convert their organization into a branching network (e.g.,MacLaughlin (1995)), and hence the number of small community banks droppedsignificantly as they were attractive buy-out targets. At the beginning of oursample, the share of assets held by very small banks—banks with less than25 million 1982-dollars in assets—was 35%. At the end of our sample this frac-tion had dropped to 0.6%.18 As a result, banks’ average size increased. Increasedcompetitive pressure, geographic diversification, and scale economies on boththe loan and deposit side affected loan losses and the cost of capital, and inturn loan interest rates. Jayaratne and Strahan (1998) find that relaxation ofintrastate branching restrictions was a source of large improvements in the ef-ficiency of bank lending, allowing better run banks to capture a larger share oflocal markets. Low-cost banks grew faster than underperforming banks follow-ing deregulation, and state-level average loan losses and operating expensesfell.19 Large banks pursued branching aggressively but some community banksalso engaged in branching in order to stay competitive (Wirtz (2005)).
There is evidence that consolidation spurred new branching in local bankmarkets. Berger et al. (1999) demonstrate that mergers and acquisitions ex-plain 20% of subsequent de novo entry in metropolitan markets and 10% inrural markets, consistent with the suggestion that the reduction in small busi-ness lending due to consolidation has been replaced in part by lending of newentrants. For example, Wirtz (2005) reports that many smaller banks havebranched into the previously unbanked communities in the states of Montanaand North Dakota.
Interstate banking restrictions were also common in many states. Entry bybank holding companies chartered in other states was only gradually permittedby individual states during the 1980s. Maine was the first state to allow entry by
was in a municipality with a population less than 10,000 and different from that of the principaloffice, in which case written consent from incumbent banks was required. While the limit on thenumber of branches was later relaxed, the home office protection rule for municipalities of lessthan 10,000 population is still in place today.
17 Kroszner and Strahan (1999) analyze the determinants of bank deregulation and find thatstates with financially more unstable banks tended to deregulate earlier. Also, states with manysmall firms deregulated earlier, consistent with our hypothesis that deregulation-induced compe-tition may be particularly important for small firms.
18 Authors’ calculations from Call Report data.19 Jayaratne and Strahan show that efficiency gains were passed on to borrowers as banks’
average interest income per loan fell, finding only small statistically insignificant increases inbank profitability after deregulation.

Effects of Deregulation of U.S. Banking 2771
out-of-state bank holding companies in 1978. Typically, acquisitions by out-of-state bank holding companies were limited to banks from same-region statesand subject to reciprocity, with entry permitted only if the acquiring bank’shome state allowed entry by banks from the target state, although some stateswere open to nationwide entry. Reciprocity was often a regional phenomenonwith states in, say, the northeastern region of the United States allowing mu-tual entry. As in the case of branch banking, most states permitted entry onlyby mergers and acquisitions (as opposed to de novo) in the early phases ofderegulation.20
MacLaughlin (1995) documents that the deregulation of intrastate branchingrestrictions impacted market structure more quickly than the deregulation ofinterstate banking restrictions. However, banks’ responses to interstate dereg-ulations picked up considerable speed in the late 1980s, although bank holdingcompanies tended to expand intraregionally, rather than cross-regionally.
Interstate branching was finally permitted on a nationwide basis with theRiegle–Neal Interstate Banking and Branching Efficiency Act. This law becameeffective June 1997, although states had the opportunity to opt in at an earlierdate. Given the date of this act falls at the very end of our sample, we do notconsider interstate branching deregulation in our empirical analysis.
III. Channels of Improvements in Personal Income Insurance
Banking deregulation is likely to have improved interstate income insuranceby increasing the level of bank intermediated finance to small businesses orby changing the pattern of supply. In particular, improved integration of bankmarkets caused by changes in banks’ reach, organization, and size, is likely tohave affected banks’ costs and ability to share risks. In this section, we discussthe empirical evidence on which we base our conjecture that changes in thepattern of lending play an important role for the effect of deregulation on thesmoothing of personal income.
A. Geographical Diversification and Bank Efficiency
Geographical diversification improves banks’ ability to bear (idiosyncratic)credit risk. Diversified banks are likely to operate with fewer financial con-straints and are less sensitive to local recessions, increasing their ability toshare risk with their borrowers. Demsetz and Strahan (1997) show that betterdiversification in large bank holding companies permits operation with higherleverage and more business loans in the portfolio. This is also related to bank
20 For example, in 1987 Alabama allowed reciprocal entry by out-of-state bank holding companiesfrom the states of AR, DC, FL, GA, KY, LA, MD, MS, NC, SC, TN, VA, and WV. Acquired banks hadto be at least 5 years old and could not branch across county lines for 7 years after acquisition. Denovo entry was prohibited. Furthermore, acquiring holding companies had to hold at least 80% oftheir deposits in the region. In 1988, this group was expanded to include TX and, in 1995, Alabamaallowed national interstate banking on a nonreciprocal basis.

2772 The Journal of Finance
size: Larger banks facilitate income insurance through geographical diversifi-cation of their loan portfolios, whereas the lending behavior of smaller bankswill be more closely tied to the health of the local economy.
Deregulation is likely to have altered the lending behavior of banks if in-cumbent banks in previously protected markets were operating inefficientlyand deregulation permitted the entry of better managed banks. If enteringbanks were superior in the screening of potential borrowers’ prospects and lendto firms with higher net present value projects, more high-quality borrowerswould have been financed. Jayaratne and Strahan (1996) argue that averagebank efficiency improved after deregulation and show that losses on banks’ loanportfolios fell, suggesting that poorly operating banks were either absorbed orsqueezed out of the market.
B. Internal Capital Markets in Bank Holding Companies
Banks that belong to a multibank organization may establish internal capitalmarkets, reallocating capital among subsidiaries, and thereby share risks withborrowers at a lower cost. Houston and James (1998) show that unaffiliatedbanks are more cash-flow-constrained than banks affiliated with a holdingcompany. Ashcraft (2006) argues that banks affiliated with a holding companyhave better access to external funds, and further, that stand-alone banks facemore severe financial constraints than affiliated banks. As a consequence, instates where stand-alone banks have more market share, aggregate lendingis relatively more affected by monetary policy contractions. Thus, multistatebank holding companies may enjoy the largest benefits from the interaction ofgeographical diversification and internal markets.
C. Bank Size and Risk Sharing among Banks
There is reason to believe that bank size may be related to income insur-ance. Kashyap and Stein (2000) argue that small banks are at an informationaldisadvantage in wholesale markets compared to larger banks, which are lessopaque and better able to overcome problems of asymmetric information. Theyshow that small banks do not use uninsured funds to smooth the effect of mone-tary policy contractions.21 Ostergaard (2001) finds evidence that these frictionsare significant at the state level and that bank lending in states dominated bysmall banks is more closely tied to banks’ internal generation of capital. Thisimplies that larger banks may have an advantage in the sharing of risks withcounterparties in national money and capital markets. It also suggests thatlarger banks have greater flexibility in their transactions with small businessowners. A shift in the size distribution away from small community banks to-ward larger banks may therefore increase the scope for income insurance.
21 “Small banks” refers to those in the bottom 95% of the size distribution.

Effects of Deregulation of U.S. Banking 2773
D. Changes in the Supply of Credit to Small Businesses
An improvement in interstate income insurance would also be consistent witha general increase in the availability of small business finance following dereg-ulation, for example, because loans enable new investment or the accumulationof other assets, leading to greater cross-state ownership of claims. Call Reportdata on small business loans by U.S. banks do not exist prior to 1993 and weknow of no direct evidence on banks’ small business lending prior to this date.Jayaratne and Strahan (1996) study the effect of deregulation on total bankloan growth and find only weak positive effects. It appears that deregulationdid not shift the overall supply of loans significantly, although we know littleabout potential changes in portfolio composition.
Several studies use post-1993 data to address whether mergers and acqui-sitions affected the volume of small business lending. Their findings are pos-sibly informative about the effects of the reorganization that took place in the1980s.22 Generally, the evidence does not support the notion that small busi-ness lending contracted despite consolidation in the banking industry and thefact that larger banks typically carry fewer small business loans on their booksthan do smaller banks. On the other hand, there is little evidence to supportthe opposite conclusion, that small business lending tended to increase.
E. Competition and Lending Relationships
Consolidation in the banking industry altered competition between banksand, in turn, the costs and benefits to firms involved in banking relationships.Through the lending process, banks acquire information about borrowers. Aninformed bank can use its information monopoly to extract rent from the bor-rower (Sharpe (1990), Rajan (1992)). Competition between lenders limits thesustainability of implicit contracts and the sharing of intertemporal surplus be-tween borrowers and lenders as found by Petersen and Rajan (1995). However,Boot and Thakor (2000) argue that increased competition may induce banksto invest relatively more in relationships because the return on relationshiplending improves relative to the return on transaction lending. If consolida-tion lowered competition in deregulated states, it may have improved the valueof bank–borrower relationships and banks’ willingness to share risks. Alter-natively, if deregulation increased competition, relationships may have beenadversely affected.23 Whether deregulation had an impact on income insur-ance through changes in competition between banks is ultimately an empiricalquestion. Our results suggest that potentially detrimental effects on incomeinsurance, if they exist, are of second-order importance.
22 See Peek and Rosengren (1998), Strahan and Weston (1998), Goldberg and White (1998), andDeYoung (1998).
23 Considering the effect of interstate branching deregulations starting in 1994, Dick (2003)reports that concentration at the regional level increased, whereas concentration at the urban(MSA) level remained unchanged. See also the discussion in Black and Strahan (2002) on theeffect of competition on business creation.
2774 The Journal of Finance
IV. Alternative Explanations for the Increase in Income Insurance
In this section we examine alternative explanations for the increase in incomeinsurance that we document. In particular, we explore potential factors otherthan banking deregulation that may have helped improve the integration ofcapital markets.
A. Changes in Lending Technology
Petersen and Rajan (2002) document that the nature of small business lend-ing by banks has changed since the 1970s. Technological advances in computersand communications equipment and the advent of intermediaries specializingin the collection and processing of firm-specific information have enabled banksto substitute hard for soft information in the lending process. This has helpedadvance the use of data-based lending decisions involving systematic and peri-odic assessment of borrowers through information about firms’ accounts, theiruse of trade credit, and the like. While small business lending has tradition-ally involved the processing of intangible (soft) information, necessitating thatlending decisions be made in close geographical proximity to the location ofthe borrower, the use of new technology has allowed banks to lend at a greaterdistance. Petersen and Rajan show that the distance between banks and theirsmall business borrowers has been steadily increasing since the 1970s.24
Banks that lend at greater distances help integrate capital markets and im-prove the sharing of risks. They may also benefit bank-dependent borrowerssuch as small business owners. Lending across state borders improves inter-state insurance because of portfolio diversification effects, as banks bear outputrisk from borrowers residing in different states. Also, firms are able to borrowfrom a wider range of banks, which directly affects the availability and cost offinance. Further, obtaining a loan from a distant reputable bank may improvea borrower’s access to other (nonbank) sources of finance (certification effect).
The trend of increased distance in lending documented by Petersen and Rajanis found for the years that we use in our study. Hence, if technological changeis correlated with deregulation, it may be the case that we are measuring theeffect of technological change on income insurance rather than the effect ofderegulation. If so, we need to allow for changes in lending technology in ourempirical specification.
Kroszner and Strahan (1999) argue that banking deregulation and technolog-ical change are correlated. Specifically, they argue that deregulation occurredwhen the benefits enjoyed by private interest groups (small banks and insur-ance firms) in favor of banking restrictions were eroded by, among other things,technological innovations that altered the costs and benefits of the restrictions.The ability to lend without soft information would be one such innovation. Forthe improvement in income insurance to be driven by changes in technologyrather than deregulation, the cross-sectional pattern of technological change
24 They estimate that a firm that began borrowing from its lender in the 1990s was approximately35% further away from its lender than an otherwise identical firm that started borrowing in the1980s.

Effects of Deregulation of U.S. Banking 2775
must coincide with the pattern of deregulation. Essentially, states should dereg-ulate only after banks had already started lending to out-of-state borrowers andbranching restrictions were less binding.
It is plausible, however, that banking consolidation and technological changeare related rather than separate trends. If lending procedures based on hardinformation involve economies of scale, banks need a certain size to reap thebenefits, which in turn necessitates consolidation. That is, consolidation mayprecede technological change. For example, there are fixed costs in associationwith auditing borrowers and collecting information from them, acquiring andinstalling systems to process and store this information, acquiring informationfrom data providers external to the bank, training employees to work with thesystem, etc. This is consistent with the observation that large banks tend tolend at greater distances than small banks (Berger et al. (2005)).
B. Development of National Mortgage Markets and Expansionin Credit Card Debt
Consumer credit markets have developed considerably during our sample pe-riod. Credit card loans have become widely available and the securitization ofmortgage debt has accelerated since 1980 when government-sponsored enter-prizes were authorized to engage in the issuance of mortgage-backed securities.It is possible that the deepening of these markets (partly) explains our results.
In principle, borrowing in credit markets helps smooth consumption ratherthan personal income (Asdrubali, Sørensen, and Yosha (1996)). However, smallbusiness owners may use consumer credit for some firm-related expenditures.Also, they may substitute sources of funds by, say, using credit card debt as abuffer during a credit crunch. However, according to the 1993 NSSBF, creditcard debt makes up only 0.14% of all finance (equity and debt), while bank debt,the largest external source of finance, constitutes 19% of all finance (Berger andUdell (1998), Table 1).25 Hence, the data do not seem to support the hypothe-sis that greater availability of unsecured credit card debt may be driving ourresults, because small business owners do not use consumer credit as a sourceof finance on a scale that may explain the magnitude of income insurance wemeasure. Furthermore, for this conjecture to be warranted, the improved accessto credit card debt would have to be correlated with the cross-sectional patternof deregulation, which seems unlikely.
Another major development, the emergence of national mortgage markets,may also have facilitated income insurance. The securitization of mortgageloans entails the pooling of risk and increases capital flows between states ashouseholds hold these claims through intermediaries such as insurance com-panies, pension, and mutual funds, etc. This implies that securitization may becontributing to the overall positive trend in income insurance that we observe.
The evolution of a liquid secondary market for mortgages has helped shiftinterest rate risk from banks and other institutions originating mortgages to
25 The number includes both the firm’s and the owner’s credit card debt when used for firmpurchases.
2776 The Journal of Finance
investors in capital markets, improving the financial flexibility of these insti-tutions.26 To the extent this has had a stabilizing effect on the supply or cost offinance collateralized by real estate, small business owners have benefited tooas mortgage loans are a source of small business finance.27
For securitization to explain the disproportionate increase in income insur-ance in states with more small businesses, mortgage debt must have been asufficiently flexible source of finance for small business owners that it has en-abled significant income smoothing. However, the use of mortgage finance doesnot seem pervasive enough to explain the considerable increase in income in-surance we measure. Berger and Udell (1998) report that mortgage debt usedfor business purposes constitutes on average 14% of debt to financial institu-tions, which amounts to only 4% of all funding and 7% of all debt (Berger andUdell (1998), Table 2). Also, these figures are from the 1993 NSSBF, which isclose to the end of our sample where the effect from securitization is likely tobe strongest.
If, on the other hand, consolidation improved the ability of banks to benefitfrom securitization, and these benefits were passed on to bank-dependent bor-rowers, this would constitute a causal effect of deregulation and would be con-sistent with our hypothesis. However, one cannot entirely rule out that banksreaped benefits from securitization for reasons unrelated to deregulation. Ifthis is the case, the trend in securitization should be part of our empiricalspecification.
V. Data
We use a panel of variables for the 50 U.S. states minus Delaware and SouthDakota for the period 1970 to 2001.28 Below, we describe the main sources ofdata and the methodology used to construct the variables used in the analy-sis. As all our measures are in per capita terms, we generally omit the term“per capita” for the sake of brevity. Growth rates of real per capita variablesare calculated as the first differences of the natural log of per capita-levelvalues.29
State Gross Domestic Product: We use Bureau of Economic Analysis (BEA)data for gross state product, which is defined as the value added of the indus-tries of a state, deflated by the consumer price index to obtain real per capitastate gross domestic product, which for brevity we refer to simply as “grossstate product” (GSP).
26 See, for example, Pennacchi (1988).27 A negative correlation between mortgage rates and the volume of securitization is often found
in empirical work; see, for example, Kolari, Fraser, and Anari (1998). However, Heuson, Passmore,and Sparks (2001) argue that this relationship may be an effect of reverse causality.
28 We exclude Delaware and South Dakota from the sample due to laws that provide tax incen-tives for credit card banks to operate there. As a result, the banking industry in these two statesgrew much faster than in other states in the 1980s.
29 We deflate output using the consumer price deflator rather than the output deflator becausewe want to measure the purchasing power of output.
Effects of Deregulation of U.S. Banking 2777
Personal Income: We use BEA state-level personal income deflated by con-sumer prices to obtain real per capita personal income by state.30 Measures ofthe components of personal income, proprietors’ income, wages, and dividends,interest, and rental income are also taken from the BEA.
Intrastate Branching Restrictions: We measure the direct effect of branchingderegulation using two indicator variables: Dm&a equals one in years in whichstate-wide branching by mergers and acquisitions is permitted, and Dnovo equalsone in years in which state-wide de novo branching is permitted. These defini-tions follow Jayaratne and Strahan (1996) and Kroszner and Strahan (1999).Deregulation dates come from Amel (1993) and Kroszner and Strahan (1999),updated from individual states’ codes and bills available from the state legis-latures; see Table I.
Interstate Banking Restrictions: We measure the direct effect of interstatebanking deregulation by the indicator variable Dinter, which equals one in yearsin which entry by out-of-state bank holding companies is permitted (by merg-ers and acquisitions). We further define the variable Dreci, which takes intoaccount the fact that most states allowed entry by banks from only neighboringstates and on a reciprocal basis. We define Dreci as the fraction of (outside) statesin the sample from which entry is de facto allowed, taking into account whetherthe reciprocity constraint for each individual outside the state is binding or not.The variable, therefore, takes fractional values between zero and one, wherethe value of one means that banks from any other state are able to enter,and the value of zero means that banks from no other states are able to en-ter.31 Information on deregulation dates and reciprocity rules is available fromAmel (1993) and our own updates from individual states’ codes and bills avail-able from the state legislatures.
Small Business Employment: We measure the degree of importance of smallbusinesses in a state as the proportion of people employed in small businessestablishments relative to total employment in 1978, the earliest date avail-able. (Data for the share of small businesses in the population of firms is onlyavailable from 1988.) We split states into three equal-sized groups accordingto this measure (“high,” “low,” and “middle”) and say that small businesses arerelatively more prevalent in a state if the state belongs to the “high” group. Bysmall we refer to establishments with a number of employees less than 100.
30 Interstate smoothing of earnings can occur by commuting across state borders. The BEAtakes into account commuters’ income in the construction of personal income data. Therefore,our measure incorporates this type of interstate income insurance. The same feature holds fordistributed profits, interest, and rent, which occur when residents of one state hold securities ofcorporations and property in other states.
31 For example, in 1978, Maine allowed national reciprocal entry but no other state allowed entry;hence, de facto, no out-of-state banks were allowed entry. In 1982, New York allowed reciprocal entryand Alaska allowed national nonreciprocal entry. Hence, de facto New York and Maine allowed entryfrom only two outside states, whereas Alaska allowed entry from 49 outside states. If reciprocalentry is permitted from specific states only, we count whether the reciprocity constraint binds foreach individual state: Dreci equals the number of states with de facto entry divided by the numberof states in the sample minus one.

2778 The Journal of Finance
Table IYear of Banking Deregulation
Amel (1993), Kroszner and Strahan (1999), and authors’ updates from individual states’ state codesavailable from the state legislatures. For states that deregulated before 1960 the date is listed as1960. ∗∗∗ indicates that states did not deregulate until the end of the sample period, 2001.
Statewide Interstate Statewide de novoBranching through Banking Branching
States M&As Permitted Permitted Permitted
Alabama 1981 1987 1990Alaska 1960 1982 1960Arizona 1960 1986 1960Arkansas 1994 1989 1999California 1960 1987 1960Colorado 1991 1988 1997Connecticut 1980 1983 1988Delaware 1960 1988 1960District of Columbia 1960 1985 1960Florida 1988 1985 1988Georgia 1983 1985 1998Hawaii 1986 1995 1986Idaho 1960 1985 1960Illinois 1988 1986 1993Indiana 1989 1986 1991Iowa 1997 1991 ∗∗∗Kansas 1987 1992 1990Kentucky 1990 1984 2001Louisiana 1988 1987 1988Maine 1975 1978 1975Maryland 1960 1985 1960Massachusetts 1984 1983 1984Michigan 1987 1986 1988Minnesota 1993 1986 ∗∗∗Mississippi 1986 1988 1989Missouri 1990 1986 1990Montana 1990 1993 1997Nebraska 1985 1990 ∗∗∗Nevada 1960 1985 1960New Hampshire 1987 1987 1987New Jersey 1977 1986 1996New Mexico 1991 1989 1991New York 1976 1982 ∗∗∗North Carolina 1960 1985 1960North Dakota 1987 1991 1996Ohio 1979 1985 1989Oklahoma 1988 1987 2000Oregon 1985 1986 1985Pennsylvania 1982 1986 1989Rhode Island 1960 1984 1960South Carolina 1960 1986 1960South Dakota 1960 1988 1960Tennessee 1985 1985 1990
(continued)

Effects of Deregulation of U.S. Banking 2779
Table I—Continued
Statewide Interstate Statewide de novoBranching through Banking Branching
States M&As Permitted Permitted Permitted
Texas 1988 1987 1988Utah 1981 1984 1981Vermont 1970 1988 1970Virginia 1978 1985 1986Washington 1985 1987 1985West Virginia 1987 1988 1987Wisconsin 1990 1987 1989Wyoming 1988 1987 1999
Table IIDefinition of Variables
PINCit The growth rate of (real) personal income (per capita) in state i in period t.PINCit PINCit minus its mean across states minus its mean across time.GSPit The growth rate of (real) gross state product (per capita) in state i in period t.GSPit GSPit minus its mean across states minus its mean across time.INCit The growth rate of (real) personal income components (per capita) in state i in period t.INCit INCit minus its mean across states minus its mean across time.Dm&a An indicator variable that equals one in years in which statewide branching by
mergers and acquisitions was permitted.Dnovo An indicator variable that equals one in years in which statewide de novo branching
was permitted.Dinter An indicator variable that equals one in years in which entry by out-of-state bank
holding companies was permitted.Dreci The fraction of (outside) states in the sample from which entry is de facto allowed,
taking into account whether the reciprocity constraint for each individual outsidestate is binding or not.
TECH Bank lending technology, measured as the log of the value of bank loans scaled bythe number of bank employees in state i at date t.
MBS The ratio of the cumulative outstanding volume of mortgage backed securitiesissued by Government Sponsored Enterprizes scaled by U.S. GDP (divided by 106
for scaling).αi A state fixed effect.νt A time fixed effect.
The data come from the Geospatial and Statistical Data Center, University ofVirginia library.32 Employment is paid employment, which consists of full- andpart-time employees, including salaried officers and executives of corporations.Included are employees on sick leave, holidays, and vacations; not included areproprietors and partners of unincorporated businesses.
32 See http://fisher.lib.virginia.edu/collections/stats/cbp/state.html.

2780 The Journal of Finance
Proprietors’ Income: This component of personal income is the current pro-duction income (including income in kind) of sole proprietorships, partnerships,and tax-exempt cooperatives. Corporate directors’ fees and the imputed netrental income of owner-occupants of farm dwellings are included in propri-etors’ income, but the imputed net rental income of owner-occupants of non-farm dwellings is included in rental income of persons. Proprietors’ incomeexcludes dividends and monetary interest received by nonfinancial businessesand rental income received by persons not primarily engaged in the real estatebusiness; these income items are included in dividends, net interest, and rentalincome of persons, respectively. The data come from the BEA.
Cumulative Mortgage-Backed Securities: Mortgage-backed securities are netissues of federally related mortgage pool securities by the Government NationalMortgage Association, Fannie Mae, Freddie Mac, and the Farm Service Agency.The data come from the Flows of Funds Accounts of the United States (“Agency-and GSE-Backed Mortgage Pools,” Table F.210).
Lending Technology: We define TECH, a measure of banks’ use of hard infor-mation, as the value of state-level bank loans per employee similar to Petersenand Rajan (2002). The data come from Call Reports.
Table II provides the definition of the variables used in the regressions.
VI. Measuring Income Insurance
We measure the degree to which personal income is insured between U.S.states. Our measure builds on the method of estimating risk sharing throughcapital markets developed by Asdrubali, Sørensen, and Yosha (1996). The fol-lowing set of assumptions are standard in the risk-sharing literature. A rep-resentative consumer of each region maximizes lifetime expected utility fromconsumption. If utility functions are of the Constant Relative Risk Aversionvariety and all regions have a common intertemporal discount factor, the opti-mal risk-sharing allocation satisfies Cit = kiCt for all t and all realizations ofuncertainty, where Cit and Ct denote state-level and aggregate consumption,respectively. The constant ki is independent of time and the state of the worldand reflects the relative value of state i’s endowment stream including initialwealth.
Because our focus is on the interconnection of small business owners’ personalfinances with the finances of their firms, we examine income insurance (smooth-ing). If full risk sharing is achieved via income smoothing, then INCit = kiINCt,where INCit and INCt denote state and aggregate personal income per capita,respectively. If income is fully insured, the income of different states may beat different levels but since the constant ki is independent of time, full incomeinsurance implies that all states have identical growth rates of income. Thisimplication forms the basis of our empirical estimations.
Let PINCit and Yit denote the growth rates of state personal income and GSP,respectively. Under full income insurance all states have the same growthrate of income: PINCit = PINCjt for all states i and j at all dates t. Equivalently,PINCit − PINC.t = 0, where PINC.t is the period t average across all states. The

Effects of Deregulation of U.S. Banking 2781
interpretation is that average income growth cannot be insured through cross-state income diversification while Yit − Y.t , the idiosyncratic component of out-put, can be fully insured.33 We also refer to (Yit − Y.t) and (PINCit − PINC.t) asstate-specific output and state-specific personal income, respectively.
We prefer that our measure of risk sharing be robust to long-lasting dif-ferences in income and output growth. States with a high immigration ofretirees, such as Florida, may see income growing faster than output whenretirees—who do not produce output but do receive income—move in. Wetherefore consider output and income in state i adjusted for state-specificmeans, that is, we study how much PINCit = PINCit − PINC.t − PINCi. co-varies withYit = Yit − Y.t − Yi., where for any variable Xit we define Xi. = 1
T �Tt=1Xit , with T
denoting the number of years in our sample, and X.t = 1N �N
i=1Xit , with N denot-ing the number of states in our sample.
Rather than testing if risk sharing is perfect, we define a measure of incomeinsurance that takes the value of zero if income moves one-to-one with output(no income insurance), that is, if PINCit = Yit , and the value of one if income doesnot co-move with output (full income insurance). More precisely, we measurethe amount of income insurance by the estimated coefficient β in the panel dataregression
Yit − PINCit = βYit + εit . (1)
The coefficient β declines with the degree of pass-through of state-specific out-put growth to state-specific income growth. A value of β > 0 implies incomeinsurance, and the more positive is β, the less state-specific income co-moveswith state-specific output. We interpret a value of one as perfect income insur-ance. We multiply the estimated β-value (and other parameters) by 100, andtherefore refer to β as the percentage of risk shared.
In order to examine if income insurance changes with banking deregulation,we allow the coefficient that measures the amount of income insurance to varyby state and over time, in other words, we estimate the relation
Yit − PINCit = µi + νt + βit Yit + εit , (2)
where
βit = β0 + β1Xit , (3)
and µi and νt are state and time fixed effects (dummy variables), respectively.34
In this regression the inclusion of the Xit-term allows the amount of incomeinsurance to vary with the value of Xit. The coefficient β0 then measures the
33 We could subtract the aggregate rather than the average with very little effect on the resultsand no change in the interpretation.
34 Equation (1) is written in terms of deviations from state and time averages. Hence, includingfixed effects will not change the estimated value of β0. The fixed effects have no impact in equation(2) because the variables are in the form of deviations from time- and state-specific means, butthey have an impact when interaction terms are included below.

2782 The Journal of Finance
average amount of income insurance when Xit is zero.35 We refer to such Xit-terms as interaction terms. The coefficient β1 measures the increase in incomeinsurance associated with a one-unit increase in X. The focus of much of our workis on the size of this coefficient. In particular, if this coefficient is significantlydifferent from zero, it implies that the relevant X-variable has an impact onincome insurance. In the following we discuss the detailed implementation forvarious interaction variables—depending on the specific variable, Xit will beunadjusted, adjusted for its overall mean, or adjusted for the mean state-by-state. We discuss these details next.
Our main interaction terms are dummy variables for various types of bankingderegulation. Let Dit be a generic term that describes one of our three dummyvariables for banking deregulation, as explained in Section V. These dummiesall take the value of zero in state i in the years before deregulation, and thevalue of one after deregulation. In this case, β0 measures the amount of incomeinsurance before deregulation and β0 + β1 measures the the amount of incomeinsurance after deregulation, where β1 is the change in income insurance. Forthe continuous measure of interstate banking deregulation, Dreci, β1 measuresthe increase in income insurance in a state that moves from prohibiting out-of-state entry to nationwide entry (that is, when Dreci
it goes from zero to one).Several things changed in the financial markets over the period we examine.
Of particular relevance is the integration of mortgage markets into a nationwidemarket and technological advances that allowed physical distances betweenbanks and firms to increase. These developments potentially led to greaterrisk sharing between states. Because these developments partly took place atthe same time banking regulations were relaxed, we need to examine whetherbanking integration is still an important explanatory factor when these othercompeting explanations are taken into account.
Petersen and Rajan (2002) verify that changes in lending technology allowbanks to lend at larger distances. The lending technology used by banks is notdirectly observable and thus the authors use as an approximation the measureTECH, bank loans per employee, which is basically a proxy for banks’ lending effi-ciency. We examine whether TECH helps predict the amount of income insurancethat states obtain and, in particular, if our measures of banking deregulationhelp explain insurance when lending technology is included as an explanatoryfactor.
We estimate the relation
βit = β0 + β1 Dit + β2(TECHit − TECHi.) , (4)
where “D” refers to one (or several) of our measures of deregulation. Lendingtechnology is likely to vary between, say, agricultural states and financial cen-ter states, which we control for by subtracting the state-level average. Theresults of this regression must be interpreted with care: Deregulation allows
35 Such regressions were previously used to estimate risk sharing by Melitz and Zumer (1999)and Sørensen et al. (2007).

Effects of Deregulation of U.S. Banking 2783
for banks to merge into larger organizations that are likely at an advantage inusing data-based lending technology because such technologies are associatedwith economies of scale. Therefore, technological change may be a competingexplanation for increased income insurance but it may also be the result ofbanking deregulation. Nonetheless, it is important to determine whether bank-ing reform improved risk sharing even after lending technology is taken intoaccount.
The nationwide integration of mortgage markets may well be another reasonrisk sharing increased during our sample period. We explore this issue to alimited extent. We define MBS to be the total outstanding amount of securitizedmortgage assets issued by government-sponsored enterprises divided by GDP.We then estimate
βit = β0 + β1 Xit + β2(MBSt − MBS). (5)
If β2 is significant and positive this implies that the securitization of mort-gage markets is associated with better income insurance. We do not attempt toidentify state-varying impacts from the integration of mortgage markets. Thisquestion is highly interesting in its own right but a more detailed study of itwould take us too far afield in this paper.36
Risk sharing between states may increase over time due to a myriad of un-derlying economic causes besides those just discussed. We therefore examinethe effect of including a quadratic trend in risk sharing in our estimation. Inparticular, for a relevant variable X, we specify the coefficient βit as
βit = β0 + β1 Xit + β2 (t − t) + β3 (t − t)2 , (6)
where the X-variable is adjusted for its overall mean or state-specific mean inthe same way as in the regressions without a trend. We include a term that isquadratic in time because income insurance cannot grow linearly forever.37
In order to test whether banking integration improved income insurancefor small business owners, we split our sample of states into three subsam-ples according to the fraction of small businesses. We have argued that smallbusinesses are most dependent on bank finance so it is essential for our
36 As a technical matter, we deduct the mean value of MBS because this keeps the interpretationof β0 unchanged. When MBS is not included in the regression, β0 measures (approximately) theamount of risk sharing when MBS takes its average value. In a regression in which MBS is includedand MBS is not subtracted from MBS, the interpretation of β0 is the amount of risk sharing whenMBS = 0. Typically, if β0 is the estimate of β0 from the former regression and β0 is the estimatefrom the latter regression, one would find β0 = β0 − β2MBS while the estimated value of β0 would beapproximately invariant when the average has been subtracted from MBS as in our implementation.The estimated value of β2 is mathematically identical in the two regressions. Braumoeller (2004)gives an elementary treatment of this issue with examples.
37 We do not restrict the estimated value of β to be less than one, but a value larger than oneimplies that income drops when output increases and vice versa, which is unlikely to be a typicalsituation.

2784 The Journal of Finance
interpretation that banking deregulation has stronger effects in the group ofstates in which small businesses are most prevalent.38
We perform regressions such as equation (1) on each of the three subsamplesseparately and examine whether the impact of banking reform as measuredby the β-coefficient is larger in the subgroup with a high prevalence of smallbusinesses. Note that in these regressions the definitions of Y and PINC are thesame as in the earlier regressions, that is, we remove the average across allstates. The interpretation, therefore, is that we measure the amount of risksharing relative to the benchmark of full U.S.-wide risk sharing. (If we controlonly for the averages in each subgroup, we would measure the amount of risksharing within the subgroup and not the amount of risk the group shares withall U.S. states.)
A. Econometric Issues
We implement the relation described by equations (2) and (3) by estimatingthe relation
Yit − PINCit = µi + νt + β0 Yit + β1 Xit Yit + γ Xit + εit (7)
using GLS. We interpret β0 + β1Xit as the time-varying risk-sharing coefficientβit. The “linear term” γ X indicates whether the variable X had an impact onthe average growth difference between income and output—while this is notof interest in the present study, we include the term as it is normal in regres-sions allowing for interaction effects in order to be certain that the estimatedcoefficient on the interaction term is not affected by erroneously leaving out asignificant linear term.
Our estimations utilize a two-step GLS estimator. The first step is a panelOLS estimation. From the residuals we estimate the variance of the error termsin the regression assuming that it varies by state—the estimates typically con-firm this assumption with small states having higher residual variance thanlarge states. In the second step the variables for each state are weighted by theestimated standard error for the state. It is feasible that the error terms may becorrelated over time within each state and correlated with state-specific outputgrowth (the regressor). Bertrand, Duflo, and Mullinaithan (2004) demonstratethat such “clustering” of standard errors can lead to severely biased standarderrors in the presence of serial correlation. Our data do not display severe auto-correlation but we find that it is prudent to display estimated standard errorsthat are robust to “clustering-type” heteroskedasticity.39
38 As a robustness check we alternatively measure the importance of small businesses by thenumber of small firms in 1988 (the earliest available year). The results using this measure are verysimilar to those reported and are omitted for brevity.
39 Our implementation is similar to the robust clustering procedure built into the STATA econo-metrics package.

Effects of Deregulation of U.S. Banking 2785
B. Proprietors’ Income
Proprietors are typically dependent on banks to the same degree as smallbusiness owners. Accordingly, we would also like to examine if banking reformled to disproportionately higher income insurance for proprietors. We do notdirectly observe the production output from proprietors and hence we cannotdirectly estimate the amount of income insurance obtained by proprietors. How-ever, we can examine if proprietors’ income has become less sensitive to outputgrowth following banking reform. We estimate the amount of proprietors’ in-come smoothing from the regression
˜PROPINCit = µi + νt + β0Yit + β1Dit Yit + γ Dit + εit , (8)
where PROPINCit measures aggregate proprietors’ period t income in state i andD is one (or several) of our measures of deregulation. Here, a positive value of β0implies that proprietors’ income co-moves with output and a value larger than100% implies that a given percentage shock to state-level output is associatedwith a more than 100% change in proprietors’ income in the same direction.A negative value of β1 indicates that an increase in D typically is associatedwith less sensitivity of the proprietors’ income to output shocks. We considerthe negative of the estimated value of β1 as a proxy for the measured effect onsmall business owners’ income insurance. For completeness, we also examinewhether wage income and dividend, interest, and rental income have becomeless sensitive to output growth following deregulation.
VII. Results and Discussion
A. Descriptive Figures and Tables
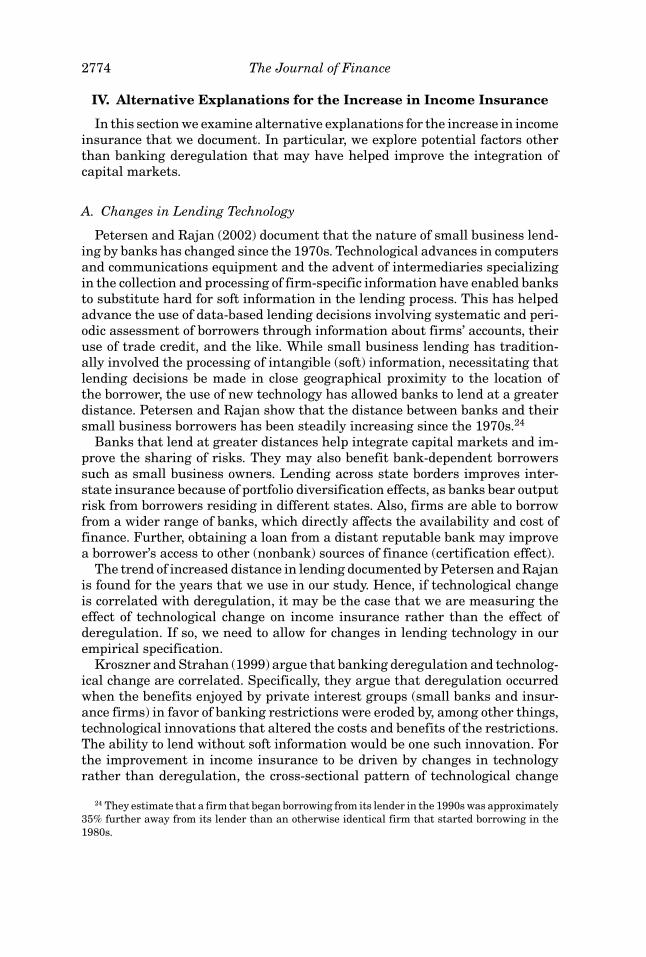
Figure 1 displays the average value of Dreci across states for each year in oursample and, similarly, the value of Dreci over time for three randomly selectedstates. For Idaho, the variable looks much like a binary variable while for Michi-gan and New York, the variable gradually increases from zero to one during theperiod from the early 1980s to the mid-1990s.
Figure 2 displays the growth rates of GSP and personal income for the av-erage U.S. state and the state-specific (state minus average) growth rates ofGSP and personal income for Idaho, Michigan, and New York. Panel A suggeststhat the volatility of state-level GSP declined after deregulation, consistent withMorgan, Rime, and Strahan (2004). Panels B to D show that large fluctuationsin state-specific GSP are typically associated with large fluctuations in personalincome, but the latter are damped relative to those of GSP, reflecting interstateincome insurance. We mark the dates of the three discrete banking deregula-tions by vertical lines and we display the correlation of state-specific incomewith state-specific GSP before and after deregulation. For the states shown in thefigure, the correlation of personal income with GSP declined after each type ofderegulation.
Figure 3 depicts similar graphs with proprietors’ income instead of personalincome. The volatility of proprietors’ income has declined considerably since the
2786 The Journal of Finance
D_reci
0
.2
.4
.6
.8
1
1970 1975 1980 1985 1990 1995 2000Year
A. Average U.S.D_reci
0
.2
.4
.6
.8
1
1970 1975 1980 1985 1990 1995 2000Year
B. Idaho
D_reci
0
.2
.4
.6
.8
1
1970 1975 1980 1985 1990 1995 2000Year
C. MichiganD_reci
0
.2
.4
.6
.8
1
1970 1975 1980 1985 1990 1995 2000Year
D. New York
Figure 1. Reciprocal interstate banking deregulation. The figure shows the interstate dereg-ulation measure D reci defined as the fraction of (outside) states in the sample from which entryis de facto allowed, taking into account whether the reciprocity constraint for each individual out-side state is binding or not. The variable takes values between zero and one, where a value of onemeans that banks from any other state are permitted to enter, and a value of zero means that banksfrom no other state may enter. Sample: 1970–2001. The states of Delaware and South Dakota areexcluded.
early 1980s, when proprietors’ income displayed extremely high sensitivity toGSP shocks. During that period, fluctuations in GSP were strongly amplified inproprietors’ income (Panel A). For the three selected states, we observe a strongdecline in the amplitude of state-specific proprietors’ income in the period afterbanking reform. While changes in GSP are not equivalent to endowment shocksfor proprietors, this pattern is nevertheless consistent with better income in-surance for proprietors following banking deregulation.
Table III displays the average values, standard deviations, and correlationsfor our deregulation variables. The mean value of the dummy variables has asimple interpretation as the fraction of the sample for which the particular formof deregulation has been in place. For example, on average states had removedrestrictions on intrastate branching by mergers and acquisitions for 60% of theyears in our sample.
The correlation matrix shows that all our integration measures are positivelycorrelated. In particular, the pair of intrastate deregulation variables and thepair of interstate deregulation variables are highly correlated: 0.83 and 0.79,

Effects of Deregulation of U.S. Banking 2787
GSP, PINCGrowth Rate (%)
Average Corr BeforeD_m&a: 0.79D_inter: 0.80D_novo: 0.79
Average Corr AfterD_m&a: 0.68D_inter: 0.66D_novo: 0.72
0
2
4
6
8
1970 1975 1980 1985 1990 1995 2000
Year
A. Average U.S.GSP, PINCGrowth Rate (%)
Corr BeforeD_inter: 0.84
Corr AfterD_inter: 0.82D_inter
0
2
4
6
1970 1975 1980 1985 1990 1995 2000
Year
B. Idaho
GSP, PINCGrowth Rate (%)
Corr BeforeD_m&a: 0.85D_inter: 0.85D_novo: 0.85
Corr AfterD_m&a: 0.80D_inter: 0.81D_novo: 0.81
D_m&aD_interD_novo
0
2
4
6
1970 1975 1980 1985 1990 1995 2000
Year
C. Michigan
Growth Rate (%)
Corr beforeD_m&a: 0.84D_inter: 0.87
Corr AfterD_m&a: 0.70D_inter: 0.65
D_inter
D_m&a
0
1
2
3
4
1970 1975 1980 1985 1990 1995 2000
Year
D. New York
Figure 2. Average and state-specific growth rates of GSP and personal income. The fig-ure displays growth rates of Gross State Product (GSP) (solid line) and State Personal Income(PINC) (dotted line) for the average of U.S. states (Panel A), and state-specific (state minus av-erage) growth rates for three arbitrary states (Panels B–D). Vertical lines correspond to thedates of deregulation, where D m&a denotes the year in which statewide branching by mergersand acquisition was permitted, D inter denotes the year in which interstate banking was permit-ted, and D novo denotes the year in which statewide de novo branching was permitted. In Pan-els B to D, the left side of each panel gives the correlation coefficients between GSP and PROPINC
for the years prior to deregulation and the right side gives the correlation coefficients for theyears following deregulation. In Panel A, the corresponding correlations are computed as theaverages across U.S. states. Sample: 1970–2001. The states of Delaware and South Dakota areexcluded.
respectively. This makes it difficult to estimate the separate impact of the vari-ables in a regression that includes both intrastate (or both interstate) deregu-lation measures. The correlations between each of the intrastate dummies witheach of the interstate deregulation variables are above 0.5 but no higher than0.64. Our data set is fairly large, hence a correlation of this magnitude maypotentially, but not necessarily, be too high for us to separate the impact of in-trastate deregulation from the impact of interstate deregulation. The measureof lending technology is quite highly correlated with the interstate deregulationdummies, with correlations of around 0.5, but less correlated with the measuresof intrastate deregulation.
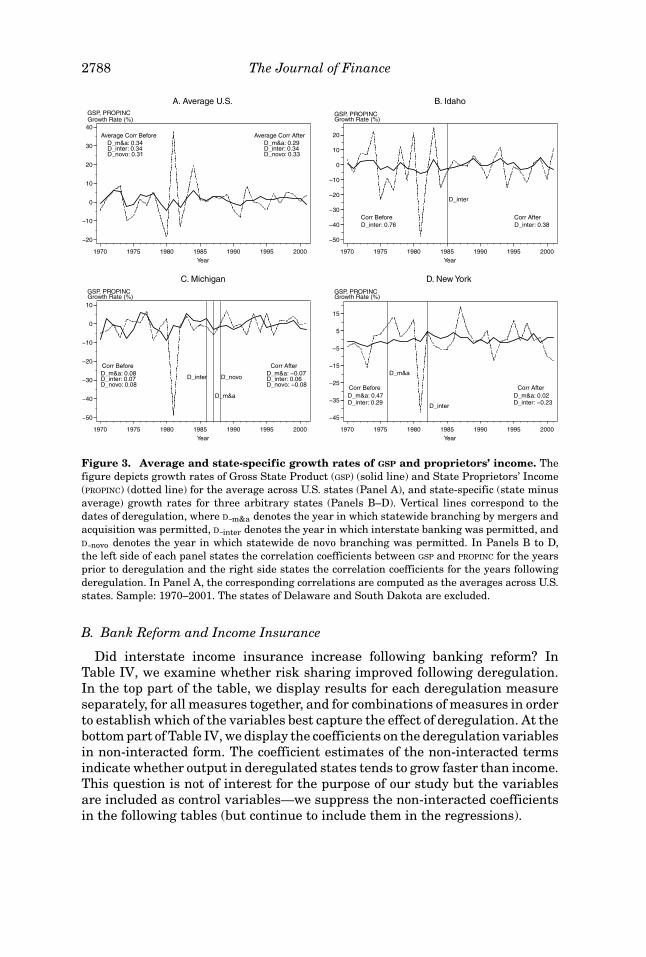
2788 The Journal of Finance
GSP, PROPINCGrowth Rate (%)
Average Corr BeforeD_m&a: 0.34D_inter: 0.34D_novo: 0.31
Average Corr AfterD_m&a: 0.29D_inter: 0.34D_novo: 0.33
0
10
20
30
40
1970 1975 1980 1985 1990 1995 2000Year
A. Average U.S.GSP, PROPINCGrowth Rate (%)
Corr BeforeD_inter: 0.76
Corr AfterD_inter: 0.38
D_inter
0
10
20
1970 1975 1980 1985 1990 1995 2000Year
B. Idaho
GSP, PROPINCGrowth Rate (%)
Corr BeforeD_m&a: 0.08D_inter: 0.07D_novo: 0.08
Corr After
D_inter: 0.06
D_m&a
D_inter D_novo
0
10
1970 1975 1980 1985 1990 1995 2000Year
C. MichiganGSP, PROPINCGrowth Rate (%)
Corr BeforeD_m&a: 0.47D_inter: 0.29
Corr AfterD_m&a: 0.02
D_inter
D_m&a
5
15
1970 1975 1980 1985 1990 1995 2000Year
D. New York
Figure 3. Average and state-specific growth rates of GSP and proprietors’ income. Thefigure depicts growth rates of Gross State Product (GSP) (solid line) and State Proprietors’ Income(PROPINC) (dotted line) for the average across U.S. states (Panel A), and state-specific (state minusaverage) growth rates for three arbitrary states (Panels B–D). Vertical lines correspond to thedates of deregulation, where D m&a denotes the year in which statewide branching by mergers andacquisition was permitted, D inter denotes the year in which interstate banking was permitted, andD novo denotes the year in which statewide de novo branching was permitted. In Panels B to D,the left side of each panel states the correlation coefficients between GSP and PROPINC for the yearsprior to deregulation and the right side states the correlation coefficients for the years followingderegulation. In Panel A, the corresponding correlations are computed as the averages across U.S.states. Sample: 1970–2001. The states of Delaware and South Dakota are excluded.
B. Bank Reform and Income Insurance
Did interstate income insurance increase following banking reform? InTable IV, we examine whether risk sharing improved following deregulation.In the top part of the table, we display results for each deregulation measureseparately, for all measures together, and for combinations of measures in orderto establish which of the variables best capture the effect of deregulation. At thebottom part of Table IV, we display the coefficients on the deregulation variablesin non-interacted form. The coefficient estimates of the non-interacted termsindicate whether output in deregulated states tends to grow faster than income.This question is not of interest for the purpose of our study but the variablesare included as control variables—we suppress the non-interacted coefficientsin the following tables (but continue to include them in the regressions).

Effects of Deregulation of U.S. Banking 2789
Table IIIMeasures of Banking Deregulation: Descriptive Statistics
See Table II for variable definitions. The correlation of TECH with the other variables is calculatedas TECH minus the mean for each state corresponding to the way it is interacted with output growthin the regression tables. Sample is 1970–2001. District of Columbia and the states of Delaware andSouth Dakota are excluded.
Panel A: Means and Standard Deviations
Mean Std. Dev. Sample
Dm&a 0.60 0.49 1970–2001Dnovo 0.47 0.50 1970–2001Dinter 0.48 0.50 1970–2001Dreci 0.35 0.44 1970–2001TECH 6.92 0.13 1970–2001
Panel B: Correlations
Dm&a Dnovo Dinter Dreci TECH
Dm&a 1.00 0.76 0.64 0.59 0.31Dnovo – 1.00 0.51 0.51 0.26Dinter – – 1.00 0.83 0.52Dreci – – – 1.00 0.52TECH – – – – 1.00
The first four columns of Table IV show that each banking deregulation vari-able strongly and significantly predicts higher income insurance. In particular,income insurance was, on average, 45% before deregulation of restrictions onbranching by mergers and acquisitions; see the coefficient on GSP in column(1). This estimate is large in economic terms and strongly significant.40 Afterderegulation, the amount of income insurance increased to 55.3% (45.0% +10.3%). The estimated impact (10.3%) of banking deregulation is large in eco-nomic terms and the estimate is statistically significant at the usual 5% level.The results in columns (2) and (3) are of similar magnitude, while the estimatedimpact of interstate deregulation, as measured by Dreci, is even larger with anincrease in risk sharing of almost 18%.
In column (5), we include all four measures of deregulation. The estimatedimpact of Dreci is nearly unchanged, but the estimated impact of Dnovo andinterstate deregulation Dinter are now both negative. Clearly, the deregula-tion variables are so highly correlated that we cannot sort out the relativeeffect of each variable. Next, in column (6), we ask a less ambitious ques-tion: Which of the two intrastate deregulation variables has more explanatory
40 The estimate is very close to the 39% value for “capital market risk sharing” found by As-drubali, Sørensen, and Yosha (1996), who define capital market risk sharing similarly to ourmeasure of income insurance except that they remove all federal transfers to persons from per-sonal income but add all revenue of state governments not collected from individuals in the state.Nonetheless, their estimate has a very similar interpretation to ours.

2790 The Journal of Finance
Table IVBanking Deregulation and Income Insurance
The results are from the following GLS regression: GSPit − PINCit = αi + νt + β0 GSPit + β1Dit +β2GSPit · Dit + εit . Dit is a variable for banking deregulation, measured in terms of four differentvariables: Dm&a, Dnovo, Dinter, and Dreci. αi and νt are not reported. See Table II for variable defi-nitions. The sample is 1970–2001. District of Columbia and the states of Delaware and SouthDakota are excluded. GLS clustering-robust standard deviations are in parentheses. Coefficientsand standard deviations are multiplied by 100. The number of observations is 1,536.
(1) (2) (3) (4) (5) (6) (7) (8) (9)
GSP 45.0 46.1 46.8 46.4 44.8 44.9 46.6 44.8 44.7(2.7) (2.4) (2.1) (2.0) (2.7) (2.7) (2.1) (2.7) (2.4)
Intrastate DeregulationGSP · Dm&a 10.3 – – – 4.5 8.5 – 3.5 –
(3.0) – – – (5.1) (4.1) – (3.7) –GSP · Dnovo – 9.5 – – −0.3 2.2 – – 5.2
– (3.1) – – (4.0) (4.2) – – (3.5)
Interstate DeregulationGSP · Dinter – – 11.8 – −4.9 – −3.1 – 9.5
– – (2.3) – (5.2) – (4.4) – (2.4)GSP · Dreci – – – 17.6 20.2 – 20.9 15.4 –
– – – (3.3) (6.0) – (6.3) (3.8) –
Linear TermsDm&a −0.2 – – – −0.2 −0.2 – −0.2 –
(0.1) – – – (0.1) (0.1) – (0.1) –Dnovo – −0.0 – – 0.1 0.1 – – −0.0
– (0.1) – – (0.1) (0.1) – – (0.1)Dinter – – −0.1 – 0.1 – 0.0 – −0.1
– – (0.1) – (0.1) – (0.1) – (0.1)Dreci – – – 0.1 0.1 – 0.1 0.1 –
– – – (0.2) (0.2) – (0.2) (0.2) –R2 0.62 0.62 0.61 0.62 0.63 0.62 0.62 0.63 0.62
power? We ask a similar question for the pair of interstate deregulation mea-sures in column (7). Considering intrastate branching deregulation first, wefind that branching by mergers and acquisitions appears more important thande novo branching. Of the interstate deregulation measures, Dreci is the moreimportant. In columns (8) and (9), we run regressions with combinations ofintrastate and interstate deregulation measures. We first combine the mea-sures from each deregulation group, Dm&a and Dreci, which are associated withsignificance in the previous columns. We find that the interstate measure hasvery high statistical significance while the intrastate measure is not signif-icant, although the estimated coefficient is positive and of reasonable size.When we use the combination of Dnovo and Dinter instead, we obtain similarresults, as Dinter is highly significant and the impact of Dnovo is positive al-though not statistically significant at conventional levels. In the following, werun regressions of the type shown in columns (8) and (9) in order to examine
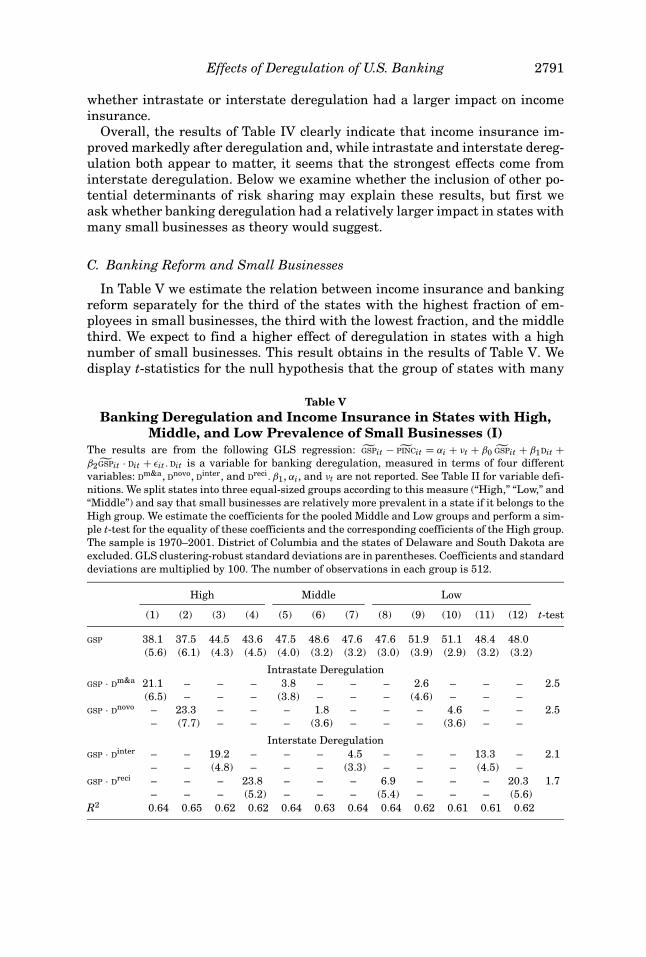
Effects of Deregulation of U.S. Banking 2791
whether intrastate or interstate deregulation had a larger impact on incomeinsurance.
Overall, the results of Table IV clearly indicate that income insurance im-proved markedly after deregulation and, while intrastate and interstate dereg-ulation both appear to matter, it seems that the strongest effects come frominterstate deregulation. Below we examine whether the inclusion of other po-tential determinants of risk sharing may explain these results, but first weask whether banking deregulation had a relatively larger impact in states withmany small businesses as theory would suggest.
C. Banking Reform and Small Businesses
In Table V we estimate the relation between income insurance and bankingreform separately for the third of the states with the highest fraction of em-ployees in small businesses, the third with the lowest fraction, and the middlethird. We expect to find a higher effect of deregulation in states with a highnumber of small businesses. This result obtains in the results of Table V. Wedisplay t-statistics for the null hypothesis that the group of states with many
Table VBanking Deregulation and Income Insurance in States with High,
Middle, and Low Prevalence of Small Businesses (I)The results are from the following GLS regression: GSPit − PINCit = αi + νt + β0 GSPit + β1Dit +β2GSPit · Dit + εit . Dit is a variable for banking deregulation, measured in terms of four differentvariables: Dm&a, Dnovo, Dinter, and Dreci. β1, αi, and νt are not reported. See Table II for variable defi-nitions. We split states into three equal-sized groups according to this measure (“High,” “Low,” and“Middle”) and say that small businesses are relatively more prevalent in a state if it belongs to theHigh group. We estimate the coefficients for the pooled Middle and Low groups and perform a sim-ple t-test for the equality of these coefficients and the corresponding coefficients of the High group.The sample is 1970–2001. District of Columbia and the states of Delaware and South Dakota areexcluded. GLS clustering-robust standard deviations are in parentheses. Coefficients and standarddeviations are multiplied by 100. The number of observations in each group is 512.
High Middle Low
(1) (2) (3) (4) (5) (6) (7) (8) (9) (10) (11) (12) t-test
GSP 38.1 37.5 44.5 43.6 47.5 48.6 47.6 47.6 51.9 51.1 48.4 48.0(5.6) (6.1) (4.3) (4.5) (4.0) (3.2) (3.2) (3.0) (3.9) (2.9) (3.2) (3.2)
Intrastate DeregulationGSP · Dm&a 21.1 – – – 3.8 – – – 2.6 – – – 2.5
(6.5) – – – (3.8) – – – (4.6) – – –GSP · Dnovo – 23.3 – – – 1.8 – – – 4.6 – – 2.5
– (7.7) – – – (3.6) – – – (3.6) – –
Interstate DeregulationGSP · Dinter – – 19.2 – – – 4.5 – – – 13.3 – 2.1
– – (4.8) – – – (3.3) – – – (4.5) –GSP · Dreci – – – 23.8 – – – 6.9 – – – 20.3 1.7
– – – (5.2) – – – (5.4) – – – (5.6)R2 0.64 0.65 0.62 0.62 0.64 0.63 0.64 0.64 0.62 0.61 0.61 0.62
2792 The Journal of Finance
small businesses is similar to the remaining states. We reject this hypothesis atthe 10% level of significance for Dreci and at the 5% level or lower for the otherderegulation variables.
One may notice the large coefficient estimate for Dreci in the group of stateswith fewer small businesses and, to a lesser extent, for Dinter. Both measurespredict a somewhat higher effect of deregulation in states with many smallbusinesses, but the coefficient estimates for the “low” group suggest that in-terstate deregulation is associated with improvements in income insurancethat do not work predominantly through small businesses. In contrast, theeffects of intrastate deregulations are mainly relevant for small businesses.These results are consistent with our hypothesis that a banking system com-prising small banks shielded from competition are prone to inefficiencies stem-ming from lack of diversification, lack of scale economies, and little integra-tion into national credit and capital markets. Our results suggest that theseinefficiencies are detrimental for bank-dependent small firms and the wel-fare of small business owners. The results are also consistent with the find-ing of Jayaratne and Strahan (1996) that improvements in bank efficiencyare behind the sizeable growth effects of intrastate deregulation that theyestimate.
The difference between the estimated effects of the intrastate and interstatevariables indicates that the main issue for small businesses is whether banksbranch and merge, and less whether banks become part of cross-border orga-nizations. We conjecture that the interstate deregulation measures are pickingup fewer of the effects from consolidation and more of the effect from improvedrisk sharing between banks—effects that are likely to benefit not only smallbusiness owners.
Also notice that the estimated level of income insurance before deregulation(row “GSP”) is lower in states with a high prevalence of small businesses. Thisis consistent with our hypothesis that it is relatively harder for small businessowners to smooth their income due to the intertwining of their personal incomewith the finances of their business.
Table VI shows the results from multivariate regressions including both in-trastate and interstate deregulation variables as regressors. The results arevery similar to those in Table V. Deregulation of branching by mergers andacquisitions had a strong effect on risk sharing in states with many small busi-nesses but no significant effect in other states, while interstate deregulationas measured by Dreci had an equally strong effect in states with many and fewsmall businesses. The results are robust to which particular pair of intra- andinterstate deregulation dummies we use, except the estimated impact of Dinter
is smaller than the estimated impact of Dreci.
D. The Impact of Banking Reform versus the Impact of Lending Technologyand Integration of Mortgage Markets
The increase in income insurance that occurred after deregulation is not nec-essarily caused only by banking reform. In this subsection, we examine whether

Effects of Deregulation of U.S. Banking 2793
Table VIBanking Deregulation and Income Insurance in States with High,
Middle, and Low Prevalence of Small Businesses (II)The results are from the following GLS regression: GSPit − PINCit = αi + νt + β0 GSPit + β1Dk
it +β2Dm
it + β3GSPit · Dkit + β4GSPit · Dm
it + εit . Dkit is a measure of intrastate deregulation: Either Dm&a or
Dnovo. Dmit is a measure of interstate deregulation: Either Dinter or Dreci. β1, β2, αi, and νt are not re-
ported. See Table II for variable definitions. We split states into three equal-sized groups accordingto this measure (“High,” “Low,” and “Middle”) and say that small businesses are relatively moreprevalent in a state if it belongs to the High group. We estimate the coefficients for the pooledMiddle and Low groups and perform a simple t-test for the equality of these coefficients and thecorresponding coefficients of the High group. The sample is 1970–2001. District of Columbia andthe states of Delaware and South Dakota are excluded. GLS clustering-robust standard deviationsare in parentheses. Coefficients and standard deviations are multiplied by 100. The number ofobservations in each group is 512.
High Middle Low
(1) (2) (3) (4) (5) (6) t-test
GSP 37.9 37.0 47.5 47.8 51.2 48.8(5.6) (5.9) (4.0) (3.3) (3.8) (3.3)
Intrastate DeregulationGSP · Dm&a 13.8 – 1.1 – −7.4 – 1.9
(8.0) – (4.1) – (6.1) –GSP · Dnovo – 18.9 – −0.8 – −2.2 2.3
– (8.5) – (3.8) – (5.5)
Interstate DeregulationGSP · Dinter – 10.1 – 5.0 – 15.1 0.2
– (4.7) – (3.4) – (5.7)GSP · Dreci 15.2 – 6.2 – 25.8 – 0.1
(6.0) – (5.9) – (7.0) –R2 0.64 0.65 0.64 0.64 0.62 0.61
banking deregulation is still a significant predictor of income insurance whenwe simultaneously allow for either a measure of lending technology or a mea-sure of national mortgage market integration.
Banking deregulation was occurring at about the same time improve-ments in technology were making it possible to lend at greater distances. InTable VII, we therefore add a measure of the efficiency of lending technology,TECH, to the regressions that estimate the effect of deregulation for the full sam-ple of states. The first column of Table VII shows that lending technology is asignificant predictor of income insurance. However, when we include either pairof bank deregulation measures, deregulation remains significant while lendingtechnology becomes insignificant. The point estimate for lending technology iseven negative, which is likely a reflection of too high a correlation with thebanking deregulation variables.
Alternatively, when we include a measure of mortgage market integration,MBS, which does not vary by state, the coefficient is clearly significant; refer tocolumn (4). The estimated impact of mortgage market integration is not robust

2794 The Journal of Finance
Table VIIBanking Deregulation and Income Insurance: Robustness to Other
Market DevelopmentsThe results are from the following GLS regression: GSPit − PINCit = αi + νt + β0GSPit + β1Dk
it +β2Dm
it + β3GSPit · Dkit + β4GSPit · Dm
it + β5Xit + β6GSPit · Xit + εit . Xit is TECHit in the first three columnsand MBSit in columns four to six. Dk
it is a measure of intrastate deregulation: Either Dm&a or Dnovo. Dmit
is a measure of interstate deregulation: Either Dinter or Dreci. β1, β2, αi, and νt are not reported. SeeTable II for variable definitions. The sample is 1970–2001. District of Columbia and the states ofDelaware and South Dakota are excluded. GLS clustering-robust standard deviations in paren-theses. Coefficients and standard deviations are multiplied by 100. The number of observations is1,536.
(1) (2) (3) (4) (5) (6)
GSP 50.9 43.8 44.2 53.0 44.7 48.8(1.9) (2.9) (2.7) (2.0) (4.7) (3.9)
Intrastate DeregulationGSP · Dm&a – 3.4 – – 3.6 –
– (3.7) – – (4.2) –GSP · Dnovo – – 5.5 – – 4.2
– – (3.6) – – (4.0)
Interstate DeregulationGSP · Dinter – – 10.4 – – 2.3
– – (3.1) – – (4.8)GSP · Dreci – 18.4 – – 15.0 –
– (4.9) – – (8.3) –
Alternative MeasuresGSP · TECH 29.3 −18.4 −7.9 – – –
(12.1) (18.6) (18.7) – – –GSP · MBS – – – 0.5 0.0 0.3
– – – (0.1) (0.3) (0.2)R2 0.59 0.63 0.63 0.61 0.63 0.62
to the inclusion of the banking deregulation variables. In column (5), where theDm&a and Dreci variables are included, the measure of mortgage market integra-tion is insignificant while the point estimate for Dreci is very close to that foundin Table IV, although the estimate now is only borderline significant at the 5%level due to a higher standard deviation. Using the Dnovo and Dinter measures,MBS becomes larger and nearly significant, while the banking deregulation vari-ables become smaller and statistically insignificant.
Our results suggest that it is difficult to separate the effect of banking dereg-ulation from other trending variables. During our sample period, states’ statuschanged from regulated to deregulated, with no state moving in the opposite di-rection. Therefore, our bank integration measures are correlated with a trend.We examine how robust the results are to the inclusion of a quadratic trend.
Including the trend in Table VIII, we see from columns (1) to (4) that theestimated coefficients of the intrastate deregulation variables remain positivebut become insignificant, while Dinter turns negative and Dreci retains its order

Effects of Deregulation of U.S. Banking 2795
Table VIIIBanking Deregulation and Income Insurance: Robustness to a TrendThe results are from the following GLS regression: GSPit − PINCit = αi + β0GSPit + β1Dk
it + β2Dmit +
β3GSPit · Dkit + β4GSPit · Dm
it + β5t + β6 t2 + εit . Dkit is a measure of intrastate deregulation: Either Dm&a
or Dnovo. Dmit is a measure of interstate deregulation: Either Dinter or Dreci. β1, β2, and αi are not
reported. See Table II for variable definitions. The sample is 1970–2001. District of Columbia andthe states of Delaware and South Dakota are excluded. GLS clustering-robust standard deviationsare in parentheses. Coefficients and standard deviations are multiplied by 100. The number ofobservations is 1,536.
(1) (2) (3) (4) (5) (6)
GSP 48.9 47.9 52.6 44.9 44.2 49.8(3.1) (2.6) (2.6) (3.1) (4.0) (3.3)
Intrastate DeregulationGSP · Dm&a 3.3 – – – 1.1 –
(4.7) – – – (4.1) –GSP · Dnovo – 5.6 – – – 6.3
– (4.6) – – – (4.4)
Interstate DeregulationGSP · Dinter – – −3.4 – – −4.9
– – (4.3) – – (3.9)GSP · Dreci – – – 16.9 16.7 –
– – – (8.2) (7.8) –
Quadratic TrendGSP · TREND 0.9 0.9 1.2 0.3 0.3 1.1
(0.2) (0.2) (0.3) (0.4) (0.4) (0.3)GSP · TREND2 −0.1 −0.1 −0.1 −0.1 −0.1 −0.1
(0.0) (0.0) (0.0) (0.0) (0.0) (0.0)R2 0.64 0.65 0.63 0.65 0.65 0.64
of magnitude and remains significant. Including both intrastate and interstatederegulation variables does not change the results much.
The trend in risk sharing is a function of underlying changes in the economyand deregulation itself is likely to be a partial explanation for this trend. Theresults so far, however, leave doubt about the importance of banking deregula-tion given the other potential explanations. If intrastate banking deregulationis important we should see a stronger impact where small businesses are moreprevalent, even in the presence of a trend. We turn to that question next.
Table IX shows that intrastate branching deregulation had a strong positiveeffect in states with many small businesses. The result is robust to trending andthe effect of branching deregulation is significantly larger than in other states.The estimated impact of deregulation is negative in the two other groups ofstates, even significantly so for states with few small businesses in the caseof Dm&a. The negative coefficient estimate is due to the correlation with thetrend. The important finding is that the intrastate deregulation variables havedisproportionately larger impacts in states with many small businesses, andthis result is clearly statistically significant with a t-value of 2.6 for each of the

2796 The Journal of Finance
Table IXBanking Deregulation and Income Insurance in States with High,
Middle, and Low Prevalence of Small Businesses: Robustnessto a Trend
The results are from the following GLS regression: GSPit − PINCit = αi + β0GSPit + β1Dkit + β2Dm
it +β3GSPit · Dk
it + β4GSPit · Dmit + β5 t + β6 t2 + εit . Dk
it is a measure of intrastate deregulation: EitherDm&a or Dnovo. Dm
it is a measure of interstate deregulation: Either Dinter or Dreci. β1, β2, and αi arenot reported. See Table II for variable definitions. The sample is 1970–2001. District of Columbiaand the states of Delaware and South Dakota are excluded. GLS clustering-robust standard devia-tions are in parentheses. Coefficients and standard deviations are multiplied by 100. The numberof observations is 1,536.
High Middle Low
(1) (2) (3) (4) (5) (6) t-test
GSP 34.0 36.9 52.2 53.5 50.0 62.4(6.7) (6.9) (4.7) (3.6) (8.7) (4.5)
Intrastate DeregulationGSP · Dm&a 16.0 – −3.8 – −11.6 – 2.6
(8.6) – (4.0) – (4.7) –GSP · Dnovo – 21.4 – −0.8 – −3.2 2.6
– (8.7) – (3.7) – (4.5)
Interstate DeregulationGSP · Dinter – 3.8 – −9.2 – −13.4 1.9
– (6.8) – (5.0) – (8.9)GSP · Dreci 16.3 – −3.0 – 33.8 – 0.8
(9.2) – (10.4) – (18.6) –
Quadratic TrendGSP · TREND 0.0 0.5 1.0 1.2 0.2 1.9
(0.6) (0.6) (0.6) (0.4) (0.9) (0.6)GSP · TREND2 −0.2 −0.2 −0.1 −0.0 −0.1 −0.1
(0.0) (0.0) (0.0) (0.0) (0.1) (0.0)R2 0.69 0.70 0.65 0.65 0.63 0.63
intrastate deregulation variables. As found in Table V, the interstate branchingvariables do not have significantly different impacts in states with many or fewsmall businesses. The point estimates for the interstate variables seem noisy inthis table, but the overall message is that the impact of intrastate deregulationon income insurance in states with many small businesses is robust to theinclusion of a trend.
In untabulated robustness tests we examine whether the results hold if thesmall and more volatile oil states, Alaska and Wyoming, are dropped from thesample.41 The estimated coefficients become more sensitive to the inclusionof a trend when Alaska and Wyoming are omitted. This obtains because thetwo states are influential observations and the trend is highly correlated withthe interstate deregulation variables in particular. When we drop these two
41 The full set of results may be found in Demyanyk, Ostergaard, and Sørensen (2006).
Effects of Deregulation of U.S. Banking 2797
states, the results are similar to those that obtain with these states, exceptthat all banking deregulation variables become insignificant when a quadratictrend is included. However, our main result, that intrastate banking dereg-ulation had a disproportionately large and positive effect on risk sharing instates with many small businesses, holds whether a trend is included or not.In fact, the null hypothesis that states with many small businesses obtainno more risk sharing than other states is rejected with even higher levels ofsignificance when Alaska and Wyoming are excluded. Also, the sensitivity ofproprietors’ income to output shocks is robust to the exclusion of Alaska andWyoming.
Furthermore, we run regressions using OLS estimation. In contrast to theGLS estimates, the OLS estimates are unweighted and therefore give largerweight to smaller states. The OLS estimates are more noisy than the GLSestimates but our conclusions hold using this simple estimator. Overall, the OLSresults are very similar to the GLS results, and the estimated stronger impactof deregulation in states with more small businesses is even more significantwhen OLS is used.
E. Banking Deregulation and the Sensitivity of Proprietors’ Incomeand Other Income Categories to GSP Fluctuations
A different way of examining whether risk sharing increased after bankingreform is to consider if proprietors’ income became less correlated with state-specific output shocks following banking reform. In Table X, we show the resultsof regressions of proprietors’ income on output shocks allowing for fixed effectsand interactions with deregulations variables. We interpret the results as re-flecting risk sharing although state-level output is not a direct endowmentshock for proprietors; nonetheless, a lower co-movement of proprietors’ incomewith output following banking deregulation is likely to at least partly reflectincreased income insurance. The coefficient on GSP in column (1) of Table Xshows that before banking reform a 1% drop in state-specific output would beassociated with a 2.88% drop in proprietors’ income on average, that is, state-specific proprietors’ income is more volatile than output. The predicted impactafter “full” banking deregulation (where both Dm&a and Dreci are equal to unity)is that a one-percentage point fall in state-specific output is associated withonly a 0.2% drop in proprietors’ income (288.4% − 204.0% − 65.8% of 1%).The estimates have large standard errors but both Dm&a and Dreci are signifi-cant at the conventional 5% level. The results are similar using the alternativeset of banking deregulation variables in column (2). The high level of signifi-cance of the measures of banking deregulation is unaffected by the inclusionof a quadratic trend. In columns (5) and (6), we examine whether wage growthbecame less correlated with output shocks following deregulation. The pointestimates imply that intrastate banking deregulation increased the correlationof wages with output shocks while interstate deregulation lowered the correla-tion by a similar amount, implying a zero overall effect. We do not investigatethis somewhat puzzling result further because the impact on wage smoothing
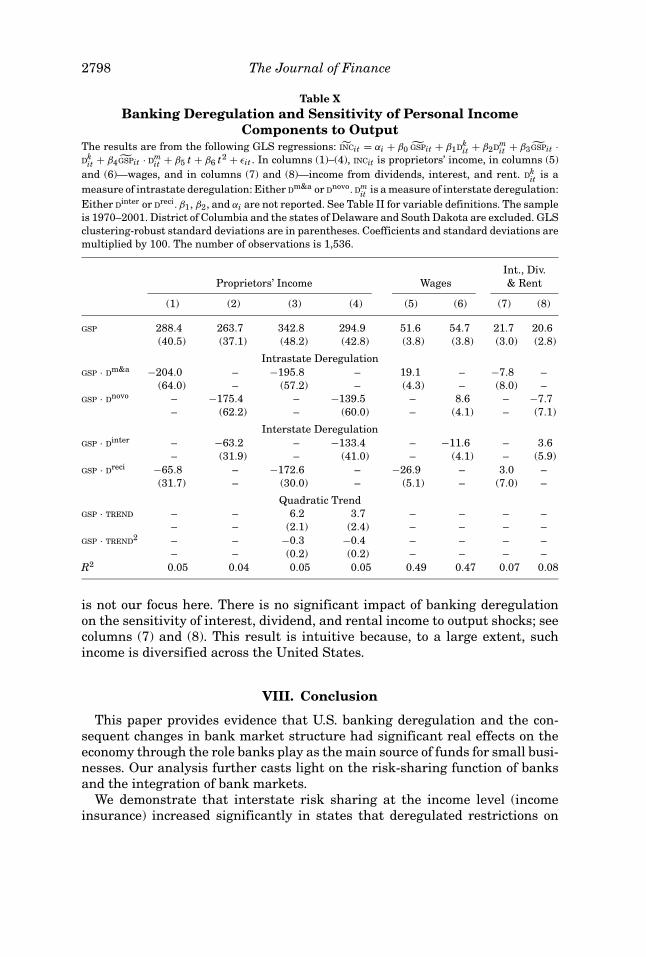
2798 The Journal of Finance
Table XBanking Deregulation and Sensitivity of Personal Income
Components to OutputThe results are from the following GLS regressions: INCit = αi + β0 GSPit + β1Dk
it + β2Dmit + β3GSPit ·
Dkit + β4GSPit · Dm
it + β5 t + β6 t2 + εit . In columns (1)–(4), INCit is proprietors’ income, in columns (5)and (6)—wages, and in columns (7) and (8)—income from dividends, interest, and rent. Dk
it is ameasure of intrastate deregulation: Either Dm&a or Dnovo. Dm
it is a measure of interstate deregulation:Either Dinter or Dreci. β1, β2, and αi are not reported. See Table II for variable definitions. The sampleis 1970–2001. District of Columbia and the states of Delaware and South Dakota are excluded. GLSclustering-robust standard deviations are in parentheses. Coefficients and standard deviations aremultiplied by 100. The number of observations is 1,536.
Int., Div.Proprietors’ Income Wages & Rent
(1) (2) (3) (4) (5) (6) (7) (8)
GSP 288.4 263.7 342.8 294.9 51.6 54.7 21.7 20.6(40.5) (37.1) (48.2) (42.8) (3.8) (3.8) (3.0) (2.8)
Intrastate DeregulationGSP · Dm&a −204.0 – −195.8 – 19.1 – −7.8 –
(64.0) – (57.2) – (4.3) – (8.0) –GSP · Dnovo – −175.4 – −139.5 – 8.6 – −7.7
– (62.2) – (60.0) – (4.1) – (7.1)
Interstate DeregulationGSP · Dinter – −63.2 – −133.4 – −11.6 – 3.6
– (31.9) – (41.0) – (4.1) – (5.9)GSP · Dreci −65.8 – −172.6 – −26.9 – 3.0 –
(31.7) – (30.0) – (5.1) – (7.0) –
Quadratic TrendGSP · TREND – – 6.2 3.7 – – – –
– – (2.1) (2.4) – – – –GSP · TREND2 – – −0.3 −0.4 – – – –
– – (0.2) (0.2) – – – –R2 0.05 0.04 0.05 0.05 0.49 0.47 0.07 0.08
is not our focus here. There is no significant impact of banking deregulationon the sensitivity of interest, dividend, and rental income to output shocks; seecolumns (7) and (8). This result is intuitive because, to a large extent, suchincome is diversified across the United States.
VIII. Conclusion
This paper provides evidence that U.S. banking deregulation and the con-sequent changes in bank market structure had significant real effects on theeconomy through the role banks play as the main source of funds for small busi-nesses. Our analysis further casts light on the risk-sharing function of banksand the integration of bank markets.
We demonstrate that interstate risk sharing at the income level (incomeinsurance) increased significantly in states that deregulated restrictions on
Effects of Deregulation of U.S. Banking 2799
banks’ ability to operate branching networks or holding companies within orbetween states. We hypothesize that this effect works in large part throughsmall businesses because of the intertwining of the personal finances of bank-dependent small business owners with the finances of their firms. We find twosets of results consistent with this hypothesis. First, we show that the positiveeffect of deregulation on income insurance is significantly stronger in statesin which small businesses are more important, as measured in terms of shareof employment. Second, we show that proprietors’ income is considerably lesssensitive to output shocks following banking deregulation. We conjecture thatthe changes in the U.S. banking industry that have led to an improvement inincome insurance are due to improved efficiency in lending to small businessesafter deregulation and to improved efficiency of interbank capital allocation.
REFERENCESAgronin, Eugene, 2003, Risk-sharing across the United States, proprietary income, and the busi-
ness cycle, Working paper, Harvard University.Allen, Franklin, and Douglas Gale, 2000, Comparing Financial Systems (MIT Press, Cambridge
and London).Amel, Dean F., 1993, State laws affecting the geographic expansion of commercial banks,
manuscript, Board of Governors of the Federal Reserve System.Amel, Dean F., and J. Nellie Liang, 1992, The relationship between entry into banking markets
and changes in legal restrictions on entry, Antitrust Bulletin Fall 37, 631–649.Ang, James S., 1992, On the theory of finance for privately held firms, Journal of Small Business
Finance 1, 185–203.Asdrubali, Pierfederico, Bent E. Sørensen and Oved Yosha, 1996, Channels of interstate risk shar-
ing: United States 1963–1990, Quarterly Journal of Economics 111, 1081–1110.Ashcraft, Adam, 2006, New evidence on the lending channel, Journal of Money, Credit and Banking
38, 751–775.Atkeson, Andrew, and Tamim Bayoumi, 1993, Do private capital markets insure regional risk?
Evidence from the United States and Europe, Open Economics Review IV, 303–324.Avery, Robert B., Raphael W. Bostic, and Kathrine A. Samolyk, 1999, The role of personal wealth
in small business finance, Journal of Banking and Finance 22, 1019–1061.Berger, Allen N., Seth D. Bonime, Lawrence Goldberg, and Lawrence J. White, 1999, The dynamics
of market entry: The effects of mergers and acquisitions on de novo entry in banking, Proceed-ings of the 35th Annual Conference on Bank Structure and Competition. Federal Reserve Bankof Chicago, Chicago, Illinois.
Berger, Allen N., Nathan H. Miller, Mitchell A. Petersen, Raghuram G. Rajan, and Jeremy C. Stein,2005, Does function follow organizational form? Evidence from the lending practices of largeand small banks, Journal of Financial Economics 76, 237–269.
Berger, Allen N., and Gregory F. Udell, 1998, The economics of small business finance: The roles ofprivate equity and debt markets in the financial growth cycle, Journal of Banking and Finance22, 613–673.
Bertrand, Marianne, Esther Duflo, and Sendhil Mullinaithan, 2004, How much should we trustdifference-in-differences estimators? Quarterly Journal of Economics 119, 249–276.
Besanko, David, and Anjan V. Thakor, 1987, Collateral and rationing: Sorting equilibria in monop-olistic and competitive credit markets, International Economic Review 28, 671–689.
Bester, Helmut, 1985, Screening vs. rationing in credit markets with imperfect information, Amer-ican Economic Review 75, 850–855.
Black, Sandra E., and Philip E. Strahan, 2002, Entrepreneurship and bank credit availability,Journal of Finance 57, 2807–2833.

2800 The Journal of Finance
Boot, Arnoud W. A., 2000, Relationship banking: What do we know? Journal of Financial Interme-diation 9, 7–25.
Boot, Arnoud W. A., and Anjan V. Thakor, 2000, Can relationship banking survive competition?Journal of Finance 55, 679–713.
Braumoeller, Bear F., 2004, Hypothesis testing and multiplicative interaction terms, InternationalOrganization 58, 807–820.
Crucini, Mario J., 1999, International and national dimensions of risk sharing, Review of Economicsand Statistics 81, 73–84.
Demsetz, Rebecca S., and Philip E. Strahan, 1997, Diversification, size, and risk at bank holdingcompanies, Journal of Money, Credit and Banking 29, 300–313.
Demyanyk, Yuliya, Charlotte Ostergaard, and Bent E. Sørensen, 2006, Banking deregulation, smallbusinesses, and interstate insurance of personal income, CEPR Discussion Paper 5863.
DeYoung, Robert, 1998, Comment on: De novo banks and lending to small businesses: An empiricalanalysis, Journal of Banking and Finance 22, 868–872.
Diamond, Douglas, 1984, Financial intermediation and delegated monitoring, Review of EconomicStudies 51, 393–414.
Diamond, Douglas, 1991, Monitoring and reputation: The choice between bank loans and directlyplaced debt, Journal of Political Economy 99, 689–721.
Dick, Astrid A., 2006, Nationwide branching and its impact on market structure, quality and bankperformance, Journal of Business 79, 567–592.
Franks, Julian R., and Oren Sussman, 2005, Financial distress and bank restructuring of small tomedium size U.K. companies, Review of Finance 9, 65–96.
Goldberg, Lawrence G., and Lawrence J. White, 1998, De novo banks and lending to small busi-nesses: An empirical analysis, Journal of Banking and Finance 22, 851–867.
Heuson, Andrea J., Wayne Passmore, and Roger Sparks, 2001, Credit scoring and mortgage securi-tization: Implications for mortgage rates and credit availability, Journal of Real Estate Financeand Economics 23, 337–63.
Holmstrom, Bengt, and Jean Tirole, 1997, Financial intermediation, loanable funds, and the realsector, Quarterly Journal of Economics 112, 663–691.
Houston, Joel F., and Christopher James, 1998, Do bank internal capital markets promote lending?Journal of Banking and Finance 22, 899–918.
Houston, Joel F., Christopher James, and David Marcus, 1997, Capital market frictions and therole of internal capital markets in banking, Journal of Financial Economics 46, 135–164.
Jayaratne, Jith, and Philip E. Strahan, 1996, The finance-growth nexus: Evidence from bankbranch deregulation, Quarterly Journal of Economics 111, 639–670.
Jayaratne, Jith, and Philip E. Strahan, 1998, Entry restrictions, industry evolution and dynamicinefficiency: Evidence from commercial banking, Journal of Law and Economics 49, 239–274.
Kashyap, Anil K., and Jeremy C. Stein, 2000, What do a million observations on banks say aboutthe transmission of monetary policy? American Economic Review 90, 407–428.
Kolari, James W., Donald R. Fraser, and Ali Anari, 1998, The effect of securitization on mortgagemarket yields: A cointegration analysis, Journal of Real Estate Economics 26, 677–693.
Kroszner, Randall, and Philip E. Strahan, 1999, What drives deregulation? Economics and poli-tics of relaxation of bank branching restrictions, Quarterly Journal of Economics 114, 1437–1467.
Leland, Hayne E., and David H. Pyle, 1977, Informational asymmetries, financial structure, andfinancial intermediation, Journal of Finance 32, 371–387.
McLaughlin, Susan, 1995, The impact of interstate banking and branching reform: Evidence fromthe States, Current Issues in Economics and Finance. Federal Reserve Bank of New York 1,1–6.
Melitz, Jacques, and Frederic Zumer, 1999, Interregional and international consumption risk shar-ing and lessons for EMU, Carnegie-Rochester Conference Series on Public Policy 51, 149–188.
Morgan, Donald P., Bertrand Rime, and Philip E. Strahan, 2004, Bank integration and state busi-ness cycles, Quarterly Journal of Economics 119, 1555–1584.
Ostergaard, Charlotte, 2001, External financing costs and banks’ loan supply: Does the structureof the bank sector matter? Working paper, Norwegian School of Management.
Effects of Deregulation of U.S. Banking 2801
Peek, Joe, and Eric S. Rosengren, 1998, Bank consolidation and small business lending: It’s notjust bank size that matters, Journal of Banking and Finance 122, 799–819.
Pennacchi, George G., 1988, Loan sales and the cost of bank capital, Journal of Finance 43, 375–396.Petersen, Mitchell A., and Raghuram G. Rajan, 1994, The benefits of lending relationships: Evi-
dence from small business data, Journal of Finance 49, 3–37.Petersen, Mitchell A., and Raghuram G. Rajan, 1995, The effects of credit market competition on
lending relationships, Quarterly Journal of Economics 110, 407–443.Petersen, Mitchell A., and Raghuram G. Rajan, 2002, Does distance still matter? The information
revolution in small business lending, Journal of Finance 57, 2533–2570.Rajan, Raghuram G., 1992, Insiders and outsiders: The choice between informed and arm’s-length
debt, Journal of Finance 47, 1367–1400.Sala-i-Martin, Xavier, and Jeffrey Sachs, 1992, Fiscal federalism and optimum currency areas:
Evidence for Europe from the United States, in P. Masson M. Canzoneri and V. Grilli, eds.: Es-tablishing a Central Bank: Lessons in Europe and Lessons from the U.S. (Cambridge UniversityPress, London).
Sharpe, Steven A., 1990, Asymmetric information, bank lending, and implicit contracts: A stylizedmodel of customer relationships, Journal of Finance 35, 1069–1087.
Sørensen, Bent E., Yi-Tsung Wu, Oved Yosha, and Yu Zhu, 2007, Home bias and internationalrisk sharing: Twin puzzles separated at birth, Journal of International Money and Finance 26,587–605.
Strahan, Philip E., and James P. Weston, 1998, Small business lending and the changing structureof the banking industry, Journal of Banking and Finance 122, 821–845.
Wirtz, Ronald A., 2005, Community banks full of change, Fedgazette, Federal Reserve Bank ofMinneapolis, January.
Wolken, John D., 1998, “New” data sources for research on small business finance, Journal ofBanking and Finance 22, 1067–1076.