
US AUTO INDUSTRY - bbvaresearch.com · Disruptive trends transforming the auto industry Source:...
32
AUTO INDUSTRY US 1Q 2018 CHARTBOOK
-
Upload
vuongkhuong -
Category
Documents
-
view
216 -
download
0
Transcript of US AUTO INDUSTRY - bbvaresearch.com · Disruptive trends transforming the auto industry Source:...

AUTO
INDUSTRY
US
1Q 2018
CHARTBOOK

Key Messages
2
1. Economic fundamentals and financial conditions remain
supportive of demand
2. However, increasing off-lease returns will continue to exert
downward pressures on sales and prices of new vehicles
3. The structural shift towards light-trucks has kept transaction
prices high, supporting profitability
4. Sales of electric vehicles hit a record in 2017; a substitution
effect between hybrids and plug-ins is taking place
5. Autonomous driving, shared mobility, connectivity and
electrification will transform the industry in the following years

SALES

Sales
Source: BBVA Research and Haver Analytics 4
U.S. Total light weight vehicle sales (SAAR, million units)
0
5
10
15
20
25
2004 2005 2006 2007 2008 2009 2010 2011 2012 2013 2014 2015 2016 2017 2018
Total Domestic Imported
Feb-18 = 17.1 Avg. 2004-2007 = 16.6

Sales
Source: BBVA Research and Haver Analytics 5
U.S. Total vehicle sales (SAAR, million units)
0.0
0.1
0.2
0.3
0.4
0.5
0.6
0
2
4
6
8
10
12
14
2004 2005 2006 2007 2008 2009 2010 2011 2012 2013 2014 2015 2016 2017 2018
Cars Light trucks Medium and heavy trucks (right axis)

Sales
Source: BBVA Research and Haver Analytics 6
U.S. Total vehicle sales (Share of total)
0%
10%
20%
30%
40%
50%
60%
70%
80%
2004 2005 2006 2007 2008 2009 2010 2011 2012 2013 2014 2015 2016 2017 2018
Cars Trucks

Sales
Source: BBVA Research and Bloomberg 7
U.S. Auto dealers: revenue (Year-over-year % change, 4Q moving average)
0
5
10
15
20
25
New Vehicle Sales Used Vehicle Sales Parts & Service

Sales
Source: BBVA Research and Haver Analytics 8
U.S. Domestic auto inventory/sales ratio (Seasonally adjusted)
0.0
0.5
1.0
1.5
2.0
2.5
3.0
3.5
4.0
4.5
5.0
2004 2005 2006 2007 2008 2009 2010 2011 2012 2013 2014 2015 2016 2017 2018

Sales
Source: BBVA Research and Bloomberg 9
U.S. Sales growth by brand and market share (2017, yoy % change and % market share)
-10
-5
0
5
-5 0 5
Q3
Q4
Share
0.5
1.0
1.5
2.0
Brand
Audi
BMW
Land Rover
Mazda
Mercedes-Benz
Mini
Mitsubishi
Porsche
VolksWagen
Volvo
-10
-5
0
5
-5 0 5
Q3
Q4
Share
5
10
15
Brand
Fiat Chrysler
Ford
GM
Hyundai
Kia
Subaru
Toyota

Prices
Source: BBVA Research and Haver Analytics 10
U.S. Consumer price index: cars and trucks (yoy % change)
-15%
-10%
-5%
0%
5%
10%
15%
20%
2007 2008 2009 2010 2011 2012 2013 2014 2015 2016 2017
New Used

Prices
Source: BBVA Research, Haver Analytics and Bloomberg 11
U.S. Auto Prices
25,000
30,000
35,000
40,000
90
95
100
105
110
115
120
125
130
135
140
2007 2008 2009 2010 2011 2012 2013 2014 2015 2016 2017 2018
Manheim used vehicles value index Edmunds Vehicle True Market Value (right axis)

Financial conditions
Source: BBVA Research and Haver Analytics 12
U.S. Interest rates (yoy % change)
2
3
4
5
6
7
8
2010 2011 2012 2013 2014 2015 2016 2017 2018
48-month new car loan 36-month used car loan 60-month new car

Financial conditions
Source: BBVA Research and Haver Analytics 13
0
20
40
60
80
100
120
140
160
2007 2008 2009 2010 2011 2012 2013 2014 2015 2016 2017
U.S. Newly originated installment auto loans ($ billion, eop, 4-qtr moving avg.)
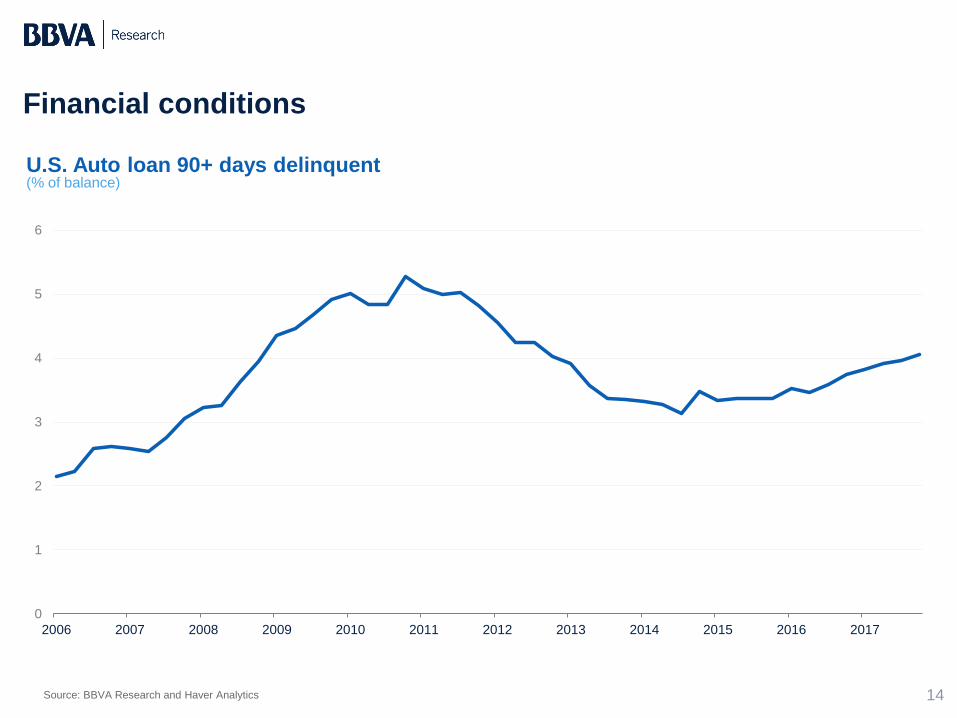
Financial conditions
Source: BBVA Research and Haver Analytics 14
U.S. Auto loan 90+ days delinquent (% of balance)
0
1
2
3
4
5
6
2006 2007 2008 2009 2010 2011 2012 2013 2014 2015 2016 2017
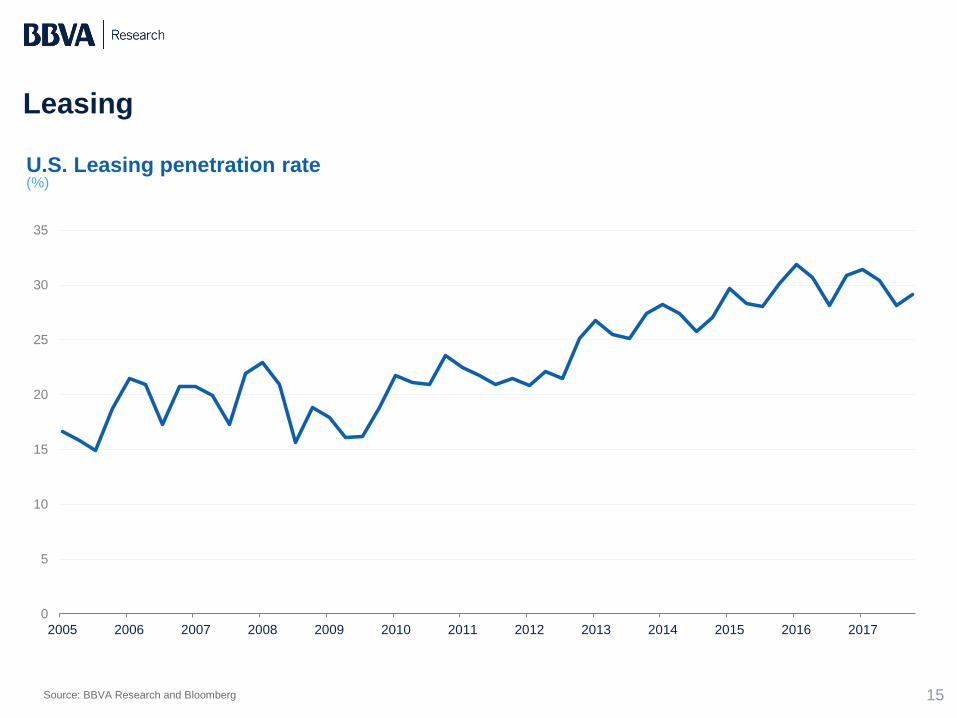
Leasing
Source: BBVA Research and Bloomberg 15
0
5
10
15
20
25
30
35
2005 2006 2007 2008 2009 2010 2011 2012 2013 2014 2015 2016 2017
U.S. Leasing penetration rate (%)

Leasing
*Assumes 36-month lease terms
Source: BBVA Research and Bloomberg 16
2.81
3.21
4.01
4.45
4.98
5.35
0
1
2
3
4
5
6
2014 2015 2016 2017f 2018f 2019f
Off-Lease returns and supply* (Fiscal years, millions units)
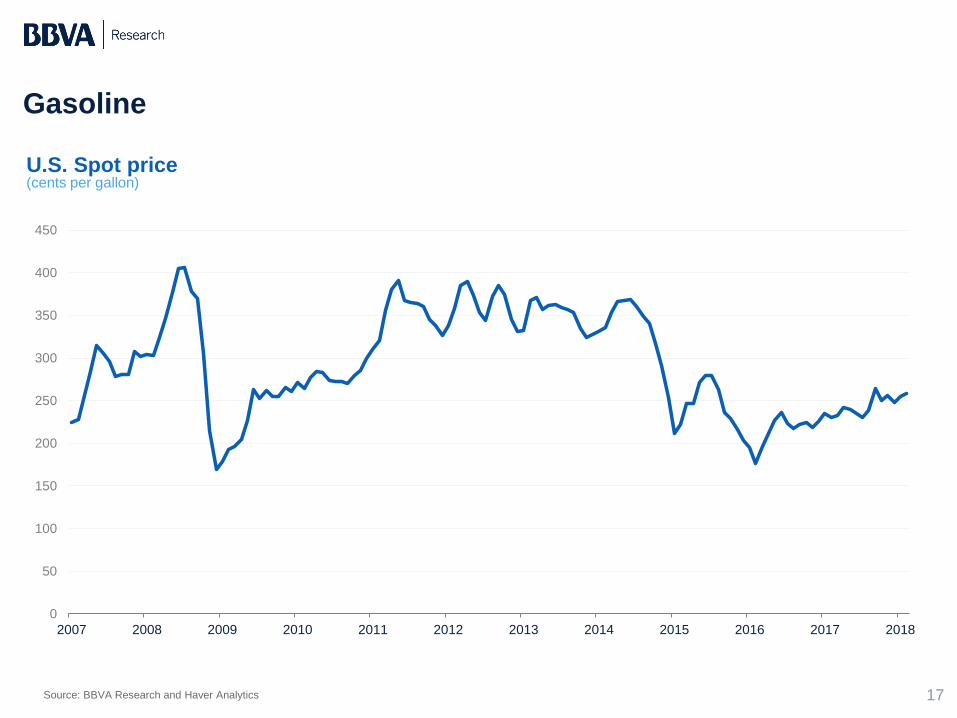
Gasoline
Source: BBVA Research and Haver Analytics 17
0
50
100
150
200
250
300
350
400
450
2007 2008 2009 2010 2011 2012 2013 2014 2015 2016 2017 2018
U.S. Spot price (cents per gallon)

CONSUMERS

Consumers
Source: BBVA Research and Haver Analytics 19
U.S. Consumer sentiment index
0
20
40
60
80
100
120
140
2007 2008 2009 2010 2011 2012 2013 2014 2015 2016 2017 2018
Current economic conditions Consumer expectations

Consumers
Source: BBVA Research and Haver Analytics 20
U.S. Plans to buy a car within 6 months (% of respondents)
8
9
10
11
12
13
14
2007 2008 2009 2010 2011 2012 2013 2014 2015 2016 2017

Consumers
Source: BBVA Research and Haver Analytics 21
U.S. Employment and real disposable personal income (yoy % change)
-6%
-4%
-2%
0%
2%
4%
6%
2007 2008 2009 2010 2011 2012 2013 2014 2015 2016 2017
Real disposable personal income Nonfarm payroll Average RDI 2010 - 1Q18

Consumers
Source: BBVA Research and Haver Analytics 22
U.S. Household equity and home prices
-12%
-10%
-8%
-6%
-4%
-2%
0%
2%
4%
6%
8%
10%
0
2000
4000
6000
8000
10000
12000
14000
16000
2007 2008 2009 2010 2011 2012 2013 2014 2015 2016 2017
Owners equity in real estate (NSA billion $, left axis) FHFA house price index (yoy change, right axis)

PRODUCTION
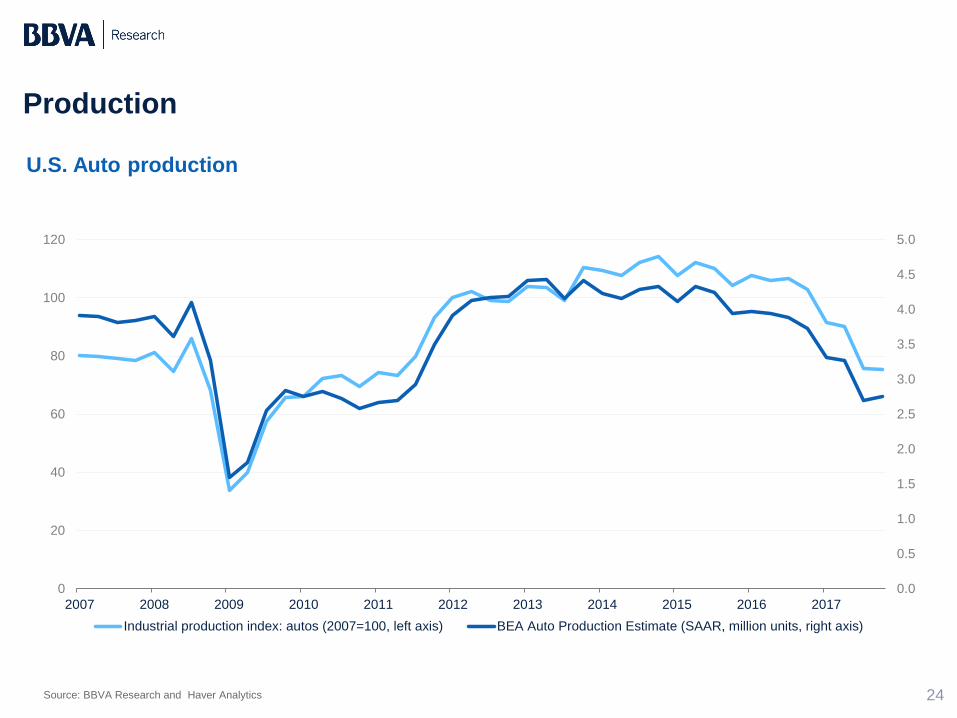
Production
Source: BBVA Research and Haver Analytics 24
0.0
0.5
1.0
1.5
2.0
2.5
3.0
3.5
4.0
4.5
5.0
0
20
40
60
80
100
120
2007 2008 2009 2010 2011 2012 2013 2014 2015 2016 2017
Industrial production index: autos (2007=100, left axis) BEA Auto Production Estimate (SAAR, million units, right axis)
U.S. Auto production

STRUCTURAL

Fundamentals
Source: BBVA Research and Haver Analytics 26
8.0
8.5
9.0
9.5
10.0
10.5
11.0
11.5
12.0
19
99
20
00
20
01
20
02
20
03
20
04
20
05
20
06
20
07
20
08
20
09
20
10
20
11
20
12
20
13
20
14
20
15
20
16
2016: 11.6
Mean age of passenger cars in operation (years)
Vehicle miles of travel (total and adjusted by labor force)
0
500000
1000000
1500000
2000000
2500000
3000000
3500000
0
2000
4000
6000
8000
10000
12000
14000
19
76
19
79
19
82
19
85
19
88
19
91
19
94
19
97
20
00
20
03
20
06
20
09
20
12
20
15
Millio
n m
iles
Miles p
er
cap
ita
Population adjusted (left axis) Total (right axis)

Demographics
Source: BBVA Research and Haver Analytics 27
0
50
100
150
200
250
300
2010 2013 2016 2019 2022 2025 2028 2031 2034 2037 2040 2043 2046 2049 2052 2055 2058
15-44 years 65 years and over
U.S. Population projections by age (millions)

Electric vehicles
Source: BBVA Research and Haver Analytics 28
U.S. Electric vehicle sales (units)
0
2000
4000
6000
8000
10000
12000
0
5000
10000
15000
20000
25000
30000
35000
40000
Apr-
14
Jun-1
4
Aug-1
4
Oct-
14
De
c-1
4
Feb
-15
Apr-
15
Jun-1
5
Aug-1
5
Oct-
15
De
c-1
5
Feb
-16
Apr-
16
Jun-1
6
Aug-1
6
Oct-
16
De
c-1
6
Feb
-17
Apr-
17
Jun-1
7
Aug-1
7
Oct-
17
De
c-1
7
Hybrids Plug-in Hybrid (right axis) Battery Electric Vehicle (right axis)

Disruptive trends transforming the auto industry
Source: Heineke, Kersten; Moller, Timo; Padhi, Asutosh, and Tschiesner, Andreas (2017), “The automotive revolution is speeding up”,
McKinsey & Company, September. 29
Autonomous Driving
80% of the top OEMs have announced
plans for highly autonomous
technology to be ready for the road by 2025
Shared Mobility
$32 billion had been invested in
ridesharing start-ups alone. US customers
expect usage of shared mobility to increase by around 80%
once robo-taxis are available
Connectivity
The percentage of consumers
ready and willing to
change car brands for better connectivity has
doubled over the past two
years
Electrification
Many mass-market OEMs are planning to add ten or more EV models as they can reach potential sales of up to 600K
units in the next five years

FORECASTS

Forecast
Source: BBVA Research 31
2015 2016 2017 2018 2019 2020 2021 2022
Auto sales (millions units)
17.5 17.5 17.3 16.6 16.8 17.1 17.3 17.3
Real GDP growth (% change)
2.9 1.5 2.3 2.8 2.8 2.5 2.3 2.2
Unemployment rate (% avg.)
5.3 4.9 4.4 3.9 3.6 3.7 4.0 4.3
Fed funds (%, eop)
0.50 0.75 1.5 2.5 3.0 3.0 3.0 3.0
5-year Treasuries (%, avg)
1.5 1.3 1.9 2.7 3.2 3.4 3.6 3.7

AUTO
INDUSTRY
US
1Q 2018
CHARTBOOK