
US ARPORTS REGONAL SERCE Passenger Service in USc.ymcdn.com/sites/ · us arports regonal serce...
17
RAA 2015 Annual Report 40 US AIRPORTS & REGIONAL SERVICE Passenger Service in US (State by State Analysis, including Alaska and Hawaii) MOB HSV BHM MGM MSL DHN PRC YUM PHX AZA GCN PGA FLG TUS SOW IGM GCW IFP FSM XNA TXK LIT ELD JBR HRO HOT ALABAMA Regional only flights (95% and above) Regional/other flights EAS Airline Service Annual Order Expiration Community to hub EAS Rate Number Muscle Shoals, TN SeaPort BNA $1,739, 308 2012-5-17 10/31/16 ARIZONA ARKANSAS Percentage of Regional flights and enplanements for each airport Percentage of Regional flights and enplanements for each airport Percentage of Regional flights and enplanements for each airport Total # of 2014 passengers enplaned Total # of 2014 airline departures Regionals 1,141,324 Regionals 28,028 Industry 2,426,194 Industry 40,265 Regional Share 47% Regional Share 70% BHM Birmingham 52% 31% DHN Dothan 100% 100% HSV Huntsville/Decatur 68% 48% MGM Montgomery 100% 100% MOB Mobile 92% 83% MSL Muscle Shoals 100% 100% Total # of 2014 passengers enplaned Total # of 2014 airline departures Regionals 2,778,452 Regionals 58,044 Industry 2,3442,723 Industry 220,076 Regional Share 12% Regional Share 26% AZA Phoenix 0% 0% FLG Flagstaff 100% 100% GCN Grand Canyon 85% 39% IFP Bullhead City 0% 0% IGM Kingman 100% 100% PGA Page 100% 100% PHX Phoenix 21% 10% PRC Prescott 100% 100% SOW Show Low 100% 100% TUS Tucson 53% 33% YUM Yuma 100% 100% Total # of 2014 passengers enplaned Total # of 2014 airline departures Regionals 987,068 Regionals 26,748 Industry 1,829,363 Industry 34,739 Regional Share 54% Regional Share 77% ELD El Dorado 100% 100% FSM Fort Smith 100% 100% HOT Hot Springs 100% 100% HRO Harrison 100% 100% JBR Jonesboro 100% 100% LIT Little Rock 54% 33% TXK Texarkana 100% 100% XNA Northwest Arkansas 92% 80% EAS Airline Service Annual Order Expiration Community to hub EAS Rate Number Page, AZ Great Lakes DEN/PHX $2,472,028 2015-4-24 04/30/17 Prescott, AZ Great Lakes LAX $2,657,002 2015-5-24 04/30/17 Show Low, AZ Boutique Air PHX $1,243,255 2015-4-13 04/30/17 EAS Airline Service Annual Order Expiration Community to hub EAS Rate Number El Dorado/Camden, AR SeaPort DAL/MEM $1,977,153 2013-8-13 10/31/17 Harrison, AR SeaPort DAL/MEM $2,251,207 2013-8-13 10/31/17 Hot Springs, AR SeaPort MEM/DAL $1,637,012 2013-8-13 10/31/17 Jonesboro, AR Air Choice One STL $1,942,890 2014-2-17 02/28/18
Transcript of US ARPORTS REGONAL SERCE Passenger Service in USc.ymcdn.com/sites/ · us arports regonal serce...

RAA 2015 Annual Report40
US AIRPORTS & REGIONAL SERVICE
Passenger Service in US(State by State Analysis, including Alaska and Hawaii)
MOB
HSV
BHM
MGM
MSL
DHN
PRC
YUM
PHX
AZA
GCN
PGA
FLG
TUS
SOW
IGM
GCWIFP
FSM
XNA
TXK
LIT
ELD
JBR
HRO
HOT
ALABAMA
Regional only flights (95% and above) Regional/other flights
EAS Airline Service Annual Order Expiration Community to hub EAS Rate Number
Muscle Shoals, TN SeaPort BNA $1,739, 308 2012-5-17 10/31/16
ARIZONA
ARKANSAS
Percentage of Regional flights and enplanements for each airport
Percentage of Regional flights and enplanements for each airport
Percentage of Regional flights and enplanements for each airport
Total # of 2014 passengers enplaned Total # of 2014 airline departures Regionals 1,141,324 Regionals 28,028Industry 2,426,194 Industry 40,265Regional Share 47% Regional Share 70%
BHM Birmingham 52% 31%DHN Dothan 100% 100%HSV Huntsville/Decatur 68% 48%
MGM Montgomery 100% 100%MOB Mobile 92% 83%MSL Muscle Shoals 100% 100%
Total # of 2014 passengers enplaned Total # of 2014 airline departures Regionals 2,778,452 Regionals 58,044Industry 2,3442,723 Industry 220,076Regional Share 12% Regional Share 26%
AZA Phoenix 0% 0%FLG Flagstaff 100% 100%GCN Grand Canyon 85% 39%IFP Bullhead City 0% 0%IGM Kingman 100% 100%PGA Page 100% 100%
PHX Phoenix 21% 10%PRC Prescott 100% 100%SOW Show Low 100% 100%TUS Tucson 53% 33%YUM Yuma 100% 100%
Total # of 2014 passengers enplaned Total # of 2014 airline departures Regionals 987,068 Regionals 26,748Industry 1,829,363 Industry 34,739Regional Share 54% Regional Share 77%
ELD El Dorado 100% 100%FSM Fort Smith 100% 100%HOT Hot Springs 100% 100%HRO Harrison 100% 100%
JBR Jonesboro 100% 100%LIT Little Rock 54% 33%TXK Texarkana 100% 100%XNA Northwest Arkansas 92% 80%
EAS Airline Service Annual Order ExpirationCommunity to hub EAS Rate Number
Page, AZ Great Lakes DEN/PHX $2,472,028 2015-4-24 04/30/17Prescott, AZ Great Lakes LAX $2,657,002 2015-5-24 04/30/17Show Low, AZ Boutique Air PHX $1,243,255 2015-4-13 04/30/17
EAS Airline Service Annual Order ExpirationCommunity to hub EAS Rate Number
El Dorado/Camden, AR SeaPort DAL/MEM $1,977,153 2013-8-13 10/31/17Harrison, AR SeaPort DAL/MEM $2,251,207 2013-8-13 10/31/17Hot Springs, AR SeaPort MEM/DAL $1,637,012 2013-8-13 10/31/17Jonesboro, AR Air Choice One STL $1,942,890 2014-2-17 02/28/18

RAA 2015 Annual Report 41
US AIRPORTS & REGIONAL SERVICE
CEC
ACV
STS
OAK
RDD
SJC
CIC
MRY
SMF
MOD
SBP
SMX
SBA
FAT
BFL
BUR
LGB
IYK
ONT
SNA
CLD
PSP
SAN IPL
SFO
LAX
SCK
MCE
VIS
MMH
HHR
VCV
GJT ASE
GUCMTJ
TEX
ALSCEZ DRO
HDN
EGE
COS
DEN
PUB
FNL
APA
BDL
HVN
CALIFORNIA
COLORADO
CONNECTICUT
Percentage of Regional flights and enplanements for each airport
Percentage of Regional flights and enplanements for each airport
Percentage of Regional flights and enplanements for each airport
Regional only flights (95% and above) Regional/other flights
Total # of 2014 passengers enplaned Total # of 2014 airline departures Regionals 10,550,151 Regionals 245,052Industry 94,667,464 Industry 868,508Regional Share 11% Regional Share 28%
ACV Eureka/Arcata 100% 100%BFL Bakersfield 98% 93%BUR Burbank 29% 15%CEC Crescent City 100% 100%CIC Chico 100% 100%CLD Carlsbad 100% 100%FAT Fresno 87% 70%HHR Hawthorne 100% 100%IPL El Centro/Imperial 100% 100%IYK Inyokern 100% 100%LAX Los Angeles 28% 10%LGB Long Beach 29% 17%MCE Merced 100% 100%MMH Mammoth Lakes 100% 100%MOD Modesto 100% 100%MRY Monterey 98% 92%
OAK Oakland 9% 5%ONT Ontario 25% 14%PSP Palm Springs 64% 36%RDD Redding 100% 99%SAN San Diego 16% 6%SBA Santa Barbara 98% 92%SBP San Luis Obispo 100% 100%SCK Stockton 0% 0%SFO San Francisco 27% 10%SJC San Jose 20% 11%SMF Sacramento 23% 11%SMX Santa Maria 88% 45%SNA Orange County 7% 4%STS Santa Rosa 100% 100%VCV Victorville 0% 0%VIS Visalia 100% 100%
Total # of 2014 passengers enplaned Total # of 2014 airline departures Regionals 5,779,710 Regionals 133,143Industry 28,073,018 Industry 301,317Regional Share 21% Regional Share 44%
ALS Alamosa 100% 100%APA Denver 100% 100%ASE Aspen 100% 100%CEZ Cortez 100% 100%COS Colorado Springs 78% 57%DEN Denver 39% 18%DRO Durango 96% 90%EGE Vail/Eagle 38% 20%
FNL Fort Collins 0% 0%GJT Grand Junction 97% 90%GUC Gunnison 80% 62%
HDNSteamboat Springs/Hayden
78% 60%
MTJ Montrose 91% 80%PUB Pueblo 95% 66%TEX Telluride 100% 100%
Total # of 2014 passengers enplaned Total # of 2014 airline departures Regionals 687,303 Regionals 15,775Industry 2,954,473 Industry 34,944Regional Share 23% Regional Share 45%
BDL Hartford 43% 22%BDR Bridgeport 100% 100%GON New London/Groton 100% 100%
HVN New Haven 100% 100%OXC Oxford 100% 100%
EAS Airline Service Annual Order ExpirationCommunity to hub EAS Rate NumberCresent City, CA SkyWest SFO $2,454,084 2014-4-23 07/31/15El Centro, CA SeaPort Airlines SAN/BUR $1,943,751 2013-1-2 04/30/15Merced, CA Great Lakes LAX/LAS/ONT/SNA $1,698,878 2012-9-9 09/30/14Visalia, CA Great Lakes LAX/ONT/SNA $1,697,929 2012-9-9
EAS Airline Service Annual Order ExpirationCommunity to hub EAS Rate NumberAlamosa, CO Great Lakes DEN $2,192,179 2014-6-9 07/31/16Cortez, CO Great Lakes DEN $2,270,297 2104-6-9 07/31/16Pueblo, CO SkyWest DEN $1,737,732 2013-1-19 01/31/16

RAA 2015 Annual Report42
US AIRPORTS & REGIONAL SERVICE
ATL
ABY
CSGMCN
AGS
VLD
BQK
SAV
AHNPDK
PNS VPSTLH
SRQ
PIE
TPA
GNV
JAX
EYW
PGDRSW
SFB
MCO
DAB
MLB
FLLMIA
PBI
ECP
APF
LAL
DSI
BOI
LWS
SUN
TWF
IDA
PIH
FLORIDA
GEORGIA
IDAHO
Percentage of Regional flights and enplanements for each airport
Percentage of Regional flights and enplanements for each airport
Percentage of Regional flights and enplanements for each airport
Regional only flights (95% and above) Regional/other flights
Total # of 2014 passengers enplaned Total # of 2014 airline departures Regionals 3,771,419 Regionals 95,835Industry 72,150,962 Industry 615,407Regional Share 5.0% Regional Share 16%
APF Naples 100% 100%DAB Daytona Beach 37% 22%DSI Destin 100% 100%ECP Panama City 4% 3%EYW Key West 79% 53%FLL Fort Lauderdale 7% 1%GNV Gainesville 93% 84%JAX Jacksonville 48% 28%MCO Orlando 4% 1%MIA Miami 16% 5%MLB Melbourne 42% 20%
PBI West Palm Beach 11% 4%PGD Punta Gorda 0% 0%PIE St. Petersburg 0% 0%PNS Pensacola 61% 36%RSW Fort Myers 9% 3%SFB Orlando-Sanford 0% 0%SRQ Sarasota/Bradenton 29% 16%TLH Tallahassee 77% 56%TPA Tampa 9% 2%UST St. Augustine 4% 0%VPS Fort Walton Beach 70% 50%
Total # of 2014 passengers enplaned Total # of 2014 airline departures Regionals 5,443,444 Regionals 117,583Industry 48,262,010 Industry 444,000Regional Share 11% Regional Share 26%
ABY Albany 100% 100%AGS Augusta 86% 75%AHN Athens 100% 100%ATL Atlanta 23% 10%BQK Brunswick 100% 100%
CSG Columbus 99% 95%MCN Macon 98% 70%PDK Atlanta-Dekalb 100% 100%SAV Savannah 69% 50%VLD Valdosta 100% 100%
Total # of 2014 passengers enplaned Total # of 2014 airline departures Regionals 969,731 Regionals 20,401Industry 1,744,063 Industry 27,207Regional Share 56% Regional Share 75%
SUN Sun Valley 100% 100%BOI Boise 65% 48%IDA Idaho Falls 89% 69%
LWS Lewiston 100% 99%PIH Pocatello 100% 100%TWF Twin Falls 100% 99%
EAS Airline Service Annual Order ExpirationCommunity to hub EAS Rate NumberAthens, GA SeaPort BNA $1,553,093 2012-9-27 09/30/14Macon, GA Silver Airway ATL/MCO $1,998,696 2013-2-26 03/14/15
No scheduled service for Delaware in 2014
DELAWARE

RAA 2015 Annual Report 43
US AIRPORTS & REGIONAL SERVICE
DECSPIUIN
MDW
BMI
ORDRFD
MLI
PIA
CMI
MWA
PWK
BLV
IND
EVV
FWA
SBN
CLU
GYY
SUXFOD
DSM
MCW
ALO
CID
BRL
DBQ
ILLINOIS
INDIANA
IOWA
Percentage of Regional flights and enplanements for each airport
Percentage of Regional flights and enplanements for each airport
Percentage of Regional flights and enplanements for each airport
Regional only flights (95% and above) Regional/other flights
Total # of 2014 passengers enplaned Total # of 2014 airline departures Regionals 13,002,584 Regionals 288,147Industry 45,656,847 Industry 536,741Regional Share 28% Regional Share 54%
DEC Decatur 100% 100%BLV Belleville 1% 0%BMI Bloomington 91% 76%CMI Champaign 100% 100%MDW Chicago-Midway 6% 3%MLI Moline 94% 81%MWA Marion 100% 100%
ORD Chicago-O'Hare 62% 35%PIA Peoria 91% 72%PWK Chicago/Propect Heights 100% 100%RFD Rockford 1% 0%SPI Springfield 90% 71%UIN Quincy 100% 100%
Total # of 2014 passengers enplaned Total # of 2014 airline departures Regionals 1,134,506 Regionals 25,929Industry 1,806,864 Industry 31,484Regional Share 63% Regional Share 82%
ALO Waterloo 100% 100%BRL Burlington 100% 100%CID Cedar Rapids 92% 78%DBQ Dubuque 99% 97%
DSM Des Moines 73% 53%FOD Fort Dodge 100% 100%MCW Mason City 100% 100%SUX Sioux City 92% 77%
EAS Airline Service Annual Order ExpirationCommunity to hub EAS Rate NumberDecatur, IL Air Choice One STL/ORD $2,667,922 2011-12-17 01/31/16Marion/Herrin, IL Cape Air STL $2,104,616 2011-4-12 11/30/15Quincy, IL / Hannibal, MO Cape Air STL $1,956,856 2011-4-12 11/30/15
Total # of 2014 passengers enplaned Total # of 2014 airline departures Regionals 1,930,101 Regionals 42,449Industry 4,440,736 Industry 63,702Regional Share 43% Regional Share 67%
CLU Columbus 100% 100%EVV Evansville 97% 94%FWA Fort Wayne 92% 74%
GYY Gary 0% 0%IND Indianapolis 58% 36%SBN South Bend 89% 67%
EAS Airline Service Annual Order ExpirationCommunity to hub EAS Rate NumberBurlington, IA Air Choice One STL/ORD $1,917,566 2011-12-17 01/31/16Ft. Dodge, IA Great Lakes MSP $1,798,693 2011-11-30 05/31/14Mason City, IA Great Lakes MSP $1,174,468 2011-11-30 05/31/14Sioux City, IA American Eagle ORD $611,334 2014-3-14 04/30/16Waterloo, IA American Eagle ORD $945,546 2014-3-14 04/30/16

RAA 2015 Annual Report44
US AIRPORTS & REGIONAL SERVICE
LEXSDF
PAH
OWB
CVG
LBL
GCKDDC
HYS
GBD
SLN
ICT
MHKFOE
SHV
LCH LFT
MLU
AEX
BTR
MSYNEW
KANSAS
KENTUCKY
LOUISIANA
Percentage of Regional flights and enplanements for each airport
Percentage of Regional flights and enplanements for each airport
Percentage of Regional flights and enplanements for each airport
Regional only flights (95% and above) Regional/other flights
Total # of 2014 passengers enplaned Total # of 2014 airline departures Regionals 431,146 Regionals 12,963Industry 915,952 Industry 17,509Regional Share 47% Regional Share 74%
DDC Dodge City 100% 100%FOE Topeka 99% 99%GBD Great Bend 100% 100%GCK Garden City 100% 99%HYS Hays 100% 100%
ICT Wichita 62% 40%LBL Liberal 100% 100%MHK Manhattan 99% 97%SLN Salina 100% 100%
Total # of 2014 passengers enplaned Total # of 2014 airline departures Regionals 2,845,027 Regionals 67,962Industry 5,128,814 Industry 87,152Regional Share 55% Regional Share 78%
CVG Cincinnati 81% 60%LEX Lexington 87% 68%OWB Owensboro 88% 17%
PAH Paducah 100% 100%SDF Louisville 66% 43%
Total # of 2014 passengers enplaned Total # of 2014 airline departures Regionals 1,735,577 Regionals 40,132Industry 6,298,450 Industry 79,804Regional Share 28% Regional Share 5%
AEX Alexandria 100% 100%BTR Baton Rouge 96% 92%LCH Lake Charles 100% 99%LFT Lafayette 97% 94%
MLU Monroe 100% 100%MSY New Orleans 20% 11%NEW New Orleans 100% 100%SHV Shreveport 94% 85%
EAS Airline Service Annual Order ExpirationCommunity to hub EAS Rate NumberDodge City, KS Great Lakes DEN $2,339,131 2014-3-9 07/31/16Garden City, KS American Airlines DTW $1,445,172 2014-3-9 07/31/16Great Bend, KS SeaPort ICT $1,434,472 2014-3-9 07/31/16Hays, KS SkyWest DEN $2,253,132 2014-3-9 07/31/16Liberal/Guymon, KS Great Lakes DEN $2,236,180 2014-3-9 07/31/16Salina, KS SeaPort MCI $1,490,479 2012-2-4 03/31/16
EAS Airline Service Annual Order ExpirationCommunity to hub EAS Rate NumberOwensboro, KY Cape Air STL $1,529,913 2011-11-5 10/31/15Paducah, KY Skywest ORD $2,034,160 2013-10-8 01/31/16

RAA 2015 Annual Report 45
US AIRPORTS & REGIONAL SERVICE
AUG
PWM
BGR
BHB
RKD
PQI
BOS
EWB
MVY
HYA
PVC
ACK
ORH
BWI
SBY
HGR
MAINE
MARYLAND
MASSACHUSETTS
Percentage of Regional flights and enplanements for each airport
Percentage of Regional flights and enplanements for each airport
Percentage of Regional flights and enplanements for each airport
Regional only flights (95% and above) Regional/other flights
Total # of 2014 passengers enplaned Total # of 2014 airline departures Regionals 686,037 Regionals 16,836Industry 1,130,741 Industry 20,816Regional Share 61% Regional Share 81%
AUG Augusta 100% 100%BGR Bangor 90% 75%BHB Bar Harbor 100% 100%
PQI Presque Isle 100% 100%PWM Portland 70% 55%RKD Rockland 100% 100%
Total # of 2014 passengers enplaned Total # of 2014 airline departures Regionals 461,435 Regionals 13,297Industry 11,396,454 Industry 105,837Regional Share 4% Regional Share 13%
BWI Baltimore 10% 4%HGR Hagerstown 93% 10%
SBY Salisbury 100% 100%
ACK Nantucket 98% 83%BOS Boston 27% 8%EWB New Bedford 100% 100%HYA Hyannis 99% 93%
MVY Martha's Vineyard 97% 78%ORH Worcester 0% 0%PVC Provincetown 100% 100%
Total # of 2014 passengers enplaned Total # of 2014 airline departures Regionals 1,481,771 Regionals 87,797Industry 15,806,073 Industry 208,611Regional Share 9% Regional Share 42%
EAS Airline Service Annual Order ExpirationCommunity to hub EAS Rate NumberAugusta/Waterville, ME Cape Air BOS $1,362,616 2010-9-28 10/31/14Bar Harbor, ME CapeAir BOS $2,531,807 2014-6-4 06/30/16Presque Isle/Houlton, ME PenAir BOS $4,710,683 2014-6-4 06/30/16Rockland, ME Cape Air BOS $1,420,545 2010-9-28
EAS Airline Service Annual Order ExpirationCommunity to hub EAS Rate NumberHagerstown, MD Sun Air IAD $1,785,638.00 2012-8-9 09/30/15

RAA 2015 Annual Report46
US AIRPORTS & REGIONAL SERVICE
TVF
BJI
MSP
RST
DLH
BRD
HIB
INL
STC
IWDCMX
IMT
MQT
ESC
MBL
MKG
AZO
TVC
GRR
PLN
LAN
CIU
MBS
FNT
APN
DTWYIP
MICHIGAN
MINNESOTA
Percentage of Regional flights and enplanements for each airport
Percentage of Regional flights and enplanements for each airport
Regional only flights (95% and above) Regional/other flights
Total # of 2014 passengers enplaned Total # of 2014 airline departures Regionals 6,369,585 Regionals 142,923Industry 18,293,456 Industry 232,310Regional Share 35% Regional Share 62%
APN Alpena 100% 100%AZO Kalamazoo 100% 100%CIU Sault Ste. Marie 100% 100%CMX Hancock 100% 98%DTW Detroit 57% 32%ESC Escanaba 100% 100%FNT Flint 51% 26%GRR Grand Rapids 68% 45%IMT Iron Mountain 100% 100%
IWD Ironwood 100% 100%LAN Lansing 84% 69%MBL Manistee 100% 100%MBS Saginaw 100% 100%MKG Muskegon 98% 90%MQT Marquette 100% 100%PLN Pellston 100% 100%TVC Traverse City 88% 78%YIP Detroit-Willow Run 100% 100%
Total # of 2014 passengers enplaned Total # of 2014 airline departures Regionals 5,033,288 Regionals 102,778Industry 17,438,112 Industry 196,164Regional Share 29% Regional Share 52%
BJI Bemidji 99% 97%BRD Brainerd 98% 95%DLH Duluth 90% 75%HIB Hibbing 98% 91%INL International Falls 99% 96%
MSP Minneapolis/St. Paul 50% 28%RST Rochester 98% 93%STC St. Cloud 77% 38%TVF Thief River Falls 100% 100%
EAS Airline Service Annual Order ExpirationCommunity to hub EAS Rate NumberEscanaba, MI SkyWest DTW $2,833,558 2012-4-10 12/31/14Iron Mountain/Kingsford, MI SkyWest MSP $2,512,971 2012-9-11 09/31/14Alpena, MI SkyWest MSP/DTW $3,098,472 2012-6-20 09/30/14Sault Ste, MI Delta DTW $1,765,393 2013-10-8 01/31/16Hancock/Houghton, MI SkyWest ORD $690,976 2013-10-8 01/31/16Muskegon, MI SkyWest ORD $1,389,952 2013-10-8 01/31/16Ironwood, MI / Ashland WI Air Choice One ORD $3,563,384 2014-4-17 05/31/16Manistee, MI AIRPORT/AEAS MDW $2,328,104 2014-7-16 07/31/18Pellston, MI Delta DTW $1,077,413 2013-10-8 01/31/16
EAS Airline Service Annual Order ExpirationCommunity to hub EAS Rate NumberChisholm/Hibbing, MN SkyWest MSP $2,535,502 2014-3-13 05/31/16Thief River Falls, MN Great Lakes MSP $2,428,750 2014-4-17 05/31/16International Falls, MN SkyWest MSP $1,107,900 2012-9-11 Brainerd, MN SkyWest MSP $1,356,764 2012-9-11 09/30/14Bemidji, MN SkyWest MSP $1,118,050 2012-1-23 02/28/16

RAA 2015 Annual Report 47
US AIRPORTS & REGIONAL SERVICE
MCI
SGF
TBN
COU
STL
CGI
IRK
JLN
BKG
FCA
MSO
BTM
HLN
GTF
BZN
WYS
BIL
HVRGGW OLF
SDY
GDV
MLS
LWT
MISSOURI
MONTANA
Percentage of Regional flights and enplanements for each airport
Percentage of Regional flights and enplanements for each airport
GLH GTR
TUP
GPT
JAN MEI
PIB
OLVUOX
MISSISSIPPI
Percentage of Regional flights and enplanements for each airport
Regional only flights (95% and above) Regional/other flights
Total # of 2014 passengers enplaned Total # of 2014 airline departures Regionals 499,725 Regionals 14,650Industry 885,438 Industry 18,498Regional Share 56% Regional Share 79%
JAN Jackson 72% 53%GLH Greenville 100% 100%GPT Gulfport/Biloxi 77% 55%GTR Columbus 100% 100%MEI Meridian 100% 100%
OLV Olive Branch 100% 100%PIB Laurel/Hattiesburg 100% 100%TUP Tupelo 100% 100%UOX Oxford 100% 100%
Total # of 2014 passengers enplaned Total # of 2014 airline departures Regionals 2,639,071 Regionals 67,671Industry 12,150,916 Industry 150,643Regional Share 22% Regional Share 45%
BKG Branson 0% 0%CGI Cape Girardeau 100% 100%COU Columbia 100% 100%IRK Kirksville 100% 100%JLN Joplin 99% 97%
MCI Kansas City 37% 20%SGF Springfield 91% 75%STL St. Louis 43% 19%TBN Ft. Leonard Wood 100% 100%
Total # of 2014 passengers enplaned Total # of 2014 airline departures Regionals 1,173,334 Regionals 31,873Industry 1,836,954 Industry 37,340Regional Share 64% Regional Share 85%
BIL Billings 82% 52%BTM Butte 100% 100%BZN Bozeman 68% 49%FCA Kalispell/Glacier 89% 76%GDV Glendive 100% 100%GGW Glasgow 100% 100%GTF Great Falls 90% 75%HLN Helena 100% 100%
HVR Havre 100% 100%LWT Lewistown 100% 100%MLS Miles City 100% 100%MSO Missoula 84% 67%OLF Wolf Point 100% 100%SDY Sidney 100% 100%WYS West Yellowstone 100% 100%
EAS Airline Service Annual Order ExpirationCommunity to hub EAS Rate NumberGreenville, MS Silver Airways ATL $3,522,398 2012-5-17 09/30/14Laurel/Hattiesburg, MS Silver Airways ATL $2,965,667 2012-5-17 09/30/14Meridian, MS Silver Airways ATL $2,417,808 2012-7-35 09/30/14Tupelo, MS Silver Airways ATL $3,522,398 2012-5-17
EAS Airline Service Annual Order ExpirationCommunity to hub EAS Rate NumberCape Girardeau/Sikeston, MO Cape Air STL $1,627,966 2011-4-12 11/30/15Fort Leonard Wood, MO Cape Air STL $1,499,141 2012-11-35 DOTFort Leonard Wood, MO Cape Air STL $1,406,653 2012-11-35 DOTJoplin, MO American Eagle DFW $342,560 2012-12-6 02/28/15Kirksville, MO Cape Air STL $1,648,249 2012-7-25 09/30/16
EAS Airline Service Annual Order ExpirationCommunity to hub EAS Rate NumberGlasgow, MT Cape Air BIL $2,046,800 2013-12-1 12/31/15Glendive, MT Cape Air BIL $1,944,467 2013-12-1 12/31/15Havre, MT Cape Air BIL $2,036,254 2013-12-1 12/31/15Sidney, MT Cape Air BIL $3,777,759 2013-12-1 12/31/15West Yellowstone, MT SkyWest SLC $535,141 2013-5-4 09/30/14Wolf Point, MT Cape Air BIL $2,145,326 2013-12-1 12/31/15Butte, MT SkyWest SLC $735,956 2013-12-18 12/31/15
RAA 2015 Annual Report48
US AIRPORTS & REGIONAL SERVICE
AIABFF
CDR
LBF
MCK
EARLNK
OMAGRI
RNO
EKO
LAS BLD
ELY
LEB
MHTPSM
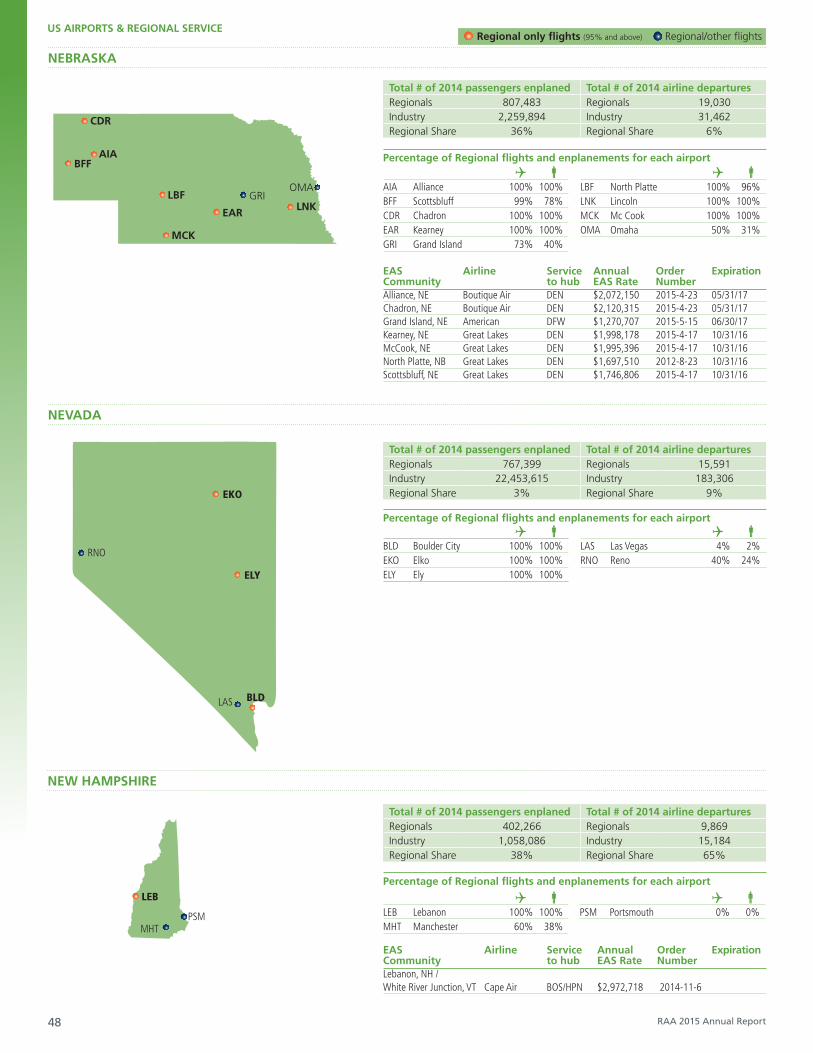
NEBRASKA
NEVADA
NEW HAMPSHIRE
Percentage of Regional flights and enplanements for each airport
Percentage of Regional flights and enplanements for each airport
Percentage of Regional flights and enplanements for each airport
Regional only flights (95% and above) Regional/other flights
Total # of 2014 passengers enplaned Total # of 2014 airline departures Regionals 767,399 Regionals 15,591Industry 22,453,615 Industry 183,306Regional Share 3% Regional Share 9%
BLD Boulder City 100% 100%EKO Elko 100% 100%ELY Ely 100% 100%
LAS Las Vegas 4% 2%RNO Reno 40% 24%
Total # of 2014 passengers enplaned Total # of 2014 airline departures Regionals 402,266 Regionals 9,869Industry 1,058,086 Industry 15,184Regional Share 38% Regional Share 65%
LEB Lebanon 100% 100%MHT Manchester 60% 38%
PSM Portsmouth 0% 0%
Total # of 2014 passengers enplaned Total # of 2014 airline departures Regionals 807,483 Regionals 19,030Industry 2,259,894 Industry 31,462Regional Share 36% Regional Share 6%
AIA Alliance 100% 100%BFF Scottsbluff 99% 78%CDR Chadron 100% 100%EAR Kearney 100% 100%GRI Grand Island 73% 40%
LBF North Platte 100% 96%LNK Lincoln 100% 100%MCK Mc Cook 100% 100%OMA Omaha 50% 31%
EAS Airline Service Annual Order ExpirationCommunity to hub EAS Rate NumberAlliance, NE Boutique Air DEN $2,072,150 2015-4-23 05/31/17Chadron, NE Boutique Air DEN $2,120,315 2015-4-23 05/31/17Grand Island, NE American DFW $1,270,707 2015-5-15 06/30/17Kearney, NE Great Lakes DEN $1,998,178 2015-4-17 10/31/16McCook, NE Great Lakes DEN $1,995,396 2015-4-17 10/31/16North Platte, NB Great Lakes DEN $1,697,510 2012-8-23 10/31/16Scottsbluff, NE Great Lakes DEN $1,746,806 2015-4-17 10/31/16
EAS Airline Service Annual Order ExpirationCommunity to hub EAS Rate NumberLebanon, NH / White River Junction, VT Cape Air BOS/HPN $2,972,718 2014-11-6

RAA 2015 Annual Report 49
US AIRPORTS & REGIONAL SERVICE
FMN
ALMSVC
CNM
ROW
HOB
CVN
ABQ
SAFLAM
JHW
BUFROC
ELM
ITH
ART
SYR
BGM
OGSMSS
SLK
HPNLGA
SWF
ALB
PBG
ISP
JFK
IAG
FRG
ACY
EWR
MMU
TTN
TEB
NEW JERSEY
NEW MEXICO
NEW YORK
Percentage of Regional flights and enplanements for each airport
Percentage of Regional flights and enplanements for each airport
Percentage of Regional flights and enplanements for each airport
Regional only flights (95% and above) Regional/other flights
Total # of 2014 passengers enplaned Total # of 2014 airline departures Regionals 617,457 Regionals 16,807Industry 2,729,227 Industry 35,008Regional Share 23% Regional Share 48%
ABQ Albuquerque 36% 18%CNM Carlsbad 100% 100%CVN Clovis 100% 100%FMN Farmington 100% 100%HOB Hobbs 100% 100%
LAM Los Alamos 100% 100%ROW Roswell 100% 99%SAF Santa Fe 100% 100%SVC Silver City 100% 100%
Total # of 2014 passengers enplaned Total # of 2014 airline departures Regionals 3,517,767 Regionals 78,844Industry 18,615,429 Industry 188,492Regional Share 19% Regional Share 42%
ACY Atlantic City 19% 4%EWR Newark 43% 20%MMU Morristown 100% 100%
TEB Teterboro 100% 100%TTN Trenton 0% 0%
Total # of 2014 passengers enplaned Total # of 2014 airline departures Regionals 8,611,219 Regionals 208,508Industry 47,623,366 Industry 500,442Regional Share 18% Regional Share 42%
ALB Albany 64% 35%ART Watertown 100% 100%BGM Binghamton 100% 100%BUF Buffalo 48% 28%ELM Elmira 94% 79%FRG Long Island Republic 100% 100%HPN Westchester County 74% 50%IAG Niagara Falls 14% 2%ISP Long Island-Macarthur 27% 8%ITH Ithaca 100% 100%
JFK New York-JFK 17% 6%JHW Jamestown 100% 100%LGA New York-La Guardia 52% 29%MSS Massena 100% 100%OGS Ogdensburg 100% 100%PBG Plattsburgh 46% 6%ROC Rochester 71% 48%SLK Saranac Lake 100% 100%SWF Newburgh 71% 48%SYR Syracuse 81% 63%
EAS Airline Service Annual Order ExpirationCommunity to hub EAS Rate NumberCarlsbad, NM Boutique Air ABQ/DFW $2,410,695 2015-4-12 05/31/17Clovis, NM Boutique Air DFW $3,179,857 2014-9-15 07/31/16Silver City/Hurley/Deming, NM Boutique Air ABQ $3,377,495 2014-12-4 12/31/16
EAS Airline Service Annual Order ExpirationCommunity to hub EAS Rate NumberCJamestown, NY Silver Airways ALB/BOS $2,045,481 2015-1-1 09/30/16Massena, NY Cape Air ALB/BOS $2,608,773 2015-1-2 03/31/19Ogdensburg, NY PenAir ALB $2,419,820 2015-1-1 12/31/15Plattsburgh, NY Peninsula Airways BOS $2,714,074 2010-3-27 06/30/16Saranac Lake/Lake Placid, NY Cape Air BOS $1,832,064 2014-2-19 02/28/18Watertown, NY American ORD $3,356,349 2013-11-1 01/31/16

RAA 2015 Annual Report50
US AIRPORTS & REGIONAL SERVICE
DAY
TOL
CMH
CLE
CAK
LUKCVG
LCK
CAK
YNG
CGF
AVLCLT
GSO
FAY
RDU
ILM
OAJ
PGV
EWN
USA
ISN
DIK
MOT
BIS
DVL
JMS
GFK
FAR
OKC
TUL
LAW
NORTH CAROLINA
NORTH DAKOTA
OHIO
OKLAHOMA
Percentage of Regional flights and enplanements for each airport
Percentage of Regional flights and enplanements for each airport
Percentage of Regional flights and enplanements for each airport
Percentage of Regional flights and enplanements for each airport
Regional only flights (95% and above) Regional/other flights
Total # of 2014 passengers enplaned Total # of 2014 airline departures Regionals 9,735,828 Regionals 202,573Industry 28,840,872 Industry 353,733Regional Share 34% Regional Share 57%
AVL Asheville 83% 63%CLT Charlotte-Douglas 54% 31%EWN New Bern 100% 100%FAY Fayetteville 93% 85%GSO Greensboro 84% 68%
ILM Wilmington 85% 76%OAJ Jacksonville 100% 100%PGV Greenville 100% 100%RDU Raleigh/Durham 51% 29%USA Concord 0% 0%
Total # of 2014 passengers enplaned Total # of 2014 airline departures Regionals 857,598 Regionals 20,303Industry 1,245,757 Industry 23,123Regional Share 69% Regional Share 88%
BIS Bismarck 84% 63%DIK Dickinson 100% 100%DVL Devils Lake 100% 100%FAR Fargo 83% 63%
GFK Grand Forks 83% 58%ISN Williston 100% 100%JMS Jamestown 100% 100%MOT Minot 87% 69%
Total # of 2014 passengers enplaned Total # of 2014 airline departures Regionals 3,669,333 Regionals 88,107Industry 8,923,627 Industry 134,179Regional Share 41% Regional Share 66%
CAK Akron/Canton 50% 30%CGF Cleveland 100% 100%CLE Cleveland 67% 40%CMH Columbus 65% 42%DAY Dayton 75% 52%
LCKColumbus-Rickenbacker
0% 0%
LUK Cincinnati 100% 100%TOL Toledo 76% 45%YNG Youngstown 0% 0%
Total # of 2014 passengers enplaned Total # of 2014 airline departures Regionals 1,143,166 Regionals 25,242Industry 3,430,290 Industry 46,418Regional Share 33% Regional Share 54%
LAW Lawton 100% 99%OKC Oklahoma City 51% 31%
TUL Tulsa 55% 34%
EAS Airline Service Annual Order ExpirationCommunity to hub EAS Rate NumberDevils Lake, ND SkyWest DEN $3,224,917 2014-1-19 06/30/16Dickinson, ND Great Lakes DEN Subsidy free 2012-10-5 UFNJamestown, ND SkyWest DEN $3,126,564 2014-1-19 06/30/16

RAA 2015 Annual Report 51
US AIRPORTS & REGIONAL SERVICE
PIT
ERI
AOO
BFD
JST
SCE
MDT
IPT
ABE
PHL
AVPFKLDUJ
LNSLBE
OTH
EUG
MFR
PDX
LMT
PDT
RDM
WSTBID
PVD
OREGON
PENNSYLVANIA
RHODE ISLAND
Percentage of Regional flights and enplanements for each airport
Percentage of Regional flights and enplanements for each airport
Percentage of Regional flights and enplanements for each airport
Regional only flights (95% and above) Regional/other flights
Total # of 2014 passengers enplaned Total # of 2014 airline departures Regionals 2,896,234 Regionals 59,192Industry 8,942,178 Industry 105,104Regional Share 32% Regional Share 56%
EUG Eugene 93% 80%LMT Klamath Falls 99% 94%MFR Medford 96% 89%OTH North Bend 100% 100%
PDT Pendleton 100% 100%PDX Portland 46% 25%RDM Redmond 100% 100%
Total # of 2014 passengers enplaned Total # of 2014 airline departures Regionals 6,741,075 Regionals 166,454Industry 20,279,271 Industry 277,174Regional Share 33% Regional Share 60%
ABE Allentown 86% 62%AOO Altoona 100% 100%AVP Wilkes-Barre/Scranton 94% 85%BFD Bradford 100% 100%DUJ DuBois 100% 100%ERI Erie 100% 100%FKL Franklin 100% 100%IPT Williamsport 100% 100%
JST Johnstown 100% 100%LBE Latrobe 0% 0%LNS Lancaster 100% 100%MDT Harrisburg 82% 62%PHL Philadelphia 56% 30%PIT Pittsburgh 53% 32%SCE State College 100% 100%
Total # of 2014 passengers enplaned Total # of 2014 airline departures Regionals 431,921 Regionals 15,390Industry 1,786,620 Industry 26,315Regional Share 24% Regional Share 58%
BID Block Island 100% 100%PVD Providence 43% 23%
WST Westerly 100% 100%
EAS Airline Service Annual Order ExpirationCommunity to hub EAS Rate NumberPendleton, OR SeaPort PDX $1,834,708 2013-1-06 12/31/16
EAS Airline Service Annual Order ExpirationCommunity to hub EAS Rate NumberAltoona, PA Sun Air PIT $2,346,168 2014-7-11 09/30/16Bradford, PA Sun Air PIT $2,045,826 201-10-21 09/30/16DuBois, PA Sun Air IAD $2,285,539 2014-7-11 09/30/16Johnstown, PA Sun Air IAD/PIT $2,438,254 2014-7-11 09/30/16Lancaster, PA Sun Air IAD/PIT $2,504,174 2012-8-9 09/30/15Oil City/Franklin, PA Sun Air PIT $1,442,788 2014-10-21 10/31/16

RAA 2015 Annual Report52
US AIRPORTS & REGIONAL SERVICE
MEM CHA
TYSBNA
TRI
MKL
CAE
GSP
FLO
CHS
HHH
MYR
RAPPIR
FSD
ABR
ATY
HON
SOUTH CAROLINA
SOUTH DAKOTA
TENNESSEE
Percentage of Regional flights and enplanements for each airport
Percentage of Regional flights and enplanements for each airport
Percentage of Regional flights and enplanements for each airport
Regional only flights (95% and above) Regional/other flights
Total # of 2014 passengers enplaned Total # of 2014 airline departures Regionals 1,938,662 Regionals 43,906Industry 4,002,445 Industry 61,463Regional Share 48% Regional Share 71%
CAE Columbia 91% 79%CHS Charleston 63% 43%FLO Florence 100% 100%
GSP Greenville/Spartanburg 75% 53%HHH Hilton Head Island 100% 100%MYR Myrtle Beach 50% 29%
Total # of 2014 passengers enplaned Total # of 2014 airline departures Regionals 576,786 Regionals 16,570Industry 801,912 Industry 18,254Regional Share 72% Regional Share 91%
ABR Aberdeen 100% 100%ATY Watertown 100% 99%FSD Sioux Falls 85% 66%
HON Huron 100% 100%PIR Pierre 100% 100%RAP Rapid City 92% 78%
Total # of 2014 passengers enplaned Total # of 2014 airline departures Regionals 2,837,693 Regionals 67,530Industry 8,839,616 Industry 119,628Regional Share 32% Regional Share 56%
BNA Nashville 39% 20%CHA Chattanooga 89% 73%MEM Memphis 66% 40%
MKL Jackson 100% 100%TRI Tri-Cities 80% 61%TYS Knoxville 88% 71%
EAS Airline Service Annual Order ExpirationCommunity to hub EAS Rate NumberAberdeen, SD SkyWest MSP $1,043,719 2014-1-4 02/29/16Huron, SD Great Lakes DEN $2,552,000 2014-7-10 09/30/14Watertown, SD Great Lakes MSP/DEN $2,847,284 2014-4-17 05/31/16
EAS Airline Service Annual Order ExpirationCommunity to hub EAS Rate NumberJackson, TN Air Choice One STL $2,072,293 2015-3-1 05/31/17

RAA 2015 Annual Report 53
US AIRPORTS & REGIONAL SERVICE
ELP
AMA
LBB
MAF
SJT
DRT
ABI
MFE
LRD
SPS
GRK
AUS
CRP
HRL
BRO
VCT
SAT
DFWDAL
ACT
CLL
HOUIAH
GGGTYR
BPT
SLRAFW
EFD
SGU
CDC
SLC
CNY
VELPVU
OGD
BTV
RUT
TEXAS
UTAH
VERMONT
Percentage of Regional flights and enplanements for each airport
Percentage of Regional flights and enplanements for each airport
Percentage of Regional flights and enplanements for each airport
Regional only flights (95% and above) Regional/other flights
Total # of 2014 passengers enplaned Total # of 2014 airline departures Regionals 14,225,471 Regionals 330,522Industry 76,346,458 Industry 843,704Regional Share 19% Regional Share 39%
SAT San Antonio 31% 19%ABI Abilene 98% 93%ACT Waco 100% 100%AFW Fort Worth-Alliance 0% 0%AMA Amarillo 63% 38%AUS Austin 25% 14%BPT Beaumont/Pt. Arthur 100% 99%BRO Brownsville 100% 100%CLL College Station 100% 100%CRP Corpus Christi 71% 52%DAL Dallas-Love 8% 3%DFW Dallas/Fort Worth 35% 15%DRT Del Rio 100% 100%EFD Houston-Ellington 56% 28%ELP El Paso 37% 22%
GGG Longview 98% 94%GRK Killeen 100% 99%HOU Houston-Hobby 3% 1%HRL Harlingen 34% 18%
IAH Houston-Intercontinental 55% 29%
LBB Lubbock 48% 29%LRD Laredo 93% 75%MAF Midland/Odessa 65% 44%MFE McAllen 57% 32%SJT San Angelo 100% 99%SLR Sulphur Springs 100% 100%SPS Wichita Falls 98% 94%TYR Tyler 100% 100%VCT Victoria 100% 100%
CDC Cedar City 100% 100%CNY Moab 100% 100%OGD Ogden 5% 2%PVU Provo 1% 0%
SGU St. George 100% 100%SLC Salt Lake City 52% 29%VEL Vernal 100% 100%
Total # of 2014 passengers enplaned Total # of 2014 airline departures Regionals 3,076,485 Regionals 64,331Industry 10,355,293 Industry 119,970Regional Share 30% Regional Share 54%
Total # of 2014 passengers enplaned Total # of 2014 airline departures Regionals 474,070 Regionals 10,022Industry 607,075 Industry 11,511Regional Share 78% Regional Share 87%
BTV Burlington 86% 78%
RUT Rutland 100% 100%
EAS Airline Service Annual Order ExpirationCommunity to hub EAS Rate NumberVictoria, TX Alternate EAS AUS/DFW $2,288,152 2014-9-18 10/31/16
EAS Airline Service Annual Order ExpirationCommunity to hub EAS Rate NumberCedar City, UT SkyWest SLC $2,317,439 2013-11-7 12/31/15Moab, UT SkyWest SLC $2,303,347 2014-2-18 03/31/16Vernal, UT SkyWest SLC $1,415,696 2014-2-18 03/31/16
EAS Airline Service Annual Order ExpirationCommunity to hub EAS Rate NumberRutland, VT Cape Air BOS $1,360,481 2013-8-3 10/31/17

RAA 2015 Annual Report54
US AIRPORTS & REGIONAL SERVICE
CLM
FRD
ESD
LKE EAT
YKMPSC ALW
PUWSEA
BFI GEG
BLI
FBSPAEWSX RSJ
RNT
RCEOTS
LPS
DTR
DHB
ROALYH
SHDCHO
RIC
PHFORF
DCAIAD
MNZ
HTS CRW
PKB
BKW LWB
CKBMGW
VIRGINIA
WASHINGTON
WEST VIRGINIA
Percentage of Regional flights and enplanements for each airport
Percentage of Regional flights and enplanements for each airport
Percentage of Regional flights and enplanements for each airport
Regional only flights (95% and above) Regional/other flights
CHO Charlottesville 98% 95%DCA Washington-National 54% 33%IAD Washington-Dulles 59% 29%LYH Lynchburg 100% 100%MNZ Manassas 100% 100%
ORF Norfolk 68% 43%PHF Newport News 89% 78%RIC Richmond 67% 43%ROA Roanoke 93% 80%SHD Shenandoah Valley 100% 100%
Total # of 2014 passengers enplaned Total # of 2014 airline departures Regionals 8,462,326 Regionals 198,342Industry 24,602,295 Industry 329,322Regional Share 34% Regional Share 60%
Total # of 2014 passengers enplaned Total # of 2014 airline departures Regionals 4,234,232 Regionals 94,154Industry 20,517,142 Industry 212,355Regional Share 21% Regional Share 44%
ALW Walla Walla 100% 100%BFI Seattle 100% 100%BLI Bellingham 49% 23%CLM Port Angeles 100% 100%DHB Deer Harbor 100% 100%DTR Decatur Island 100% 100%EAT Wenatchee 100% 100%ESD Eastsound 100% 100%FBS Friday Harbor 100% 100%FRD Friday Harbor 100% 100%GEG Spokane 50% 34%LKE Seattle 100% 100%
LPS Lopez Island 100% 100%OTS Anacortes 100% 100%PAE Everett 80% 100%PSC Pasco 94% 84%PUW Pullman 100% 100%RCE Roche Harbor 100% 100%RNT Renton 100% 100%RSJ Rosario 100% 100%SEA Seattle/Tacoma 33% 17%WSX West Sound 100% 100%YKM Yakima 99% 99%
BKW Beckley 100% 100%CKB Clarksburg 91% 43%CRW Charleston 94% 84%HTS Huntington 77% 38%
LWB Greenbrier 100% 100%MGW Morgantown 100% 100%PKB Parkersburg 100% 100%
Total # of 2014 passengers enplaned Total # of 2014 airline departures Regionals 279,930 Regionals 11,783Industry 388,423 Industry 12,631Regional Share 72% Regional Share 93%
EAS Airline Service Annual Order ExpirationCommunity to hub EAS Rate NumberStaunton, VA Silver Airways IAD $1,980,922 2014-7-11 09/30/16
EAS Airline Service Annual Order ExpirationCommunity to hub EAS Rate NumberBeckley, WV Alternate EAS CLT $2,696,888 2014-10-24 11/30/16Clarksburg/Fairmont, WV Silver Airways IAD $2,310,252 2014-7-11 09/30/16Morgantown, WV Silver Airways IAD $2,342,074 2014-7-11 09/30/16Parkersburg, WV/Marietta, OH Silver Airways CLE $3,505.876 2014-7-11 09/30/16Greenbrier/White Sulphur Springs/Lewisburg, WV Silver Airways IAD $3,582,194 2014-7-11 09/30/16
RAA 2015 Annual Report 55
US AIRPORTS & REGIONAL SERVICE
EAU CWA
RHI
ATW
LSE
MSN
GRB
MKE
ARVEGV
JAC
RKS
COD
RIW
WRL
SHR
CPR
LAR
GCC
CYS
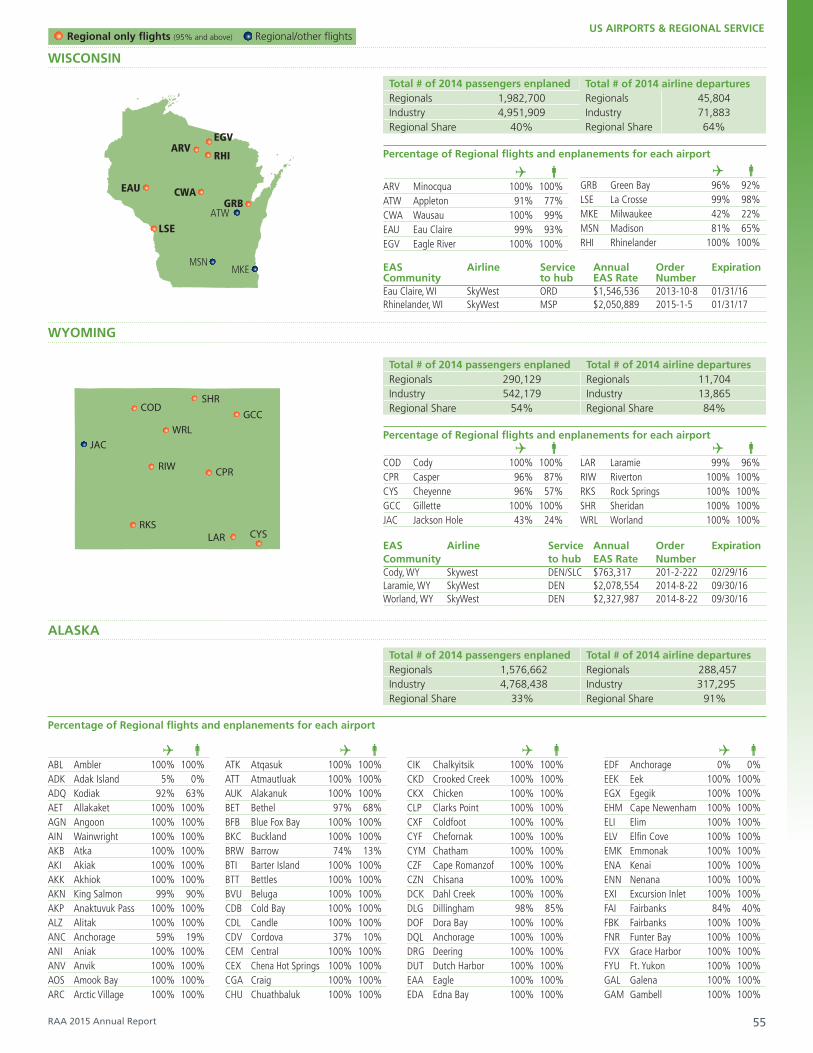
WISCONSIN
WYOMING
ALASKA
Percentage of Regional flights and enplanements for each airport
Percentage of Regional flights and enplanements for each airport
Regional only flights (95% and above) Regional/other flights
ARV Minocqua 100% 100%ATW Appleton 91% 77%CWA Wausau 100% 99%EAU Eau Claire 99% 93%EGV Eagle River 100% 100%
GRB Green Bay 96% 92%LSE La Crosse 99% 98%MKE Milwaukee 42% 22%MSN Madison 81% 65%RHI Rhinelander 100% 100%
Total # of 2014 passengers enplaned Total # of 2014 airline departures Regionals 1,982,700 Regionals 45,804Industry 4,951,909 Industry 71,883Regional Share 40% Regional Share 64%
COD Cody 100% 100%CPR Casper 96% 87%CYS Cheyenne 96% 57%GCC Gillette 100% 100%JAC Jackson Hole 43% 24%
LAR Laramie 99% 96%RIW Riverton 100% 100%RKS Rock Springs 100% 100%SHR Sheridan 100% 100%WRL Worland 100% 100%
Total # of 2014 passengers enplaned Total # of 2014 airline departures Regionals 290,129 Regionals 11,704Industry 542,179 Industry 13,865Regional Share 54% Regional Share 84%
Total # of 2014 passengers enplaned Total # of 2014 airline departures Regionals 1,576,662 Regionals 288,457 Industry 4,768,438 Industry 317,295 Regional Share 33% Regional Share 91%
ABL Ambler 100% 100%ADK Adak Island 5% 0%ADQ Kodiak 92% 63%AET Allakaket 100% 100%AGN Angoon 100% 100%AIN Wainwright 100% 100%AKB Atka 100% 100%AKI Akiak 100% 100%AKK Akhiok 100% 100%AKN King Salmon 99% 90%AKP Anaktuvuk Pass 100% 100%ALZ Alitak 100% 100%ANC Anchorage 59% 19%ANI Aniak 100% 100%ANV Anvik 100% 100%AOS Amook Bay 100% 100%ARC Arctic Village 100% 100%
ATK Atqasuk 100% 100%ATT Atmautluak 100% 100%AUK Alakanuk 100% 100%BET Bethel 97% 68%BFB Blue Fox Bay 100% 100%BKC Buckland 100% 100%BRW Barrow 74% 13%BTI Barter Island 100% 100%BTT Bettles 100% 100%BVU Beluga 100% 100%CDB Cold Bay 100% 100%CDL Candle 100% 100%CDV Cordova 37% 10%CEM Central 100% 100%CEX Chena Hot Springs 100% 100%CGA Craig 100% 100%CHU Chuathbaluk 100% 100%
CIK Chalkyitsik 100% 100%CKD Crooked Creek 100% 100%CKX Chicken 100% 100%CLP Clarks Point 100% 100%CXF Coldfoot 100% 100%CYF Chefornak 100% 100%CYM Chatham 100% 100%CZF Cape Romanzof 100% 100%CZN Chisana 100% 100%DCK Dahl Creek 100% 100%DLG Dillingham 98% 85%DOF Dora Bay 100% 100%DQL Anchorage 100% 100%DRG Deering 100% 100%DUT Dutch Harbor 100% 100%EAA Eagle 100% 100%EDA Edna Bay 100% 100%
EDF Anchorage 0% 0%EEK Eek 100% 100%EGX Egegik 100% 100%EHM Cape Newenham 100% 100%ELI Elim 100% 100%ELV Elfin Cove 100% 100%EMK Emmonak 100% 100%ENA Kenai 100% 100%ENN Nenana 100% 100%EXI Excursion Inlet 100% 100%FAI Fairbanks 84% 40%FBK Fairbanks 100% 100%FNR Funter Bay 100% 100%FVX Grace Harbor 100% 100%FYU Ft. Yukon 100% 100%GAL Galena 100% 100%GAM Gambell 100% 100%
EAS Airline Service Annual Order ExpirationCommunity to hub EAS Rate NumberEau Claire, WI SkyWest ORD $1,546,536 2013-10-8 01/31/16Rhinelander, WI SkyWest MSP $2,050,889 2015-1-5 01/31/17
EAS Airline Service Annual Order ExpirationCommunity to hub EAS Rate NumberCody, WY Skywest DEN/SLC $763,317 201-2-222 02/29/16Laramie, WY SkyWest DEN $2,078,554 2014-8-22 09/30/16Worland, WY SkyWest DEN $2,327,987 2014-8-22 09/30/16
Percentage of Regional flights and enplanements for each airport
RAA 2015 Annual Report56
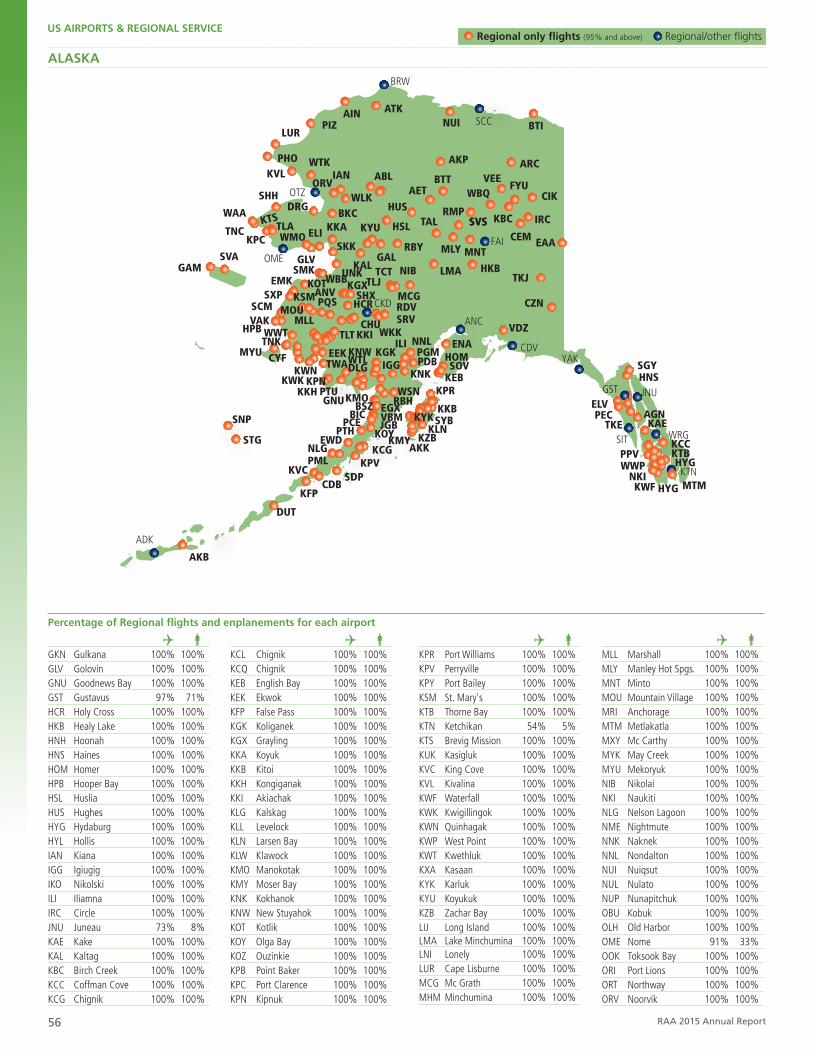
US AIRPORTS & REGIONAL SERVICE
ALASKA
Regional only flights (95% and above) Regional/other flights
GKN Gulkana 100% 100%GLV Golovin 100% 100%GNU Goodnews Bay 100% 100%GST Gustavus 97% 71%HCR Holy Cross 100% 100%HKB Healy Lake 100% 100%HNH Hoonah 100% 100%HNS Haines 100% 100%HOM Homer 100% 100%HPB Hooper Bay 100% 100%HSL Huslia 100% 100%HUS Hughes 100% 100%HYG Hydaburg 100% 100%HYL Hollis 100% 100%IAN Kiana 100% 100%IGG Igiugig 100% 100%IKO Nikolski 100% 100%ILI Iliamna 100% 100%IRC Circle 100% 100%JNU Juneau 73% 8%KAE Kake 100% 100%KAL Kaltag 100% 100%KBC Birch Creek 100% 100%KCC Coffman Cove 100% 100%KCG Chignik 100% 100%
KCL Chignik 100% 100%KCQ Chignik 100% 100%KEB English Bay 100% 100%KEK Ekwok 100% 100%KFP False Pass 100% 100%KGK Koliganek 100% 100%KGX Grayling 100% 100%KKA Koyuk 100% 100%KKB Kitoi 100% 100%KKH Kongiganak 100% 100%KKI Akiachak 100% 100%KLG Kalskag 100% 100%KLL Levelock 100% 100%KLN Larsen Bay 100% 100%KLW Klawock 100% 100%KMO Manokotak 100% 100%KMY Moser Bay 100% 100%KNK Kokhanok 100% 100%KNW New Stuyahok 100% 100%KOT Kotlik 100% 100%KOY Olga Bay 100% 100%KOZ Ouzinkie 100% 100%KPB Point Baker 100% 100%KPC Port Clarence 100% 100%KPN Kipnuk 100% 100%
KPR Port Williams 100% 100%KPV Perryville 100% 100%KPY Port Bailey 100% 100%KSM St. Mary's 100% 100%KTB Thorne Bay 100% 100%KTN Ketchikan 54% 5%KTS Brevig Mission 100% 100%KUK Kasigluk 100% 100%KVC King Cove 100% 100%KVL Kivalina 100% 100%KWF Waterfall 100% 100%KWK Kwigillingok 100% 100%KWN Quinhagak 100% 100%KWP West Point 100% 100%KWT Kwethluk 100% 100%KXA Kasaan 100% 100%KYK Karluk 100% 100%KYU Koyukuk 100% 100%KZB Zachar Bay 100% 100%LIJ Long Island 100% 100%LMA Lake Minchumina 100% 100%LNI Lonely 100% 100%LUR Cape Lisburne 100% 100%MCG Mc Grath 100% 100%MHM Minchumina 100% 100%
MLL Marshall 100% 100%MLY Manley Hot Spgs. 100% 100%MNT Minto 100% 100%MOU Mountain Village 100% 100%MRI Anchorage 100% 100%MTM Metlakatla 100% 100%MXY Mc Carthy 100% 100%MYK May Creek 100% 100%MYU Mekoryuk 100% 100%NIB Nikolai 100% 100%NKI Naukiti 100% 100%NLG Nelson Lagoon 100% 100%NME Nightmute 100% 100%NNK Naknek 100% 100%NNL Nondalton 100% 100%NUI Nuiqsut 100% 100%NUL Nulato 100% 100%NUP Nunapitchuk 100% 100%OBU Kobuk 100% 100%OLH Old Harbor 100% 100%OME Nome 91% 33%OOK Toksook Bay 100% 100%ORI Port Lions 100% 100%ORT Northway 100% 100%ORV Noorvik 100% 100%
GAM
SNP
STG
ADK
AKB
SVA
WAA
TNC
SXP
KPC
SHH
WWT
OME
EMK
KTSTLA
DUT
KFPCDB
NLGPML
TNK
CYFKWN
KKH
LUR
PHOKVL
OTZDRG
WMO
KWK
HPBVAKSCM
MYU
MLL
KSMMOU
GNU
GLVSMK
PTU
EWD
ELI
PIZ
WTK
ORV
KOTANVPQS
PTH
KVC
WBB
TWA
EGX
TLT
KPN
EEK
WSNKMO
SDP
WTLDLG
KPV
PCEBIC
KKI
KKA
SKK
UNK
BKC
IAN
CHU
AIN
ABL
WLK
HCR
KAL
KGXTLJSHX
HSLKYU
GALTCT
KGK
KOY
KNW
CKD
BRW
ATK
HUS
KCG
JGBVBM
KMYAKK
NNL
IGG
RBH
RDVMCG
NIB
SRV
RBY
WKKILI
KNKPDB
TAL
AETBTT
KZB
KPR
KKBSYB
LMA
MLY
RMP
ENAHOMSOV
KEB
KYKKLN
SCCNUI
AKP
ANC
MNT
SVS
WBQVEE
SVS
HKB
PGM
KBC
FAI
VDZ
CDV
ARC
FYU
CEM
BTI
CIK
IRC
EAA
TKJ
CZN
YAKSGYHNS
ELVPEC
TKE
GST
SITPPV
KCC
NKIKWF HYG
JNU
AGNKAE
WWP HYG
WRG
MTMKTN
KTB
BSZ
Percentage of Regional flights and enplanements for each airport


![Lo que nos dice el SERCE [Segundo Estudio Regional ... FINAL - SERCE graphs (Spanish)[1].pdf · Cuadro 1. Puntaje promedio de alumnos de tercer grado en la prueba SERCE de matemática,](https://static.fdocuments.us/doc/165x107/5bd7b60e09d3f238188d34d1/lo-que-nos-dice-el-serce-segundo-estudio-regional-final-serce-graphs-spanish1pdf.jpg)


