U.S. Army Corps of Engineers Study of Norfolk Naval Base Storm Damage
104
DRAFT ENVIRONMENTAL ASSESSMENT WILLOUGHBY SPIT AND VICINITY COASTAL STORM DAMAGE REDUCTION PROJECT NORFOLK, VIRGINIA Prepared by: U.S. Army Corps of Engineers Norfolk District Planning and Policy Branch Environmental Analysis Section August 2013
-
Upload
learn-more-about-climate-university-of-colorado-boulder -
Category
News & Politics
-
view
5.879 -
download
0
Transcript of U.S. Army Corps of Engineers Study of Norfolk Naval Base Storm Damage

DRAFT ENVIRONMENTAL ASSESSMENT WILLOUGHBY SPIT AND VICINITY
COASTAL STORM DAMAGE REDUCTION PROJECT NORFOLK, VIRGINIA
Prepared by: U.S. Army Corps of Engineers Norfolk District Planning and Policy Branch Environmental Analysis Section
August 2013


ENVIRONMENTAL ASSESSMENT WILLOUGHBY SPIT AND VICINITY COASTAL STORM DAMAGE REDUCTION PROJECT
NORFOLK, VIRGINIA DRAFT
TABLE OF CONTENTS
Item Page
1.0 INTRODUCTION 1
2.0 NATIONAL ENVIRONMENTAL POLICY ACT of 1969 (NEPA) CONSIDERATION 2 3.0 PURPOSE AND NEED FOR THE PROPOSED ACTION 2
4.0 DESCRIPTION OF THE PROPOSED ACTION 3 5.0 ALTERNATIVES TO THE PROPOSED ACTION 3
5.1 ALTERNATIVES ELIMINATED FROM DETAILED EVALUATION 3
5.1.1 Structural Measures 3
5.1.2 Sand Retention Structures and Beach Nourishment 4
5.1.3 Non-structural Solutions 4
5.2 PREFERRED ALTERNATIVE - BEACH NOURISHMENT ONLY 5
5.2.1 Alternative 1 - The Authorized Plan/Locally Preferred Plan 5
5.2.2 Alternative 2 - The National Economic Development Plan 6
5.3 NO-ACTION ALTERNATIVE 6
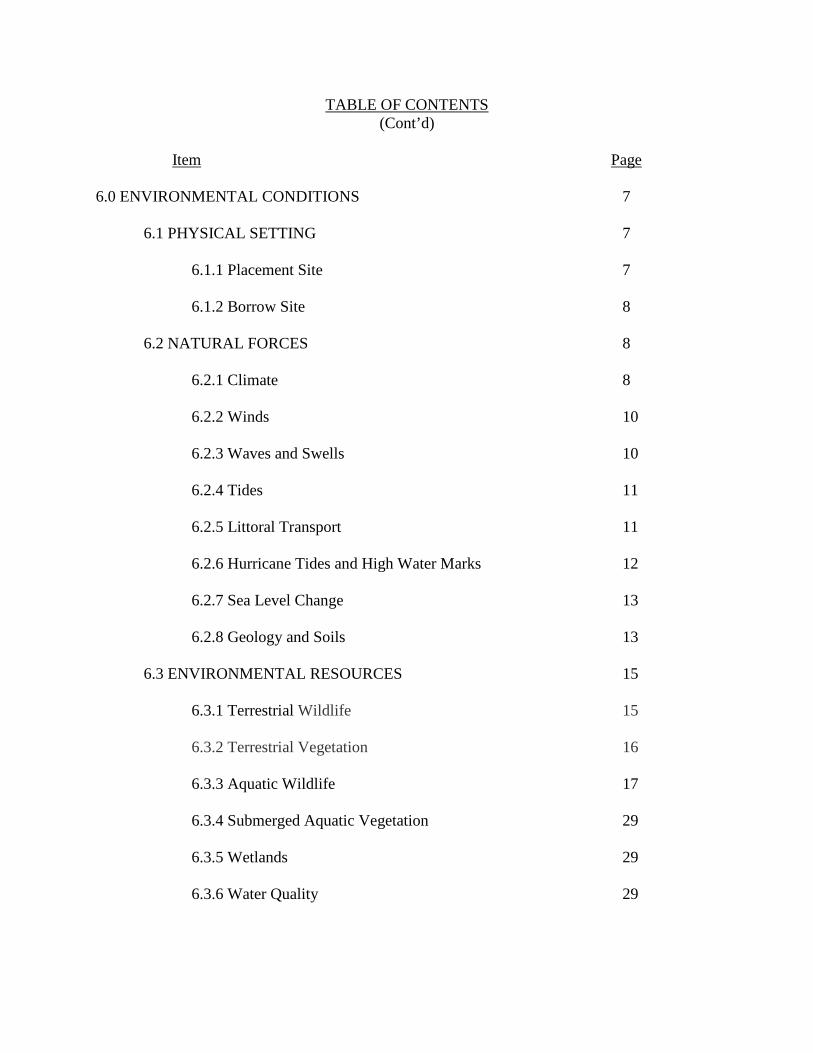
TABLE OF CONTENTS (Cont’d)
Item Page
6.0 ENVIRONMENTAL CONDITIONS 7
6.1 PHYSICAL SETTING 7
6.1.1 Placement Site 7
6.1.2 Borrow Site 8
6.2 NATURAL FORCES 8
6.2.1 Climate 8
6.2.2 Winds 10
6.2.3 Waves and Swells 10
6.2.4 Tides 11
6.2.5 Littoral Transport 11
6.2.6 Hurricane Tides and High Water Marks 12
6.2.7 Sea Level Change 13
6.2.8 Geology and Soils 13 6.3 ENVIRONMENTAL RESOURCES 15
6.3.1 Terrestrial Wildlife 15
6.3.2 Terrestrial Vegetation 16
6.3.3 Aquatic Wildlife 17 6.3.4 Submerged Aquatic Vegetation 29
6.3.5 Wetlands 29 6.3.6 Water Quality 29

TABLE OF CONTENTS (Cont’d)
Item Page
6.4 CULTURAL AND ECONOMIC ENVIRONMENT 31 6.4.1 Socioeconomic Resources 31 6.4.2 Environmental Justice 33 6.4.3 Military Use/Navigation 34 6.4.4 Historic Resources 34 6.4.5 Archaeological Resources 36 6.4.6 Architectural Resources 37 6.4.7 Aesthetics 38 6.5 NOISE 39
6.6 HAZARDOUS MATERIALS 40
6.7 AIR QUALITY 41
7.0 ENVIRONMENTAL CONSEQUENCES OF THE PROPOSED ACTION 42
7.1 PHYSICAL SETTING 42 7.1.1 Geology and Soils 42
7.1.2 Beach Profile 43
7.2 ENVIRONMENTAL RESOURCES 43
7.2.1 Terrestrial Flora and Fauna 43
7.2.2 Aquatic Wildlife 44
7.2.3 Essential Fish Habitat 45
7.2.4 Threatened and Endangered Species 48
7.2.5 Submerged Aquatic Vegetation 52
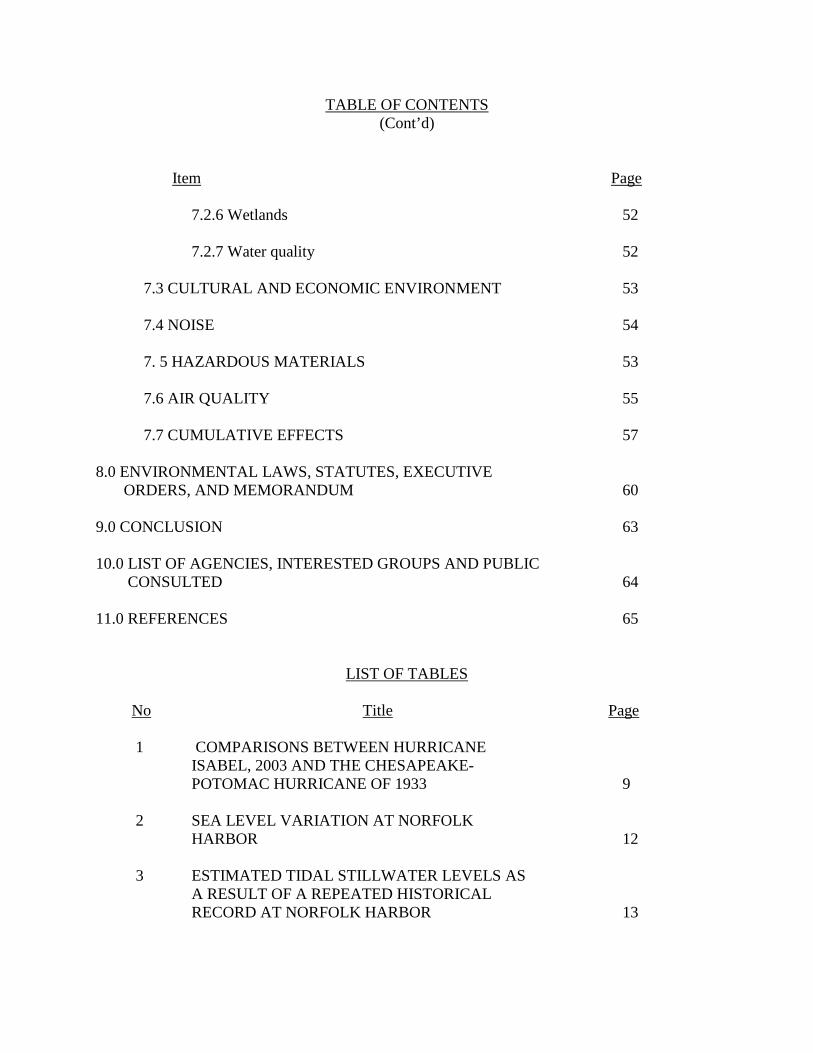
TABLE OF CONTENTS (Cont’d)
Item Page 7.2.6 Wetlands 52
7.2.7 Water quality 52
7.3 CULTURAL AND ECONOMIC ENVIRONMENT 53 7.4 NOISE 54
7. 5 HAZARDOUS MATERIALS 53 7.6 AIR QUALITY 55 7.7 CUMULATIVE EFFECTS 57
8.0 ENVIRONMENTAL LAWS, STATUTES, EXECUTIVE ORDERS, AND MEMORANDUM 60 9.0 CONCLUSION 63 10.0 LIST OF AGENCIES, INTERESTED GROUPS AND PUBLIC CONSULTED 64 11.0 REFERENCES 65
LIST OF TABLES No Title Page 1 COMPARISONS BETWEEN HURRICANE
ISABEL, 2003 AND THE CHESAPEAKE- POTOMAC HURRICANE OF 1933 9
2 SEA LEVEL VARIATION AT NORFOLK HARBOR 12 3 ESTIMATED TIDAL STILLWATER LEVELS AS A RESULT OF A REPEATED HISTORICAL RECORD AT NORFOLK HARBOR 13

LIST OF TABLES (Cont’d)
No Title Page
4 ESSENTIAL FISH HABITAT AS DESIGNATED BY NOAA FISHERIES FOR THE WILLOUGHBY SPIT PROJECT AREA 21 5 FEDERALLY LISTED SPECIES THAT MAY OCCUR ALONG THE ATLANTIC COAST OF SOUTHERN VIRGINIA 22 6 RECORDED ARCHITECTURAL PROPERTIES
POTENTIALLY AFFECTED BY THE PROJECT 38
7 PERMISSIBLE NON-DEPARTMENT OF DEFENSE NOISE EXPOSURES 39 8 ESTIMATED EMISSIONS FOR THE
PREFERRED ALTERNATIVE (TONS PER YEAR) 56
LIST OF PLATES No. Title
1 PROJECT LOCATION
2 STUDY AREA MAP 3 DESIGN OF THE PREFERRED ALTERNATIVE 4 LOCATION OF POTENTIAL BORROW SITES 5 TYPICAL BEACH PROFILE 6 TIDAL VARIATION IN THE HAMPTON ROADS AREA
RESULTING FROM THE 1933 HURRICANE 7 TIDAL VARIATION IN THE HAMPTON ROADS AREA
RESULTING FROM HURRICANE ISABEL

LIST OF PLATES (Cont’d)
No. Title
8 RECORDED PEAK WATER LEVELS FROM THE 1933 HURRICANE AND FROM HURRICAN ISABEL
9 THE STORM TRACKS OF THE 1933 HURRICANE
AND HURRICANE ISABEL
10 PREDICTED AND OBSERVED WATER LEVELS MEASURED AT SEWELLS POINT, VA TIDAL GAGE FROM NOVEMBER 01, 2009 TO NOVEMBER 30, 2011
11 OBSERVED AND PREDICTED WATER LEVELS
MEASURED AT SEWELLS POINT, VA TIDAL GAGE FROM NOVEMBER 10, 2009 TO NOVEMBER 15, 2011 (IMAGE FROM NOAA)
12 HISTORICAL TRENDS FROM THE SEWELLS
POINT, VA TIDE GAUGE
13 HISTORICAL TRENDS FROM THE SEWELLS POINT, VA TIDE GAUGE
14 HISTORICAL TRENDS FROM THE SEWELLS
POINT, VA TIDE GAUGE
15 HISTORICAL TRENDS FROM THE SEWELLS POINT, VA TIDE GAUGE
16 HISTORICAL SEA LEVEL CHANGE TRENDS FROM THE SEWELLS
POINT, VA TIDE GAUGE
17 TYPICAL VEGETATION PROFILE FORM A BEACH LOCATED ALONG THE CHESAPEAKE BAY
18 HISTORIC MAPS OF WILLOUGHBY SPIT AND
OCEAN VIEW
19 HISTORICAL MAPS AND OCEAN VIEW 20TH CENTURY DEVELOPMENT

LIST OF PLATES (Cont’d)
20 ARCHAEOLOGICAL SURVEY AREAS
21 ARCHITECTURAL INVENTORY OF WILLOUGHBY AND OCEAN VIEW


1
ENVIRONMENTAL ASSESSMENT
WILLOUGHBY SPIT AND VICINITY
1.0 INTRODUCTION The Willoughby Spit and Vicinity project is located entirely within the city of
Norfolk and consists of 7.3 miles of shoreline within southern Chesapeake Bay extending east from the tip of Willoughby Spit near the Hampton Roads Bridge-Tunnel to the Federal navigation project at Little Creek Inlet as shown on Plates 1 and 2. The project was authorized for construction by Section 501 of the Water Resources Development Act of 1986 (Public Law 99-662), which states:
“The following works of improvement for the benefit of shoreline protection are adopted and authorized to be prosecuted by the Secretary substantially in accordance with the plans and subject to the conditions recommended in the respective reports designated in this subsection, except as otherwise provided in this subsection. Construction of the projects authorized in this title shall be subject to determinations of the Secretary, after consultation with the Secretary of Interior, that the construction will be in compliance with the Coastal Barrier Resources Act (Public Law 97-348).”
This area was the subject of a four-year investigation conducted by the Norfolk District Corps of Engineers, which culminated in the completion in January 1983 of a Feasibility Report and Final Environmental Impact Statement entitled “Willoughby Spit and Vicinity, Norfolk, Virginia, Hurricane Protection and Beach Erosion Control.” The document concluded that the threat of coastal storm damage was a major problem along the project area shoreline and recommended the construction and periodic nourishment of a 60-foot-wide protective beach berm at an elevation of 5.0 feet above mean low water, along the entire shoreline where an adequate berm did not exist. This recommendation was later authorized as a Federal project in the Water Resources Development Act of 1986.
During the late 1980’s and early 1990’s, the city of Norfolk chose to implement
small, stopgap projects along the project area in lieu of supporting the authorized Federal project. In February 1998, the city entered into a design agreement to initiate design investigations for the authorized Federal project. However later that year, the city requested that the design be terminated because the city had concluded that the Federal project would not accommodate its needs and schedule for a storm damage reduction project. The project was terminated at that time and the remaining design funds of $350,000 were reprogrammed from the project.
The city of Norfolk proceeded on its own to build breakwaters and to obtain
beach nourishment from another source in 1998. With the assistance of the Commonwealth of Virginia, the city constructed a series of breakwaters along the project
2
shoreline in the late 1990’s. However, Commonwealth funding was discontinued before beach nourishment behind the breakwaters could be accomplished, leaving the project area with a reduced level of protection. Shoreline recession, especially along the easternmost portion of the project area, continues to be a major problem. The city has recently requested a restart of the Pre-Construction Engineering and Design (PED) phase effort to include the conduct of a General Reevaluation Study to determine continued Federal interest in the authorized project or a reformulated project.
Congress added funds and corresponding language in Fiscal Year 2004, which
directed the Corps of Engineers to conduct a reconnaissance study to determine if the authorized project continued to meet the current needs of the city of Norfolk, was still economically feasible, and in the Federal interest to construct. That report, which was completed in September 2004, determined that the authorized project or a reformulated project would be in the Federal interest and recommended the conduct of the General Reevaluation Study. This Environmental Assessment (EA) has been prepared to present the impacts that could potentially result from beach nourishment of the bay front and the associated source of beach borrow material for continuing beach nourishment and hurricane protection. The purpose of this EA is to evaluate whether or not the proposed action has the potential for creating significant impacts to the environment and thereby warrants a more detailed study on impacts, mitigation, and alternative courses of action. The evaluations are based on Federal, state, and local statutory requirements and an assessment of USACE environmental, engineering, and economic regulations and criteria. 2.0 NATIONAL ENVIRONMENTAL POLICY ACT of 1969 (NEPA) CONSIDERATION
The NEPA and Title 40 of the Code of Federal Regulations, Parts 1500-1508 (40 CFR 1500-1508) require Federal agencies to consider the potential environmental consequences of proposed actions and alternatives. Executive Order (EO) 11514, Protection and Enhancement of Environmental Quality (amended by EO 11991), provides a policy directing the Federal government to take leadership in protecting and enhancing the environment. 3.0 PURPOSE AND NEED FOR THE PROPOSED ACTION
The purpose of the proposed action is to provide protection from erosion induced damages and also to provide limited protection to the beach and to residential structures from storm damage. Historically, the Willoughby Spit-Ocean View shoreline has undergone periods of alternating recession and accretion with an overall trend toward recession. The shoreline is exposed to open bay fetch conditions as well as some oceanic conditions. Long term erosion rates range from 2.5 feet to 6.0 feet per year, with the east end of the study area being the most affected. Renourishment is necessary to reinforce the beach berm in anticipation of northeasters and hurricanes over the 50-year project life. The November 2009 nor’easter, impacted the beach front, reducing it from 300 feet (including berm) at low tide to an average of 136 feet in width at low tide.

3
4.0 DESCRIPTION OF THE PROPOSED ACTION The proposed action would involve beach nourishment at the Willoughby Spit-
Ocean View shorefront. The project would provide for a beach berm along the entire 7.3-mile study area shoreline from the inlet at Little Creek to the tip of Willoughby Spit, where an adequate berm does not presently exist, as well as the accomplishment of periodic nourishment as needed (Plate 4). The protective beach would consist of a berm 60 feet wide at elevation of 3.5 feet NAVDA with a with a foreshore slope of 1 on 20 extending to the natural bottom, requiring approximately 1.2 million cubic yards (yd3) of sandy fill from the Thimble Shoal Auxiliary Channel to be placed along the shoreline initially to increase the effectiveness of the existing beach in preventing storm damage. This would include "advance nourishment" material to ensure that the project design berm would be maintained throughout the cycle until the next nourishment event. Acceptance section surveys would be performed before and after placement of sandy material on the beach to determine whether the contractor has achieved the beachfill contract requirements. The city of Norfolk would be required to maintain the current dune structure in the project area throughout the 50-year life of the project at its own expense.
The Tentatively Selected Plan (TSP) would require periodic nourishment in order
to maintain the integrity of the protective berm. The beachfill is designed to be sacrificial, as the sandy material would erode during storm events. Also, the material would be susceptible to longshore and cross-shore sediment transport on a daily basis. Periodic beach renourishment would be required to maintain the 30-foot design berm and the effectiveness of the storm damage prevention, and the selected plan would require approximately 445,100 cubic yards of sand to be placed on the project beach on an average of every 9 years depending upon weather conditions, availability of funding, and behavior of subsequently placed material at the project site. Between each of the beach nourishment cycles, monitoring of the beach and borrow areas would be required and would consist of topographic and hydrographic surveys and sampling, as required. Periodic maintenance quantities would vary from one nourishment cycle to the next.
The preferred borrow area would be the Thimble Shoal Auxiliary Channel which
is located within the lower Chesapeake Bay, east of the project area as shown on Plate 4. Material would likely be removed by cutterhead suction dredge or by trailing suction hopper dredge. The hydraulic dredge would pump the material ashore for dispersal as slurry, through a pipeline deployed on the seabed. The hopper dredge is equipped with drag heads and a hopper which collects sand. When the hopper is full, material is transported to a pump-out buoy located offshore. The material would then be pumped through a discharge pipeline, which runs along the ocean floor, and up onto the beach where bulldozers and graders would distribute the material.
5.0 ALTERNATIVES TO THE PROPOSED ACTION 5.1ALTERNATIVES ELIMINATED FROM DETAILED EVALUATION
5.1.1 Structural Measures. Structural measures are generally intended to physically prevent or control flooding. These structures include seawalls, bulkheads, revetments, groins, breakwaters, and/or a combination of some or all of these methods.

4
There are several existing hard structures protecting portions of the beach in the project area. Construction of structures in the project area began in the 1920’s with a series of 62 groins constructed along the ocean front by private land owners. The most recent construction action involved the construction of breakwaters east of 8th View St in 2006. Rock structures in the project area also include terminal groins at the western limit of the project and at the Little Creek Inlet and a number of offshore breakwaters.
Structural measures involved the construction of additional rock structures,
including revetments and seawalls. This alternative was screened out. Structure types that have not been utilized within the project limits, such as seawalls and revetments, are not appropriate for the usage and level of development in the project area. The benefit of the construction of additional groins and breakwaters was assessed and no additional benefit would be gained from this alternative.
5.1.2 Sand Retention Structures and Beach Nourishment. Coastal flood damage
reduction is usually accomplished with a combination of sand retention structures and beach nourishment. Beach nourishment is a process where sand, lost through erosion or longshore drift is replaced from sources other than the eroding beach. A wider beach can reduce storm damage to structures built on the coast by dissipating energy across the surf zone, protecting upland structures and infrastructure from storm surges and unusually high tides. Numerous beach nourishment projects have been completed in the Willoughby Spit area beginning in the 1940’s (Hardaway et al., 2005). Some of these projects are listed below:
1948 – 50,000 cubic yards (cy) dredge material from Little Creek Inlet 1953 – 70,000 cy dredge material from Little Creek Inlet 1960 – 159,000 cy placed near the Little Creek Inlet 1962 – 176,000 cy placed along the westernmost 7,000 ft of the Willoughby Spit 1982 – 400,000 cy placed in the eastern end of the project site 1984 – 537,000 cy placed along the entire length of Willoughby Spit 1987 – 50,000 cy placed at Sarah Constant Shrine Beach Park 1989 – 133,000 cy placed in the eastern end of the project site 2002 – 3,438 cy placed in the eastern end of the project site 2003 – A large beachfill placed in the eastern end of the project site A plan that included both sand retentions structures and beach nourishment was
screened out because additional structures were either inappropriate for the project area or they would not provide additional benefits.
5.1.3 Non-structural Solutions. Non-structural measures are actions that reduce or
avoid flood damages without significantly altering the nature or extent of flooding, by changing the use made of floodplains or accommodating existing uses to the potential flood hazard. Solutions investigated for this alternative included: continued participation in the National Flood Insurance Program, employment of flood plain and subdivision regulations, review and development of an improved forecasting, warning, and temporary evacuation system, placement of warning signs in the flood plain, development of open

5
space for uses compatible with potential flood hazard, flood proofing and permanent evacuation.
This alternative was screened out because the non-structural actions were either
already in place, not cost effective or would not address the problem. For example, there is an evacuation route from Willoughby Spit-Ocean View and residents, tourists, and business proprietors receive warnings from the National Weather Service by radio and television on predicted storm events. In addition, the city of Norfolk has zoning already in place to manage areas that are subject to flooding. Floodplain/Coastal Hazard Overlay Districts ("FPCHOs") were created which include areas that have a one percent chance or greater of flooding in any given year as identified by the Federal Emergency Management Agency (FEMA). The city regulates construction in these areas in order to reduce the “loss of property and life, the creation of health and safety hazards, the disruption of commerce and governmental services, the extraordinary and unnecessary expenditure of public funds for flood protection and relief, and the impairment of the tax base” (City of Norfolk, 2012). Flood proofing, on the other hand, would not have any impact on the existing erosion problem, and permanent evacuation would not be acceptable to the local residents and is not economically justified.
5.2 PREFERRED ALTERNATIVE - BEACH NOURISHMENT ONLY
The preferred alternative includes beach nourishment only. Beach nourishment, also known as replenishment, beachfill, and restoration, is best defined as the placement of large quantities of good quality sand on the beach to advance it seaward. The sand is placed on the shoreline by mechanical means, such as dredging and pumping from offshore deposits or overland hauling and dumping by trucks. The beach nourishment functions as eroding buffer zones, and as large waves strike the beach sand is carried offshore and deposited onto a bar. As the bar grows, it causes incoming waves to break farther offshore. The useful life of such a beach, which depends on how quickly it erodes, can be completely eliminated in a short period of time by a rapid succession of severe storms; therefore, the owner must expect to periodically add more fill as erosion continues. The rate at which new fill must be added depends on the relative coarseness of the fill material in relation to the native beach material. Fill and native beach materials should be perfectly matched, but this is virtually impossible. For example, if fill material is coarser than the native material, the fill erodes more slowly and if it is finer, it erodes more quickly. Beach nourishment is often used in combination with construction of other protection methods such as coastal structures. The resulting beach provides some protection to the area behind it and also serves as a valuable recreational resource. The effects of beach nourishment are generally short-lived (as long as the supply of material exists).
5.2.1 Alternative 1 – Tentatively Selected Plan. This plan is also called the Authorized plan and the locally Preferred Plan in the accompanying GRR. Throughout the remainder of the document, the plan will be referred to as the Tentatively Selected Plan (TSP). The project consists of a berm with an average width of 60-feet constructed at an elevation of 5.0 feet above mean low water with a foreshore slope of 1 on 20 extending to the natural bottom. The initial placement of sand would be approximately

6
1.2 million cubic yards (yd3). The sponsor would continue to maintain the existing dunes at their expense.
Three potential borrow sites were identified for Willoughby Spit and Vicinity and are all located within the Chesapeake Bay. The Thimble Shoal site is located in the auxiliary channels of this channel coming into the port. The Willoughby Banks site is located approximately one mile offshore of Willoughby Spit. The Hampton/Buckroe Beach site was an alternative site to the Chesapeake Bay Shoreline, Hampton, VA, Hurricane and Storm Damage Reduction Study and is located approximately five miles away across the Thimble Shoal navigation channel offshore of Hampton, VA.
The preferred borrow area will be the Thimble Shoal Auxiliary Channel which is
located within the lower Chesapeake Bay, east of the project area as shown on Plate 1. Material would likely be removed by cutterhead suction dredge or by trailing suction hopper dredge. The hydraulic dredge would pump the material ashore for dispersal as slurry, through a pipeline deployed on the seabed. The hopper dredge is equipped with drag heads and a hopper which collects sand. When the hopper is full, material is transported to a pump out buoy located offshore. The material would then be pumped through a discharge pipeline, which runs along the ocean floor, and up onto the beach where bulldozers and graders would distribute the material.
The TSP would require periodic nourishment in order to maintain the integrity of
the protective berm. Although the actual nourishment requirements would be evaluated on an annual basis, nourishment cycles in the original feasibility report were projected to be 5, 10 and 15 years for East Ocean View, Central Ocean View, West Ocean View and Willoughby Spit, respectively. The renourishment cycle would be approximately 9 years. Nourishment would occur when the 60-foot berm had eroded to a design width of 30-feet. Approximately 452452,000 yd3 of beach quality sand would be placed on the beach for every re-nourishment cycle depending upon weather conditions, availability of funding, and behavior of subsequently placed material at the project site. 5.2.2 Alternative 2 - The National Economic Development Plan. The NED plan consists of a berm with an average width of 50 feet constructed at an elevation of 3.5 NAVD 88above mean low water with a foreshore slope of one on 20 extending to the natural bottom. The plan would also include the enhancement of the existing dune system, where needed, to provide for a system with an elevation of at least 14 feet NAVD 88, a crest width of 30 feet, and a fore-shore slope of one (horizontal) on five (vertical). The plan would require periodic nourishment in order to maintain the integrity of the protective berm and dune system. Nourishment would occur at such time that the 50-foot berm had eroded to a design width of 25 feet. Although the actual nourishment requirements would be evaluated on an annual basis, nourishment cycles were projected to be required once every 11 years on average. 5.3 NO ACTION ALTERNATIVE
In the absence of a Federal project, it is likely that conditions as they currently exist would continue into the foreseeable future. The city of Norfolk will continue to

7
nourish the study area beach to a limited extent in response to major storm damage/losses, although such efforts will become increasingly more difficult as the availability of suitable sand diminishes over time. The city’s efforts over the past two decades have been insufficient as indicated by the existing condition of the study area beach as substantial problems still exist as the distances between structures and the beachfront continues to decline. Implementation of the No Action Alternative (NAA) would result in continued degradation and erosion of the beachfront, which is exposed to high wave energy during storm events. Long term erosion rates range from 2.5 ft to 6.0 ft per year, with the east end of the study area being the most affected. Historically, the Willoughby Spit-Ocean View shoreline has undergone periods of alternating recession and accretion with an overall trend toward recession. An erosion rate over the 50-year planning period is expected to approximate that of the historical average. Without a project, storms would continue to inflict expensive damages from erosion and storm surge along the bay front, and large portions of the beach would continue to be vulnerable. 6.0 ENVIRONMENTAL CONDITIONS 6.1 PHYSICAL SETTING
Knowledge of such physical phenomena as storms, tides, waves, winds, and their magnitudes is necessary in order to identify the many forces affecting the coastal waters and the beach adjacent thereto. Establishment of these forces is necessary to analyze their effects on development along the shoreline under existing conditions and also to consider the design of possible protective structures. 6.1.1 Placement Site. The Norfolk shoreline is one long curvilinear coast that is mostly beach and dune with individual sites containing bulkheads, breakwaters and groins. The littoral system is sand rich from material coming through the mouth of the Chesapeake Bay. This is evidenced by mostly sand beaches along the coast and a complex system of offshore sand bars. These sand bars greatly influence, and are themselves influenced, by the impinging wave climate (Hardaway et al., 2005). Beaches typically consist of several conspicuous regions as shown on Plate 5. Furthest away from the waterline, a beach profile begins at the secondary dune, while the primary dune is the first sandy ridge backing the beach. Swales are low-lying areas between and behind secondary and primary dunes. Primary dunes absorb the initial impact of strong storms and help protect manmade structures built behind them. The secondary dune is usually more stable than the primary dune, because primary dunes block most of the wind and salt spray. Dunes are areas where sand accumulates and as a result, represent a net positive sediment budget at the site. However, all beach habitat is dynamic and sediment accumulation or loss is dependent on coastal location. Typically, there are no secondary dunes along the Willoughby Spit-Ocean View beach. The backshore is the region of a beach from the berm crest landward (to the foredune ridge, vegetation line, seawall etc.) and is typically beyond the reach of ordinary waves and tides but is influenced by wind Plate 5. Common plant species include sea oat (Uniola paniculata), seaside goldenrod (Solidago sempervirens), and sea rocket (Cakile

8
edentula). This is an area subject to harsh environmental and physical changes, including a wide temperature range, salinity fluctuations, and wave action that causes cycles of erosion and accretion. The foreshore is the sloping portion of the beach between the limits of high tide and low tide swash which includes the entire intertidal (beach face and low tide terrace) area affected by swash and backwash. The beach face is commonly separated by a plunge step, a small trough filled with coarse sand or shells formed by the breaking of small plunging waves at the base of the beach face. The foreshore is the zone that is submerged at high tide and exposed at low tide.
The nearshore is seaward of the foreshore, and is submerged even at low tide. This zone extends seaward from the mean low water line to well beyond the breaker zone. Most sediment is transported in the nearshore, both along the shore and perpendicular to it.
6.1.2 Borrow Site. Material for the beachfill will be dredged from Thimble Shoal
Auxiliary Channel which is located in the mouth of the Chesapeake Bay as shown on Plate 3 and runs east to west from Hampton, VA to Cape Henry, VA. Thimble Shoal Channel is approximately 9.9 nautical miles long, with its eastern end located at the naturally deep main entrance to Chesapeake Bay, just north of Cape Henry, and its western end at the naturally deep entrance to Hampton Roads, north of the western section of Ocean View, Norfolk, Virginia. The main channel is 1000 ft wide with a nominal water depth of 45 ft MLW. The Auxiliary channels, which are 450 ft in width, flank the main channel on both sides and have a nominal water depth of 32 ft MLW. Material for the beachfill would be dredged from Thimble Shoal Auxiliary Channel which is located in the mouth of the Chesapeake Bay as shown on Plate 4 and runs east to west from Hampton, VA to Cape Henry, VA. The auxiliary channels are 500-foot wide reaches of seafloor that run along both sides of the main channel. 6.2 NATURAL FORCES 6.2.1 Climate. Norfolk’s climate is temperate with moderate, seasonal changes. Winters are generally mild, and summers, though long and warm, are frequently tempered by cool periods resulting from winds off the Chesapeake Bay and nearby Atlantic Ocean. Occasionally, during brief periods, the climatic conditions vary extremely due to storms of both extra-tropical and tropical origin. The average annual precipitation is approximately 46.41 inches and is fairly evenly distributed throughout the year, with average monthly amounts ranging from 3.12 inches in February to 5.43 inches in August. Measurable amounts occur on an average of about one of every three days.
Two general types of major storms affect the Chesapeake Bay area in the form of
hurricanes and northeasters. The term "hurricane" is applied to an intense cyclonic storm originating in the tropical and subtropical latitudes in the Atlantic Ocean north of the equator. These storms normally gain intensity as they move over water in the southern latitudes, and decay or decrease in intensity as they pass over land or move into the northern latitudes where conditions are such that the energy of the storm cannot be

9
maintained. A hurricane is characterized by low barometric pressure, high winds (over 74 miles per hour (mph)), heavy rainfall, large waves, and tidal surges. The most severe hurricanes affecting the study area were the August 1933 Chesapeake-Potomac Hurricane and Hurricane Isabel in September, 2003. The Chesapeake-Potomac Hurricane produced wind gusts as high as 82 mph; tides of 7to 9 feet; and a storm surge of 6 to 9 feet.
Hurricane Isabel damages came from the storm surge which inundated areas
along the coast and resulted in severe beach erosion. Hurricane Isabel high water marks resembled and approached the water levels witnessed by the 1933 Chesapeake-Potomac Hurricane. Plates 6, 7, and 8 show the observed water levels (red curves) in Hampton Roads, VA (measured at Sewells Point Tide Gage) during the 1933 Hurricane and Hurricane Isabel. The predicted water levels at the same location (blue curves), and the storm surge (green curve), which is the difference between the predicted wave heights and the observed wave heights.
The following table summarizes the graphs in Plate 8 and shows the differences
between the August 1933 Hurricane and Hurricane Isabel. Plate 9 shows the track of both storms.
Table 1. COMPARISONS BETWEEN HURRICANE ISABEL, 2003 AND THE CHESAPEAKE-POTOMAC POTOMACHURRICANE OF 1933
Storm Storm Tide
(height above MLLW) Storm Surge
(height above normal) Mean Water Level
(height above MLLW) August 1933
8.018 ft (2.444 m) 5.84 ft (1.78 m) 0.95 ft (0.29 m)
September 2003
7.887 ft (2.404 m) 4.76 ft (1.45 m) 2.30 ft (0.70 m)
"Northeaster" (also Nor’easter) is the term given to storms that occur during the fall, winter, and spring months along the Atlantic Coast and are characterized by high winds circulating around an essentially stationary low pressure, producing high tides, large waves, and heavy rainfall along the coast. Like all cyclonic wind systems in the northern hemisphere, the wind direction is always rotating inward and counter-clockwise about the low pressure area. Typically, wind systems originate from the northeast quadrant relative to this area, hence the term "northeaster." Northeasters sometimes develop into complex storms having more than one influencing pressure cell. The location of high pressure centers and low pressure centers with respect to each other may greatly intensify the wind speeds that would be expected from a single storm cell. Strong winds reaching almost hurricane strength may occur over many thousands of square miles. Northeasters may form with little or no advance warning and have been known to persist for as long as a week to 10 days; however, the average duration of a northeaster is only about 2 or 3 days.

10
Noteworthy northeasters of the last decade occurred in April 1956, March 1962, and November 2009. The March 1962 northeaster caused serious tidal flooding and widespread damage along the Mid-Atlantic Coast. The November 2009 Mid-Atlantic northeaster (also known as Nor’Ida) was a vigorous fall northeaster that caused widespread damage throughout the Atlantic coast. This extra-tropical cyclone formed in relation to Hurricane Ida's mid-level circulation across southeastern Georgia, migrated east-northeast offshore North Carolina before slowly dropping south and southeast over the next several days. As the storm traveled southeast of the Chesapeake Bay, persistent onshore waves carried elevated water levels to some areas for up to four days, bringing a storm surge to much of the region and reaching record levels set by Hurricane Isabel in 2003. In the city of Norfolk, a maximum storm surge of 7.74 feet was measured. Plates 10 and 11 show the water level data as a result of Nor’Ida, with peaks from November 01, 2009 to November 30, 2009 as measured at Sewells Point.
6.2.2 Winds. A study of recorded and possible wind velocities, duration, and
direction is necessary to determine their effect on the characteristics of waves likely to be experienced in the study area. Wind-generated waves are the primary cause of loss of material from the beaches. The design height of shore protection structures is dictated to a great degree by the height and force of the waves likely to be experienced.
A compilation of wind velocities, durations, and directions was made from the
records of the United States Weather Bureau Station located at Cape Henry, VAVA. Destructive wave attack and elevated water levels are caused by winds which have components ranging from north-northeast clockwise to an easterly direction. The prevailing local winds were from the southern quadrants, but the velocities and total wind movement were greater from the northern quadrants. This data, along with the information available from the March 1962 northeaster, cover the most severe periods which have been experienced to date and are considered adequate for this study.
6.2.3 Waves and Swells. The Willoughby Spit-Ocean View area is open to wave
attack from the north clockwise to the east. As storm waves approach the shoreline, their characteristics are altered by bottom friction, change in water depth, and local meteorological conditions such as wind or rain. Normally the waves are moderate in height since the average velocity of the winds is only about 13 miles per hour; however, during storms northerly to easterly winds with large fetches produce waves which impinge heavily on the shores. The beach erosion and practically all of the structural and property damage along the beach is a direct result of storm-generated waves.
The Chesapeake Bay is a very complicated area for estimating wave data because
of characteristics such as refraction, shoaling, currents, and non-uniform topography. The study area is no exception and any gage or historical observations are considered critical to the formulation of plans. In this regard, three years of wave data are available in "Wave Climate at Selected Locations along U.S. Coasts" (CERC TR 77-1). Although the fetch distribution is somewhat different because the gage was not specifically located in the study area, it is representative of the wave distribution that can be experienced at Willoughby Spit-Ocean View. Historically, the study area was among the hardest hit
11
sections of the city during northeasters and hurricanes. Wave heights on the order of 7 to 10 feet were reported during this event by observers within the area as shown on Plates 12 through 15.
6.2.4 Tides. Tides in the Chesapeake Bay at Willoughby Spit-Ocean View are
uniformly semi-diurnal with the principal variations following the changes in the moon's distance and phase. The mean range of tide is 2.6 feet and the spring range is 3.1 feet. The Swells Point mean range of tide is 2.43 feet and the diurnal range is 2.76 feet. Maximum tidal currents average about 1.0 knot flood and 0.8 knots ebb at 0.7 nautical miles north of Willoughby Spit. Variations in water surface elevations of more than 9 feet have resulted from storms and studies indicate that tides in excess of 10 feet above mean sea level are possible.
The existing Thimble Shoal Channel area is tidally flushed and has relatively
significant freshwater inflows. The mean tidal range for Thimble Shoal is 4.6 feet mean sea level (msl) with spring tide of 5.1 feet msl. Tides are semi-diurnal and their circulation relatively complex.
6.2.5 Littoral Transport. Littoral transport is the movement of sedimentary material (littoral drift) caused by waves and currents in the littoral zone. As wave trains approach a shore at an angle, they generate an alongshore current which moves sediment that has been placed in suspension by wave action. This shore-parallel movement of sediment is called longshore transport. The direction of longshore transport is mostly dependent on the angle of wave approach with shoreline orientation and nearshore bottom geometry affecting it to a lesser degree. The Willoughby Spit area has a definite east to west net longshore transport as is evidenced by the buildup of sand on the east side of the numerous groins along the study area and a large accumulation of sand at the western tip of Willoughby Spit. Transport of material perpendicular to a shoreline (onshore-offshore transport) is also influenced by the above factors.
In the vicinity of the southern Chesapeake Bay shoreline, the net littoral transport
is from east to west. This is evidenced by several structures constructed in the surf zone that exhibit sand buildup on the east sides of the structures and a prime example of this is the groin field along Willoughby Spit and West Ocean View. There are also various temporal and spatial direction reversals in the littoral transport along the southern Chesapeake Bay shoreline.
Dye tracer studies by Das (1972) have indicated various temporal and spatial
direction reversals in the littoral transport along the southern Chesapeake Bay shoreline. Fleischer, P., G. McRee, and J. Brady (1977) have found a transport reversal in Central Ocean View with the convergence point estimated to be off Community Beach and the divergence point near First View Street.
Based on evidence such as unfilled dredged trenches in the nearshore area updrift
of Little Creek Inlet, a relatively small updrift fillet east of the entrance to the jetty, and minimal filling of the Little Creek entrance channel, littoral transport along the southern
12
shoreline of the Chesapeake Bay is apparently small. The magnitude of the rate of littoral transport in the vicinity of the study area was investigated by Das using wave hindcasting methods and wave energy flux considerations as presented in the Shore Protection Manual (USACE, 1977). Based on these investigations, Das calculated the net transport rate to be about 36,000 cubic yards per year from east to west. However, the professional consensus is that the net westerly transport rate is no more than 10,000 cubic yards per year.
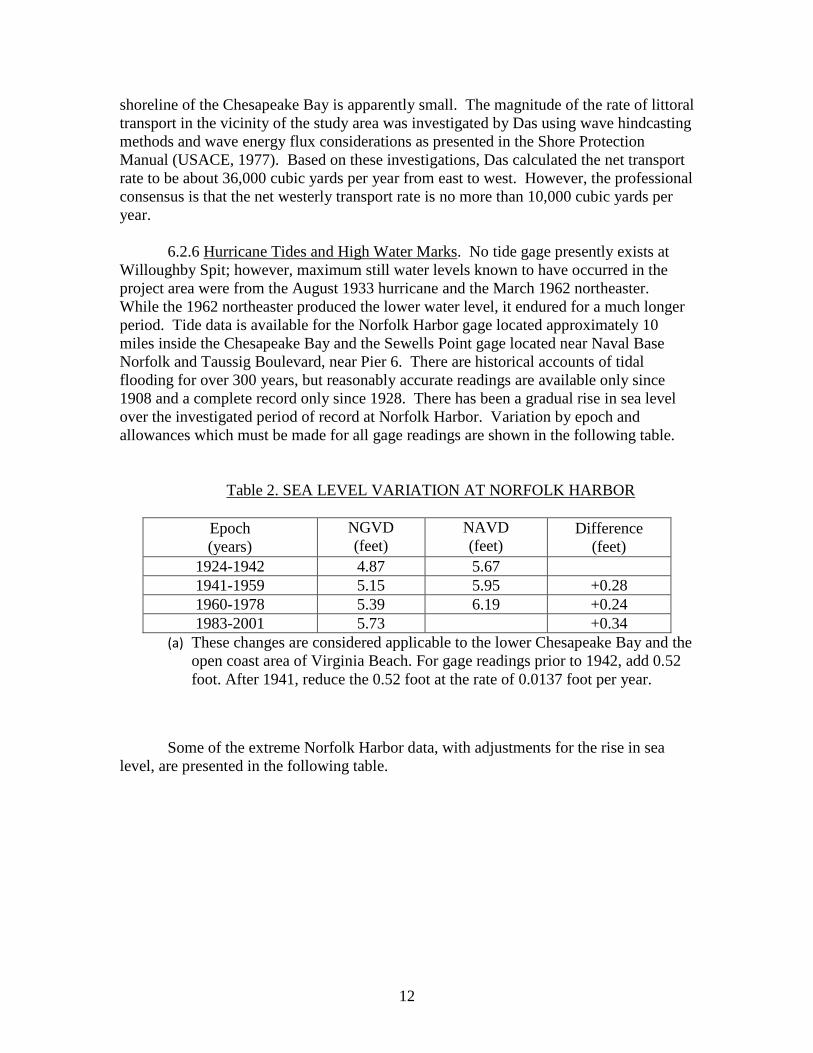
6.2.6 Hurricane Tides and High Water Marks. No tide gage presently exists at Willoughby Spit; however, maximum still water levels known to have occurred in the project area were from the August 1933 hurricane and the March 1962 northeaster. While the 1962 northeaster produced the lower water level, it endured for a much longer period. Tide data is available for the Norfolk Harbor gage located approximately 10 miles inside the Chesapeake Bay and the Sewells Point gage located near Naval Base Norfolk and Taussig Boulevard, near Pier 6. There are historical accounts of tidal flooding for over 300 years, but reasonably accurate readings are available only since 1908 and a complete record only since 1928. There has been a gradual rise in sea level over the investigated period of record at Norfolk Harbor. Variation by epoch and allowances which must be made for all gage readings are shown in the following table.
Table 2. SEA LEVEL VARIATION AT NORFOLK HARBOR
Epoch (years)
NGVD (feet)
NAVD (feet)
Difference (feet)
1924-1942 4.87 5.67 1941-1959 5.15 5.95 +0.28 1960-1978 5.39 6.19 +0.24 1983-2001 5.73 +0.34
(a) These changes are considered applicable to the lower Chesapeake Bay and the open coast area of Virginia Beach. For gage readings prior to 1942, add 0.52 foot. After 1941, reduce the 0.52 foot at the rate of 0.0137 foot per year.
Some of the extreme Norfolk Harbor data, with adjustments for the rise in sea level, are presented in the following table.

13
Table 3. ESTIMATED TIDAL STILLWATER LEVELS AS A RESULT OF A REPEATED HISTORICAL RECORD AT NORFOLK HARBOR
Date Maximum elevations in feet (NGVD)
Maximum elevations in feet (NAVD)
23 August 1933 8.05 8.85 18 September 1936 7.55 8.35 7 March 1962 7.06 7.86 16 September 1933 6.35 7.15 11 April 1956 6.34 6.14 12 September 1960 6.09 6.89 18 September 1928 5.85 6.65 27 April 1978 5.84 6.64 27 September 1956 5.74 6.54 6 October 1957 5.53 6.33 5 October 1948 5.35 6.15
(a) Allowances for increases in sea level have been incorporated.
6.2.7 Sea Level Change. Sea level change (SLCSLC) is predicted to continue in the future as the global climate changes. A recent study conducted for the Corps of Engineers by the Virginia Institute of Marine Science (VIMS),entitled “Chesapeake Bay Land Subsidence and Sea Level Change” (Boon et al., 2010) predicts a change in relative sea level rise ranging from .114 in/year to .22 in/year in the Chesapeake Bay. This equates to approximately one half foot of sea level rise (SLR) to one foot of SLR over the next 50 years. Additionally, USACE recently issued EC 2-2-211, “Incorporating Sea-Level Change Considerations in Civil Works Program”. This USACE guidance document provides three different accelerating eustatic, (worldwide changes in sea level) SLC scenarios: a conservative scenario (historic rate of sea level rise), an intermediate scenario and a high scenario. The scenarios presented in the USACE guidance estimate SLR thru 2065 to be .73 feet for the conservative approach, 1.14 feet for the intermediate approach and 2.48 feet for the high scenario. Plate 16 illustrates the historic SLC as documented by the Sewells Point tide gauge, which is the closest tide gauge to the project area. 6.2.8 Geology and Soils. 6.2.8.1 General Vicinity & Placement Area - Virginia has a diverse landscape that extends from the high rocky summits in the Blue Ridge Mountains to low-lying barrier islands exposed to the Atlantic Ocean. The city of Norfolk is located in the Coastal Plain Physiographic Province. It is a flat, low-relief region along major rivers and near the Chesapeake Bay. The topography of the Coastal Plain is a terraced landscape that stair-steps from the Fall Zone down to the coast and to the major rivers. This landscape was formed over the last few million years as sea level rose and fell in response to the repeated melting and growth of large continental glaciers and as the Coastal Plain slowly uplifted. The Virginia Coastal Plain is underlain by a thick wedge of sediments that

14
increases in thickness from a featheredge near the Fall Zone to more than 4,000 meters under the continental shelf. These sediments rest on an eroded surface of Precambrian to early Mesozoic rock. Two-thirds of this wedge is comprised of late Jurassic and Cretaceous clay, sand, and gravel (College of William & Mary, 2006). Soils in the Coastal Plain were developed from unconsolidated marine sediments and the texture of these soils is generally sandy silt from flood plain deposits, clayey silt on fluvial terraces, fine silty sand on higher marine terraces, and clayey silt from Coastal Plain peneplain. These soils are deep, but their drainage characteristics range from well-drained to poorly-drained. Wetness and poor drainage are prevalent in a number of locations in the region. The Chesapeake Bay coast of the city of Norfolk is exclusively Holocene beach sands which overlie earlier Holocene sands, mud and clays (Hardaway et al., 2005). Willoughby Spit beach consists primarily of sandy material, which originated from the site and has been placed there during beach renourishment projects or deposited by wave action. The mean diameter for all sediment found in the project area is 0.13 phi (0.9 mm). Broken shell hash make up 50% of the largest particles and approximately 10% to 15% of the beach consists of clays and finer size material. In May and September 1988, sediment samples were taken along the survey lines, at the top of the berm, high-tide mark, mid-tide mark, low-tide mark, -3.0, -6.0, -12.0, -15.0 (NGVD) and at the crest of the submarine bar. The mean sediment size for the study area was found to be 0.5 mm. In June 1994, VIMS collected 53 samples along the entire beach profile at six locations along the western portion of project site. Mean grain sizes ranged from 0.5 to 2.2 (phi) with an average of approximately 1 (phi) or 0.5 mm. In April 2004, Moffatt and Nichol analyzed samples from the Ocean View area and reports a median grain size at mid-dune of 0.31 mm, mid-beach 0.39 mm and between high and low water of .45 mm. For the purposes of sand compatibility and overfill calculations, the mean sand grain size of the existing beach would be conservatively set at 0.5 mm. 6.2.8.2 Borrow Area - Chesapeake Bay began to form as a partially enclosed coastal water body separated from the open ocean in the late Pliocene and developed through the Pleistocene and into the Holocene in response to coastal marine processes and major cycles of sea-level rise and fall. During times of emergence and low sea level, the rivers excavated channels in the broad coastal plain and subaerial processes eroded and modified existing landforms. During periods of high sea level, the Delmarva Peninsula lengthened as a major barrier spit, progressively enclosing what was to become the Chesapeake Bay (Hobbs, 2004).
Surface sediments off the lower Chesapeake Bay shoreline in the Thimble Shoal Channel are a combination of silts and clays with detrital sands (USACE, 2002). Benthic populations are sparse and add little surface roughness. Bottom sediment along a profile derived from depth recorder surveys by Ludwick in 1971 showed medium-grained sand. Coarsest quartz grains in each of 15 samples taken from the profile range from 3 to 7 millimeters (mm) in diameter with no systematic variation along the profile. The weight of sediment finer grained than 0.062 mm ranged from 1.7 to 0.7 percent among the

15
samples. Most of the samples contained 10 percent of coarse-grained broken worm shell fragments. Both the shell fragments and the coarse quartz particles were iron-stained, giving the samples a brownish coloration (Ludwick, 1971).
Thirty-one vibracores were performed in the Thimble Shoal Channel during 1983, 1984, and 1985. In 1990, the Corps of Engineers obtained additional samples of the Channel. Areas of suitable sand deposits correspond to station 11+00 to station 132+00 in the Thimble Shoal Channel. This area is 12,800 feet in length and is located east of the Chesapeake Bay Bridge Tunnel. Composite samples, which represent the entire dredge prism, were collected from vibracores during the exploratory studies. Extracted samples were washed and sieved to determine the percent by weight of silt/clay content and the grain size distribution of the sands. The sediment found at Thimble Shoal Channel is composed of silt (35 percent) and sand (65 percent) to a depth of 15 feet. From a depth of 15 feet to greater depths the percentage of silt is 7 percent (USACE, 2002). Suitable beach-quality sand collected from the Channel ranged in mean size from 0.18 to 0.32 mm, with an average size of 0.30 mm. 6.3 ENVIRONMENTAL RESOURCES 6.3.1 Terrestrial Wildlife. Beach surfaces present a harsh environment as the temperature of the sand on a hot, sunny day may be extremely high, but less than an inch below the surface, the temperature is lower and more conducive to life. Therefore, most permanent residents of the upper parts of the beach are burrowers and come out primarily at night. The upper beach, above mean high water, is generally dry except during storms. Storms can significantly modify the physical environment by eroding or accreting the upper beach and altering the beach animal communities. Characteristic species of the backshore region are ghost crabs (Ocypode spp.), sandfleas (Talitridae), hermit crabs (Pagurus sp.), and sand fiddler crabs (Uca pugilator). Many birds also use the beach for breeding, nesting, and feeding. Gulls (Larus spp.), sanderlings (Crocethia alba), fish crows (Corvus ossifragus), and grackles (Quiscalus quiscula) are the most noticeable bird species in this community. Raccoons, mice, rats, opossums, rabbits, snakes, lizards and foxes forage in the primary and secondary dunes. While sea turtles use beaches as nesting areas, there are no recorded nests on the Willoughby Spit-Ocean View beaches because sea turtles utilize ocean beaches and Willoughby Spit is located in the Bay. Residents of the lower beach, nearshore below mean high water, include annelid worms, clams (Donax spp.), and mole crabs (Emerita spp.). These species provide important ecological functions in coastal environments including cycling of organic matter and nutrition and transfer of both primary and secondary production to surf zone fishes and shore birds. As in most harsh environments, the fauna and flora are limited in number of species, often in number of individuals, and the inhabitants include many examples of extreme adaptation to a specialized way of life. Animals that live in shifting sands on marine beaches are well adapted and tolerate environmental extremes in order to feed, burrow, and reproduce.
More than 40 species of mammals inhabit the area of the proposed project, most of which are small creatures, such as mice, rats, squirrels, shrews, squirrels, rabbits,
16
skunks, and voles. Larger mammals, which are more closely associated with uplands, also found in the vicinity of the beach include white-tailed deer (Odocoileus virginianus), common grey fox (Urocyon cinereoargenteus cinereoargenteus), and coyote (Canis latrans). In addition, ten bat species, including the state endangered species Rafinesque’s eastern big-eared bat (Corynorhinus rafinesquii macrotis), utilize the project site. Table C-3 of this appendix lists all of the mammal species that may occur in the project area (VDGIF, 2012).
A variety of reptiles and amphibians is reported to occur within the project area.
Table C-4 of this appendix lists more than 50 species of frogs, toads, tree frogs, salamanders, skinks, snakes, and turtles that may be found within a 3-mile radius of the Willoughby Spit project area (VDGIF, 2012).
More than ninety species of butterflies, moth, ticks, spiders, and flies have been
described by the Virginia FWS to inhabit an area within 3 miles of the placement site. A list of those species in is Table C-5 of this appendix (VDGIF, 2012).
A large number of bird species utilized either the borrow site or placement site for
all or part of their life span. More than 300 species of birds may be found in an area with a 3-mile radius of the placement site. A list of those species is included in Table C-2 of this appendix (VDGIF, 2012).
Ruddy (2000) indicates that all potential borrow areas in this study are used as feeding and resting habitat for wintering waterbirds, although surveys indicate that numbers are low. Species utilizing this area include oceanic ducks, black and surf scoters (Melanitta nigra and N. perspicillata), oldsquaw (Clangula hyemalis), red-breasted merganser (Mergus serrator), red-throated loons (Gavia stellata), and various gulls (Larus spp.). Forsell (2004) surveyed the offshore area from New Jersey to Virginia to determine abundance and distribution of waterbirds during the winters of 2001-2003. Species such as black scoters (Melanitta nigra), surf scoters (M. perspicillata), Northern gannets (Morus bassanus), common loons (Gavia immer), and red-throated loons (G. stellata) were found near the mouth of the Chesapeake Bay. Large flocks of scoters, up to 4,000 birds, were observed from Virginia Beach out to 10 nautical miles offshore. The study included observations of the largest concentration of gannets in the Mid-Atlantic region in the mouth of the Chesapeake Bay. Loons and gannets were most abundant off the shoals throughout the study area. Perry et al., 2007 inventoried diving ducks in the Chesapeake Bay region and noted that while some species’ populations have remained constant since the 1950s, the populations of the buffleheads and mergansers have increased while those of the shallow water pochards (scaup, redheads and canvasbacks) have decreased. Stressors on pochard populations include contaminants, development in the Bay tributaries, and increased boat traffic (Perry et al., 2007). 6.3.2 Terrestrial Vegetation. Due to the added stability of a secondary dune and the harsh living conditions experience on the primary dune, greater plant diversity is found on the secondary dune (Plate 17). Strong winds, salt spray, low soil nutrients, unreliable water supply, shifting sand, and blazing sun causes the dune habitat to
17
resemble a desert. Many of the plants living on the primary dunes have developed adaptations similar to those of desert flora. Succulent leaves, extensive root systems and vertical runners that help the plant stay above the shifting sands. Some common plants that occur on the beach (foredune, dune, and backdune) areas include sea rocket (Cakile edentula), seabeach orach (Atriplex arenaria), sea oats (Uniola paniculat), dune primrose (Oenothera humifusa), sandspur (Centrus tribuloidesa), beach elder (Iva imbricate), and American beach grass (Ammophila breviligulata). In 2008, an invasive plant called beach vitex (Vitex rotundifolia) was discovered on Willoughby Spit, the first discovery of the plant in Virginia. Beach vitex is a native plant of Asia that has ravaged sand dunes in North and South Carolina for many years. Its vines, or runners, can spread up to 60 feet in one year and will overtake native plants and grasses. The city of Norfolk has been trying to control the plant from spreading by applying an herbicide mix and digging up remnants (Harper, 2008).
6.3.3 Aquatic Wildlife. The aquatic habitats included in the project area include the surf zone and nearshore zone. Aquatic organisms are associated with each habitat type.
The surf zone is the area of breaking waves. Seasonal wave patterns, sediment
movement, and storms are major physical forces that influence the distribution and abundance of animals in this zone. Most of the benthic animals, or animals associated with the ocean bottom, living in the surf are adept burrowers, a behavior enhancing survival by maintaining position. The pelagic (i.e., living in the water column) and benthic animals in the surf are limited by wave action, lack of cover, and food supply. Some of the animals migrate onshore and offshore with the tides and seasonal sediment movement; populations are influenced significantly by physical factors (USACE, 1992).
The nearshore zone extends approximately 150 feet seaward of the surf zone to
the continental shelf. This is physically a more stable environment than the beach or surf zone. As a result, both pelagic and benthic animal populations are also more stable and diverse than in the surf zone. The nearshore area serves as spawning grounds and as an important migratory route for anadromous and catadromous finfish. Some common invertebrates found in the nearshore zone of lower Chesapeake Bay waters include brown shrimp (Panaeus aztecus), pink shrimp (P. duorarum), white shrimp (P. setiferus), horseshoe crab (Limulus polyphemus), sea nettle (Chrysaora quinquecirrha), and sea star (Asterias forbesi). Common fish species include the bluefish (Pomatomus saltatrix), windowpane flounder (Scopthalmus aquosus), summer flounder (Paralicthys dentatus), scup (Stenotomus chrysops), Atlantic sea herring (Clupea harengus), black sea bass (Centropristus striata), spiny dogfish (Squalus acanthias), king mackerel (Scomberomorus cavalla), Spanish mackerel (Scomberomorus maculatus), cobia (Rachycentron canadum), red drum (Sciaenops occelatus), red hake (Urophycis chuss), and yellowfin tuna (Thunnus albacares ).
6.3.3.1 Non-commercial Benthos - Species composition varies within different
zones of the beach (Plate 5), with less species diversity occurring in the backshore, the

18
area furthest away from the waterline and before the dune habitats. The following types of organisms are typically found along sandy beaches in their respective zones: 1) backshore - burrowing organisms such as talitrid amphipods (sand fleas), ocypodid crabs, and isopods; and transient animals, such as scavenger beetles; 2) midlittoral zone, an area of the foreshore that is covered and uncovered by water each day - polychaetes, isopods, and haustoriid amphipods; and interstitial organisms that feed on bacteria and unicellular algae among the sand grains; 3) swash zone - polychaete worms, coquina clams, and mole crabs; and 4) surf zone - shellfish, forage fish, and predatory birds; offshore migrating predators are most common in this zone.
Benthic populations that inhabit sandy beach habitat also vary relative to whether
organisms live in or on the sand. The epifauna, which live on or above the sand surface, represent the smallest number of animals associated with beaches, but it is the major group linking marine and terrestrial species. There is less species diversity because the shifting sand is inhospitable to many animals that need stable conditions and protection. Only the larger animals that are fast enough to keep up with the waves and to overcome burial are able to compete with the dynamic conditions. These larger forms establish the highest level in the food chain in the surf and beach zones.
Endofauna (infauna) is the group of organisms that spend most of their lives in the
substrate, digging and burrowing and includes those species whose biological activities are restricted within the sand. In areas of heavy wave activity, the endofauna are generally limited to the robust and quickly moving species. Therefore, on high-energy beaches, stationary or semi-sedentary forms are generally scarce. The endofauna on most sandy beaches are dominated by crustaceans, mollusks, and polychaetes. The distribution of beach endofauna is dependent on several physical factors, including wave energy, tidal range, sediment texture, and morphological features of the beach.
Interstitial fauna live within the interstitial space of sand grains and include a
greater diversity of species than the epifauna and endofauna. The dominant interstitial fauna found in the intertidal environment are protozoans (ciliates and foraminiferans), turbellarians (flatworms), nematodes (roundworms), gastrotrichs, and harpacticoid copepods (crustaceans). The vertical distribution of many of these organisms in a sandy beach varies with the season of the year; a migration toward greater depths occurs during the cooler seasons (Naqvi and Pullen, 1982)
6.3.3.2 Commercial Benthos - The Commonwealth of Virginia offers commercial
licenses for the harvest of a number of benthic organisms, including the American oyster (Crassostrea virginica), blue crab (Callinectes sapidus), hard clams (Mercenaria mercenaria), soft clams (Mya arenaria), surf clams (Spisula solidissima), and channeled whelks (Busycotypus canaliculatus), and lobster (Homarus americanus). Benthic organisms support a significant part of the seafood industry in Virginia. The VMRC reports that more than 48,000,000 lbs shellfish harvested commercially was landed in 2010, which was valued at over $124,000,000 (VMRC, 2010).

19
The hard clam (M. mercenaria) is a commercially-important species in the lower bay. In the vicinity of the Thimble Shoal borrow area, hard clam densities are low and cannot support a commercial harvest (Hobbs et al., 1982). According to Ruddy (2000), anecdotal evidence indicates that densities in the area of the proposed borrow site at Thimble Shoal continue to be low.
Blue crabs are very important commercially as well as ecologically in the bay.
Dredging surveys for blue crabs have been conducted each winter since 1990 by researchers from VIMS in the Chesapeake Bay. The VIMS Winter Dredge Survey (WDS) is a collaborative, baywide research program to assess the population dynamics of the blue crab in the Chesapeake Bay (Lipcius and Montane, 1997). Since blue crabs overwinter in bottom sediments of the bay from December to March, a baywide random sampling program was established in 1988 using dredge gear to estimate blue crab abundance. This investigation quantified the distribution and abundance of blue crabs on the continental shelf in the vicinity of the bay mouth during the wintertime when habitat impact from sand extraction is expected to be greatest (Lipcius et al., 2001; 2002).
The blue crab survey has “demonstrated persistent and substantial decline in the
spawning stock, recruitment, larval abundance and female size of blue crabs in Chesapeake Bay between 1992 and 2007” (VIMS, 2012). Spawning stock abundance has declined by 81 percent, female size by 8 percent, spawning stock biomass by 84 percent, and abundance of larvae and post larvae by approximately an order of magnitude (Lipcius and Stockhausen, 2002). In addition, the relationship between spawning stock abundance and post larval recruitment is positive and significant, indicating that an enhanced spawning stock should produce higher recruitment (Lipcius and Van Engel, 1990; Lipcius and Stockhausen, 2002), and hence allow for long-term, sustainable exploitation in the fishery and population persistence.
The populations began to rebound in 2008 when management actions, including
harvesting restrictions and the establishment of a crab spawning sanctuary, were implemented. VIMS developed and demarcated a Blue Crab Sanctuary in 2002. This sanctuary was established for the purpose of allowing blue crab populations to rebound from the stresses of commercial and recreational fishing and trawling as well as sand mining. Blue crabs reproduce during the summer and the early fall, and the sanctuary prohibits large scale use of the area from June 1 to September 20.
In 2003, VIMS completed a survey both within the Thimble Shoal area and
outside the mouth of the Chesapeake Bay on the continental shelf for the blue crab (C. sapidus) for the purposes of this EA. The objective of the investigation was to assess whether sand extraction in the Sand Extraction Area (SEA) would cause a significant loss to the Chesapeake Bay blue crab population. It determined whether or not a “significant loss” would occur by comparing blue crab abundance in the SEA with that in the surrounding region outside the bay mouth and with that in the bay proper (the Lower Chesapeake Bay-Continental Shelf [LCB-CS]). If blue crab abundance is significantly lower in the SEA than in the lower bay, then the loss of blue crabs in the SEA will be disproportionately lower than the loss of habitat area. As long as the SEA area is not

20
large relative to that in the LCB-CS system, then the total loss in blue crab abundance due to SEA activities would be relatively insignificant.
The study attempted to do the following:
1. Quantify blue crab abundance during winter on the continental shelf in a
region extending approximately 10 km off the bay mouth, and which encompasses the SEA.
2. Estimate the aerial extent of the SEA habitat relative to the remaining habitats of the LCB-CS system using Geographic Information System technology.
3. Define the gradient in blue crab abundance extending from the SEA. 4. Determine if a significant fraction of the blue crab population resides in the
SEA by comparing blue crab abundance in the SEA with that in the surrounding region outside the bay mouth and with that in the bay proper.
The report concluded that blue crab abundance data for habitats on the continental
shelf, which includes the SEA (borrow area), did not harbor a significant fraction of the overwintering blue crab spawning stock in 2003. No female blue crabs were caught in the borrow areas outside the bay mouth. Only three blue crabs were caught on the shelf outside the bay mouth in 130 dredge tows. In contrast, 101 female blue crabs were caught in the lower bay in 114 dredge tows. The spatial analysis indicated that the spawning stock was concentrated inside the bay mouth with extremely low abundances of blue crab females outside the bay mouth, either in the borrow area or in the surrounding region.
Since the blue crab spawning stock has been in low abundance (Lipcius and
Stockhausen, 2002), it was also important to determine whether or not sediments in the borrow area and shelf region are those that female blue crabs prefer when overwintering, in case those habitats might be utilized when crab abundance is higher. The VIMS scientists’ retrospective analyses of the long-term WDS data, both in years of high abundance (1990-1992) and low abundance (1993-1997), indicated that blue crab females are lowest in abundance where percent sand is greater than 80 percent, which is the dominant sediment type in the borrow area and edge of the borrow area. Therefore, it is unlikely that female blue crabs currently use or would utilize the habitats in the borrow area extensively as an overwintering ground; thus, it is also unlikely that sand extraction activities in the Cape Henry borrow area would appreciably reduce the blue crab spawning stock of the Chesapeake Bay. 6.3.3.3 Essential Fish Habitat - Essential Fish Habitat (EFH) is defined in the Magnuson-Stevens Fishery Conservation and Management Act as…"those waters and substrates necessary to fish for spawning, breeding, feeding or growth to maturity.” The designation and conservation of EFH seeks to minimize adverse effects on habitat caused by fishing and non-fishing activities. The 1996 amendments to the Magnuson-Stevens Fishery Management and Conservation Act require Federal agencies to consult with the National Marine Fisheries Service (NMFS) regarding the potential effects of their actions

21
on EFH. The project area includes the waters of the borrow site and 7 miles of ocean shore from Willoughby Spit to Little Creek Inlet.
Table 4. ESSENTIAL FISH HABITAT AS DESIGNATED BY NOAA FISHERIES FOR THE WILLOUGHBY SPIT PROJECT AREA
Species Eggs Larvae Juveniles Adults
Windowpane flounder (Scopthalmus aquosus) X
X X Bluefish (Pomatomus saltatrix)
X X
Atlantic butterfish (Peprilus triaccanthus) X X X X Summer flounder (Paralicthys dentatus)
X X X
Black sea bass (Centrophristus striata) X X King mackerel (Scomberomorus cavalla) X X X X Spanish mackerel (Scomberomorus maculatus) X X X X Cobia (Rachycentron canadum) X X X X Red drum (Sciaenops occelatus) X X X X Dusky shark (Charcharinus obscurus)
X X
Sandbar shark (Charcharinus plumbeus)
HAPC HACP HACP Clear nose skate (Raja eglanteria)
X X X
Little skate (Raja erinacea)
X X Winter skate (Raja ocellata)
X X
* The “X” indicates the lifestage for which this habitat is important. EFH has been identified for fourteen fish species, including three skate species, in the project area that includes the Thimble Shoal Bank borrow area and the shoreline from Willoughby Spit to the Little Creek Inlet (designated by the limits North 37° 00.0, East 76° 10.0, South 36° 50.0, West 76° 20.0). These species are listed in Table 4 (NOAA, 2010). Bottom habitats with mud, gravel, and sand substrate that occur within the project area are designated as EFH for the clearnose skate. Bottom habitats with soft bottom, rocky, or gravelly substrates that occur within the project area are designated as EFH for the little skate. For the winter skate, bottom habitats with a substrate of sand and gravel or mud that occur within the project area are designated as EFH. The NMFS designated a “habitat area of particular concern” (HAPC) for the sandbar shark but not for any other Atlantic highly migratory species (HMS) due to a general lack of scientific information detailing HMS-habitat associations. The lower Chesapeake Bay, including the project site, has been identified as a Habitat Areas of Particular Concern (HAPC), which is described in regulations as a subset of EFH that is rare; particularly susceptible to human-induced degradation, especially ecologically important, or located in an environmentally-stressed area. This area is has been given this designation because it is an important nursery and pupping area.

22
6.3.3.4. Threatened and Endangered Species - Preliminary review of this action identified species on the Department of Commerce, National Marine Fisheries Service (NMFS) and the Department of the Interior, U.S. Fish and Wildlife Service (USFWS) List of Threatened and Endangered Wildlife and Plants in Virginia. The following table identifies the federally listed species that may occur along the Atlantic Coast of southern Virginia.
Table 5. FEDERALLY LISTED SPECIES THAT MAY OCCUR ALONG THE ATLANTIC COAST OF SOUTHERN VIRGINIA
Common Name Scientific Name Status Whales
Blue whale Balaenoptera musculus LE Finback whale Balaenoptera physalus LE Humpback whale Megaptera novaengliae LE Right whale Eubalaena glacialis LE Sei whale Balaenoptera borealis LE Sperm whale Physeter macrocephalus LE Birds
Piping plover Charadrius melodus LT Roseate tern Sterna dougallii dougallii LE Fish
Shortnose sturgeon Acipenser brevirostrum LE Atlantic sturgeon Acipenser oxyrinchus LE Turtles
Loggerhead sea turtle Caretta caretta LT Green sea turtle Chelonia mydas LT Leatherback sea turtle Dermochelys coriacea LE Hawksbill sea turtle Eretmochelys imbricata LE Kemp's ridley sea turtle Lepidochelys kempii LE Plants
Seabeach amaranth Amaranthus pumilus LT Insects
Northeastern beach tiger beetle Cicindela dorsalis dorsalis LT
LE - Listed Endangered LT- Listed Threatened
(Last Updated: July 3, 2012 – Though coordination with the USFWS, Virginia Field Office)
Of the listed species, only the sea turtles, piping plover, roseate tern, right whale,
humpback whale, finback whale and the Northeastern beach tiger beetle may be

23
potentially affected by this action. A review of the listed shortnose sturgeon indicated a low likelihood of occurrence within the project area; however, since its habitat range (historically) is within a proximate distance, continued consideration by this document was warranted. At one time, seabeach amaranth thrived in coastal environments from Massachusetts to South Carolina. A review of the species indicated it has been reduced to about one-third of historical distribution, found only on a few protected undeveloped beaches. It is currently found only in Accomack and Northampton counties in Virginia; therefore, seabeach amaranth was not assessed further.
Sea turtle populations are threatened for many reasons including the loss of
nesting beaches, hatchling disorientation from artificial light, drowning in fishing and shrimping trawls, marine pollution, and plastics and Styrofoam. The major known sources of anthropogenic mortality for the leatherback, loggerhead, Kemps ridley, green, and hawksbill sea turtles at nest sites on beaches are coastal construction, motor vehicles, poaching, exotic species such as fire ants, as well as beach armoring and nourishment. In oceanic habitats these known sources of anthropogenic mortality are trawl, purse seines, hook and line, gill net, pound net, and longline and trap fisheries. They also include oil and gas exploration, marine pollution, underwater explosions, hopper dredging, offshore artificial lighting, power plant entrainment and/or impingement, debris entanglement and ingestion, marina and dock construction, poaching, and boat collisions.
Five of the seven species of sea turtles found worldwide can be found in Virginia
waters and are described below. Between 5,000 and 10,000 turtles enter the Chesapeake Bay during late spring. Most of these animals are juvenile loggerhead and Kemp’s ridley turtles, which are using the Bay as feeding grounds.
Sea turtles (Caretta caretta) are found throughout the temperate and tropical regions of the Atlantic, Gulf of Mexico, Pacific, and Indian Oceans. This species may be found hundreds of miles out to sea, as well as in inshore areas such as bays, lagoons, salt marshes, creeks, and the mouths of large rivers. As loggerheads mature, they travel and forage through nearshore waters until their breeding season, when they return to the nesting beach areas. This species nests within the U.S. from Texas to Virginia, although the major nesting concentrations are found along the Atlantic coast of Florida, Georgia, South Carolina, and North Carolina. The loggerhead sea turtle nests in small numbers along Virginia’s coast and is the only species recurrently nesting along the Virginia Beach coastline (Dodd, 1988). The northern extent of its nesting range in the United States is along the Virginia/Maryland border. Loggerhead females generally nest every 2 to 4 years, and lay from 1 to 6 clutches of eggs a season. The re-nesting interval varies from 12 to 16 days, with an average of 14 days (NMFS, 1991). Sea turtles return to the same area to lay successive clutches of eggs that are usually within a 5 km radius of the first nest; therefore, the discovery of one nest may mean that others will soon follow. It is unlikely that loggerheads will be spotted until the ocean temperature reaches 74º F; they are usually found in Virginia’s waters from May through November. Because of the movement of individual loggerhead sea turtles, it is difficult to estimate the population of this species in U.S. and territorial waters, although numbers of nesting females give a useful index of the species’ population size and stability at this life state. Unfortunately,

24
population trends analysis based upon this method may not reflect overall population growth rates, since a female may lay multiple nests in any one season.
Since 1970, more than 230 incidents of turtles nesting or attempting to nest (false crawls) have been recorded on the beaches of Virginia. Loggerhead sea turtles account for most of these occurrences, but a few green sea turtles have nested in the state. The majority of these events have occurred at Back Bay, Assateague, and False Cape State Park, which is a contiguous tract of undeveloped shoreline. Some of these events have been recorded in Virginia Beach, including at the resort beach area, Sandbridge Beach, and Naval Base Dam Neck; no events have been recorded in Norfolk.
The green turtle (Chelonia mydas) was listed under the Endangered Species Act (ESA) on July 28, 1978. The breeding populations in Florida and the Pacific coast of Mexico are listed as endangered; elsewhere the species is listed as threatened. Green sea turtles are found worldwide, although this species is concentrated primarily between the 35° North and 35° South latitudes. In U.S. Atlantic and Gulf of Mexico waters, green turtles are found in inshore and nearshore waters from Texas to Massachusetts, the U.S. Virgin Islands, and Puerto Rico (NMFS, 1991). Green sea turtles tend to occur in waters that remain warmer than 68° F. Adult green turtles are unique among sea turtles in that they are herbivorous, feeding primarily on sea grasses and algae. This diet is thought to give them greenish colored fat, from which they take their name. A green turtle's carapace (top shell) is smooth and can be shades of black, gray, green, brown, and yellow. Their plastron (bottom shell) is yellowish white. This species migrates often over long distances between feeding and nesting areas. Mid-Atlantic Green turtle population estimates are derived from the major nesting beaches for this species along the Atlantic coast of Florida with some usage of the beaches of the panhandle. Until the nesting season of 2005, there had been no documented nest sites for this species north of North Carolina. The first documented green turtle nest site north of North Carolina was discovered on August 1, 2005, by a passer-by on the beach south of Sandbridge, several miles south from the project site. Biologists at Back Bay National Wildlife Refuge confirmed that 124 eggs were successfully laid by a green turtle as observers monitored the egg laying. The eggs were immediately transplanted to a secured site on the refuge (Glass, 2005).
The leatherback sea turtle (Dermochelys coriacea) is the largest turtle and the largest living reptile in the world. Mature males and females can be as long as six and a half feet (2 m) and weigh almost 2,000 lbs. (900 kg). The leatherback is the only sea turtle that lacks a hard, bony shell. A leatherback's carapace is approximately 1.5 inches (4 cm) thick and consists of leathery, oil saturated, connective tissue overlying loosely interlocking dermal bones (NMFS, 1992). Leatherbacks are the most migratory and wide ranging of sea turtle species, their range extends from Cape Sable, Nova Scotia, south to Puerto Rico and the U.S. Virgin Islands. Leatherbacks are found in temperate waters while migrating to tropical waters to nest. Distribution of this species has been linked to thermal preference and seasonal fluctuations in the Gulf Stream and other warm water features (Fritts et al., 1983). Nesting of Leatherback sea turtles is nocturnal with only a small number of nests occurring in the United States in the Gulf of Mexico (Florida) from

25
April to late July. Leatherbacks prefer open access beaches possibly to avoid damage to their soft plastron and flippers. Unfortunately, such open beaches with little shoreline protection are vulnerable to beach erosion triggered by seasonal changes in wind and wave direction. Eggs may be lost when open beaches undergo severe and dramatic erosion. The Pacific coast of Mexico supports the world’s largest known concentration of nesting leatherbacks. Nest counts are the only reliable source of population data for leatherback turtles. There is very little nesting in the United States overall and leatherbacks do not nest on any Virginia coast beaches. The adults of the species are found in low numbers in the lower Chesapeake Bay during the summer.
The Hawksbill sea turtle (Eretmochelys imbricate) population estimates are derived from beach nest sites in the Virgin Islands and Puerto Rico. The hawksbill turtle's status in the United States has not changed since it was listed as endangered in 1970. It is a small to medium-sized compared to other sea turtle species. Adults weigh 100-150 pounds (45 to 68 kg) on average, but can grow as large as 200 pounds (NMFS, 1993). It is a solitary nester, so population trends or estimates are difficult to determine. The most significant nesting within the U.S. occurs in Puerto Rico and the U.S. Virgin Islands, specifically on Mona Island and Buck Island, respectively. Each year, about 500-1000 hawksbill nests are laid on Mona Island, Puerto Rico, and another 100-150 nests on Buck Island Reef National Monument off St. Croix in the U.S. Virgin Islands. Within the continental United States nesting is restricted to the southeast coast of Florida and the Florida Keys, but nesting is rare in these areas. In addition to nesting beaches in the U.S. Caribbean, hawksbills nest at numerous other sites throughout the Caribbean, with the majority of nesting occurring in Mexico and Cuba. The largest nesting population of hawksbills appears to occur in Australia. Approximately 2,000 hawksbills nest on the northwest coast of Australia and about 6,000 to 8,000 off the Great Barrier Reef each year. Although the species is an occasional visitor to the Mid-Atlantic region, hawksbill sightings are very rare on Virginia beaches (Williams and Gallegos, 2000). The NMFS contractor observer program has not recorded any takes in northeast or Mid-Atlantic fisheries. The adult Kemp's ridleys (Lepidochelys kempii) is considered the smallest marine turtle in the world, weigh on average around 100 pounds (45 kg) with a carapace (top shell) measuring between 24-28 inches (60-70 cm) in length. They are the most endangered of all sea turtles, listed in the United States as endangered throughout its range in 1970. Kemp’s ridley sea turtle population estimates are derived from the only major nesting site for the species, a single stretch of beach near Rancho Nuevo, Tamaulipas, Mexico. The number of nests observed here is increasing at a mean rate of 11.3 percent per year since 1966, allowing some optimism about the possible recovery of the most endangered sea turtle species. Similar to olive ridleys, Kemp's ridleys display one of the most unique synchronized nesting habits in the natural world. Large groups of Kemp's ridleys gather off a particular nesting beach near Rancho Nuevo, Mexico, in the state of Tamaulipas. Wave upon wave of females come ashore and nest in what is known as an "arribada," which means "arrival" in Spanish (NMFS, 1992). There are many theories on what triggers an arribada, including offshore winds, lunar cycles, and the release of pheromones by females. Scientists have yet to conclusively determine the cues

26
for ridley arribadas. Arribada nesting is a behavior found only in the genus Lepidochelys. Female Kemp's ridleys nest from May to July, laying two to three clutches of approximately 100 eggs, which incubate for 50-60 days (USFWS, 1992). The following birds are federally listed species found in eastern Virginia: The piping plover (Charadrius melodus) breed on coastal beaches from Newfoundland and southeastern Quebec to North Carolina. Piping plovers favor open sand, gravel, or cobble beaches for breeding. Breeding sites are generally found on islands, lake shores, coastal shorelines, and river margins. These birds winter primarily on the Atlantic Coast from North Carolina to Florida, although some migrate to the Bahamas and West Indies (USFWS, 2008). The piping plover is an uncommon summer resident in the lower Chesapeake Bay, yet it breeds and forages in Virginia from March to October. All piping plovers are considered threatened species under the Endangered Species Act when on their wintering grounds. Critical habitat identifies specific areas that are essential to the conservation of a listed species, and that may require special management considerations or protection. The North American population roseate terns (Sterna dougallii dougallii) peaked in 2000 with 4,310 breed pairs; however the population fell to 3,320 in 2006. The reason for this decline is not currently known. Although its range in North America is often listed as extending from Nova Scotia to Virginia or North Carolina and the southern tip of Florida, the roseate tern is most common from Massachusetts to Long Island; they no longer breed south of Long Island, NY (USFWS, 1998). In Virginia, the roseate tern is found or has been known to be found in Virginia Beach, and in Accomack and Northampton counties.
Almost all important colonies of roseate terns are and have been on small islands,
often located at ends or breaks in barrier islands. Nesting habitat for the northeastern North American population has been greatly reduced by housing developments and other human activity on and near the coastal barrier islands. Some roseate terns have attempted to nest with common terns in the salt marshes but with almost no success. The decline of the northeastern population of roseate terns and its subsequent listing as endangered prompted an intensive study into the causes of its endangerment and possible strategies for its recovery.
The two main factors identified as limiting to roseate terns in the Northeast were
loss of nesting sites and predation. Many islands that traditionally were used as nesting sites by roseate terns have been taken over by herring gulls (Larus argentatus) and great black-backed gulls (L. marinus); other islands were lost to erosion. The loss of these islands to gulls or erosion forced roseate terns to nest at sites either on or close to the mainland, where they are more vulnerable to human disturbance and to predators. Historically, they nested on the Eastern Shore, but no known nests have been documented since 1927. The Northeast population of the roseate tern nests on barrier islands and salt marshes, typically along with common terns, and forages over shallow coastal waters, inlets, and offshore seas. While competing with common terns for food and nesting sites, roseates benefit from the former's aggressive defense of colony sites against predators.
27
While breeding, they primarily feed on American sand lance, a small marine fish. Their nesting success rates may be related to the abundance and proximity of sand lance. There are federally listed whale species that can be found in the southern part of the Chesapeake Bay. Finback whales (Balaenoptera physalus) are found in all the world's major oceans, from polar to tropical waters and is the second largest whale and the second largest living animal after the Blue Whale (American Cetacean Society, 2008). Adult males measure up to 78 feet (24 m) in the northern hemisphere, and 88 feet (26.8 m) in the southern hemisphere. Females are slightly larger than males and the weight for both sexes is between 50-70 tons (45,360-63,500 kg). The highest population density occurs in temperate and cool waters and is less densely populated in the hottest, equatorial regions. Finback whales prefer deep waters beyond the continental shelf and are common in waters of the U. S. Atlantic Exclusive Economic Zone (EEZ), principally from Cape Hatteras northward. Finback whales are migratory, moving seasonally in and out of high-latitude feeding areas; however, the overall migration patterns are complex and not well understood. They feed mainly on small shrimp-like creatures called krill and schooling fish. In autumn, these whales migrate several thousand miles to equatorial waters to mate during the winter. They were hunted extensively between the 1930's and the 1960's, but now since they are protected worldwide, finback whales are estimated to number 40,000-60,000. Currently, the largest threat to finback whales is entanglement and habitat destruction. The Humpback whale (Megaptera novaengliae) is found in all the major oceans in a wide band running from the Antarctic ice edge to 65° N latitude. They are distinguished from other whales in the same Balaenopteridae Family by extraordinarily long flippers, a more robust body, fewer throat grooves, more variable dorsal fin, and utilization of very long (up to 30 minutes) and complex, repetitive vocalization (songs) during courtship (NMFS, 1991). Like other whales, the humpback whale became endangered as a result of exploitation from commercial whaling (Marine Mammal Commission, 2003). The species first received protection in the North Atlantic in 1955 when the International Whaling Commission placed a prohibition on non-subsistence hunting by member nations. Protection was extended to the North Pacific and Southern Hemisphere populations after the 1965 hunting season. It was classified as an endangered species when the ESA was passed in 1973, and it remains so today. Currently, there are is estimated 30,000 to 40,000 humpback whales worldwide. An increased number of sightings of humpback whales in the vicinity of the Chesapeake and Delaware bays occurred in 1992. A reported 38 humpback whale strandings occurred during 1985-1992 in the U.S. Mid-Atlantic and southeastern states, increasing particularly along the Virginia and North Carolina coasts. Most stranded animals were sexually immature and the small size of many of the stranded whales strongly suggested that they had only recently separated from their mothers (NMFS, 2007). Right whales (Eubalaena glacialis) are the rarest of all large whale species and are among the rarest of all marine mammal species. Right whales were named because when whaling started they were considered the "right" whale to hunt because they are very slow and easy to approach. The North Atlantic right whale primarily occurs in
28
coastal or shelf waters. Individuals in the western North Atlantic population range from winter calving and nursery areas in coastal waters off the southeastern United States to summer feeding grounds in New England waters and north to the Bay of Fundy and Scotian Shelf (NMFS, 2005). In spring, summer and autumn, they feed in areas in a range stretching from New York to Nova Scotia and in winter, they head south towards Georgia and Florida to give birth. NMFS designated three areas in June 1994 as critical habitat for the western North Atlantic population including coastal Florida and Georgia (Sebastian Inlet, FL to the Altamaha River, GA), Great South Channel (east of Cape Cod), and Massachusetts Bay and Cape Cod Bay. The population is currently believed to contain only about 300 individuals and it remains unclear whether its abundance is static, undergoing modest growth or, as recent modeling exercises suggest, currently in decline. However, there has been no apparent sign of recovery in the last 15 years, and the species may be rarer and more endangered than previously thought (NMFS, 2005).
The shortnose sturgeon (Acipenser brevirostrum) is a federally listed species of fish found in the southern part of the Chesapeake Bay. The species is anadromous, which means that it lives in slow moving river waters or nearshore marine waters, but migrates periodically to fresher water to spawn. Historically, shortnose sturgeon were found in large coastal rivers of eastern North America in the Mid-Atlantic region, and in the rivers of North Carolina and Chesapeake Bay system. Shortnose sturgeon inhabit the main stems of their natal rivers, migrating between freshwater and mesohaline river reaches. Spawning occurs in upper, freshwater areas, while feeding and overwintering activities may occur in both fresh and saline habitats (NMFS, 1998). Shortnose sturgeon prefer lower salinity than pure seawater, typically in the range of 30 - 31 ppt. In areas where the shortnose sturgeon occur with the Atlantic sturgeon, the two species apparently segregate the habitat according to salinity preferences, with Atlantic sturgeon preferring more saline areas. Gilbert (1990) suggested that though the shortnose sturgeon is capable of entering the open ocean, it is hesitant to do so. This factor may be the single largest consideration limiting extensive coastal migrations of this species (Hill, 2008).
Anthropogenic mortality sources for the shortnose sturgeon include entrainment in dredges, entanglement in commercial or recreational fishing gear, structures associated with dams, and power plant cooling water intakes. Sources also include waterfront construction in freshwater sections of large and deep rivers where the species spawn. These rivers include the Chesapeake Bay tributaries, particularly the Susquehanna, Bohemia, Potomac, and Elk. A comprehensive analysis of entanglement patterns is not available due in part to frequent confusion with the similar Atlantic sturgeon. The distribution and movement of the species in the bay is poorly understood for the same reason. When not spawning, shortnose sturgeons favor the deep channel sections of the large rivers mentioned above. Annual egg production fluctuates in the species due to several factors; females do not spawn every year and eggs may not be fertilized due to interrupted migrations or unsuitable environmental conditions at the time of spawning.
The Northeastern beach tiger beetle (Cicindela dorsalis dorsalis) is a federally listed species of insects found in eastern Virginia. This beetle is a small insect (from ½ to 3/5 inches in length) with a bronze-green head and thorax and prefers long, wide,
29
dynamic beaches with medium to medium course sand with low organic content. The insect will not use sites with significant amounts of human and vehicular activity. The adult beetles are present from June through September and are active on warm, sunny days when they feed, mate and bask along the water’s edge. The Northeastern beach tiger beetle was once abundant along coastal beaches from Massachusetts to New Jersey, and in Maryland and Virginia along the Chesapeake Bay. The species has been extirpated form Connecticut, Rhode Island, and New York. Currently, there are only two know populations of this beetle found north of the Chesapeake Bay and both are located in Massachusetts. The insect is found in only four sites in Maryland, with the majority of the population of the tiger beetle found in Virginia; it has been known to or is believed to occur in Accomack, Hampton, Lancaster, Mathews, Middlesex, Northampton, Northumberland and Poquoson counties. There are no Northeastern beach tiger beetles currently found in the city of Norfolk. The most southern site where the beetles have been found is on the western shoreline of the Chesapeake Bay on Plum Tree Island.
The main threat to the tiger beetle population is the loss of habitat through the destruction and disturbance of natural beach by shoreline development, beach stabilization and high levels of recreational use. Additional threats include pollution, pesticides, oil slicks and off-road vehicle traffic. Natural limiting factors include winter storms, beach erosion, flood tides, hurricanes, parasites, and predators. 6.3.4 Submerged Aquatic Vegetation. No submerged aquatic vegetation is present within or near any of the potential borrow sites or offshore of the proposed nourishment area. The proposed borrow sites are too deep and not within the photic zone (VIMS, 2012). No submerged aquatic vegetation subsists in the submerged portion of the placement site. 6.3.5 Wetlands. Due to the high porosity of beach sands, sufficient hydrology does not exist to support the development of hydric soils or hydrophytic vegetation in the site for beach nourishment. Conversely, due to the open water estuarine environment of the proposed borrow sites located in the Chesapeake Bay, hydrology conducive to hydrophytic vegetation does not exist. Therefore, no jurisdictional wetlands exist within the site for beach nourishment or the study areas. 6.3.6 Water Quality. The water quality of the Chesapeake Bay is impaired due to the negative impacts resulting from the development and land use within the watershed. The Chesapeake Bay Program reported on the health of the bay and found the following (Chesapeake Bay Program, 2010):
• 38% of the combined water volume of the Bay and its tidal tributaries met
dissolved oxygen standards during the summer months; • 18% of Chesapeake Bay tidal waters met or exceeded goals for water
clarity, which was a decrease from 26% in 2009;

30
• 28% of the ninety tidal waterways analyzed in the Bay had no impairment for chemical contaminants;
• 72% of the waterways have a persistent problem with PCBs in fish tissue; and
• 22% of the tidal waters of the Chesapeake Bay had chlorophyll a concentrations that allow the growth of SAV.
It is estimated that 278 million pounds of nitrogen, 16 million tons of phosphorus and 9 million tons of sediment entered the Chesapeake Bay in 2010. These pollutants have a negative effect on the health of the bay by reducing water clarity and fueling the growth of algae that reduce dissolved oxygen in the water column. In December of 2010, the EPA established Total Maximum Daily Load (TMDL) for nitrogen, phosphorus and sediment for the entire Chesapeake Bay. The TMDL was designed to ensure that all actions to control pollution entering the tidal rivers and the bay will be in place by 2025.
6.3.6.1 Placement Site - The Clean Water Act (CWA) establishes the basic
structure for regulating discharges of pollutants into the waters of the United States and creating surface waters quality standards. The CWA requires each state to establish water quality standards for all bodies of water in its boundaries. Water quality standards must include a designated beneficial use or uses for each waterbody. In Virginia, all waters are designated for the following uses: 1) recreational uses, e.g., swimming and boating, 2) the propagation and growth of a balanced, indigenous population of aquatic life, 3) wildlife, 4) shellfishing, 5) fish consumption, and 6) public water supplies (where applicable) as described in Virginia State law 9VAC25-260-10. Recognizing the unique nature of the Chesapeake Bay, five additional sub-uses, which fall under the aquatic life use, are identified for the bay and its tidal tributaries. These uses include 1) migratory fish spawning and nursery, 2) shallow-water submerged aquatic vegetation, 3) open-water aquatic, 4) deep-water aquatic life, and 5) deep-channel seasonal refuge.
Virginia DEQ water quality testing has shown that the placement site fully
supports recreational use; however the site does not fully support other designated uses. The placement site is included on the Virginia “Draft 2012 305(b)/303(d) Water Quality Assessment Integrated Report” as impaired for fish consumption due to the polychlorinated biphenyls (PCB) found in the tissue of fish collected from the site. As previously described, this impairment is common to most of the waters of Chesapeake Bay. Also, the area does not meet the aquatic life use due to insufficient levels of submerged aquatic vegetation growing in the sampling area. Finally, the entire placement site fully supports shellfishing except for the area adjacent to the Little Creek Inlet, which is closed to shellfishing due to fecal coliform contamination. The sources of the impairments are identified as atmospheric deposition of nitrogen, industrial point source discharge, internal nutrient recycling, loss of riparian habitat, municipal point source discharges, and stormwater discharge.
6.3.6.2 Borrow Area - The potential borrow sites are included in a water quality assessment unit which includes the section of Chesapeake Bay between the mouth of the James River and mouth of Chesapeake Bay. The area fully supports all of the designated

31
uses that are applicable (open-water aquatic life and shellfishing). However, it is included in the 2012 list of impaired waters of Virginia for not meeting two designated uses: the area does not meet water quality standards for the aquatic life due to lack of sufficient levels of submerged aquatic vegetation; and the fish consumption usage is not supported due to the high level of PCB found in fish tissue. The cause of these impairments include nitrogen entering the bay through atmospheric deposition, industrial point source discharge, internal nutrient recycling, loss of riparian habitat, stormwater discharges and other, unknown non-point source. Even with the impairments described above, the lower section of the Chesapeake Bay, in which the potential borrow sites are located, is showing evidence of improvement to water quality. From 1985 to 2010, trend analysis indicates that the amount of bottom total suspended solids and inorganic and total phosphorus throughout the water column have decreased. During the same time frame secchi depths (which indicate water clarity) and concentrations of dissolved oxygen have increased.
6.4 CULTURAL AND ECONOMIC ENVIRONMENT 6.4.1 Socioeconomic Resources
6.4.1.1 Population - Norfolk is part of the Norfolk-Virginia Beach-Newport News Metropolitan Statistical Area (MSA) which is the second largest metro area between Washington, D.C. and Atlanta and the seventh largest metro area in the southeast United States. In 2010 the MSA had a population of 1,671,683. Although Norfolk is the largest urban core area within the MSA, the city contributes only about 15% of the population. However, of the incorporated cities in the state, Norfolk has the second largest population behind neighboring Virginia Beach.
The Norfolk rate of population growth is about the same as that for the MSA as a
whole, yet has a significant decrease from the 50% growth that occurred in the city between 1980 and 1990. As of 2010, the city had an estimated population of 242,803, a 3.6% growth from the year 2000 (U.S. Census, 2012). Projections from the Virginia Employment Commission show Norfolk’s population declining by 2.21% from 2010 to 2020, but rebounding slightly by 0.62% out to 2030.
6.4.1.2 Land Use - Norfolk consists of a total area of 96.3 square miles (249 km2),
of which, 53.7 square miles (139 km2) of it is land and 42.6 square miles (110 km2) of it (44.22%) is water. It is bounded by the Chesapeake Bay on the north, Elizabeth River on the west, city of Chesapeake on the south, and city of Virginia Beach on the east. Norfolk is a modern sea-port city with virtually all of the land in urban or suburban area being commercial districts, industrial complexes, military bases, and residential neighborhoods. In 2011, the city of Norfolk completed the first section of commuter rail, The Tide, with future plans of extending the system to Old Dominion University and the Naval Base Norfolk as well as working with the city of Virginia Beach to extend the system to the Oceanfront.
Commercial development ranges from high rise office buildings downtown to low intensity, suburban style development located at major road intersections and along many of the city’s primary arterials. It varies in size from small scale strip shopping centers to

32
major malls, both of which tend to have large parking areas and out parcels with gas stations, convenience stores, and fast food restaurants. The largest shopping areas are MacArthur Mall downtown and Military Circle and Janaf shopping centers on the eastern edge of Norfolk at the intersection of Virginia Beach Boulevard and Military Highway with smaller neighborhood shopping and dining areas as well.
Industrial development is concentrated along the Elizabeth River waterfront and includes substantial shipbuilding and repair operations along the eastern branch of the river and container and coal port facilities along the main stem, north of downtown. Naval Base Norfolk is at the northwestern corner of the city, where it occupies nearly a fifth of the city’s land area. Other, lighter industrial areas are along the Norfolk Southern Railroad corridor along West 23rd Street, and the Norfolk Industrial Park between Princess Anne Road and Virginia Beach Boulevard.
Residential areas vary from high density with high-rise condominiums and apartment buildings, to medium density with garden apartment and townhouse configurations, to low density with single family homes on individual lots. The high density residential areas primarily occur west of downtown, medium density in the Ghent neighborhood, and public housing along Princess Anne Road. Much of the rest of the city has low density residential and commercial areas with the exception of Willoughby Spit-Ocean View, which has areas of medium density residential with scattered commercial development.
The late 1990’s saw a general decline in the then existing and proposed future
development in substantial portions of the Willoughby Spit-Ocean View area. This situation was reversed after 2000 with the reemergence of growth in the entire coastal property market. Older communities of beach cottages and small motels along the resort strip were replaced by new upscale residential communities, such as East Beach at the eastern terminus of the area. Bay front properties have regained, and often exceeded, their past values and renewed growth and increased tourism have generated increased revenues for the area.
6.4.1.3 Employment - Employment in Norfolk grew by .76% in the 1999 - 2000,
but shrank by 1.84% between 2009 and 2010. Personal income grew in both periods, but more in the 1999-2000 (6.45%) than in 2010 (3.78%). As of the fourth quarter of 2011, there were 139,194 people working in the city, not including proprietors’ employment. Unemployment rates for Norfolk tracked the national rate staying about half of one percent lower than the national rate, while typically about 1% higher than that for Virginia between 2001 and 2011, with a low of 4.1% in 2007 to a high of 9% in 2010 (Virginia Employment Commission [VEC], 2012).
Norfolk’s economy is highly dependent on the Federal Government, in particular the Department of Defense, which is the largest single employer in the city and in the region. For Norfolk most of this employment is concentrated in the Naval Base

33
Norfolk. As of 2010, there were 48,723 military and 15,907 Federal civilian jobs in the city, which together make up 31% of Norfolk’s total employment (Bureau of Economic Analysis, 2012).
The largest numbers of jobs in the city are in the government sector with 41 percent, followed by the healthcare and retail sectors with 10 percent and 6 percent, respectively (BEA, 2012). Employment in these sectors will continue to increase as long as the city’s population continues to grow. Accommodation and food services contribute 5.15% of employment, however, information was not available on what portion of this sector was linked to tourism, nor was this information available per census tract or other subunit within the city of Norfolk. Other smaller but significant sectors include professional, scientific and technical services contributing to 5 percent of the jobs, while manufacturing and construction contribute about 3 percent each.
6.4.1.4 Income - Income levels for the city’s residents are lower than those for the state and slightly lower than those for the nation, based on median household and per capita income estimates. Census data show that 2010 median household income was $42,677 for Norfolk compared to $61,406 for the state and $51,914 for the US as a whole (U.S. Census Bureau, 2012). Per capita income for 2010 was $23,773 for Norfolk while it was $32,145 for the state. Norfolk’s per capita income was also below the national average of $27,334. 6.4.2 Environmental Justice. Executive Order (EO) 12898, Federal Actions to Address Environmental Justice in Minority and Low-Income Populations (February 11, 1994) requires Federal agencies to conduct their programs, policies, and activities that substantially affect human health or the environment in a manner that ensures that such programs, policies, and activities do not have the effect of excluding persons (including populations) from participation in, denying persons (including populations) the benefits of, or subjecting persons (including populations) to discrimination under such programs, policies, and activities because of their race, color, or national origin. An analysis of the U.S. Census data for 2010 shows that the census tracts that encompass the study area (tracts 1,3,4,2.01, 65.01 and 65.02), have a smaller minority population than the city as a whole. The non-white population for the study area was only 35.53 percent of its population, whereas the non-white population of Norfolk as a whole was 52.92 percent. The study area does have a significant minority population that could be affected by project implementation; however, the minority population was not concentrated in any of the six census tracts which are within the study area. Income levels for the study area show that income levels for residents of the area are slightly lower than those for the city’s residents as a whole. Median household income for the study area was $40,958 in 2010, which is 95.75 percent of the $42,677 median household income for Norfolk as a whole. In summary, the study area is relatively balanced in race, ethnicity, and income and does not comprise a socio-economic enclave.
6.4.3 Military Use/Navigation. The potential borrow areas are located near Thimble Shoal Channel, the approach to Hampton Roads. The Port of Virginia, in Hampton Roads ranks second on the east coast for cargo behind New York/New Jersey

34
and is home to the U.S. Navy’s largest operating base and shipyard. Dredging equipment and the pump-out buoys would be not located within a navigational channel. Dredging operations are publicized weekly in the Coast Guard’s Local Notice to Mariners. The dredging equipment and the pump-out buoys would not be located within a navigational channel, and should not pose a hazard to navigation, military or otherwise.
6.4.4 Historic Resources. Earliest human inhabitation of the Americas remains one of the most debated issues in archaeology, but clearly Native Americans began to inhabit the Chesapeake Bay region over 12,000 years ago. Many of the sites left by the ‘Paleo-Indians’ of this period may now be submerged on the bottom of the bay and the Atlantic continental shelf, as sea-levels during the Wisconsin Glaciation of the Pleistocene epoch, or Ice Age, were some 400 feet below contemporary levels. Populations were evidently low, but grew considerably during the Archaic Period, which is divided into Early (8000-6500 BC), Middle (6500 to 3000 BC) and Late (3000 to 1200 BC) Archaic Periods. Along with increasing population there is evidence of an increased diversity in resources hunted and gathered for food, with an expansion in fishing and shellfish gathering particularly notable.
Around 1200 BC people in the region began making and using pottery. This marks the beginning of the Woodland Period, also divided into Early (1200-500 BC), Middle (500 BC to AD 900), and Late (AD 900-1600) Woodland Periods. There seems to have been little change in settlement between the Late Archaic and Early Woodland Periods, apart from the use of pottery, but during the Middle Woodland people seem to have dispersed into smaller, though perhaps more sedentary settlements. It was during this period that the maize-beans-squash crop combination of American Indians was adopted in the region. During the Late Woodland Period populations increased with an expansion of agriculture, as political hierarchy increased as well. Village districts consisting of a series of hamlets, or in the native language “hattos” were strung along the shores of the major estuaries, with a nucleated, often palisaded chief’s residence central to them.
This was the state of native culture in the Chesapeake Bay region during early
exploration and settlement, and the direct historical accounts of that period give the name Protohistoric Period to 1600-1650. When the Jamestown colonists arrived in the area in 1607, the Norfolk and Virginia Beach areas were inhabited by the Chesapeack, who had a village in the vicinity of downtown Norfolk called Skicoak. The larger Native American sites in the Tidewater region of Virginia are most often located on points and near the mouths of major tributaries, and often include artifacts from several, sometimes all of the periods of prehistory. One reported Native American archaeological site is in the Area of Potential Effect (APE) of this project, and it is recorded in the Virginia Department of Historic Resources inventory as 44NR0019. Although reported as a shell midden site to an archaeologist who formerly taught at Old Dominion University, no field investigation was carried out.
Historical records indicate that the first European settler in the Willoughby-Ocean View area was Thomas Willoughby, who came to Virginia in 1610, settled in Hampton, and moved to what is now Norfolk in the 1630s. He received several land grants in
35
southeastern Virginia from King James I, including a 500-acre parcel in Ocean View about 1625. Later he acquired additional land west of Little Creek along the shore and constructed a home known as “Willoughby Hope” on high ground overlooking the bay. His son, Thomas II, and other descendants lived there for more than 100 years. The city of Norfolk, which was a part of Norfolk County, was incorporated as a borough in 1705 and granted a royal charter in 1736. By 1775, the city had developed into one of the most prosperous cities in Virginia. It was a major shipbuilding center and an important export point for tobacco, corn, cotton, and timber and an import point for rum, sugar, and manufactured products and was incorporated as a city in 1845. Popular accounts indicate Willoughby Spit was initially formed during a hurricane in 1749 as a sandy shoal at the end of Willoughby Point. Subsequent storms, including one in 1806, built up the shoal until it grew into a sizeable spit known as Willoughby’s Sand Point or Sandy Point and today as Willoughby Spit. However, it was not until 1807 that the spit first appeared on maps, indicating that the feature might have actually developed somewhat later than popular reports indicated. The area to the east of Willoughby Spit and west of Little Creek was originally a 360-acre tract called the Magagnos Plantation. In 1854, the tract was surveyed with lots, streets laid out, and named Ocean View City. An 1863 map (Plate 18) shows a cluster of 5 buildings near the later location of Ocean View pier and amusement park. No inhabitation is shown for Willoughby Spit at that time. A narrow gauge steam passenger rail line between Ocean View and what is now downtown Norfolk was begun in 1879, and a large hotel was built at the terminus (Plate 18 1886 map). Little development occurred in the area until after the turn of the century, with a few additional buildings around the hotel but little other development in Ocean View, and still none at all on Willoughby Spit. This was to change dramatically in only a few years with the expanding system of electric-powered streetcars. A building boom ensued as the trolley lines extended from Norfolk to Sewells Point for the Jamestown Exposition in 1907, and elsewhere to Ocean View and to the end of Willoughby Spit. In just a few years these were lined with houses as the new transportation system made the beaches accessible suburban residential areas.
By the beginning of the 20th century an amusement park had been built at the end of the streetcar line and a boardwalk adjacent to it along the beach (Plate 19). This was common throughout the country, where trolley lines also extended electrical power to the amusement parks. A commercial area developed along Ocean View Avenue between Granby and 1st View Streets with neighborhoods of year-round residents to either side. For a time Ocean View enjoyed fame as a major east coast resort, helped along by the 1907 Jamestown Exposition. By the 1920’s ‘the Rocket,’ a large wooden roller-coaster was built, which would become iconic of Ocean View Amusement Park (Plate 19). Ocean View remained a major resort, though slowly eclipsed by Virginia Beach after World War II. The amusement park would be a major local attraction through the 1960’s, but afterward declined as regional theme parks took up that market. As a result Ocean View Amusement Park closed in the late 1970’s.

36
Both Willoughby Spit and Ocean View were part of Norfolk County until they were annexed by the independent city of Norfolk in 1923. In the 1920s and 1930s, both large and more modest single-family summer houses were built in the area. During the 1940s and 1950s, small, one-story, frame beach cottages became popular and were the predominant type of building during this time. Very few of the pre-World War II structures still remain in the area, and many of those that do have been significantly altered. During the second half of the 20th century, large apartment buildings, residential motels, and elevated, wood-sided houses and condominiums were constructed. The 21st century has seen new, upscale residential development replacing old beach cottages and small motels along the beach front.
6.4.5 Archaeological Resources. 6.4.5.1 Submerged Resources - Marine archaeology remote sensing surveys (Plate
20) for the Hampton (Buckroe) beach nourishment borrow area and the earlier study for beach nourishment on Willoughby Spit have covered all of the Willoughby Bank borrow area and portions of the Hampton and Thimble Shoal Auxiliary Channel borrow areas (Tidewater Atlantic Research [TAR] 2004 and 2007). The purpose of the surveys was not only to identify potentially significant historic resources, but also to identify potential ordnance hazards. The surveys had the same methodology, transects at close intervals plotted by real-time GPS resulting in near 100% coverage of the survey areas with marine magnetometer and side-scan sonar. No diving was undertaken in either survey to further identify magnetic anomalies or sonar targets, but the data was sufficient to characterize these as likely shipwreck or ordnance locations, or as debris such as pipes, chains, or cables. The Hampton Borrow Area (Borrow Area A) covers about 2081 acres, extending east from a line just over a mile east of Buckroe Beach, Hampton, VA. The 2004 survey covered 466 acres near the middle of that area, identifying 1,191 magnetic anomalies of which 693 had electronic signatures consistent with ordnance, and 391 were larger. The high count of possible ordnance items reflects the 19th and 20th century military activity in the area, including artillery practice from Fort Monroe dating to the 1830’s and adjacent coast defense batteries established in the 20th century. Many of the magnetic anomalies were associated with 15 ‘target clusters.’ According to the report these, “could be associated with the remains of vessels or structures that served as targets for artillery.” (TAR, 2004:44). In 2007 TAR reported on survey for an earlier version of this proposed undertaking, for proposed borrow areas at Willoughby Bank and along Thimble Shoal Channel. The Willoughby Bank borrow area surveyed is identical to that proposed in this study, and the survey covered the 580 acre area along with a 100ft. buffer. The survey identified 4,031 magnetic anomalies and 316 sonar targets at the Willoughby Bank area, with 2217 of the magnetic anomalies suggestive of ordnance, 52 sonar targets associated with magnetic anomalies suggestive of ordnance, and 10 sonar targets characteristic of ordnance without magnetic anomalies associated. Twenty clusters of magnetic anomalies were suggestive of shipwrecks, and ten of those had sonar targets associated. Another

37
two sonar targets had signatures suggesting structural remains, potentially shipwrecks (TAR, 2007). While hardly devoid of materials the Thimble Shoal Auxiliary Channel borrow area yielded far fewer sensor readings with 1092 magnetic anomalies and 142 sonar targets. Of the magnetic anomalies, 459 and 14 sonar targets had signatures suggesting ordnance. Only two clusters of anomalies had the more complex signatures suggestive of shipwrecks. The 2007 survey area was a rectangle covering 700 acres extending north from the north Thimble Shoal Auxiliary Channel. The currently proposed Thimble Shoal Auxiliary Channel borrow areas total 382 acres with 178 acres in the North Channel and 204 in the south channel. The TAR 2007 survey covered 130 of the 178 acres of the North Channel borrow area.
6.4.5.2 Terrestrial Resources in the Sand Placement Areas - Only one archaeological site has been recorded in or near the berm placement area. Site 44NR0019 is reported as a shell midden site on the beachfront near the beginning of Willoughby Spit. Shell middens are accumulations of shell, usually oyster in this part of Virginia, sometimes developed over long periods of time when the mollusks were seasonally exploited. A local avocational archaeologist made a collection and donated this to Jamestown Festival Park many years ago, but the composition of the collection is not available elsewhere, and the cultural periods represented are unknown. Apart from this, no archaeological survey is known for the Willoughby Spit-Ocean View bay front areas.
6.4.6 Architectural Resources. There are 19 properties recorded in the Department of Historic Resources Data Sharing System (DSS) architectural database. These are listed in the following table with a brief description and status.
The properties on Chela Avenue were surveyed by Dovetail Cultural Resources for Virginia Department of Transportation planning in November 2011, and were found to be not eligible for listing on the National Register of Historic Places (NRHP), as were two nearby on West Ocean View Avenue. The Willoughby Spit-Ocean View area was evaluated as a potential historic district, and found not eligible. Although not evaluated, 1522 Lea View is separated by dunes and a distance of about 200 feet from the area of potential effect (APE).
Commercial buildings on 1st View Street are separated from visual effects by
existing structures. Five other buildings on West Ocean View Avenue appear to be little altered in their historic character and are not separated from the beach by other structures or an existing dune line. These are marked in bold in the previous table and illustrated in Plate 21. Generally they may be as little as 50 feet from the proposed sand berm installation. Two properties in East Ocean View listed in the DSS, ‘Cottage Place’ at 4343 East Ocean View Avenue (DHR ID 122-0912) and a cottage court at 3706 East Ocean View Avenue (DHR ID 122-0552) have been demolished since they were recorded in 1994. Records of these five were generated by a professional Phase I survey in 1996; however, while it is not known if all structures over 50 years old at that time were inventoried, it is unlikely.

38
Table 6: RECORDED ARCHITECTURAL PROPERTIES POTENTIALLY
AFFECTED BY THE PROJECT
DHR ID Name Location Date Description NRHP Status
122-0957 House 1522 Lea View Ave. 1935 two story dwelling not evaluated
122-0958 House 1526 Chela Ave. ca 1932 one story dwelling not eligible
122-0961 Lynch Anchorage Cottage
850 W. Ocean View Ave. 1932 American Legion Post 35 not evaluated
122-5048 Willoughby Beach Historic District Willoughby Spit post 1900 district not eligible
122-5498 House 1504 Chela Ave. ca 1900 one story dwelling not eligible
122-5499 House 1508 Chela Ave. ca 1960 two story apartment building not eligible
122-5500 House 1510 Chela Ave. ca 1935 one story dwelling not eligible
122-5502 House 1534 Chela Ave. ca 1954 one story dwelling not eligible
122-5506 House 1548 Chela Ave. ca 1920 one story dwelling not eligible
122-5508 House 1552 Chela Ave. ca 1920 one story dwelling not eligible
122-5509 House 1556-1560 Chela Ave. ca 1920 1.5 story dwelling not eligible
122-5510 Apartment Complex 1540 Chela Ave. ca 1940 1.5 story apartment building not eligible
122-5765 House 1438 W. Ocean View Ave. ca 1947 1.5 story dwelling not eligible
122-5767 Apartment Building
1452 W. Ocean View Ave. ca 1955 2 story apartment building not eligible
122-0148 House 450 W. Ocean View Ave. 1917 2.5 story dwelling not evaluated
122-0953 Commercial Building
9643-9661 1st View St. 1942 2 story commercial building not evaluated
122-0962 House 650 W. Ocean View Ave. 1940 2 story dwelling not evaluated
122-0964 House 550 W. Ocean View Ave. 1895 2 story dwelling not evaluated
122-0965 House 502 W. Ocean View Ave. 1906 2.5 story dwelling not evaluated
6.4.7 Aesthetics. Visual and aesthetic features include a beach of varying width, in some places with a dune system along the project length. Most of the Willoughby Spit-Ocean View shore is residential and privately owned, however, a small percentage of the shoreline is held in public domain where there are three city beach parks. Overall, the entire length of the project area is aesthetically pleasing bringing local residents and some tourists in during the summer months for bay front activities such as swimming, surfing, dining, and entertainment. 6.5 NOISE

39
Noise is defined as an undesirable or “unwanted sound.” Noise affects the full range of human activities and must be considered in local and regional planning (NYDEC, 2001). Noise levels are measured in units called decibels. Since people cannot perceive all pitches or frequencies equally, noise production is frequently reported in A-weighted decibels, or dBA, where noise is weighted to correspond to human hearing.
While there is no Federal standard for allowable noise levels, several Federal agencies have developed guidelines for acceptable noise levels. The Department of Housing and Urban Development Guidelines denote Day-Night Sound Levels or DNLs (a noise rating developed by the EPA for specification of community noise from all sources) below 65 dBA as normally acceptable levels of exterior noise in residential areas. The Federal Aviation Administration (FAA) denotes a DNL of 65 dBA as the level of significant noise impact. Several other agencies, including the Federal Energy Regulatory Commission, use a DNL criterion of 55 dBA as the threshold for defining noise impacts in sparse suburban and rural residential areas (Schomer et al., 2001). The USACE Safety and Health Requirements Manual provides criteria for temporarily permissible noise exposure levels, for consideration of hearing protection, or for the need to administer sound reduction controls as shown in the following table.
Table 7. PERMISSIBLE NON-DEPARTMENT OF DEFENSE NOISE EXPOSURES
Duration/day (hours)
Noise level (dBA)
8 90 6 92 4 95 3 97 2 100
1.5 102 1 105
Noise levels in the area are typical of recreational and beach activities and fluctuate with the highest levels usually occurring during the spring and summer months due to increased tourism, boating, fishing, and coastal activities. The project vicinity does not encompass any noise-sensitive institutions, structures, or facilities such as churches, parks, or hospitals.
The city of Norfolk has established allowable noise limits in Chapter 26 of the Code of Ordinances. It is unlawful to generate a sound pressure level that exceeds limits set by the city when measured outside the real property boundary of the noise source or at any point within any other property affected by the noise. Allowable noise levels are higher from 7:00 am to 10:00 pm than at other times, and maximum noise levels have been established for different land use categories. The maximum noise level for
40
residential areas during the day is 57 dBA; while noise up to 67 dBA is allowed in parks, recreational areas and commercial zones. Industrial sites are allowed the highest daytime noise levels, at 77 dBA. The placement site includes residential, commercial and parks and recreational zones. Norfolk’s noise ordinance states that when a noise is measured in more than one district classification (commercial, residential, etc.), the limits of the most restrictive classification will be applied except in the cases of some exempt activities, including sounds generated by construction. In the case of this project, the sound level limits would be the higher level allowed for commercial zones and recreational areas or 77dbA. 6.6 HAZARDOUS MATERIALS
The VDEQ Waste Division indicates the following inventories of generators and sites of Hazardous, Toxic, and Radioactive Wastes (HTRW) within the project area:
1) Comprehensive Environmental Response, Compensation, and Liability Act
(CERCLA) Information System. This database lists potential hazardous release sites under the Superfund Program.
2) Resource Conservation and Recovery Information System (RCRIS). This is an inventory of hazardous waste handlers.
3) Toxics Release Inventory (TRI). This is an information system about toxic chemicals that are being used, manufactured, treated, transported, or released into the environment.
4) Solid Waste Facilities Inventory. This is an information system about large facilities for the storage and handling of solid waste, whether transported or left in place.
According to the CERCLIS database, there are 2 CERCLA sites located within 4 miles of the project area. The CERCLA sites are located on land and are not expected to have resulted in HTRW-related impacts on the potential borrow site at Willoughby Bank. Fort Story is a Non-NPL site and is located approximately two miles south of the potential borrow area at the Thimble Shoal Auxiliary Channels. Remedial actions have been completed at Fort Story and there are no anticipated HTRW-related impacts on the potential borrow site at the Thimble Shoal Auxiliary Channels. The second CERCLA site, Naval Base Norfolk, which is on the National Priorities List (NPL), is located more than 4 miles from the proposed borrow site. Remedial actions at Naval Base Norfolk site were completed in 2010.
A number of RCRIS generators are located within 4 miles of the project area. These RCRIS generators include dry cleaning establishments, gasoline stations, fiberglass manufacturers and other industrial facilities. Previous reports have also identified RCRIS generators within 4 miles of the project area (USACE, 2006). The only Toxic Release Inventory (TRI) site identified is the Naval Base Norfolk (also identified as an NPL site). A review of the aggregate TRI data from Naval Base Norfolk indicates minimal releases to surface water from the site. Less than 500 lbs of TRI classified chemicals have been reported released to surface water since 2000.

41
No large facilities for the storage and handling of solid waste were identified within 4 miles of the project area. No significant HTRW releases to the project area have been documented. As with any active industrial area, there is the potential for HTRW contaminants to be released to the environment from a multitude of sources; however no evidence has been found to suggest that sediments in the borrow site have been exposed to HTRW. Additionally, the conditions found at the borrow and placement sites, i.e., the course-grained material and moderate to high-energy environment, do not support the accumulation of HTRW contamination. Overall, the potential borrow sites and beach nourishment activities would not be expected to result in the identification and/or disturbance of HTRW.
The potential for munitions and explosives of concern (MEC) to be present in each of the three potential borrow sites does exist. As discussed in Section 6.4.5.1of this report, numerous magnetic anomalies have been identified during past marine surveys; many of which contained electronic signatures consistent with ordnance items. The numerous magnetic anomalies identified during marine surveys along with the past military activity in the area during the 19th and 20th centuries, indicates that the potential for ordnance to be present in the borrow areas does exist. Therefore, it is recommended that the USACE Environmental and Munitions Design Center (EMDC), currently located in NAB District, be consulted during the design phase of the project. Specifically, the EMDC should be consulted in order to evaluate the need for screens to be utilized during dredging. The EMDC should also be consulted for guidance on the size, configuration and O&M procedures of the dredge screens if they are required. 6.7 AIR QUALITY The USEPA is required to set air quality standards for pollutants considered harmful to public health and welfare. The Primary National Ambient Air Quality Standards (NAAQS) set limits to protect public health, including the health of sensitive populations such as asthmatics, children, and the elderly. Secondary standards set limits to protect public welfare, including protection against decreased visibility, and prevention of damage to animals, crops, vegetation, and buildings. These standards have been established for the following six principal pollutants, called criteria pollutants (as listed under Section 108 of the Clean Air Act):
• Carbon monoxide (CO); • Lead (Pb); • Nitrogen dioxide (NO2); • Ozone (O3); • Particulate matter, classified by size as follows:
o An aerodynamic size less than or equal to 10 micrometers (PM10); o An aerodynamic size less than or equal to 2.5 micrometers
(PM2.5); • Sulfur dioxide (SO2)
42
The project area is located in the Hampton Roads Intrastate Air Quality Control
Region (Chapter 20, Section 200). In June 2007, this Air Quality Control Region was redesignated as a maintenance area (Chapter 20, Section 203) for 8-hour ozone. The region is not a maintenance area or a nonattainment area of any other pollutants (Chapter 20, Section 204, VDEQ, 2012).
Maintenance areas are geographic areas that had a history of nonattainment, but
are now consistently meeting the NAAQS. These areas have been re-designated by the U.S. Environmental Protection Agency from “non-attainment” to “attainment with a maintenance plan”. The maintenance area, pursuant to the Air Regulations of the State Air Pollution Control Board (9 VAC 5-160), requires that the total of direct and indirect emissions caused by a Federal action be less than 100 tons per year for ozone, which is identified as nitrogen oxide (NOx) and volatile organic compounds (VOCs).
7.0 ENVIRONMENTAL CONSEQUENCES OF THE PROPOSED ACTION 7.1 PHYSICAL SETTING
7.1.1 Geology and Soils. The tentatively selected plan would remove approximately 1.2 million cy of sand from Thimble Shoal Auxiliary Channel, while the NED plan would require 2.7 million cy of sand. Removal of this material would not change the geology or sediment quality in the Lower Chesapeake Bay.
The nourishment project may impact the placement site in a number of ways, including alteration of sediment quality, increasing turbidity and increasing the hardness of the beach. To ensure the project would not alter current sediment characteristics found within the placement site, only sand of similar grain size and composition would be placed in the project area. Dredging would avoid areas of fine sediment present at the borrow site to ensure that the beachfill consists principally of beach quality sand. Avoiding fine sediment would also reduce the amount of turbidity that is created during construction of the project. Material with large grain sized, such as beach quality sand, stay suspended in the water column for relatively short periods of time. Turbidity created by the project should be short lived and spatially limited to the vicinity of the dredge outfall pipe.
The No Action Alternative (NAA) will result in no alteration to the geology of the project area; however the impact of the NAA on the soils is more difficult to predict. If no future maintenance of the Norfolk Shoreline occurs, it is expected that the characteristics of the sand on site will not change. It is more likely that beach maintenance will continue in some form in the future. With each re-nourishment effort, the character of beach sediment will be altered. Although re-nourishment is most successful using material that is identical to the existing sand, it is almost impossible to find dredge material that matches exactly and the addition of large quantities of material from another site will slightly change the overall characteristic of the site.
7.1.2 Beach Profile. Both alternatives would result in an alteration of the existing
beach profile. The placement activities would create a wider beach profile with a steeper

43
slope. Once construction has been completed, natural processes, including sand supply, sea level change, currents and wave size, would rework the beach. Over time the beach would revert back to a more natural profile.
The wider beach created by the proposed alternatives would provide significant benefits in the form of storm damage reduction. During storms with elevated water levels and high waves, a wide beach acts as an energy absorber, dissipating wave energy across the surf zone. As a result rather than the upland structures, the beach is affected by the storm.
The impact of the NAA will depend on whether beach restoration efforts continue in the future. If no actions are maintenance efforts occur, it is expected that erosion will continue along most of the beachfront, with some areas of accretion. The project area, however, has been modified through the construction of coastal protection structures and re-nourishment projects since 1938. Even without the implementation of the tentatively selected plan, it is highly likely that the sponsor or other organizations will continue to maintain the beach. However, these projects are dependent on available funding and coastal storm events, so the frequency and magnitude of future restoration efforts are difficult to predicted. 7.2 ENVIRONMENTAL RESOURCES
7.2.1 Terrestrial Flora and Fauna. The impacts due to either of the two alternatives to the terrestrial beach community are expected to be short and insignificant in nature. Some benthic organisms will not able to move away from renourishment activities. Beach plants between the nearshore and the primary beach (Plate 17) in the placement site would be buried under dredged material and would perish. Observations made by the Corps of Engineers and others at previous beach nourishment projects in Hampton (Buckroe Beach, etc.) indicate that these species would re-colonize within a year of sand placement.
Construction may disrupt the natural behavior of terrestrial wildlife that currently utilize the beach. Terrestrial reptiles, amphibians, and mammals may be temporarily disturbed by the activity and some individuals are expected to leave the area during construction. However, the wildlife is expected to return once nourishment has been completed. Construction is not expected to interfere with nesting, breeding, or migration of any avian species.
The NED Alternative would have additional impacts on the terrestrial resources
within the project area. This plan includes the creation of a dune through the placement of sand and construction would result in the burial of beach flora and fauna. However, dune communities are expected to colonize the area quickly.
Impacts to terrestrial wildlife are predicted to be temporary in nature and it is
expected that motile organisms would move back into the placement area once construction has been completed.

44
The NAA would allow the beach to recede inland and it expected that the beach community would continue to adjust to the location and configuration beach. If the beach is eventually lost to erosion (e.g., if the beach erodes back to a wall or other permanent structure) the associated community would be lost.
7.2.2 Aquatic Wildlife. Both the selected and NED plan would result in impacts on aquatic organisms. Recovery time of the benthos within both the dredging area and the seaward surf zone is expected to be relatively rapid, although full recovery of both sites by benthos to a condition resembling pre-project conditions may take several years (Nelson, 1993; Newell et al., 1998).
7.2.2.1 Borrow Site - Aquatic organisms would be lost at the borrow site due to
dredging activities. The rate of benthic recovery and degree of diversity at the borrow site following a dredging event depend on a number of factors including: 1) duration and timing of dredging, 2) the type of dredging equipment used to extract the sediment, 3) sediment composition of the mine site, 4) amount of sand removed from the site, 5) the fauna present in the mine pit and surrounding area prior to dredging and their ability to adapt to change, 6) characteristics of the new sediment interface, 7) life history characteristics of fauna that re-colonize, 8) water quality at the site, 9) hydrodynamics of the mine pit and surrounding area, and 10) degree of sedimentation that occurs following dredging.
Motile benthic and pelagic fauna, such as crabs, shrimp, and fish, would be able
to avoid the dredging area. In fact, epibenthic organisms, such as crustaceans, and burrowing fishes (e.g., flounder) are rarely found in pumped sediments (USACE, 1992). Relatively non-motile benthos, such as worms and mollusks, would be destroyed over much of the dredged area (Parr et al, 1978). The recovery of the aquatic community after dredging has been found to occur relatively quickly and can be accelerated with specific dredging practices. In June 1998 and May 1999, the Virginia Institute of Marine Science and the University of New Hampshire conducted a study of the effects of sand mining on benthic populations forming the bulk of food sources for juvenile finfish in the shallow oceanic waters of Weaver Shoal and Fenwick Shoal, off the coast of Maryland and Delaware. Video sleds, sediment coring, and metered beam trawling were utilized to focus upon areas which provide the most desired sand grain size for commercial sand mining operations. Re-colonization occurred naturally within approximately one year of sand mining. The study concluded that, in order to minimize impacts to finfish food supplies and to promote re-colonization of mined areas as rapidly and efficiently as possible, the total removal of a layer of substrate should be avoided. Instead, small un-dredged areas within an identified borrow area should be left to create refuge patches that would promote rapid re-colonization and serve as habitat for the mobile benthic species. Mining activities ending in time for the spring and summer recruitment would favor crustaceans. Mining operations that begin in the summer and end in time for the fall and winter recruitment season would favor annelids (Diaz, Cutter and Hobbs, 2004). Dredging by hydraulic or other mechanical methods can cause the suspension of solids into the water column, resulting in some adverse environmental effects at the

45
borrow area, including localized increases in turbidity, slight decreases in DO, and reduction of light penetration. These changes could impact aquatic organisms by interfering with the respiration through gill clogging, temporarily reducing primary production and hampering predators that hunt by sight. Sediments in the Thimble Shoal Channel average approximately 89 percent sands and 11 percent clays and this sandy material would tend to settle rapidly, causing less turbidity and less oxygen demand than finer-grained (organic) sediments. It is predicted that water quality would quickly return to pre-project levels once dredging has been completed.
7.2.2.2 Placement Site - At the placement site, aquatic wildlife that cannot move away from the project site would be buried under the dredged material. However, it is expected that the area would area repopulate relatively quickly, with organisms moving in from the surrounding area. Several environmental studies of beach nourishment indicate that there are no detrimental long-term changes in the beach fauna as a result of beach nourishment (Burlas et al., 2001). In order to further determine the effects of beach nourishment activities upon key organisms, the Corps of Engineers conducted a study in 1987 along the nearby Virginia Beach shoreline (USACE, 1992). The findings of this study are based upon population changes of the mole crab (Emerita talpoida), ghost crab (Ocypode albicans), calico crab (Ovalipes ocellatus), amphipods (Haustorius arenarius), and sand worms (Clymenella torquata) in response to deposition of material dredged from offshore sources on the resort beach. This study supported the findings of other separate and independent studies, concluding that the greatest influencing factor on beach fauna populations appears to be the composition of the introduced material and not the introduction of additional material onto the beach. The deposited sediments, when similar in composition (grain size and other physical characteristics) to existing beach material (whether indigenous or introduced by an earlier nourishment or construction event), do not appear to have the potential to reduce the numbers of species or individuals of beach infauna (USACE, 1992).
The overall impact to aquatic organisms for both alternatives is expected to be temporary in nature and not significant.
The NAA is expected to have no adverse impacts on the aquatic fauna at the placement or borrow areas.
7.2.3 Essential Fish Habitat. The 1996 amendments to the Magnuson-Stevens
Fishery Management and Conservation Act require Federal action agencies to consult with the NMFS regarding the potential effects of their actions on EFH, which is defined as those waters and substrates necessary to fish for spawning, breeding, feeding, or growth to maturity (NMFS, 1998). Step 1 of the consultation process was accomplished by notifying NMFS that this document was being prepared. Step 2 is the preparation of an EFH Assessment by the Federal agency proposing the action. The EFH assessment shall include: (1) a description of the proposed action, (2) an analysis of the effects of the action on EFH and associated species, (3) the Federal agency’s views regarding the effects of the action on EFH, and (4) a discussion of proposed mitigation, if applicable. Step 3 of the consultation process is completed after NMFS reviews the Draft EA for

46
which the NMFS provides EFH Conservation Recommendations during the established comment period. The fourth and final step in the consultation process is the Federal agency’s response to the EFH Conservation Recommendations within 30 days. This response, in writing, must either describe the measures proposed by the agency to avoid, mitigate, or offset the impacts of the action on EFH pursuant to NMFS recommendations, or must explain its reasons for not following NMFS recommendations.
7.2.3.1 Description of Proposed Action - See Section 6.0: The Tentatively Selected Plan, in the main report.
7.2.3.2 Analysis of the Effects - This section includes a description of the fourteen species in the vicinity of the project and at which life stage NMFS has determined that those species would come in contact with project elements. Direct impacts to each finfish species are evaluated on their likelihood of being present, and therefore, potentially physically harmed at either the proposed borrow areas or beachfill placement areas during project construction. Finfish species could potentially be harmed at the borrow area through entrainment in the dredge. Pelagic species, such as bluefish and Atlantic butterfish, should be able to avoid the entrainment into the dredge due to their high mobility. Demersal species such as the windowpane flounder and the summer flounder are mobile and should be able to avoid dredge entrainment as well. However, because of their demersal nature, individuals that may remain on the seafloor of the borrow area during dredging could be entrained and destroyed; demersal eggs may be entrained as well. Juveniles are more vulnerable than adults due to their slower swimming speed. Finfish species that have eggs and larvae in surface waters may be impacted by the hopper dredge making numerous transits through the borrow area; any eggs in the path of the dredge are likely to be destroyed by the ship’s propeller. Because eggs and larvae are widely distributed over the continental shelf, egg destruction is not expected to cause significant impacts to fish populations. While some individual finfish would likely be entrained into the dredge and destroyed, no detrimental impacts to populations of any finfish are expected from the proposed project. Dredging may also result in physical alterations to the substrate of EFH which could cause changes to benthic community assemblages after re-colonization or in unsuitable substrate for spawning of some finfish species. However, significant changes in substrate are not expected because dredging depths would be based on vibracore data to minimize dissimilar substrates (MMS, 2006).
Finfish species could also be harmed in the surf zone while sand is being pumped
onto the beach however; most of the fish living nearshore are motile and can easily escape from sand placement. The greatest impacts of sand placement are the initial decrease in fish abundance, potential for gill clogging caused by increased turbidity, and direct burial of demersal fish. These impacts would be short-term and would not cause significant impacts to populations of any finfish.
Indirect impacts to each finfish species could occur as a result of several aspects of the project. EFH species can be adversely impacted temporarily due to the formation of a turbidity plume and decreased dissolved oxygen (DO) content during the dredging

47
and placement. Potential impacts to juvenile and adult fish from turbidity include gill clogging or abrasion. These fish are motile and would most likely leave the area while dredging and sand placement occurs, significantly decreasing their abundance and diversity in the short-term. Sessile prey organisms that feed by filtering suspended particles from water are likely to be harmed by turbidity and sedimentation. Abrasion, impaired respiration, and reductions in larvae survival are some of the associated effects. Populations exposed to the increased turbidity are expected to have a drop in productivity. However, no large concentrations of filter feeding organisms are known to exist in the project area. These impacts would subside upon cessation of construction activities. There is only a minor portion of fine-grained sediment within the material to be dredged and placed, and turbidity can be pronounced locally at both sites naturally as a result of wave re-suspension of bottom sediments at any time of year. For these reasons it is assumed that impacts from turbidity would be very minor. In addition, because of the open nature of the sites, turbidity should decrease as the particles in the water column rapidly dissipate into the surrounding coastal ocean waters. Short-term beneficial impacts could result from the increase in suspended nutritive material as a food source, creating areas of feeding concentrations.
The sandbar shark (Charcharinus plumbeus) is designated as having a Habitat
Area of Particular Concern (HAPC), which is described in regulations in rare a subset of EFH as follows: particularly susceptible to human-induced degradation, especially ecologically important, or located in an environmentally-stressed area. USACE has coordinated with NOAA Fisheries Services regarding this designation. The physical conditions at both the borrow site and the City of Norfolk’s Willoughby Spit shoreline do not meet the habitat requirements as pupping or nursery areas for this species. As a result, it is unlikely that the project will have any adverse affects on the sandbar shark HAPC. The correspondence with NOAA can be found in Appendix E.
There would be short-term increases in turbidity and settlement associated with dredging and sand placement but they would be localized and temporary. Any minimal turbidity would be very short in duration (i.e., would settle rapidly) and would be generally limited to the vicinity of the dredging and sand placement. It is generally viewed that elevated levels of turbidity generated by trailing suction hopper dredge operations in open ocean waters do not represent a significant ecological impact. Fish can avoid plumes and other organisms can survive short-term elevated turbidity. The beach nourishment area (surf zone) and borrow area are not located within nursery or pupping grounds for the sandbar shark. Given that the shark can be found from the intertidal zone to waters more than 655 feet deep and is widely distributed along the East Coast, the borrow area represents a fraction of available forage habitat.
7.2.3.3 Department of the Army’s Views Regarding the Effects of the Action
on EFH - Adverse effects on EFH species, due to dredging and construction activities, would largely be temporary and minimal within the dredged footprints and beach nourishment areas in the surf zone. The project is not anticipated to significantly impact EFH species or habitat (including HAPC) that may be in the project area. It was determined, through consultation with NOAA, that dredging operations will not impact

48
the HAPC of the sandbar shark. This species of shark typically pups in shallow, estuarine waters. The depth of the Thimble Shoal Auxiliary Channel is much greater than what the species typically used for nursery areas.
7.2.3.4 Discussion of proposed mitigation – It is the opinion of USACE that no mitigation will be required for this project.
7.2.4 Threatened and Endangered Species. The USFWS and NOAA have been consulted about the impact of the Willoughby Spit project on TES species. The USFWS concluded in the draft Planning Aid Report (PAR) “that there are no federally listed threatened and endangered species that reside in the project area year round.”
7.2.4.1 Birds – The PAR does state that some transient species travel
through the area, including piping plovers (Charadrius melodus) and roseate terns (Sterna dougallii dougallii). The PAR continues to state that “the piping plover is an uncommon summer resident in the lower Chesapeake Bay. They breed and forage in Virginia from March to October. The roseate tern is rare and would only be in the coastal area during the summer. Historically the piping plover nested on the Eastern Shore but nesting has not been documented there since 1927.” It is unlikely that the project will have long-term, negative effects on either species. The piping plover is also an uncommon summer resident in the lower Chesapeake Bay. It breeds and forages in Virginia, mostly on the Eastern Shore, from March to October. The Eastern Shore is a 70-mile long area of the Delmarva Peninsula, which is separated from Virginia Beach by the mouth of the Chesapeake Bay. The most southern point of the Eastern Shore is approximately 16 miles from the project area (Plate 1).
The piping plover both nests and feeds in open beach habitat. Even though there have been no known incidences of plovers nesting within the project area since the 1920’s, the placement site will be surveyed for nests before construction begins to ensure that there will be no effect on the piping plover. If nests are found, then the USFWS will be consulted.
Similar to the piping plover, the roseate tern nests on open beaches, but it feeds offshore. The roseate tern is rare visitor to the Mid-Atlantic and would only be in the coastal area of Virginia during the summer. This species has not been known to nest on the Willoughby Spit, so placement of sand will have no impact on the species. Although rare to the borrow site area, roseate terns might be found to forage within or near the borrow site while dredging is taking place. The proposed action is not likely to affect the roseate tern or the piping plover. If these individuals visit the borrow area or the placement site during the time of construction, it is expected that they will immediately leave the area due to the operation of heavy equipment. This movement will temporarily interrupt their nature behaviors. Once construction has been completed, there will be no impediments that will restrict the birds from returning to project site. Even though there are no know incidence of nesting

49
within the project site, if construction begins during the nesting season, the project area will be surveyed for nests. If nests are found, then the USFWS will be consulted before construction is begun.
7.2.4.2 Sea Turtles - Although the IPaC system did not identify sea turtles as potentially being affected by the proposed project, dredging operations can cause the mortality or injury of sea turtles as a result of entrainment, the direct uptake of aquatic organisms by the suction field generated at the draghead or cutterhead. Sea turtle mortalities due to entrainment during hopper dredging operations have been documented since 1980. The Endangered Species Observer Program, established in 1980, required observers to quantify entrainment of turtles by screening dredged material from hopper dredge intake structures or overflows. By species, loggerheads were the most frequently entrained during hopper dredging, accounting for 67.4 percent of the total entrainment (for turtles identified per species). Green sea turtles and Kemp’s ridleys accounted for 11.1 and 2.5 percent of entrainment incidents, respectively. Nineteen percent were unidentified as to species, since only fragments were recovered (Reine and Clark, 1998). Over the past 24 years, the USACE and dredging industry have worked to develop protocols, operational methods, and modified dredging equipment to reduce dredging impacts to sea turtles. If dredging occurs from May 1 to November 30, hopper dredges must be equipped with rigid turtle deflectors attached to the drag-head. The deflector is checked throughout every load to ensure that proper installation is maintained.
7.2.4.3 Whales - The IPaC system did not list whales as potentially being affected
by the proposed action. However, finback, humpback, and right whales are known to exist within the lower Chesapeake Bay. Dredging impacts on marine mammals may result from underwater noise and vessel collisions. Collision with vessels is the leading human-caused source of mortality for whales; the most lethal and serious injuries are caused by large, fast-moving ships.
The NMFS has established regulations to implement speed restrictions of no more than 10 knots applying to all vessels 65 feet or greater overall length in certain locations and at certain times of the year along the east coast of the U.S. Atlantic Seaboard. The purpose of the regulations is to reduce the likelihood of deaths and serious injuries to endangered North Atlantic right whales that result from collisions with ships (50 CFR, part 224). Since these restrictions are not mandatory for vessels owned or operated by, or under contract to, U.S. Federal agencies, the NMFS has requested all Federal agencies to voluntarily observe the conditions of the proposed regulations when and where their missions are not compromised. Should whales happen to occur during dredging operations, USACE will adhere to NMFS’ observer/monitoring program to insure that vessel collisions are avoided. The proposed action is not likely to adversely affect any of these whale species.
Both alternatives may affect piping plovers, roseate terns, whales and sea turtles;
however, appropriate precautions would be taken to prevent those impacts to these populations as described in the previous paragraphs. No other threatened and endangered species would be affected by either of the two proposed alternatives.
50
Coordination with NOAA was completed for marine species, including marine
mammals, sea turtle and sturgeon. The activities that are part of the Willoughby Project, both the dredging and sand placement, are included in the programmatic biological opinion released by the National Marine Fisheries Service on October 16, 2012. The entire opinion is included in the Environmental Appendix. The biological opinion states that in order to be exempt from prohibitions of Section 9 if the ESA, USACE must implement the reasonable and prudent measures (RPMs) listed in the document. Section 12.3 of the biological opinion describes the terms and conditions for the implementation of each RPM. The RPMs included in the biological opinion are listed below: RPMs Applicable for All Dredge Activities
1. NMFS must be contacted prior to the commencement of dredging and again upon completion of the dredging activity.
2. All dredges must be operated in a manner that will reduce the risk of
interactions with sea turtles.
3. All (alive or dead) Atlantic sturgeon must have a fin clip taken for genetic analysis. This sample must be transferred to NMFS.
4. All dead loggerhead sea turtles must have a sample for genetic analysis. This
sample must be transferred to NMFS
5. Any dead sturgeon must be transferred to NMFS or an appropriately permitted research facility NMFS will identify so that a necropsy can be undertaken to attempt to determine the cause of death. Sturgeon should be held in cold storage.
6. Any dead sea turtles must be held until proper disposal procedures can be discussed with
NMFS. Turtles should be held in cold storage.
7. All sturgeon and turtle captures, injuries or mortalities associated with any dredging activity and any sturgeon and sea turtle sightings in the action area must be reported to NMFS within 24 hours.
8. The ACOE shall implement measures that would reduce the number of sea
turtles in the dredging channel so that the possibility of entrainment would be minimized.
RPMs Applicable for all hopper dredges
9. The USACE shall ensure that all hopper dredges are outfitted with state-of-
the-art sea turtle deflectors on the draghead and operated in a manner that will reduce the risk of interactions with sea turtles.

51
RPMs Applicable when UXO screening is not in place on a hopper dredge
10. For all hopper dredge operations where UXO screening is not in place, a
NMFS- approved observer must be present on board the hopper dredge any time it is operating. The USACE shall ensure that dredges are equipped and operated in a manner that provides endangered/threatened species observers with a reasonable opportunity for detecting interactions with listed species and that provides for handling, collection, and resuscitation of turtles injured during project activity. Full cooperation with the endangered/threatened species observer program is essential for compliance with the ITS.
11. The USACE shall ensure that all measures are taken to protect any turtles or
sturgeon that survive entrainment in a hopper dredge. RPMs Applicable when UXO screening is in place on a hopper dredge
12. The USACE shall ensure that for all dredge operations where UXO screening is
in place, a lookout/bridge watch, knowledgeable in listed species identification, will be present on board the hopper dredge at all times to inspect the draghead each time it is removed from the water.
RPMs Applicable when UXO screening is in place on a hopper or cutterhead dredge
13. For all hopper or cutterhead dredge operations where UXO screening is in place, USACE shall provide monthly reports to NMFS regarding the status of dredging and interactions or observations of listed species.
RPMs Applicable when UXO screening is not in place on a cutterhead dredge Prior to finalizing contract specifications and initiating contract solicitation processes for new cutterhead dredging projects scheduled for calendar year 2013, the USACE must work with NMFS to develop monitoring plans for cutterhead dredges and/or dredged material disposal sites.
RPMs Applicable during Mechanical Dredging
14. A lookout/bridge watch must be present to observe all mechanical dredging
activities where dredged material will be deposited to monitor for any capture of sturgeon.
15. The ACOE must ensure that all measures are taken to protect any sturgeon
that survive capture in the mechanical dredge.
Section 13.0 of the biological opinion provides conservation recommendations, which are discretionary activities that USACE can follow to minimize of avoid adverse effected of the proposed actions on listed species or critical habitat. These measures include:
52
(1) To the extent practicable, the USACE should avoid dredging in the spring (March-May) and fall (September – November) when listed species are most likely to occur in the action area.
(2) The USACE should conduct studies in conjunction with cutterhead dredging
where disposal occurs on the beach to assess the potential for improved screening to: (1) establish the type and size of biological material that may be entrained in the cutterhead dredge, and (2) verify that monitoring the disposal site without screening is providing an accurate assessment of entrained material.
(3) The USACE should support studies to determine the effectiveness of using a sea turtle deflector to minimize the potential entrainment of sturgeon during hopper dredging.
(4) The USACE should explore alternative means for monitoring for interactions with listed species when UXO screening is in place including exploring the potential for video or other electronic monitoring.
The NAA has no predicted impact on the threatened and endangered species
within the project area.
7.2.5 Submerged Aquatic Vegetation. There would be no effect to submerged aquatic vegetation by either alternative or the NAA.
7.2.6 Wetlands. There would be no effect to wetlands by either alternative or the NAA.
7.2.7 Water Quality. 7.2.7.1 Borrow Area - Dredging in the borrow area would result in some short
term negative effects to water quality, including localized increases in turbidity and slight decreases in DO. The dominant substrate at the borrow area is medium-grain sand, which is expected to settle rapidly, causing less turbidity and less oxygen demand than finer-grained (organic) sediments. Studies (Priest, 1981; Barnard, 1978) have concluded that the turbidity created by a dredging operation is restricted to the vicinity of the operation and decreases significantly with increased distance from the dredge. DO, pH, and temperature all influence the welfare of living organisms in water; without an appreciable level of DO, many kinds of aquatic organisms cannot exist. No appreciable effects on DO, pH, or temperature are anticipated due to the nature of the dredged material (sand), related low levels of organics and biological oxygen demand, and the hydrodynamic influences within the borrow area in the open ocean where the water column is subject to significant mixing and exchange with oxygen rich surface waters. 7.2.7.1 Placement Site - Both beach nourishment alternatives would result in increased turbidity at the placement site; however, these impacts are expected to be short-term and spatially-limited to the vicinity of the dredge outfall pipe. Nearshore turbidity

53
impacts are directly related to the quantity of fines (silt and clay) in the nourishment material. The nourishment material would consist primarily of beach quality sand, with fine material making up a very small fraction. As a result, turbidity in the area of the sand placement disappears quickly, within several hours after nourishment operations cease (Van Dolah et al., 1992). Schubel et al., 1978, found that 97-99% of slurry discharged from pipelines settled to the bottom within tens of meters from the discharge point. Nichols et al., 1978, observed that sediment plumes were limited to the area of the discharge, and that after terminating activities, the plumes disappeared within 2 hours. Studies conducted off the coast of New Jersey revealed short-term turbidity at the fill site was essentially limited to a narrow swath (less than 500 m) of beachfront. Dispersed sediment was most prominent in the swash zone in the area of the operation, with concentrations dropping off in the surf zone and nearshore bottom waters. Except for the swash zone, the concentration of sediment was considered comparable to conditions that might occur when sediment becomes re-suspended during storms (USACE, 2001).
Van Dolah et al., 1994 reached a similar conclusion: despite a maximum of 200 Nephelometric Turbidity Units (NTUs) confined to a narrow area, background turbidities were close to 100 NTUs during storms and normal fluctuations often elevated turbidity. BMP’s, such as the containment of sediment during and after construction, would be implemented to order control the increase in turbidity caused by the operation at the placement site.
The NAA would not affect water quality at either the borrow or placement sites. 7.3 CULTURAL AND ECONOMIC ENVIRONMENT
Effects to socioeconomic conditions would be the result of temporary interruption of beach access to limited areas due to construction, and long term partial blocking of views of the Chesapeake Bay from residences and businesses and should have a negligible effect to tourism and recreation. As the name implies, the view of the open water is integral to the character of Willoughby Spit-Ocean View. Construction of a 10 or 14 foot high berm would block the view of the Chesapeake Bay at ground level. Water view properties are highly desired; the berm would block the view and this change could adversely affect property values as well as incomes for businesses, therefore, causing substantial economic impacts. However, in the TSP no berm would be constructed above the high tide line (e.g., five feet above mean low water), and visual effects would be negligible.
Effects to the aesthetic and historic character of Ocean View and Willoughby
would not be adverse. The beach widening would be with the historic character of the landscape where there were natural sand dunes. Historic architectural resources which may be potentially eligible for the National Register of Historic Places and might have their viewsheds affected include five houses on West Ocean View Avenue (addresses 850, 650, 550, 502, and 450 W. Ocean View Avenue). The Virginia Department of Historic Resources was consulted, and concurred that no above-ground resources would be adversely affected by the TSP (letter Brad MacDonald VDHR to John Haynes USACE Norfolk District 4 September 2012, VDHR file #2012-4033).

54
The Phase I and II surveys for submerged archaeological resources cover all of
the selected Thimble Shoal Auxiliary Channel borrow areas, having been conducted for a similar beach nourishment project at Cape Henry, VA in 2000. The Phase I survey covers most of the Horseshoe Shoal (Hampton) borrow area, and the Phase I survey of the Willoughby Banks borrow area provides complete coverage of this area. The remote sensing underwater archaeology surveys were fully sufficient to evaluate the alternatives in terms of submerged archaeological resources. The Thimble Shoal Auxiliary Channel has far fewer potential shipwreck sites identified in Phase I, and fewer potential ordnance artifacts. The subsequent Phase II survey found all of the potential shipwreck anomalies to have not been shipwrecks, but various types of debris jettisoned or lost overboard, and not of archaeological interest. Therefore, dredging in the selected Thimble Shoal Auxiliary Channel borrow areas would not affect significant historic shipwrecks. The Virginia Department of Historic Resources was consulted, and concurred that no archaeological resources would be adversely affected by the TSP (letter Brad MacDonald VDHR to John Haynes USACE Norfolk District September 4, 2012, VDHR file #2012-4033).
A slight chance of historic ordnance in that area was noted, and a number of potential ordnance remote sensing targets were mapped. Protocol for safety and recording historical information of any ordnance encountered during dredging, most likely World War II naval mines, should be developed.
Environmental Justice issues are not apparent in relation to this project, and
navigation and military operations should not be affected. 7.4 NOISE
Both beach re-nourishment alternatives are anticipated to take approximately 130 days, depending on weather conditions, economic forces and equipment breakdown. Operations are expected to continue 24 hours per day, 7 days per week. Bulldozers would be working on the beach continuously, which would affect the ambient noise level; although the impacts would be restricted to the area immediately surrounding construction and not extend throughout the entire project site. Noise pollution and construction activities would be monitored to ensure minimum disturbance to the surrounding community. The offshore pumps are not expected to impact the ambient noise level as they would be far enough from the beach and not be a nuisance.
Ambient underwater sound levels are an important consideration in assessing the
probability of detrimental effects of dredging sounds. Much of the sound produced during filling of the hopper is associated with propeller and engine noise with additional sounds emitted by pumps and generators; these sounds are continuous in nature. Numerous factors contribute to ambient sounds at a given location, including tidal hydrodynamics, meteorological conditions and sea state, the presence or absence of ice, and sounds of biological origin. It should also be recognized that interpreting underwater sound data may be futile without fundamental studies on biological responses to characteristic dredging sounds. There is few data exist that adequately characterize
55
sounds emitted by dredge plants that would support objective decisions balancing the need to dredge against relative risk to a fishery resource (Dickerson et al., 2001).
The NAA would not involve any construction related noise and would, therefore, have no impact on noise levels in the project area. 7. 5 HAZARDOUS MATERIALS
Overall, the potential borrow sites and beach nourishment activities would not be expected to result in the identification and/or disturbance of HTRW. However, the potential for ordnance to be present in the borrow areas does exist. Therefore, it is recommended that the USACE Environmental and Munitions Design Center (EMDC), currently located in NAB District, be consulted during the design phase of the project. Specifically, the EMDC should be consulted in order to evaluate the need for screens to be utilized during dredging. The EMDC should also be consulted for guidance on the size, configuration and O&M procedures of the dredge screens if they are required.
7.6 AIR QUALITY The Willoughby project lies within the limits of the independent city of Norfolk, VA. According to the Virginia Department of Environmental Quality’s (VDEQ) Air Regulations (Chapter 20, Section 203), the city of Norfolk is included in the Hampton Roads Ozone maintenance area with respect to 8-hour ozone. Air regulations (9 VAC 5-160 – 30), issued by the VDEQ, require Federal agencies to prepare a conformity determination if the total of both direct and indirect emissions produced by a Federal action in a maintenance area is equal to or greater than 100 tons of nitrogen oxides (NOx) or volatile organic compounds (VOC) per year (VDEQ, 2012).
Air pollutant emissions were calculated for both alternatives using estimates of power requirements, duration of operations, and emission factors for the equipment needed to complete the project. Multiplying horsepower ratings, activity rating factor (percent of total power), and operation time yields the energy used. Power requirements and durations for each phase of the proposed hopper dredging and beach placement activities were estimated using previous nourishment projects completed by the USACE.
The horsepower rating of the dredge plant used for each activity are as follows:
propulsion (5000 hp), dredging (5000 hp), pumping (4000 hp), and auxiliary (2000 hp). The estimated time to complete each dredge cycle, including idle time, dredging, transit and pump-out, is roughly 4 hours per load and on average, approximately 4,000 yd3 of dredge material would be moved per cycle. Approximately 305 trips would be needed to move 1.2 million cy of sand for the TSP and 676 trips would be required to move 2.7 million cy for the NED Plan. The placement and relocation of the nearshore mooring buoys used during pump-out would require a work barge, and a pipeline hauler/crane. The buoy would have to be moved at most five times during the project, with each move taking approximately 12 hours. A work barge (900 hp) and a crane (230 hp) would be needed to relocate the buoy. Buoy placement requirements would be identical for both alternatives. On the beach, the equipment required to move the sand into place would include two bulldozers (300 hp) working 24 hours a day and a front end loader (200 hp) working 18 hours a day. An extra 4 weeks, 2 weeks before and after the dredge plant

56
supplies sand to the project, were added to the operational schedule of equipment operated on the beach.
To determine air emission output, emission factors of 0.031(lb/hp*hr) for diesel engines < 600 hp and 0.024031(lb/hp*hr) for engines >600 hp were used to calculate NOx production. VOC emissions were calculated using emission factors of 0.002514031(lb/hp*hr) for diesel engines <600 hp and 0.000705 031(lb/hp*hr) for engines >600 hp. The emission factors were supplied by the USEPA as shown in the following table.
Table 8. ESTIMATED EMISSIONS FOR THE TSP (TONS PER YEAR)
Emissions (tons)
TSP NED Alternative Activity NOx VOC NOx VOC
Dredge Vessel (Hopper)
18.8 4.13
25.92 0.76 Dredging
36.6 1.08
3.36 0.1 Transit
11.52 0.34
40.8 1.2 Pump-out
1.44 0.04
81 2.38 Idle
1.51 0.06
1.51 0.06 Relocation of Mooring Buoy
18.77 1.52
36.18 2.93 Beachfill
88.64 7.17
188.77 7.43 Total Emissions
As shown in Table 8, implementation of the TSP would produce approximately
88 tons of NOx and 7.17 tons of VOC. Projected emissions of NOx and VOC are within 100 tons/year, the standard set for maintenance areas; therefore no conformity determination would be required under 40 CFR Part 93. The TSP would result in small, localized, temporary increases in concentrations of NOx and VOC. Based on the preceding analysis, projected emissions from the Willoughby Spit project would not adversely impact air quality given the relatively low levels of emissions and the prevailing offshore winds.

57
The NED Plan would have a greater impact on air quality, resulting in the creation of 7.43 tons of VOC and 188.77 tons of NOx. Projected emission of NOx is greater than 100 tons/year, the standard set for maintenance areas; therefore, if the NED Plan is pursued, a conformity determination would be required under 40 CFR Part 93.
The NAA would not involve any construction related air emissions, and would, therefore, have no impacts to air quality. 7.7 CUMULATIVE EFFECTS
Cumulative impacts are those impacts on the environment that result from the incremental impacts of the action when added to other past, present, and reasonably foreseeable future actions. This section analyzes the proposed action in context of similar and unrelated actions occurring in the vicinity of the action area. In considering potential cumulative impacts, time crowded perturbations, space crowded perturbations, indirect and synergistic impacts, and combinations thereof, were evaluated. Other activities of importance occurring in the vicinity of the project area include beach recreation, coastal development, beach nourishment, navigation channel maintenance, commercial and recreational fishing, and shipping traffic. Both beneficial and adverse cumulative impacts could occur when the impacts of the proposed action are considered in context, but the incremental contribution to impacts are minor to air quality, avian communities, beach habitat, marine mammals and sea turtles, benthic communities, finfish and essential fish habitat, and physical processes from the proposed action.
Sand nourishment of the project area, from Willoughby Spit to the Little Creek Inlet, is projected for approximately every 9 years for the next 50 years. Considered in context of past projects along the Norfolk beachfront, these and similar projects which have taken place in the city, as well as past and future projects that will occur along the shoreline in Norfolk, it is predicted that beachfill activities will continue to be supported in the project area. As a result, the Norfolk beachfront will continue to be subject to the stresses of such activities. The impacted area would not increase, and the nature of impacts would not change. The intervening periods between nourishments generally allow for physical and biological recovery and equilibration of the submerged section of the beach and surf zone. Beach nourishment activities are generally considered beneficial to beach recreation, tourism, and property values, but may encourage disturbance or loss of beach, dune, and overwash habitat owing to human activities associated with coastal development. Trampling, artificial lighting, and beach erosion control (e.g., bulkheading) potentially degrade the full range of seabird and sea turtle nesting habitat and interfere with nesting, foraging, parental care, and hatchling behavior (Defeo et al., 2009).
Beachfill should balance or counter those losses, replacing the dune (NED
Alternative) and beach habitat that would otherwise be lost to erosion or compromised by more aggressive shoreline protection measures. With the respite between maintenance cycles, sensitive biological resources, including infaunal and epifaunal invertebrates, should substantially recover from disturbances, which include burial, reduced prey availability, and emigration (Burlas et al., 2001; Peterson and Bishop, 2005). Most

58
sandy-beach species are adapted to severe physical disturbances, since storms are frequent along the Mid-Atlantic coast. Seabirds should benefit from the long-term nesting habitat that would certainly disappear with unmitigated coastal erosion. In general, behavior modifications and displacement from preferred nesting and foraging areas would be temporary.
Not all beach restoration projects in the Hampton Roads region use the same
offshore borrow area. Beach quality sand is a finite resource and requires careful resource management. 1.12 million and 2.7 million cubic yards of sand would be needed to implement the TSP and the NED alternative respectively. If dredged to 6 feet, it is estimated approximately 3.0 million cy of beach grade sand is currently present in the Thimble Shoal Auxiliary Channel. Both alternatives would result in the removal of a substantial amount of material from the Thimble Shoal Auxiliary Channel borrow site.
The shoal’s function as habitat may be adversely affected, but to date, there has been limited evidence of any sustained disturbance beyond transient and localized impacts to a wide range of benthic and pelagic biota resulting from similar dredging operations that have occurred within the Hampton Roads region (Diaz et al., 2004). Areas of the borrow site where sediment grain-size is incompatible with nourishment grain size requirements, as well as other no-dredge areas such as the submarine cable zone, would remain undisturbed, serving as feeder zone for benthic recolonization and natural bottom habitat. Additionally, since borrow areas are not typically dredged perfectly flat relative to the adjacent sea floor, a portion of the dredge areas would remain morphologically intact.
Prominent shoals or broad sand bodies are often the primary target for dredging, but are also considered valuable benthic and fish habitat. The importance of sand shoal habitats to sea turtles and other sensitive biota is largely unknown. The areal extent of seafloor disturbance is governed by dredging cut depth and thickness of available sand deposits. These habitats are naturally dynamic and physically-dominated, making resident biota fairly resilient. The proposed action and foreseeable actions would not result in significant effects on sensitive biological resources. It is likely that recolonization of benthic fauna would occur rapidly by migration and larval recruitment (see EFH Assessment). Cumulative impacts to EFH and finfish occur from a vast array of sources, including neighboring navigation channel dredging, and are discussed in the attached EFH Assessment.
The most influential of impacts on EFH, finfish, and shellfish are regulated recreational and commercial fishing activities that conduct unsustainable fishing practices and policies. Nearly one third of the Nation’s marine fisheries have been officially designated as overfished or nearly so; unsustainable harvesting practices reduce recruitment, decrease spawning stock, and decrease overall populations (Defeo et al., 2009). Gillnet fishing may be conducted for fish species such as the spiny dogfish and striped bass. Some by-catch is caught along with the targeted species, and this could potentially reduce the population numbers of non-targeted organisms, sublegal size fish and prey species. Many commercially-caught fish species, such as bluefish and Atlantic
59
croaker, are caught by rod and reel or hand line. Impacts include mortality of catch released because of size limits or species prohibitions. If anchoring takes place, there may be some bottom disturbance as well. Trawl fisheries have targeted bottom fish such as grey seatrout and summer flounder or water column species such as bluefish. Traditional bottom trawls have been shown to remove bottom dwelling organisms such as brittle stars and urchins as well as polychaetes. Colonial epifauna have also been shown to be less abundant in areas disturbed by bottom trawling. This epifauna provides habitat for shrimp, polychaetes and small fish which are potential prey species for commercially desirable fish species. Seafloor areas that have been heavily trawled may bear tracks where trawl doors have gouged into the sediment, changing the sediment surface and in other areas the trawl has flattened the sediment surface reducing habitat for managed species and their prey. Traditional trawl techniques were known to be nonselective in their catch thus having the potential to reduce both prey species and year classes of managed species not yet mature. Longline fishing for species such as some coastal sharks is also expected to occur. Longlining may result in the death of some juvenile and non-target fish species.
Recreational anglers have also caught designated EFH species within the vicinity
of the borrow areas (i.e., bluefish, cobia, striped bass, king mackerel) via rod and reel, power trolling, and spear fishing. Mortality of some species is expected from the by-catch of non-target species and sublegal catches. Additionally, disruption of bottom habitat can occur from the anchoring of recreational boats. Benthos and fish caught by the anchor may be destroyed. Repeated anchoring in the same location can lead to patches void of benthic organisms. It can reasonably be assumed that Virginia will continue to license and permit recreational vessels and operations, which do not fall under the purview of a Federal agency. If recreational activity increases, the number moralities may continue to increase as well.
Vessel activity associated with dredging and fisheries would be added to the existing commercial shipping and naval vessel traffic using the Chesapeake Bay ports. Air emissions from the construction activities are extremely small in context of the existing point and non-point emissions that contribute to moderate air quality conditions. The impacts on water quality from beach nourishment and channel maintenance activities, including elevated turbidity and reduction of dissolved oxygen and water clarity, are short in duration and limited to the placement and dredging location. The impacts may be influenced by seasonal fluctuations in river and tidal inlet exchange.
Routine discharges from dredge and service vessels are not expected to contribute
appreciably to degraded water quality. Oil spills, although non-routine from vessel activity, are potentially the most destructive pollution source impacting sand beaches and biological resources. Runoff from agriculture, stormwater, and other sources carry pathogens, contaminants, and excess nutrients into coastal waters (Defeo et al., 2009). These can lead to reproductive failure, deformations, mortality and contribute to locally anoxic habitats. Impacts from the nonpoint sources of pollution are expected to continue.
60
Dredge plants and support vessels, such as military, shipping, and fishing activities, may contribute to disrupted feeding, loss of prey, noise disruption, and possible collision and entrainment of finfish and sea turtles. Military activities, including ordnance testing, sonar testing, and operational exercises, may affect listed turtle and marine mammal species. Since sea turtles and pelagic fish are highly migratory, the disturbances discussed above can generally be avoided. The same species are likely to be affected by human activities throughout their geographic range. The mitigation measures considered integral to the project are adopted for the express purpose of reducing these risks. 8.0ENVIRONMENTAL LAWS, STATUTES, EXECUTIVE ORDERS, AND MEMORANDUM 1. Archaeological and Historic Preservation Act of 1974, as amended, 16 U.S.C. 469 et seq. Compliance: The Virginia Department of Historic Resources (VDHR) has been coordinated with concerning historic and/or archaeological resources in the project area. Continued coordination with VDHR, where required, signifies compliance. Pertinent correspondence can be found in Appendix E. 2. Clean Air Act, as amended, 42 U.S.C. 7401 et seq. Compliance: Submission of this report to the Administrator of Region 3 the USEPA for review pursuant to Sections 176 (c) and 309 of the Clean Air Act signifies compliance. Although the proposed project is located in Norfolk, VA, which currently is maintenance for ozone, a formal conformity determination is not required due to emissions not exceeding regulatory thresholds.
3. Clean Water Act of 1977 (Federal Water Pollution Control Act Amendments of 1972 and Water Quality Act of 1987) PL 100-4, 33 U.S.C. 1251 et seq. Compliance: A Section 404(b)(1) Evaluation and Compliance Review has been incorporated into this report. VMRC and Virginia Beach Wetlands Board permits would be acquired via Virginia’s joint permit application (JPA) process. State Water Quality Certification under Section 401 of the Clean Water Act, as amended, would be obtained from VDEQ prior to construction. 4. Coastal Zone Management Act of 1972, as amended, 16 U.S.C. 1431 et seq. Compliance: In accordance with the Coastal Zone Management Act (CZMA) and the approved Coastal Zone Management Program of Virginia, the proposed project has been evaluated for consistency with the coastal development policies. A consistency determination would be submitted to VDEQ. 5. Endangered Species Act of 1973, as amended, 16 U.S.C. 1531 et seq.

61
Compliance: Review of databases and coordination with USFWS and NFMS has been completed. The draft Planning Aid Report provided by the USFWS and the Biological Opinion from NOAA are included in Appendix C. Pertinent correspondence can be found in Appendix E. 6. Estuarine Protection Act, 16 U.S.C. 1221 et seq. Compliance: Coordination of this document with appropriate Federal and state resource agencies will signify compliance with this act. 7. Federal Water Project Recreation Act, as amended, 16 U.S.C. 4601-12 et seq. 199 Compliance: Coordination with the National Park Service and the VDCR, relative to the Federal and state comprehensive outdoor recreation plans, will signify compliance with this act. Pertinent correspondence will be added to in Appendix E once coordination has been completed. 8. Fish and Wildlife Coordination Act, as amended, 16 U.S.C. 661 et seq. Compliance: Coordination with the USFWS will signify compliance with this act. The draft Planning Aid Report is included in Appendix C. 9. Land and Water Conservation Fund Act of 1965, as amended, 16 U.S.C. 4601-4 et seq. Compliance: Not applicable. 10. Marine Protection, Research, and Sanctuaries Act of 1972, as amended 33 U.S.C. 1401 et seq. Compliance: Not applicable - The project does not involve disposal of materials in the ocean. 11. National Environmental Policy Act of 1969, as amended, 42 U.S.C. 432 et seq. Compliance: Preparation of this report and public coordination and comment signify partial compliance with National Environmental Policy Act (NEPA). Full compliance will be achieved with the signing and issuing of the Finding of No Significant Impact. 12. National Historic Preservation Act of 1966, as amended, 16 U.S.C. 470 et seq. 200

62
Compliance: Preparation of the Draft EA and public coordination and comment signifies partial compliance with NEPA. Full compliance is noted with the signing and issuing of the Finding of No Significant Impact (FONSI). 13. Rivers and Harbors Appropriation Act of 1899, as amended, 33 U.S.C. 401 et seq. Compliance: Exempt. 14. Watershed Protection and Flood Prevention Act, as amended, 16 U.S.C. 1001 et seq. Compliance: No requirements for USACE activities. 15. Wild and Scenic Rivers Act, as amended, 16 U.S.C. 1271 et seq. Compliance: The proposed project would not adversely impact any component of the Virginia Scenic Rivers System. Coordination with the National Park Service and the VDCR, relative to the Virginia Scenic Rivers System, will signify compliance with this act. 16. Resource Conservation and Recovery Act. 42 U.S.C 6901 et seq. (1979) Compliance: Project has been evaluated in reference to this act. No hazardous substances have been definitively identified on lands necessary for project construction, operation, and maintenance. Ordnance may be found in the general area of the borrow site and precautions have been incorporated into the project to ensure that the projects proceeds safely. Project is in compliance with this act following state and Federal agency concurrence with the findings of the Draft EA. Executive Orders 1. Executive Order 11988, Floodplain Management, 24 May 1977, as amended by Executive Order 12148, 20 July 1979. 201 Compliance: The proposed project would not stimulate development in the flood plain. Circulation of this report for public review fulfills the requirements of Executive Order 11988, Section 2(a)(2). 2. Executive Order 11990, Protection of Wetlands, 24 May 1977. Compliance: No wetlands are present in the proposed project area. Circulation of the Draft EA for public review fulfills the requirements of Executive Order 11990, Section 2(b). 3. Executive Order 12114, Environmental Effects Abroad of Major Federal Actions, 4 January 1979.

63
Compliance: Not applicable, this project is located within the U.S. 4. Executive Order 12898, Environmental Justice in Minority Populations and Low- Income Populations, 11 February 1994. Compliance: No impacts are expected to occur to any minority or low income communities in the project area. The Draft EA was made available for comment to all individuals who have an interest in the proposed project. 5. Executive Order 13508, Chesapeake Bay Protection and Restoration, 12 May 2009. Compliance: The project would contribute to the goals and objectives of the executive order. Executive Memorandum 1. Analysis of Impacts of Prime or Unique Agricultural Lands in Implementing NEPA, 11 August 1980. Compliance: The project does not involve or impact agricultural lands. 9.0 CONCLUSION The project would provide for a wider beach, offering significant benefits in the form of storm damage reduction. Maintaining and restoring dimensions of the beach would aid in reducing the impacts of shoreline erosion and provide greater storm protection, thus improving the size and quality of habitats for shoreline wildlife. Re-establishing beach habitat supports a variety of associated flora and fauna. The proposed action would have no significant environmental impacts on the existing environment. Currently, no mitigation actions are foreseen for the implementation of the proposed project. Coordination with the resources agencies is ongoing and may yet yield additional mitigation requirements. NOAA will require USACE to implement the reasonable and prudent measures during dredging and placement activities in order to eliminate the incidental take of threatened and endangered species. These measures typically include the use of turtle deflectors on the draghead, the presences of an observer on each dredge who has been trained in the proper handling and resuscitation of sea turtles, and development of a system for timely reporting to the NMFS. The implementation of the proposed action would not have a significant adverse impact on the quality of the environment, and an environmental impact statement is not required. 10.0 LIST OF AGENCIES, INTERESTED GROUPS AND PUBLIC CONSULTED

64
This EA will be circulated for a 30-day review and comment period with at least the following Federal, state and local agencies as well as local interests.
NMFS National Marine Fisheries Service USEPA U.S. Environmental Protection Agency USFWS U.S. Fish and Wildlife Service VDCR Virginia Division of Soil and Water Conservation VEIR Virginia Office of Environmental Impact Review VDEQ Virginia Department of Environmental Quality VDGIF Virginia Department of Game and Inland Fisheries VDHR Virginia Department of Historic Resources VIMS Virginia Institute of Marine Science VMRC Virginia Marine Resources Commission Hampton Roads Planning District Commission City of Virginia Beach Comments which are received will be addressed in the comment/response section
and will be included in the final version of this document. A FONSI will be published and those commenting will also receive a copy of the Environmental Assessment.

65
11.0 REFERENCES American Cetacean Society. “Fin Whale Balaenoptera physalus Fact Sheet”. Retrieved
18 February 2008. http://www.acsonline.org/factpack/finwhl.htm. Barnard, W. D. 1978. Prediction and control of dredged material dispersion around
dredging and open water pipeline disposal operations. Dredged Material Research Program Synthesis Report, TR DS-78-13, U.S. Army Engineers Waterways Experiment Station. Vicksburg, Mississippi.
Boon, J.D., J.M. Brubaker and D.R. Forrest, 2010. “Chesapeake Bay Land Subsidence
and Sea Level Change: An Evaluation of Past and Present Trends and Future Outlook” Special Report #425 in Applied Marine Science and Ocean Engineering, Virginia Institute of Marine Science, Gloucester Point, VA.
Bureau of Economic Analysis, Department of Commerce (BEA), 2012. Norfolk, Virginia Facts. Burlas, M., G. Ray, and D. Clarke, 2001. The New York District’s Biological Monitoring
Program for the Atlantic Coast of New Jersey, Asbury Park to Manasquan Section Beach Erosion Control Project. Engineer Research and Development Center, U. S. Army Engineer Waterways Experiment Station, Vicksburg, MS.
City of Norfolk. 2012. “Zoning Services Bureau”. Retrieved on 23 July 2012
http://www.norfolk.gov/planning/zoning_services_bureau.asp. Das, M.M. 1972. Suspended Sediment and Longshore Sediment Transport Data Review.
13th International Conference on Coastal Engineering, Vancouver, B.C., Canada.
Defeo, O., A. McLachlan, D.S. Schoeman, T.A. Schlacher, J. Dugan, A. Jones, M. Lastra and F. Scapini. 2009. Threats to sandy beach ecosystems: A review. Estuarine, Coastal and Shelf Science, 81:1-12.
Diaz, R. J., G. R. Cutter, Jr., and C. H. Hobbs, III, 2004. Potential impacts of sand
mining offshore of Maryland and Delaware: Part 2 - biological considerations. Journal of Coastal Research, 20: 61-69.
Dickerson, C., Reine, K. J., and Clarke, D. G. 2001. Characterization of Underwater
Sounds Produced by Bucket Dredging Operations. DOER Technical Notes Collection, TNDOERE14, U. S. Army Engineer Research and Development Center, Vicksburg, MS.17pp.
Dodd, C. K, Jr. 1988. Synopsis of biological data on the loggerhead sea turtle Caretta
caretta (Lineaus 1758). U. S. Fish and Wildlife Service Biological Report 88: 1-110.
66
Fleischer, P., McGee, G.J., and Brady, J.J.,"Beach Dynamics and Erosion Control, Ocean View Section, Norfolk, VA, Tech. Report No. 50, Institute of Oceanography, Old Dominion University, Norfolk, VA, 1977.
Forsell, D.J. 2004. Special report on the distribution and abundance of wintering seaducks and waterbirds in Mid-Atlantic coastal waters emphasizing the mouth of the Chesapeake Bay. U.S. Minerals Management Service. Herndon, VA.
Fritts, T.H., A.B. Irvine, R.D. Jennings, L.A. Callum, W. Hoffman, and M.S. McGehee.
1983. Turtles, Birds, and Mammals in the Nearby Atlantic Waters. U.S. Fish and Wildlife Service, Division of Biological Services, Washington, D.C. 455 pp.
Gilbert, C. R. 1990. Species profiles: life histories and environmental requirements of
coastal fishes and invertebrates (Mid-Atlantic Bight) -Atlantic and shortnose sturgeons. U.S. Fish and Wildlife Service Biol. Rep. 82(11.122). 28 pp.
Glass, Jon W. “Rare kind of sea turtle lays a one-of-a-kind nest.” The Virginian-Pilot,
August 5, 2005. Hardaway, C.S., Jr., L.M. Varnell, D.A. Milligan, G.R. Thomas, and C.H. Hobbs, III,
2001. Chesapeake Bay Dune Systems: Evolution and Status. Technical Report. Virginia Institute of Marine Science, College of William & Mary, Gloucester Point, Virginia.
Hardaway, C.S., D.A. Milligan, L.M. Varnell, C. Wilcox, G.R. Thomas, and T.R. Comer.
2005. Shoreline Evolution Chesapeake Bay Shoreline City of Norfolk, VA.” Virginia Institute of Marine Science.
Harper, Scott. “Norfolk works to rid Willoughby Spit of damaging plant”. The Virginian
Pilot. October 4, 2008. Hill, K. “Shortnose Sturgeon Acipenser brevirostrum.” Smithsonian Marine Station at
Fort Pierce. Retrieved April 15, 2008, http://www.sms.si.edu/irlSpec/Acipes_brevir.htm.
Hobbs, C.H., R.J. Byrne, and R.A. Gammisch. 1982. “Final Report to the Coastal Erosion
Abatement Commission Commonwealth of Virginia concerning the Inventory of Sand Resources in the Southern Portion of the Chesapeake Bay,” Virginia Institute of Marine Science.
Hobbs, C. H., 2004. "Geological history of Chesapeake Bay, USA," Quaternary Science
Reviews, Volume 23, Issues 5–6, pp.651-657. Lipcius , R.N. and M.M. Montane. 1997. A field study of the population dynamics of the
blue crab, Callinectes sapidus, in Chesapeake Bay. Final report submitted to the Virginia Marine Resources Commission and Chesapeake Bay Stock Assessment Committee.
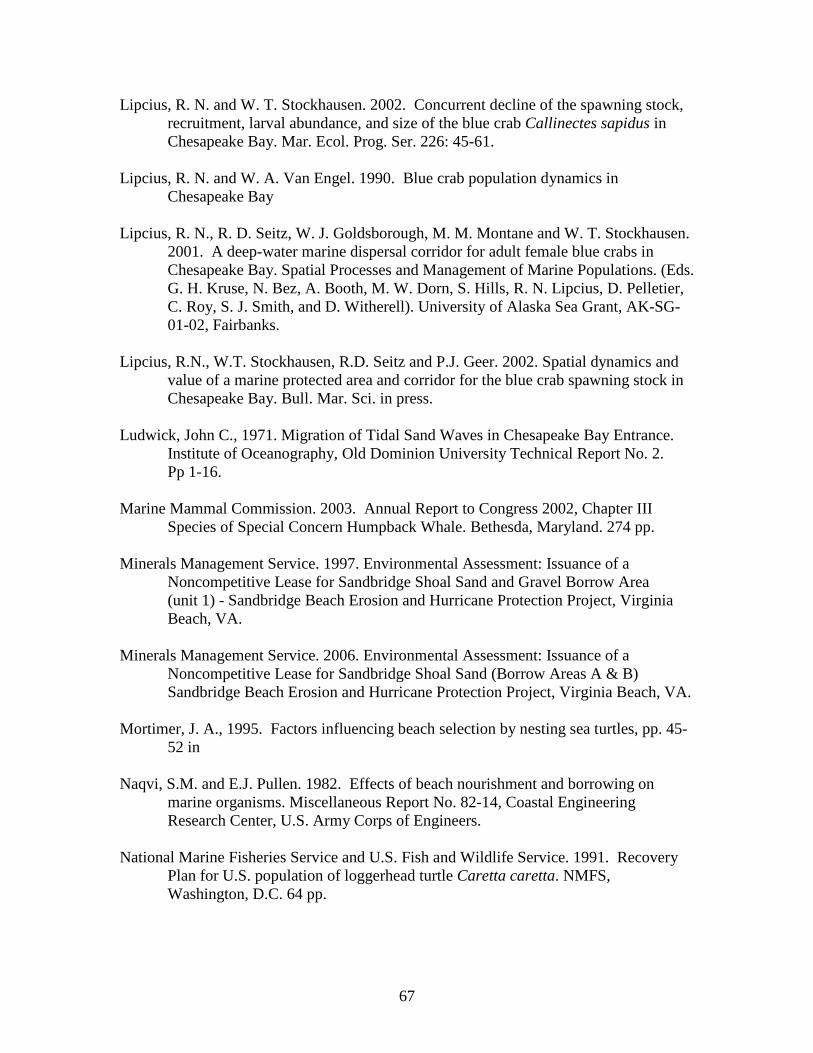
67
Lipcius, R. N. and W. T. Stockhausen. 2002. Concurrent decline of the spawning stock, recruitment, larval abundance, and size of the blue crab Callinectes sapidus in Chesapeake Bay. Mar. Ecol. Prog. Ser. 226: 45-61.
Lipcius, R. N. and W. A. Van Engel. 1990. Blue crab population dynamics in Chesapeake Bay
Lipcius, R. N., R. D. Seitz, W. J. Goldsborough, M. M. Montane and W. T. Stockhausen.
2001. A deep-water marine dispersal corridor for adult female blue crabs in Chesapeake Bay. Spatial Processes and Management of Marine Populations. (Eds. G. H. Kruse, N. Bez, A. Booth, M. W. Dorn, S. Hills, R. N. Lipcius, D. Pelletier, C. Roy, S. J. Smith, and D. Witherell). University of Alaska Sea Grant, AK-SG-01-02, Fairbanks.
Lipcius, R.N., W.T. Stockhausen, R.D. Seitz and P.J. Geer. 2002. Spatial dynamics and
value of a marine protected area and corridor for the blue crab spawning stock in Chesapeake Bay. Bull. Mar. Sci. in press.
Ludwick, John C., 1971. Migration of Tidal Sand Waves in Chesapeake Bay Entrance.
Institute of Oceanography, Old Dominion University Technical Report No. 2. Pp 1-16.
Marine Mammal Commission. 2003. Annual Report to Congress 2002, Chapter III
Species of Special Concern Humpback Whale. Bethesda, Maryland. 274 pp. Minerals Management Service. 1997. Environmental Assessment: Issuance of a
Noncompetitive Lease for Sandbridge Shoal Sand and Gravel Borrow Area (unit 1) - Sandbridge Beach Erosion and Hurricane Protection Project, Virginia Beach, VA.
Minerals Management Service. 2006. Environmental Assessment: Issuance of a
Noncompetitive Lease for Sandbridge Shoal Sand (Borrow Areas A & B) Sandbridge Beach Erosion and Hurricane Protection Project, Virginia Beach, VA.
Mortimer, J. A., 1995. Factors influencing beach selection by nesting sea turtles, pp. 45-
52 in Naqvi, S.M. and E.J. Pullen. 1982. Effects of beach nourishment and borrowing on
marine organisms. Miscellaneous Report No. 82-14, Coastal Engineering Research Center, U.S. Army Corps of Engineers.
National Marine Fisheries Service and U.S. Fish and Wildlife Service. 1991. Recovery Plan for U.S. population of loggerhead turtle Caretta caretta. NMFS,
Washington, D.C. 64 pp.

68
National Marine Fisheries Service and U.S. Fish and Wildlife Service. 1991. Recovery Plan for U.S. Population of Atlantic green turtle Chelonia mydas. NMFS, Washington, D.C. 59 pp.
National Marine Fisheries Service. 1991. Recovery Plan for the Humpback Whale
Megaptera novaengliae. Prepared by the Humpback Whale Recovery Team for the National Marine Fisheries Service. Silver Spring, Maryland. 105 pp.
National Marine Fisheries Service and U.S. Fish and Wildlife Service.1992. Recovery
Plan for Leatherback Turtles Dermochelys coriacea in the U.S. Caribbean, Atlantic and Gulf of Mexico. NMFS, Washington, D.C. 69 pp.
National Marine Fisheries Service and U.S. Fish and Wildlife Service. 1992. Recovery Plan for the Kemp’s ridley sea turtle Lepidochelys kempii. NMFS, St. Petersburg, FL. 40 pp.
National Marine Fisheries Service and U.S. Fish and. Wildlife Service. 1993. Recovery Plan for Hawksbill Turtles Eretmochelys imbricata in the U.S. Caribbean Sea, Atlantic Ocean, and Gulf of Mexico. NMFS, St. Petersburg, Florida. 59 pp.
National Marine Fisheries Service. 1998. Recovery Plan for the Shortnose Sturgeon (Acipenser brevirostrum). Prepared by the Shortnose Sturgeon Recovery Team for the National Marine Fisheries Service, Silver Spring, Maryland. 104 pages.
National Marine Fisheries Service. 2005. Recovery Plan for the North Atlantic Right
Whale Eubalaena glacialis. NMFS, Silver Spring, MD. 137 pp. National Marine Fisheries Service. 2007. Stock Assessments Humpback Whale
(Megaptera novaeangliae) Gulf of Maine Stock. NOAA's Fisheries Office of Protected Resources National Marine Fisheries Service.
National Marine Fisheries Service. “Guide to Essential Fish Habitat Designations in the
Northeastern United States.” Retrieved April 16, 2008, http://www.nero.noaa.gov/hcd/skateefhmaps.htm.
National Oceanographic and Atmospheric Administration. Habitat Conservation,
“Habitat Protection, Essential Fish Habitat Mapper v3.” Retrieved 2010. http://www.habitat.noaa.gov/protection/efh/habitatmapper.html
Nelson, W.G. 1993. Beach Restoration in the Southeastern U.S: Environmental effects
and biological monitoring. Ocean and Coastal Management, 19:157-182. Newell, R.C., L.J. Seiderer, and D.R. Hitchcock. 1998. The impact of dredging works in
coastal waters: A review of the sensitivity to disturbance and subsequent recovery of biological resources on the sea bed. Oceanography and Marine Biology: An Annual Review, 36: 127.

69
Nichols, M. M., G. S. Thompson, and R. W. Fass. 1978. A field study of fluid mud dredged NYDEC. New York State Department of Environmental Conservation. 2001. “Assessing and Mitigating Noise Impacts Conservation”. Available online: http://www.dec.ny.gov/docs/permits_ej_operations_pdf/noise2000.pdf.
Parr, T., D. Diner, and S. Lacy, 1978. Effects of Beach Replenishment on the Nearshore
Sand Fauna at Imperial Beach, California. Miscellaneous Paper No. 78-4, U. S. Army Corps of Engineers, Coastal Engineering Research Center, Fort Belvoir, Virginia. 125 pp.
Perry, M. C., A. M. Wells-Berlin, D. M. Kidwell, and P. C. Osenton. 2007. Temporal
changes of populations and trophic relationships of wintering diving ducks in Chesapeake Bay. Pages 4-16 in R. Michael Erwin, Bryan D. Watts, G. Michael Haramis, Matthew C. Perry, and Keith A. Hobson, editors. Waterbirds of the Chesapeake Bay and Vicinity: Harbingers of Change? Waterbirds 30(Special Publication 1). 182 pp.
Peterson, C.H. and M.J. Bishop. 2005. Assessing the Environmental Impacts of Beach
Nourishment. BioScience 88:887-896.
Priest, W. I. 1981. The effects of dredging impacts on water quality and estuarine organisms: A literature review, Special Report in Applied Marine Science and Ocean Engineering, No. 247, Virginia Institute of Marine Science, Gloucester Point, VA.
Reine, K., and Clarke, D. 1998. Entrainment by hydraulic dredges - A review of
potential impacts. Technical Note DOER-E1. U.S. Army Engineer Research and Development Center, Vicksburg, Mississippi.
Ruddy , G., 2000. Chesapeake Bay Shoreline, Hampton, VA, Feasibility Study, Planning
Aid Report: Baseline biological resources and potential impacts of Dredging at a Candidate Offshore Sand Borrow Area. Prepared for the US Army Corps of Engineers, Philadelphia District.
Schomer, P. 2001. “A White Paper: Assessment of Noise Annoyance”. Schomer and
Associates. Available online: http://www.nonoise.org/library/schomer/assessmentofnoiseannoyance.pdf.
Schubel, J. R., Carter, H. H., Wilson, R. E., Wise, W. M., Heaton, M. G., and Gross, M.
G. (1978). “Field investigations of the nature, degree, and extent of turbidity generated by open-water pipeline disposal operations,” Technical Report D-78-30, U.S. Army Engineer Waterways Experiment Station, Vicksburg, MS.
Tidewater Atlantic Research, 2000. Phase I Archaeological Remote Survey of the
Virginia Beach and Fort Story Hurricane Protection Borrow Areas, Virginia. Tidewater Atlantic Research, Inc., Washington, North Carolina.

70
Tidewater Atlantic Research, 2004. An Intensive Remote Sensing Survey of the Hampton, Virginia Hurricane and Storm Protection Borrow Area, Hampton Roads, Virginia. Tidewater Atlantic Research, Inc., Washington, North Carolina.
Tidewater Atlantic Research, 2007. An Intensive Ordnance and Submerged Cultural
Resource Remote-Sensing Survey of Proposed Borrow Areas Off Willoughby Bank and Thimble Shoal Channel, Chesapeake Bay, Virginia. Tidewater Atlantic Research, Inc., Washington, North Carolina.
U.S. Army Corps of Engineers.1977. Shore Protection Manual, Volumes 1-3. US Army
Coastal Engineering Research Center. U.S. Army Corps of Engineers. 1992. Final Feasibility Report and Environmental
Assessment Sandbridge, Virginia Beach, VA. USACE, Norfolk District. U.S. Army Corps of Engineers. 2001. Final Feasibility Report and Environmental
Assessment, Sandbridge Beach, Virginia Beach, VA. USACE, Norfolk District. U.S. Army Corps of Engineers. 2002. Final Detailed Project Report and Environmental
Assessment Chesapeake Bay Shoreline, Hampton, Virginia. USACE, Norfolk District.
U.S. Army Corps of Engineers. 2006. Environmental Assessment, Virginia Beach
Hurricane Protection Project. USACE, Norfolk District. U.S. Census Bureau, Department of Commerce, 2012. State & County Quick Facts,
Norfolk City, VA. Retrieved 2 July 2012. http://quickfacts.census.gov/qfd/states/51/51710.html
U.S. Fish and Wildlife Service. “Piping Plover Atlantic Coast Population”. Retrieved April 30, 2008, http://www.fws.gov/northeast/pipingplover/pdf/plover.pdf.
U.S. Fish and Wildlife Service and National Marine Fisheries Service. 1992. Recovery plan for the Kemp’s ridley sea turtle (Lepidochelys kempii). National Marine Fisheries Service, St. Petersburg, FL. 40pp.
U.S. Fish and Wildlife Service. 1998. Roseate tern recovery plan, northeastern population, first update. Hadley, MA. 75 pp.
Van Dolah, R. F., P. H. Wendt, R. M. Martore, M. V. Levisen, and W. A. Roumillat.
1992. A Physical and Biological Monitoring Study of the Hilton head Beach Nourishment Project.

71
Van Dolah, R. F., R. M. Martore, A. E. Lynch, M. V. Levisen, P. H. Wendt, D. J. Whitaker, and W. D. Anderson, 1994. Final Report: Environmental Evaluation of the Folly Beach Nourishment Project, U. S. Army Corps of Engineers, Charleston District, Charleston, S. C.
Virginia Department of Environmental Quality. 2012. Commonwealth of Virginia State
Air Pollution Control Board Regulations for the Control and Abatement of Air Pollution. Retrieved February 12, 2012, http://www.deq.virginia.gov/Programs/Air/LawsRegulationsGuidance.aspx.
Virginia Department of Game and Inland Fisheries (VDGIF). 2012. Fish and Wildlife Information Service (VaFWIS). Retrieved January 23, 2012. http://vafwis.org/fwig.
Virginia Employment Commission 2012, Norfolk City Community Profile. Virginia
Employment Commission, Economic Information Services Division, Richmond, Virginia. (report generated 27 June 2012).
Virginia Institute of Marine Science.“Sea Turtle Nesting Behavior”. Retrieved 6 May
2008, http://www.fisheries.vims.edu/turtletracking/nestingbehavior.html. Virginia Institute of Marine Science, SAV in Chesapeake and Coastal Bays”. Retrieved
17 February 2012, <http://web.vims.edu/bio/sav/maps.html>. Virginia Institute of Marine Science. “Winter Dredge Survey”. Retrieved on July 23,
2012,<http://www.vims.edu/research/units/programs/bc_winter_dredge/index. php>.
Virginia Marine Resources Commission. 2010. “Virginia Landings Bulletin, 2010 Annual Commercial Fisheries Statistics Summary Report”. Retrieved on July 23, 2012, http://www.mrc.state.va.us/Bulletins/2010_ANNR.pdf.
Weldon Cooper Center for Public Service, University of Virginia, 2012. Demographics
Interactive Map. Retrieved on July 26, 2012. http://www.coopercenter.org/demographics/interactive-map/citycounty/3103
Williams, Sara, and John Gallegos, 2000. Nesting Loggerhead Sea Turtle Activity Report, VA.

Plate EA-1

Plate EA-2
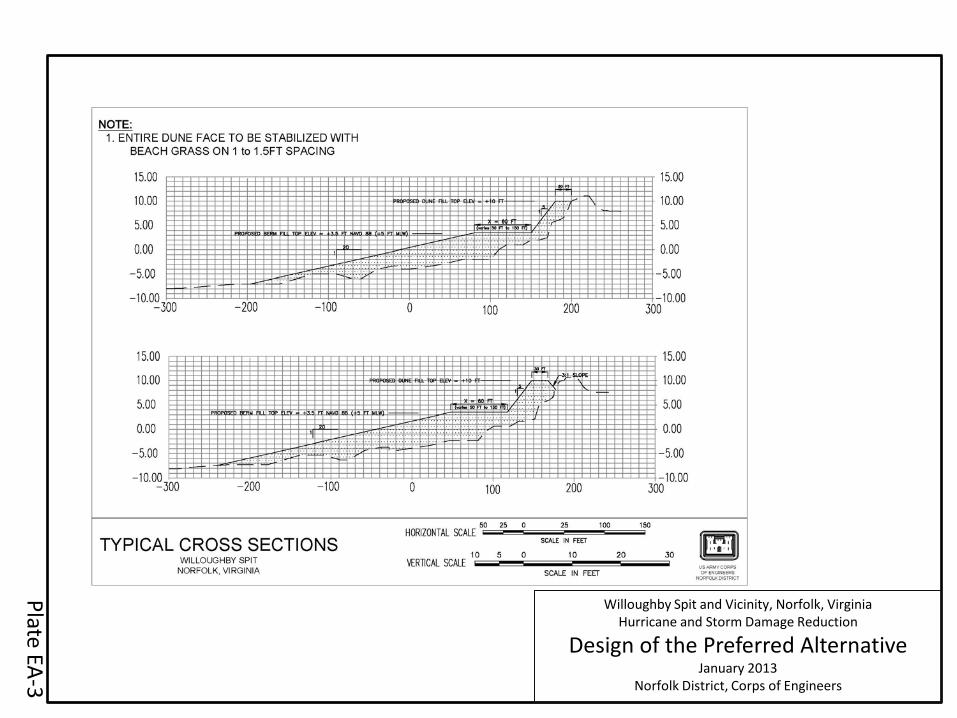
Willoughby Spit and Vicinity, Norfolk, Virginia Hurricane and Storm Damage Reduction
Design of the Preferred Alternative January 2013
Norfolk District, Corps of Engineers
Plate EA-3
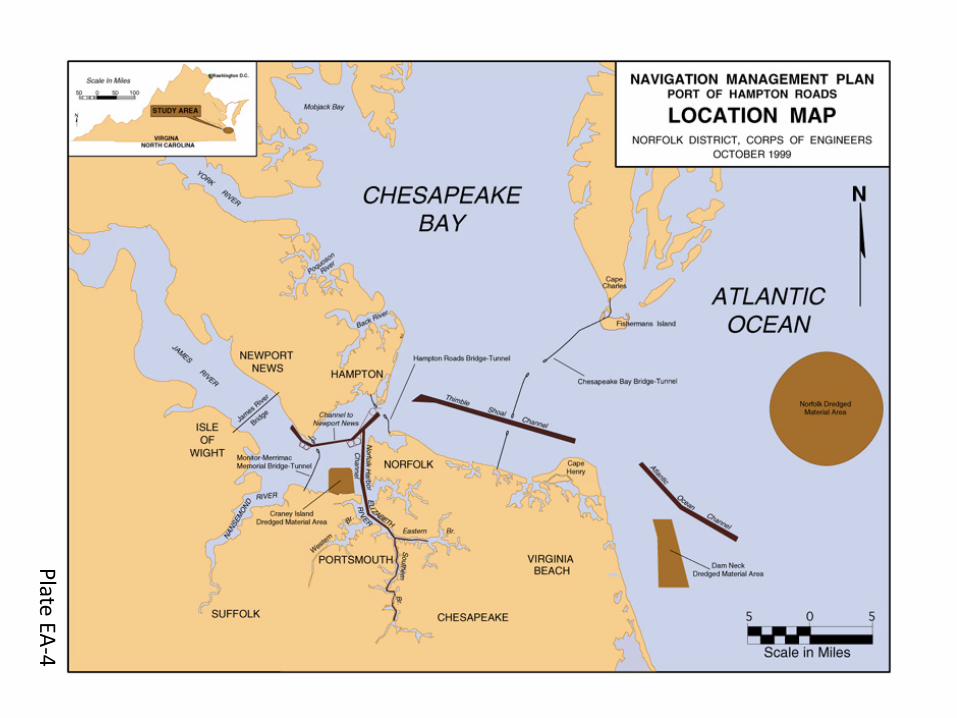
Plate EA-4

Willoughby Spit and Vicinity, Norfolk, Virginia Hurricane and Storm Damage Reduction
Typical Beach Profile January 2013
Norfolk District, Corps of Engineers
Plate EA-5

Plate EA-6
Willoughby Spit and Vicinity, Norfolk, Virginia Hurricane and Storm Damage Reduction
Hurricane of August 1933 January 2013
Norfolk District, Corps of Engineers
Tidal Variation in the Hampton Roads Area Resulting from the 1933 Hurricane (Image by VIMS).

Willoughby Spit and Vicinity, Norfolk, Virginia Hurricane and Storm Damage Reduction
Hurricane Isabel January 2013
Norfolk District, Corps of Engineers
Tidal Variation in the Hampton Roads Area Resulting from Hurricane Isabel (Image by VIMS).
Plate EA-7

Willoughby Spit and Vicinity, Norfolk ,Virginia Hurricane and Storm Damage Reduction
Peak Water Levels January 2013
Norfolk District, Corps of Engineers
Recorded peak water levels from the 1933 Hurricane (top) and from Hurricane Isabel (bottom) (Images by VIMS).
Plate EA-8

Plate EA-9
The storm tracks of the 1933 Hurricane (left) and Hurricane Isabel (right) (Images by NOAA).
Willoughby Spit and Vicinity, Norfolk, Virginia Hurricane and Storm Damage Reduction
Storm Tracks of the 1933 Hurricane and Hurricane Isabel
January 2013 Norfolk District, Corps of Engineers

Willoughby Spit and Vicinity, Norfolk, Virginia Hurricane and Storm Damage Reduction
November Preliminary vs. Predicted Water Levels January 2013
Norfolk District, Corps of Engineers
Water level measured at Sewells Point, VA Tidal Gage from November 01, 2009 to November 30, 2011 (Image from NOAA).
Plate EA-10

Plate EA-11
Willoughby Spit and Vicinity, Norfolk, Virginia Hurricane and Storm Damage Reduction
5 Day Preliminary vs. Predicted Water Levels January 2013
Norfolk District, Corps of Engineers
Water level measured at Sewells Point, VA Tidal Gage from November 10, 2009 to November 15, 2011 (Image from NOAA).

Willoughby Spit and Vicinity, Norfolk, Virginia Hurricane and Storm Damage Reduction
Wave Plot August 1933 January 2013
Norfolk District, Corps of Engineers
Plate EA-12

Willoughby Spit and Vicinity, Norfolk, Virginia Hurricane and Storm Damage Reduction
Wave Plot March 1962 January 2013
Norfolk District, Corps of Engineers
Plate EA-13

Willoughby Spit and Vicinity, Norfolk, Virginia Hurricane and Storm Damage Reduction
Wave Plot September 2003 January 2013
Norfolk District, Corps of Engineers
Plate EA-14
Willoughby Spit and Vicinity, Norfolk, Virginia Hurricane and Storm Damage Reduction
Wave Plot November 2009 January 2013
Norfolk District, Corps of Engineers
Plate EA-15

Willoughby Spit and Vicinity, Norfolk, Virginia Hurricane and Storm Damage Reduction
Historical Trends from the Sewells Point, VA Tide Gauge
January 2013 Norfolk District, Corps of Engineers
Plate EA-16

Willoughby Spit and Vicinity, Norfolk ,Virginia Hurricane and Storm Damage Reduction
Typical Vegetation Profile of a Beach Located Along the Chesapeake Bay
January 2013 Norfolk District, Corps of Engineers
Plate EA-17

Willoughby Spit and Vicinity, Norfolk, Virginia Hurricane and Storm Damage Reduction
Historic Maps of Willoughby Spit and Ocean View January 2013
Norfolk District, Corps of Engineers
Plate EA-18
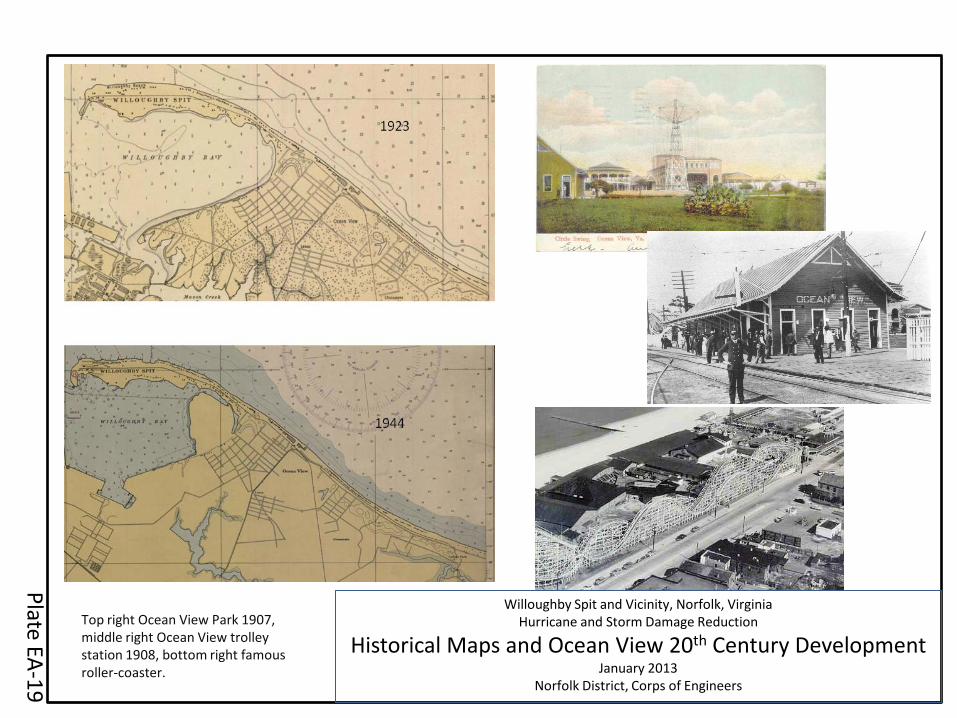
Willoughby Spit and Vicinity, Norfolk, Virginia Hurricane and Storm Damage Reduction
Historical Maps and Ocean View 20th Century Development January 2013
Norfolk District, Corps of Engineers
Plate EA-19
Top right Ocean View Park 1907, middle right Ocean View trolley station 1908, bottom right famous roller-coaster.

Plate EA-20

Willoughby Spit and Vicinity, Norfolk, Virginia Hurricane and Storm Damage Reduction
Architectural Inventory of Willoughby and Ocean View January 2013
Norfolk District, Corps of Engineers
Plate EA-21
850 W Ocean View Ave.
650 W. Ocean View Ave.
550 W. Ocean View Ave.
502 W. Ocean View Ave.
450 W. Ocean View Ave.
Willoughby and West Ocean View Structures Recored with DHR 17 Chela Avenue Area

DRAFT FINDING OF NO SIGNFICANT IMPACT WILLOUGHBY SPIT AND VICINITY HURRICANE AND
STORM DAMAGE REDUCTION PROJECT NORFOLK, VIRGINIA
I have reviewed and evaluated the Environmental Assessment (EA) for this project in terms of the overall public interest. The possible consequences of the alternatives were considered in terms of probable environmental impact, social well being, and economic factors. The proposed project involves the nourishment of a total of 7.3 miles of beach along the Chesapeake Bay shoreline in Norfolk for the purpose of storm damage reduction. The project will result in approximately 1,280,000 cubic yards of beach quality sand to be placed initially in a 3.5-foot (North American Vertical Datum [NAVD]88) high, 60-foot-wide berm, which provides a 250-foot-wide beach at the public beach from the Willoughby Spit to the Little Creek Inlet. The project is designed for nourishment at 9-year intervals on average, with each nourishment cycle requiring approximately 445,100 cubic yards of sand. The sand will be obtained from an offshore borrow site located in the Thimble Shoal Auxiliary Channel. Some negative impacts to water quality are expected; however, these impacts are expected to be short in duration. Increased turbidity at both the placement and borrow sites will result from the disturbance and placement of sand. Also, a decrease in dissolved oxygen and light penetration is expected to occur in the dredging plume at the borrow site. Water quality conditions will return to normal once dredging activities are completed. The project has been developed consistent with the Clean Water Act, Section 404(b) Guidelines. Temporary and insignificant impacts to the environmental resources in the project area will result from the implementation of the proposed project. The mortality of some aquatic organisms at the placement and borrow site is expected, as is the burial of some terrestrial organisms at the placement site. Although shore habitat will be converted to beach habitat due to nourishment activities, this impacted habitat is not considered significant or unique in the project area. As the material placed on the beach closely matches the grain size of the native material, populations of beach-dwelling organisms are expected to quickly rebound post-construction. Similarly, although there will be a direct loss of benthic organisms in the area to be dredged, previous studies have shown that these areas recolonize quickly. Reestablishment of pre-dredge population diversity will take longer, between two to three years. No significant adverse effects on threatened and/or endangered species and/or species of special concern are foreseeable with project implementation. Similarly, no significant impacts to species with designated Essential Fish Habitat in the project are anticipated. The proposed project has been evaluated under the Clean Air Amendments of 1990. Due to the small amount of construction required for the completion of the project, the amounts of nitrogen oxides (NOx) and volatile organic compounds (VOC) are not expected to exceed the minimum emission threshold that triggers the requirement to conduct a full-scale conformity determination. The project will comply with Section 176(b) of the Clean Air Amendments of 1990.
No significantly adverse economic or social impacts are foreseen as a result of the proposed action. Predicted impacts include the temporary interruption of beach access to limited areas due to project construction, and long term partial blocking of views of the Chesapeake Bay from residences and businesses. No Environmental Justice issues were identified during the evaluation of this project. The project would not affect the water views of five structures potentially eligible for listing in the National Register of Historic Places. Existing surveys of submerged archeological resources cover the selected borrow area and no significant archaeological resources were identified after Phase I and II marine archaeology surveys. The Virginia Department of Historic Resources was consulted and concurs that the Tentatively Selected Plan would cause no adverse effects to historic properties. The other project alternatives were not selected, as either they involved greater cost per unit benefit to reach the project goal, as in the case of evaluating structural options such as groins and breakwaters, or were not acceptable to the project sponsor, as in the case of the sponsor’s selecting a plan smaller than the National Economic Development Plan or did not fulfill the project objectives. The No-Action Alternative would not provide any improvement to the Willoughby Spit Project area. This report is based on an evaluation of the effects that the proposed action would have on the entire ecosystem; including the land, air, and water resources at both the Willoughby Spit placement site and the Thimble Shoal Auxiliary Channel borrow site. Cumulative impacts of other activities were also considered in this evaluation. It is concluded that implementing the tentatively selected plan would not have a significant adverse effect on the environment. Design features and best management practices will be incorporated into the project in order to minimize the adverse impacts. The expected long-term positive economic effects from the nourishment of the Willoughby project area are greater than the short-term, minor negative impacts resulting from construction activities. Due to the absence of significant adverse environmental impacts, an Environmental Impact Statement will not be required.
________________________ _______________________________ Date PAUL B. OLSEN, P.E.
Colonel, Corps of Engineers Commanding