urnal - Home - MPCilmuonline.mpc.gov.my/elmu-cis/document/... · · 2008-07-10Y. BHG. TAN SRI...
181
\urnal BU. 16, Januari '98 PERBADANAN PRODUKTIVITINEGARA ISSN 0127-8223 TREND AND PERFORMANCE OF AGRICULTURAL PRODUCTIVITY By Mad Nasir Shamsudin, Alias Radam and Fred Lew (Page 5) RELATIONSHIP BETWEEN PRODUCTIVITY AND CHARACTERISTICS OF FOREIGN DIRECT INVESTMENT(FDI) FIRMS IN SELECTED MANUFACTURING INDUSTRIES By Dr. Ab. Wahab Muhamad, Guok Eng Chai & Izani bin Ishak (Page 43) FUTURE DEVELOPMENT IN LOCAL GOVERNMENT THROUGH STRATEGIC MANAGEMENT By Phang Siew Nooi (Page 77) TECHNICAL EFFICIENCY OF FIRMS USING FRONTIER PRODUCTION FUNCTION By Rugayah Mohamed (Page 85) BUSINESS PROCESS MANAGEMENT: A BOUNDARYLESS APPROACH TO MODERN COMPETITIVENESS By Prof. Mohamed Zairi SB 1C Chair in Best Practice Management, University of Bradford (Page 95) WAGE RATES, LABOUR PRODUCTIVITY AND INFLATION IN MANUFACTURING SECTOR By Abd Rabman Ibrahim (Page 125) THE PRACTICE OF PRODUCTIVITY AND QUALITY IMPROVEMENT TECHNIQUES IN MALAYSIA By Awang bin Musa (Page 147) ANALISIS TERHADAP PERKAITAN STRESS DAN KEPUASAN KERJA DIKALANGAN PENTADBIR WANITA: CABARAN DAN PROSPER Oleh Sabitha Marican (Page 161)
Transcript of urnal - Home - MPCilmuonline.mpc.gov.my/elmu-cis/document/... · · 2008-07-10Y. BHG. TAN SRI...

\urnalBU. 16, Januari '98 PERBADANAN PRODUKTIVITINEGARA ISSN 0127-8223
TREND AND PERFORMANCE OF AGRICULTURAL PRODUCTIVITYBy Mad Nasir Shamsudin, Alias Radam and Fred Lew
(Page 5)
RELATIONSHIP BETWEEN PRODUCTIVITY AND CHARACTERISTICS OF FOREIGNDIRECT INVESTMENT (FDI) FIRMS IN SELECTED MANUFACTURING INDUSTRIES
By Dr. Ab. Wahab Muhamad, Guok Eng Chai & Izani bin Ishak(Page 43)
FUTURE DEVELOPMENT IN LOCAL GOVERNMENT THROUGH STRATEGICMANAGEMENT
By Phang Siew Nooi(Page 77)
TECHNICAL EFFICIENCY OF FIRMS USING FRONTIER PRODUCTION FUNCTIONBy Rugayah Mohamed
(Page 85)
BUSINESS PROCESS MANAGEMENT: A BOUNDARYLESS APPROACH TO MODERNCOMPETITIVENESS
By Prof. Mohamed ZairiSB 1C Chair in Best Practice Management, University of Bradford
(Page 95)
WAGE RATES, LABOUR PRODUCTIVITY AND INFLATION IN MANUFACTURING SECTORBy Abd Rabman Ibrahim
(Page 125)
THE PRACTICE OF PRODUCTIVITY AND QUALITY IMPROVEMENTTECHNIQUES IN MALAYSIA
By Awang bin Musa(Page 147)
ANALISIS TERHADAP PERKAITAN STRESS DAN KEPUASAN KERJA DIKALANGANPENTADBIR WANITA: CABARAN DAN PROSPER
Oleh Sabitha Marican(Page 161)

Serial

jurnalPRODUKTIVITl
3b lSO

jurnalPRODUKTIVITI
PENASIHATTuan Haji Ismail Adam
(Ketua Pengarah)
KETUA PENGARANGNik Zainiah Nik Abd. Rahman
(Pengarah P&Q Promosi)
SIDANG PENGARANGHamdi Olhman, Ab. Rahraan Khamis, Omar Othman,
Shezlina Zakaria, Fatimah Zainuddin, Sarimah Misman,Abdul Latif Abu Seman, Hj. Annuar Mahmud
PENERBITPerbadanan Produktiviti Negara
(National Productivity Corportion)Peti Surat 64
Jalan Sultan 46904Petaling Jaya, Malaysia
Tel: 03-7557266
PENCETAK/PRINTERPercetakan Wami Sdn. Bhd.
46 & 48, Lorong Perusahaan 4Kimpal Industrial Part
68100 Batu CavesSelangor Danil Ehsan.
Tel: 03-6882666
Kami mengalu-alukan sumbangan rencana untuk dimuatkan di dalam jurnal ini. 'JumalProduktiviti' diterbitkan enam bulan sekali, meliputi semua aspek ekonomi danpengurusan serta lain-lain bidang yang ada hubungannya dengan konsep produktiviti.Rencana-rencana yang tersiar tidak semestinya merupakan pendapat NPC.
NPCPERBADANAN PRODUKTIVITI NEGARA
'Jumal Produktiviti' diterbitkan oleh Perbadanan Produktiviti Negara(Kementerian Perdagangan Antarabangsa dan Industri) Peti Surat 64
Jalan Sultan 46904 Petaling Jaya, Selangor, Malaysia.Telefon: 03-7557266 (15 Talian) Fax: 03-7578068
http: //w ww.npc.org. my

LEMBAGA PENGARAHPERBADANAN PRODUKTIVITI NEGARA (NPC)
Y. BHG. TAN SRI DATO'AZMANHASHIMPengerusi, Perbadanan ProduktivitiNegara (NPC)
Y. BHG. ENCIK MOHD. ZULKIFLIABD.RAUPTimhalan Pengerusi NPC/Timbalan Ketua Setiausaha (Industri)Kementerian PerdaganganAntarabangsa & Industri (MITI)
ENCIK ISMAIL ADAMKetua PengarahPerbadanan Produktiviti Negara (NPC)
Y.BHG.TANSRIDATO'DRSHAMSUDIN BIN ABDUL KADIRPengerusi Eksekutif Sapura Holdings
Y. BHG. TAN SRI KISHUTIRATHRAIPengerusi & Pengarah UrusanKunipulan Globe
Y. BHG. DATO'ABDUL KHALIDIBRAHIMKetua EksekutifKumpulan Guthrie Berhad
Y.BHG. DR.MOHAMEDARIFFB.ABDUL KARIMKetua EbekutifMalaysian Institute of EconomicResearch (MIER)
Y. BHG. DATO1 HAJI MOHD. RAMLIKUSHAIRISetiausaha AgongNational Chamber of Commerce &Industry of Malaysia (NCCIM)
Y. BHG. TAN SRI DATO' SERIALIABUL HASSAN BIN SULAIMANKetua PengarahUnit Perancangan EkonomiJabatan Perdana Menteri
Y.BHG.DATO' ZAINOLABIDINABD. RASHIDKetua SetiausahaKementerian Sumber Mamisia
Y.BHG. DATO' MOHAMEDADNANB.ALIAkauntan Negara Malaysia
Y. BHG. DATO' ANNUAR MAARUFKetua SetiausahaKenienteriaii Pertanian Malaysia
Y. BHG. DATUK PROF.DR. ANUWAR ALIPengarah, Jabatan Pengajian TinggiKementerian Pendidikan Malaysia
Y. BHG. DATO' MUSTAFAMANSURNaib Presiden Persekutuan Pekilang-Pekilang Malaysia.
ENCIK JAAFAR B. ABD. C ARRIMPersekutuan Majikan-MajikanMalaysia
ENGIK RAJASEKARANGOVINDASAMYSetiausaha AgongKongres Kesatuan Sekerja Malaysia
Y.BHG. DATUK DR. HADENANABDUL JALILTimbalan Kutua Setiausaha
Kementerian PerdaganganAntarabangsa & Industri (MITI)
Y.M. RAJA ZAHARATON RAJAZAINALABIDINPengarah Seksyen Industri &Perdagangan, Unit Perancang EkonomiJahatan Perdana Menteri
ENCIK MUHAMAD NOOR YACOBSetiausaha Bahagian Perancangan &PenyelidikanKementerian Sumber Manusia
ENCffi TAMBI B. HJ. ABU HASSANPenolong PengarahBahagian BelanjawanKementerian Kewangan Malaysia
TUAN HAJI AHMAD PHARMY B.ABDUL RAHMANTimbalan Ketua Setiausaha (Operas!)Kementerian Pertanian Malaysia
P E J A B A T - P E J A B A T W I L A Y A HUTARAPengarah Wilayah UtaraBeg Berkunci 206, Jalan Bertam13200 Kepala Batas, Pulau PinangTel: 04-5754709Fax: 04-57545410
PANTAITIMURPengarah Wilayah Pantai TimurTingkat 18, Kompleks TeruntumJalan Mahkota, 25000 Kuantan.Tel: 09-5131788/5131789Fax: 09-5138903
KUCH1NGPengarah Wilayah SarawakLot 894, Fasa 3, Taman PerindustrianDemak Laut, Peti Surat 267993752 Kuching, Sarawak.Tel: 082-439959/439960Fax: 082-439969
SELATANPengarah Wilayah SelatanNO. 8, Jalan Padi MahsuriBandar Baru UDA81200 Johor Bahru..Tel: 07-2377422/2377644Fax: 07-2380798
KOTA KINABALUPengarah Wilayah SahahNo. 08, Tingkat 7, Blok EBangunan KWSP,49 Jalan Karamunsing88000 Kota Kinabalu.Tel: 088-235837/233245Fax: 088-242815
111

BIODATA
Mad Nasir Shamsudin has been with Universiti Putra Malaysia since1986 and Associate Professor since 1994. Obtained Ph.D. in AgriculturalEconomics with minor in Statistics from Mississippi State University,USA.
He teaches Agricultural Price Analysis at both undergraduate andgraduate levels. Taught other courses included Microeconomics,International Economics and Agricultural International Trade.
His main research interest is in Agricultural Trade Policy and CommodityModeling and Forecasting. Currently conducting research in the area oftrade liberalization and its impact on Malaysian agriculture. Hasdeveloped MASA (Malaysian Agricultural Sector Analysis) modeltogether with the Economic Planning Unit, Prime Minister's Department,which is capable of conducting policy simulation analysis and projectionsof Malaysian agriculture to the year 2010.
He has published and presented papers at both local and internationallevels and contributed chapters in books, mainly in the area ofcommodity modeling, policy simulation analysis and forecasting. Activein consultancy, recent clients included Asian Development Bank,Economic Planning Unit, Prime Minister's Department, Ministry ofAgriculture and National Productivity Corporation. Has also conductedtrainings, mainly in the area of business and economic forecasting.

TREND AND PERFORMANCEOF AGRICULTURAL PRODUCTIVITY1
2 3By Mad Nasir Shamsudin, Alias Radam and Fred Lew
1. INTRODUCTIONThe structure of the Malaysian economy has changed radically,through three decades of transformation from a primary-basedeconomy to a more diversified economy with expanding industrialbase. The changing structure is reflected in the changingcomposition of the country's GDP. The share of agriculture in GDPhas declined over the years from 30.8% in 1970 to 15.8% in 1993,while that of manufacturing sector has grown rapidly from 13.4% to30.1% over the same period. This transformation process is expectedto continue over the medium and long terms.
Although the share of the agricultural sector is declining, thesector's performance has been considerable. During the last threedecades, agriculture's annual growth has been 5.2 percent perannum. The average index of food production has risen by 39percent. The agricultural sector, however, is facing a structuralconstraints such as labour shortages and land availability. Theeconomic implication of the labour shortage is substantial. UnitedPlantation Association of Malaysia's (UPAM) survey of its membersestates has imputed harvest losses due labour shortage of thefollowing magnitude for 1991: rubber RM28 million (compared toRM11 million in 1988) and oil palm RM83 million (RM50 million).It is recognised that for the sector to continue to contribute to thedevelopment of the country, it must respond effectively to the aboveconstraints. One of the strategic options that has been identified is
' The study is funded by National Productivity Corporation.1 Associate Professor and lecturer, respectively, Department of Agricultural Economics, Universiti
Putra Malaysia.1 Consultant, National Productivity Corporation.
by improving the productivity which will improve the economicwelfare of the society. Growth in productivity helps abate inflation,conserves scarce resources and maintain Malaysia's competitiveposition. It is also evident that successful countries in developmentefforts have had impressive histories of productivity gains inagriculture.
Agricultural productivity studies in Malaysia only began in 1980sunder the initiative of Asian Productivity Organization (APO).These studies include, among others, Hussein and Kuperan (1987)and Mad Nasir, at. al (1989). Hussein and Kuperan documented thetrends in agricultural productivity and partial factor productivity ofland an labour covering the 1960-80 period. Mad Nasir at. al.estimated the trends in partial factor productivity of land, labour andcapital as well as total factor productivity from 1960 to 1986.
2. OBJECTIVESThe general objective of this study is to analyse the performance ofagricultural productivity. The specific objectives are to:
1. to estimate the trend of agricultural production;
2. to estimate the trend of agricultural factors of production;
3. to estimate partial factor productivity of land, labour andcapital;
4. to estimate total factor productivity; and
5. to identify the sources for productivity growth and a possiblestrategy that Malaysia could adopt in order to achieve greaterfarm output and returns.
3. METHODOLOGYThe approach adopted in this study follows that of Yamada (1969and 1983) and Asian Productivity Organization (1987). Theproductivity is measured both in terms of partial and total factorproductivity. Partial factor productivity refers to the productivity ofone single factor input. It is calculated as the ratio of totalproduction to total quantity of a factor input (land, labour, orcapital). An increase in partial productivity, among other things,implies a saving in the use of the input, and vice versa. Total factor

productivity is defined as the aggregative productivity measure, andcalculated as the ratio of total production to total factor inputs.
The factor inputs are measure both in terms of stock and flow. Thestock measure is defined as the amount utilised in production,without taking into account the rate of use or intensity. The flowmeasure, on the other hand, refers to the amount used in productionwhich also incorporates its intensity in use and time frame.
3.1 Total ProductionTotal production comprises the aggregate output ofcommodities produced in agriculture. In this study, totalproduction refers to the aggregate real value of agriculturalproducts consisting of crops, livestock and its products, fishand timber. It is expressed as an index of agriculturalproduction, and indicator showing the relative level of the realvalue of agricultural production for each year covered incomparison with a base year.
3.2 InputsFour categories of inputs are considered to be contributive toagricultural production; namely, land, labour, capital andcurrent inputs.
3.2.1 LandThe stock of land is constituted by the total area ofarable land and land under .permanent crops. The flowof lands, on other hand, refers to the area planted orharvested. This means that double-cropped areas must becounted twice. In both terms, differences in the qualityof different agricultural land and changes in the qualityof land from time to time are ignored.
3.2.2 LabourThe stock of labour comprises those economically activein agriculture. The differential work capacity of male,female and the juvenile labour may be taken intoaccount, if necessary, by incorporating conversionfactors. The flow of labour is defined as the amount ofwork it performs in agricultural production. It isconventionally expressed in terms of man-days.

Differences in abilities are considered by converting theman days into man-adult standard. In both terms, thequalitative aspects of labour such as experience,education and age are ignored.
In this study, the stock of labour input is measured by thenumber of agricultural workers, calculated based on thenumber of male equivalent as follows:
ME = M + 0.75 Fwhere
ME = male equivalent of farm workers;M = number of male workers; andF = number of female workers.
The conversion factor of 0.75 is from APO (1987). It isbased on the ratio of female wage-rate as well as theirwork hours on land cultivation to those of male labours.The juvenile labour component is not considered due tothe lack of suitable data. The labour flow is representedby the total number or equivalent man-days of labour,calculated as follows:
MDE = AM + B (0.75 F)where
MDE = number of equivalent man-days oflabour
M = number of male workers;F = number of female workers;A = number of days worked per year by
adult males; andB = number of days worked per year by
adult female
3.2.3 CapitalThe stock of capital comprise the total value of fixedcapital in agriculture. In flow terms, it refers to thestream of services provided by the fixed capital.
In this study, only farm machinery is considered in themeasurement of fixed capital since the data on theremaining capital assets is unavailable. Accordingly, the
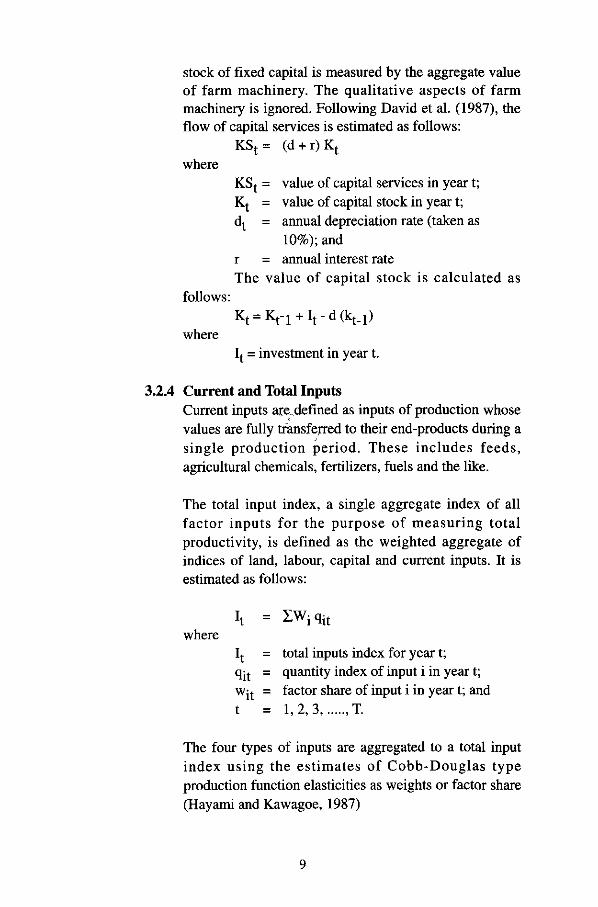
stock of fixed capital is measured by the aggregate valueof farm machinery. The qualitative aspects of farmmachinery is ignored. Following David et al. (1987), theflow of capital services is estimated as follows:
KS t= (d + r)K t
whereKSt = value of capital services in year t;Kt = value of capital stock in year t;dt = annual depreciation rate (taken as
10%); andr = annual interest rateThe value of capital stock is calculated as
follows:Kt = Kri + It-d(kt-i)
whereIt = investment in year t.
3.2.4 Current and Total InputsCurrent inputs are,defined as inputs of production whosevalues are fully transferred to their end-products during asingle production period. These includes feeds,agricultural chemicals, fertilizers, fuels and the like.
The total input index, a single aggregate index of allfactor inputs for the purpose of measuring totalproductivity, is defined as the weighted aggregate ofindices of land, labour, capital and current inputs. It isestimated as follows:
it = £wiqitwhere
It = total inputs index for year t;qjt = quantity index of input i in year t;wjt = factor share of input i in year t; andt = 1 2 3 TL — 1, ,, J, ...... J..
The four types of inputs are aggregated to a total inputindex using the estimates of Cobb-Douglas typeproduction function elasticities as weights or factor share(Hayami and Kawagoe, 1987)

4. DATAThe data was obtained from published materials such as MalaysiaPlan, Economic Report, Rubber Statistics Handbook, Oil Palm,Cocoa, Tea and Coconut Statistics Handbook, Miscellaneous CropStatistics Handbook, Sabah Agricultural Statistics, SarawakAgricultural Statistics and National Account Statistics.
The collected data include agricultural production, agriculturalinputs (land, labour, capital and current inputs) both in stock andflow terms. The time period of study is from 1960 to 1993.
5. RESULTS AND DISCUSSIONThis section discusses the growth of agricultural production, inputsand productivity. The analysis is based on intervals of 1961-70,1971-80, 1981-90, and 1991-93, entire period 1961-93 and threephases (Phase I 1961-65, Phase TI 1965-78 and Phase III 1978-93).The classification of the phases is based on the land-labour ratio,and is discussed in detail in the later section.
5.1 Agricultural ProductionAgricultural production has been in general, increasing overthe study period (Figure 1), except for the 1974-76 and 1982-84 periods when the growth rate fell due to the globaleconomic recession. The average annual growth over the 1961-93 period was 5.3 percent (Table 1). This performance waslargely attributed to increased production of exportcommodities such as palm oil, rubber in the 1960s and 1970s,cocoa, timber and sawlogs. The annual growth rates, however,decelerated from 6.5 percent in the 1960s to 5.9 percent in the1970s, and 4.2 percent in 1980s. In early 1990s (1991-93), theproduction grew only by 2.8 percent. The slower growth ratesin the 1980s was largely attributed by the prolonged worldeconomic recession, lower commodity prices and theemergence of structural constraints within agriculture. Thisstructural constraints, mainly the supply of agricultural labour,continued in the 1990s, although commodity prices, except forcocoa, have improved slightly.
10
5.2 Agricultural Inputs
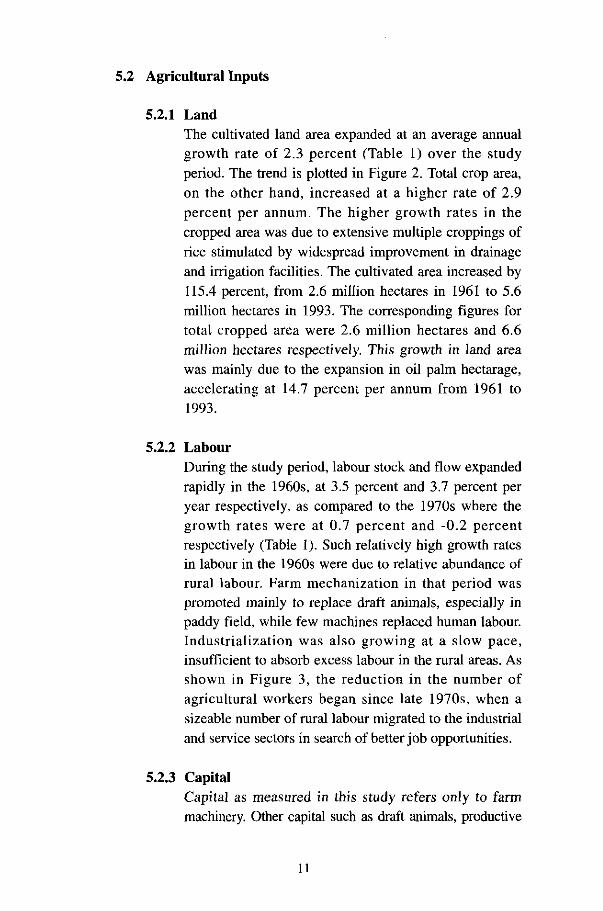
5.2.1 LandThe cultivated land area expanded at an average annualgrowth rate of 2.3 percent (Table 1) over the studyperiod. The trend is plotted in Figure 2. Total crop area,on the other hand, increased at a higher rate of 2.9percent per annum. The higher growth rates in thecropped area was due to extensive multiple croppings ofrice stimulated by widespread improvement in drainageand irrigation facilities. The cultivated area increased by115.4 percent, from 2.6 million hectares in 1961 to 5.6million hectares in 1993. The corresponding figures fortotal cropped area were 2.6 million hectares and 6.6million hectares respectively. This growth in land areawas mainly due to the expansion in oil palm hectarage,accelerating at 14.7 percent per annum from 1961 to1993.
5.2.2 LabourDuring the study period, labour stock and flow expandedrapidly in the 1960s, at 3.5 percent and 3.7 percent peryear respectively, as compared to the 1970s where thegrowth rates were at 0.7 percent and -0.2 percentrespectively (Table 1). Such relatively high growth ratesin labour in the 1960s were due to relative abundance ofrural labour. Farm mechanization in that period waspromoted mainly to replace draft animals, especially inpaddy field, while few machines replaced human labour.Industrialization was also growing at a slow pace,insufficient to absorb excess labour in the rural areas. Asshown in Figure 3, the reduction in the number ofagricultural workers began since late 1970s, when asizeable number of rural labour migrated to the industrialand service sectors in search of better job opportunities.
5.2.3 CapitalCapital as measured in this study refers only to farmmachinery. Other capital such as draft animals, productive
11

livestock, perennial crops, irrigation and non-residentialfarm buildings were not included due to data limitations.
The trends for the farm machinery employed in theMalaysian agriculture in both the stock and flow termsare shown in Figure 4. Its growth rates are presented inTable 1. Investment in farm machinery increased rapidlyat an annual rate of 6.9 percent in the 1970s, ascompared to -1.1 percent, -0.4 percent and -0.8 percentin the 1960s, 1980s and 1990s respectively. The averageannual growth rate was 1.4 percent over the studyperiod.
5.2.4 Non-Farm Current InputsThe measure of non-farm current inputs comprisesdomestic as well as imported input originating from non-farm sources. This include, among others, fertilizer,agricultural chemicals and animal feeds. Between 1961-93, the level of non-farm current inputs increased at anannual growth rate of 9,1 percent (Table 1). In 1993, thelevel of the inputs used was more then eight times aslarge as that of 1961.
5.3 Partial Factor Productivity
5.3.1 Land ProductivityThe trend and growth rates in land productivity duringthe 1961-93 period may be discerned from Figure 5 andTable 2 respectively. The land productivity in stock andflow terms were growing at an average annual rate of 2.9and 2.4 percent respectively. The growth rates weregenerally high in the 1960s and 1970s. The rates,however, decelerated in the 1980s. The observed slowgrowth of the 1980s could be due to the remarkableexpansion of cultivated land area at 3.6 percent perannum, compared to 2.7 percent in the 1960s and 2.3percent in the 1970s. Furthermore, the productiongrowth in the 1980s was slower than in the 1960s and1970s. The productivity growth rates, however,improved in early 1990s at around 2.7 percent in bothstock and flow terms.
12

5.3.2 Labour ProductivityLabour productivity has shown an increasing trend overthe study period (Figure 6). It grew at an average annualrate of 4.5 and 4.8 percent from 1961 to 1993 in stockand flow terms respectively (Table 2). The rate of growthwas high in the 1970s at 5.1 percent per annum in stockterms and 6.1 percent per annum in flow terms; moregradual in the 1980s at 4.6 percent in stock terms and4.5 percent in flow terms; and moderate rate at about 3percent in both stock and flow terms in the 1960s. Thelabour productivity improved remarkably in early 1990s.
5.3.3 Capital ProductivityThe trend in capital productivity is plotted in Figure 7.The growth rates are presented in Table 2. The growth inthe productivity for the entire period of study is 4.1 and5.1 percent per annum in stock and flow termsrespectively. The growth in capital per worker was verylow. This implies that Malaysia's agriculture is not yetcharacterised as capital -intensive.
5.4 Total Factor ProductivityA Cobb-Douglas production was fitted to the indices of factorinputs to obtained the factor shares. Table 3 presents the OLSestimates of parameters of the Cobb-Douglas productionfunction. The parameters were used as factor shares incomputing the total factor index. Dividing the aggregate outputindex by the total factor for a given year yields and index oftotal factor productivity. Increased productivity means greateroutput from the same amount of inputs, or an output producedwith fewer inputs.
The trends in total inputs and total factor productivity in boththe stock and flow terms are shown in Figures 8 and 9respectively. Their rate of change and the relative contributionsfor the growth of total productivity to output growth arepresented in Table 4. Total input increased at around 3 percent,and total productivity growth in stock and flow terms were 2.1and 2.3 percent per annum respectively.
13
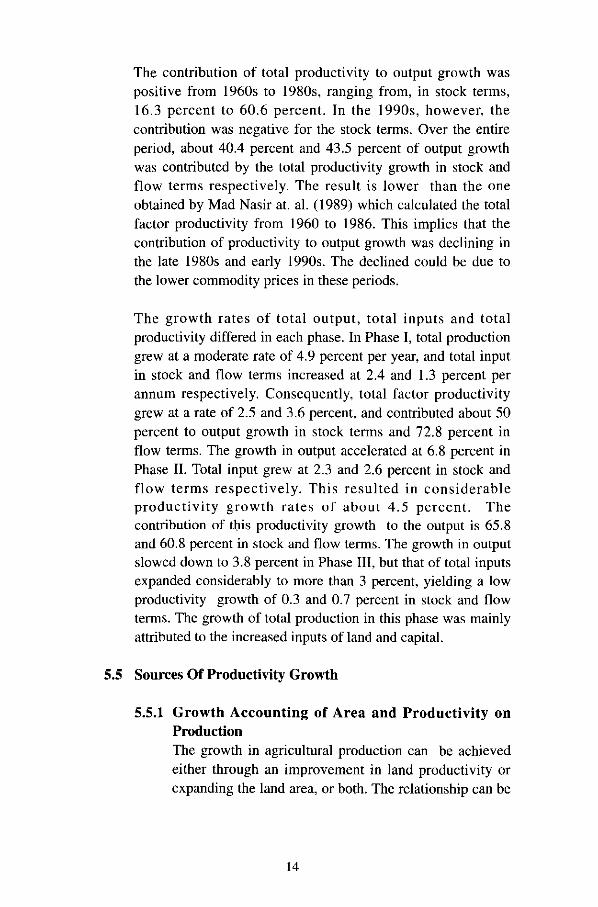
The contribution of total productivity to output growth waspositive from 1960s to 1980s, ranging from, in stock terms,16.3 percent to 60.6 percent. In the 1990s, however, thecontribution was negative for the stock terms. Over the entireperiod, about 40.4 percent and 43.5 percent of output growthwas contributed by the total productivity growth in stock andflow terms respectively. The result is lower than the oneobtained by Mad Nasir at. al. (1989) which calculated the totalfactor productivity from 1960 to 1986. This implies that thecontribution of productivity to output growth was declining inthe late 1980s and early 1990s. The declined could be due tothe lower commodity prices in these periods.
The growth rates of total output, total inputs and totalproductivity differed in each phase. In Phase I, total productiongrew at a moderate rate of 4.9 percent per year, and total inputin stock and flow terms increased at 2.4 and 1.3 percent perannum respectively. Consequently, total factor productivitygrew at a rate of 2.5 and 3.6 percent, and contributed about 50percent to output growth in stock terms and 72.8 percent inflow terms. The growth in output accelerated at 6.8 percent inPhase II. Total input grew at 2.3 and 2.6 percent in stock andflow terms respectively. This resulted in considerableproductivity growth rates of about 4.5 percent. Thecontribution of this productivity growth to the output is 65.8and 60.8 percent in stock and flow terms. The growth in outputslowed down to 3.8 percent in Phase III, but that of total inputsexpanded considerably to more than 3 percent, yielding a lowproductivity growth of 0.3 and 0.7 percent in stock and flowterms. The growth of total production in this phase was mainlyattributed to the increased inputs of land and capital.
5.5 Sources Of Productivity Growth
5.5.1 Growth Accounting of Area and Productivity onProductionThe growth in agricultural production can be achievedeither through an improvement in land productivity orexpanding the land area, or both. The relationship can be
14
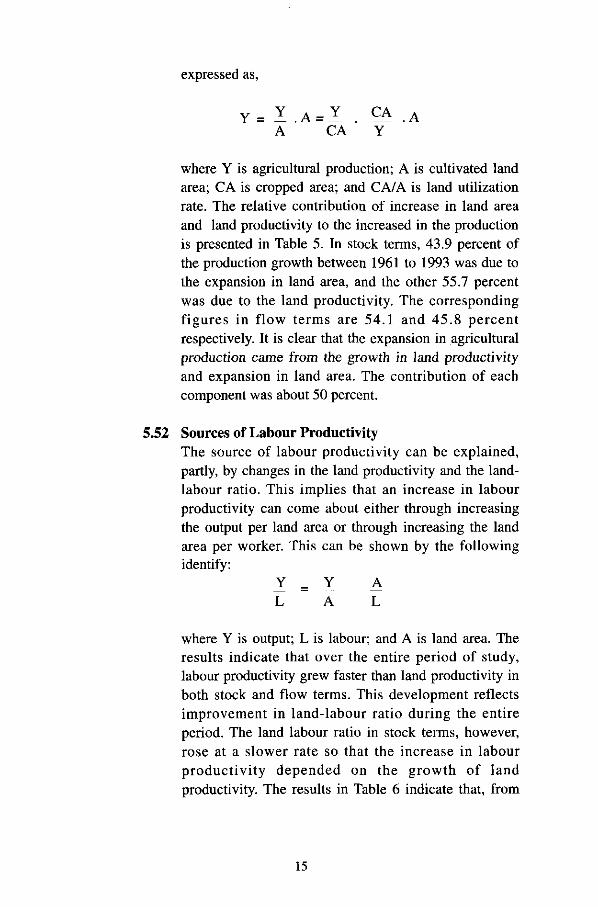
expressed as,
V V PAY — A = v--rt. AA ' CA ' Y~ '
where Y is agricultural production; A is cultivated landarea; CA is cropped area; and CA/A is land utilizationrate. The relative contribution of increase in land areaand land productivity to the increased in the productionis presented in Table 5. In stock terms, 43.9 percent ofthe production growth between 1961 to 1993 was due tothe expansion in land area, and the other 55.7 percentwas due to the land productivity. The correspondingfigures in flow terms are 54.1 and 45.8 percentrespectively. It is clear that the expansion in agriculturalproduction came from the growth in land productivityand expansion in land area. The contribution of eachcomponent was about 50 percent.
5.52 Sources of Labour ProductivityThe source of labour productivity can be explained,partly, by changes in the land productivity and the land-labour ratio. This implies that an increase in labourproductivity can come about either through increasingthe output per land area or through increasing the landarea per worker. This can be shown by the followingidentify:
Y = Y AL A L
where Y is output; L is labour; and A is land area. Theresults indicate that over the entire period of study,labour productivity grew faster than land productivity inboth stock and flow terms. This development reflectsimprovement in land-labour ratio during the entireperiod. The land labour ratio in stock terms, however,rose at a slower rate so that the increase in labourproductivity depended on the growth of landproductivity. The results in Table 6 indicate that, from
15
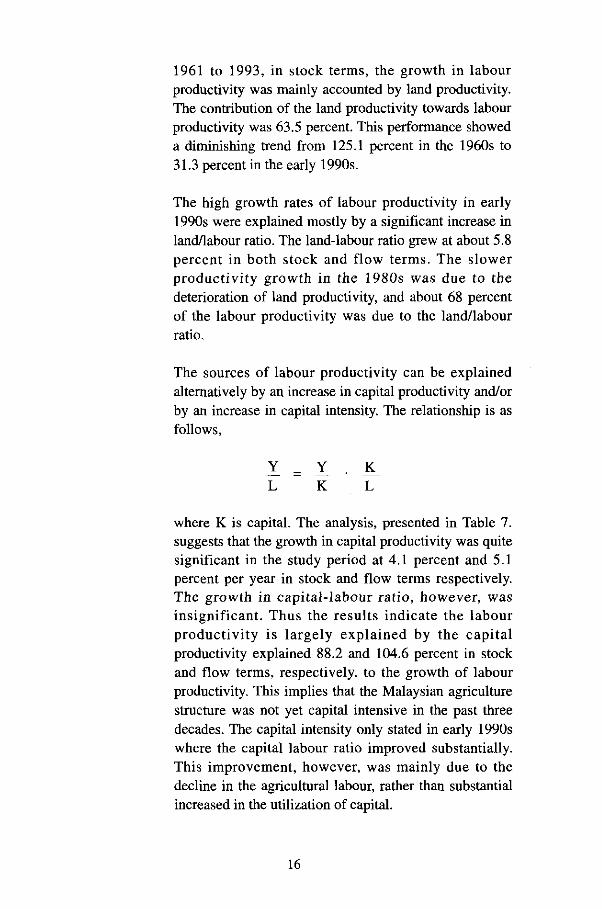
1961 to 1993, in stock terms, the growth in labourproductivity was mainly accounted by land productivity.The contribution of the land productivity towards labourproductivity was 63.5 percent. This performance showeda diminishing trend from 125.1 percent in the 1960s to31.3 percent in the early 1990s.
The high growth rates of labour productivity in early1990s were explained mostly by a significant increase inland/labour ratio. The land-labour ratio grew at about 5.8percent in both stock and flow terms. The slowerproductivity growth in the 1980s was due to thedeterioration of land productivity, and about 68 percentof the labour productivity was due to the land/labourratio.
The sources of labour productivity can be explainedalternatively by an increase in capital productivity and/orby an increase in capital intensity. The relationship is asfollows,
L K L
where K is capital. The analysis, presented in Table 7.suggests that the growth in capital productivity was quitesignificant in the study period at 4.1 percent and 5.1percent per year in stock and flow terms respectively.The growth in capital-labour ratio, however, wasinsignificant. Thus the results indicate the labourproductivity is largely explained by the capitalproductivity explained 88.2 and 104.6 percent in stockand flow terms, respectively, to the growth of labourproductivity. This implies that the Malaysian agriculturestructure was not yet capital intensive in the past threedecades. The capital intensity only stated in early 1990swhere the capital labour ratio improved substantially.This improvement, however, was mainly due to thedecline in the agricultural labour, rather than substantialincreased in the utilization of capital.
16

Analysing with respect to the phases of agriculturaldevelopment, the contribution of capital productivity,although substantial, was diminishing in both stock andflow terms. The contribution declined from about 300percent in Phase I to merely 50 percent in Phase III.
5.6 Strategies for Productivity ImprovementA crucial factor that determine agricultural productivityperformance, as well as the choice of agricultural technology, isthe country's resource endowment, denoted by the land-labourratio. If the ratio is low, in order to increase productivity andhence production growth, the country's agriculture has to raiseland productivity through land saving technology. On thecontrary, if the ratio is high, labour saving technology throughcapital intensive scheme is preferred to improve agriculturalproductivity.
Three growth phases can can be identified in the Malaysianagricultural development. These phases are identified by thetrends in the land to agricultural labour ratio (Figure 10). Thepatterns of the land-labour ratio are determined by the growthrate in population, the extent of economic development underspecific endowments of the land and labour, level of economicdevelopment and its growth rates and the share of agriculture inthe total economy.
Phase IThis phase is before 1965 and charaterised as land surplus. Theland-labour ratio increased by a sustained expansion ofcultivated land, the growth rate of which exceeded the growthrate of the number of agricultural workers. In stock terms, thegrowth rate in cultivated land area was 2.6 percent per annumcompared with 1.1 percent in the growth rate of agriculturalworkers (Table 8). In this phase, labour productivity rose morerapidly at 3.8 percent than land productivity at 2.3 percent.
Phase IIPhase II (1965-78) is categorised as labour surplus. Theagricultural labour force increased at an annual average rate of2.9 percent as compared to 2.2 percent for cultivated land area.
17

The land-labour ratio thus declined at a rate of 0.6 percent. Inthis phase, the growth in land productivity exceeded the growthin labour productivity. Asian countries such as Thailand,Philippines, Indonesia, India and Pakistan are in this category.This is partly due to their high population growth rates and lowabsorptive capacity of the non-agricultural sectors. A study byAsian Productivity Organisation (1987) indicates that the growthin land-labour ratio ranges from -0.5 percent in Indonesia to -2.6percent in the Philippines.
Phase IIIPhase III (1978-93) is characterised as labour scarce. Thenumber of agricultural labour declined at an average annual rateof 1.2 percent, mainly due to the high economic growth,outflow of rural youth to urban areas in search for better jobopportunities and the advent of ageing farm labour. Labourproductivity in this phase can be raised significantly byadopting high-level technologies which simultaneouslyimproves land productivity. The land-labour ratio grew at ahigh rate of 3.8 percent per annum. The figures for the declinedin the number of farm workers and the rise in the land-labourratio are substantially higher compared to an earlier study byMad Nasir at. al. (1989) employing the data from 1960 to 1986,indicating the shortage of farm labour has worsen since 1986.Other than Malaysia, Asian countries such as Japan, Taiwan,Korea are in this phase. The number of farm workers in Japan,Taiwan and Korea has been declining at around 2 percent peryear (APO, 1987). Malaysia, being in phase III, is partly due tothe high growth rate in the economic development anddecreasing share of the agriculture sector in the economywhich causes high labour absorption by the non-agriculturalsector.
Thus, in order for Malaysia to increase agriculturalproductivity and production, it would be beneficial to adopt thestrategies that have been implemented in the east Asiancountries. The strategies, among others, include:
1. Agricultural development must be closely linked withthe general economic development such thatdevelopment strategies could not ignore the prevailing
18

conditions and development of the other sectors of theeconomy. Appropriate institutional changes areimperative in adjusting the agrarian structure and socialsystems which would match with non-agriculturaleconomy as well as with sustainable modern agriculturaldevelopment;
2. The path of agricultural development has evolvedshifting from land-saving orientation during the laboursurplus situation to the labour-saving and capital-intensive orientation once farm labour shortage sets in.This includes intensification of farm mechanisation tosubstitute farm labour and draft power. Agriculturalproductivity has to be increased, first by improvingproductivity through the use of biological or chemicalinnovations, and second, by raising labour productivitythough the use of farm machineries;
3. Intensification of indigenous farm mechanisation andrapid adoption of imported technology; and
4. Devise policies pertaining to land ownership and leasesystem to facilitate and encourage efficientmechanisation among small size farm holdings.
The progress in farm mechanisation in Malaysian agriculturehas hitherto been relatively slow. Private ownership ofmachinery is not easily accepted by farmers largely due to theirfinancial incapability. Farm mechanisation as a means ofenhancing labour productivity seems to have been confined tothe rice sector. That severe constrain in mechanisation existingin the country, can be deduced from the almost absence of adomestic agricultural engineering industry and the near totaldependence on imported agricultural machineries. Statisticsshow that from 1985 to 1991, imports of agriculturalmachinery have increased from RM96.2 million to RM279.4million (Sixth Malaysia Plan). Mechanization work inMalaysia has for the past decades been confined to testing andadaptation of the imported machineries. This places Malaysianagriculture in a very vulnerable position where it is dependenton the prevalent economic, social and political conditions ofthe exporting countries for the supply of spare parts of
19

machines. In addition, there is also the question of suitability. Itis therefore desirable that agricultural machinery be designed,developed and manufactured locally to suit the existingagricultural structure in the country. The government shouldencourage the private sector to participate more fully in themanufacture of agricultural machinery. This can be initiated bythe provision of fiscal incentives for private capital to make itattractive to invest in the production of farm machinery fordomestic utilization and exports. Certain import restrictionsand subsidies would be necessary to ensure the growth ofindigenous industries at the initial stage. Export could beencouraged with the provision of export credit.
Agricultural mechnization program is a critical component inincreasing the productivity of agriculture and improving thequality of rural life. A comprehensive agriculturalmechanization policy is pertinent to ensure the success of theprogram. The policy should include all aspects which includemanufacturing, marketing and distribution, financing andcredit, research and development as well as education andtraining.
6. CONCLUSIONThe central theme of this study is to measure agriculturalproductivity and identify the sources of growth in Malaysianagriculture. Despite a structural constraint, agricultural sectorperformed satisfactorily over the past three decades. The highannual growth rate of 5.3 percent per annum for agricultural outputcan be explained as the combined result of increase in factor inputsand improvement in productivity. During the period under review,total inputs, including non-farm current inputs, averaged an annualgrowth rate of about 3 percent to yield about 2 percent per yeargrowth in productivity. The contribution of growth of total factorproductivity to the production growth was about 40 percent.
The productivity of land and labour grew impressively over theperiod of study. Labour productivity grew at a faster rate than landproductivity. Biological innovations make it possible to increaseland productivity, and the introduction of farm machineries helpedto raise labour productivity.
20

As Malaysian agriculture is projected to continue to face a shortageof agricultural workers, labour-saving technology throughmechanisation seems to be the most appropriate strategy forimproving both labour and land productivity. This calls forpragmatic approach aimed towards greater emphasis on machanisedfanning in the country.
21

REFERENCE
Asian Productivity Organization (1987) Productivity Measurement andAnalysis: Asian Agriculture, Tokyo.
Department of Agriculture Sabah, Agricultural Statistics of Sabah,various issues.
Department of Agriculture Sarawak, Agricultural Statistics of Sarawak,various issues.
Department of Statistics, Rubber Statistics Handbook, Kuala Lumpur,various issues.
Department of Statistics, Bulletin of Social Statistics Handbook, variousissues.
Department of Statistics, Oil palm, Cocoa, Tea and Coconut StatisticsHandbook, Kuala Lumpur, various issues.
Department of Statistics, Area of Miscellaneous Crops for PeninsularMalaysia Statistics Handbook, Kuala Lumpur, various issues.
Department of Statistics, Bulletin of Social Statistic Handbook, KualaLumpur, various issues.
David, C.C., R. Barker and A. Palacpac (1987) "Country Studies onAgricultural Productivity Measurement and Analysis: Phillipines", inProductivity Measurement and Analysis: Asian Agriculture, AsianProductivity Organisation, Tokyo.
Government of Malaya (1960) Second Malaya Plan, 1960-65, KualaLumpur.
Government of Malaysia (1966) First Malaysia Plan, 1966-70, KualaLumpur.
Government of Malaysia (1971) Second Malaysia Plan, 1971-75, KualaLumpur.
22

Government of Malaysia (1976) Third Malaysia Plan, 1976-80, KualaLumpur.
Government of Malaysia (1980) Fourth Malaysia Plan, 1981-85, KualaLumpur.
Government of Malaysia (1986) Fifth Malaysia Plan, 1986-90, KualaLumpur.
Government of Malaysia (1991) Sixth Malaysia Plan, 1991-95, KualaLumpur.
Government of Malaysia, Economic Reports, Kuala Lumpur, variousissues.
Hayami, Y, and T. Kawagoe (1987) "An Inter-Country Comparison ofAgricultural Production Efficiency" in Productivity Measurement andAnalysis: Asian Agriculture, Asian Productivity Organization, Tokyo,103-113.
Hussein, M.A. and K. Kuperan (1987) "A Country Paper on AgriculturalProductivity Measurement and Analysis" in ProductivityMeasurement and Analysis: Asian Agriculture, Asian ProductivityOrganization, Tokyo, 495-515.
Mad Nasir, S., A.A. Rahman and M.A. Hussein (1989) "Productivity andSources of Growth in Malaysian Agriculture, 1960-86" MalaysianJournal of Agricultural Economics, 5 (1): 35-51.
UPAM (1992) Eleventh UPAM Report on Shortage of Labour (in memberplantations) 1991.
Yamada, S (1969) Productivity Measurement Manual, Asian ProductivityOrganization, Tokyo.
Yamada, S (1983) Work Guideline for Measurement and Analysis ofAgricultural Productivity, Asian Productivity Organization, Tokyo.
23

FIGURE 1: AGRICULTURAL PRODUCTION INDEX (1960 = 100)
600
500
400
300
200
100
0 I I 1 I I I I I I _L I I I I I I I I I
1961 1965 1975I I I I I I I
1985J_ I i
19931970 1980 1990
Y E A R
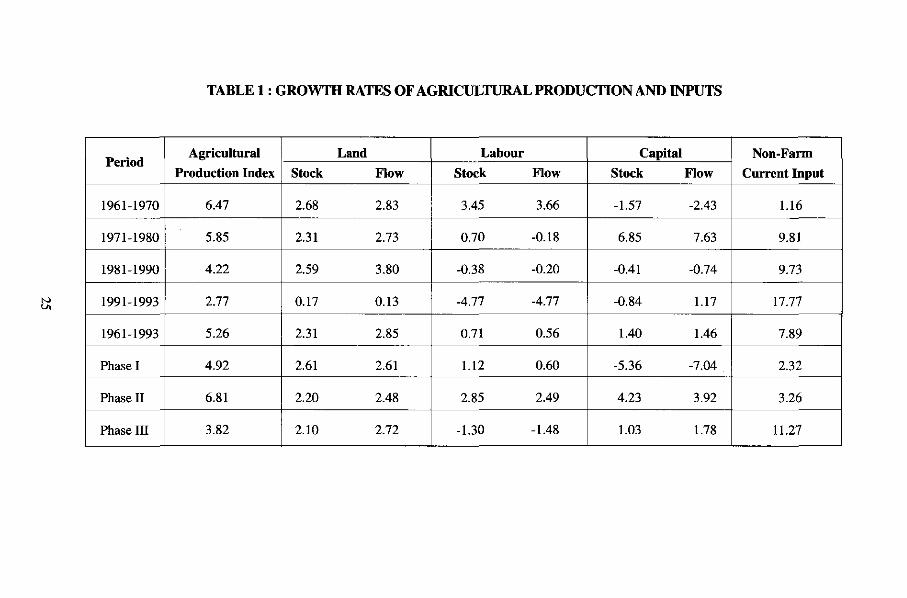
TABLE 1: GROWTH RATES OF AGRICULTURAL PRODUCTION AND INPUTS
Period
1961-1970
1971-1980
1981-1990
1991-1993
1961-1993
Phase I
Phase II
Phase in
AgriculturalProduction Index
6.47
5.85
4.22
2.77
5.26
4.92
6.81
3.82
LandStock Flow
2.68 2.83
2.31 2.73
2.59 3.80
0.17 0.13
2.31 2.85
2.61 2.61
2.20 2.48
2.10 2.72
LabourStock Flow
3.45 3.66
0.70 -0.18
-0.38 -0.20
-4.77 -4.77
0.71 0.56
1.12 0.60
2.85 2.49
-1.30 -1.48
CapitalStock Flow
-1.57 -2.43
6.85 7.63
-0.41 -0.74
-0.84 1.17
1.40 1.46
-5.36 -7.04
4.23 3.92
1.03 1.78
Non-FarmCurrent Input
1.16
9.81
9.73
17.77
7.89
2.32
3.26
11.27
toLft
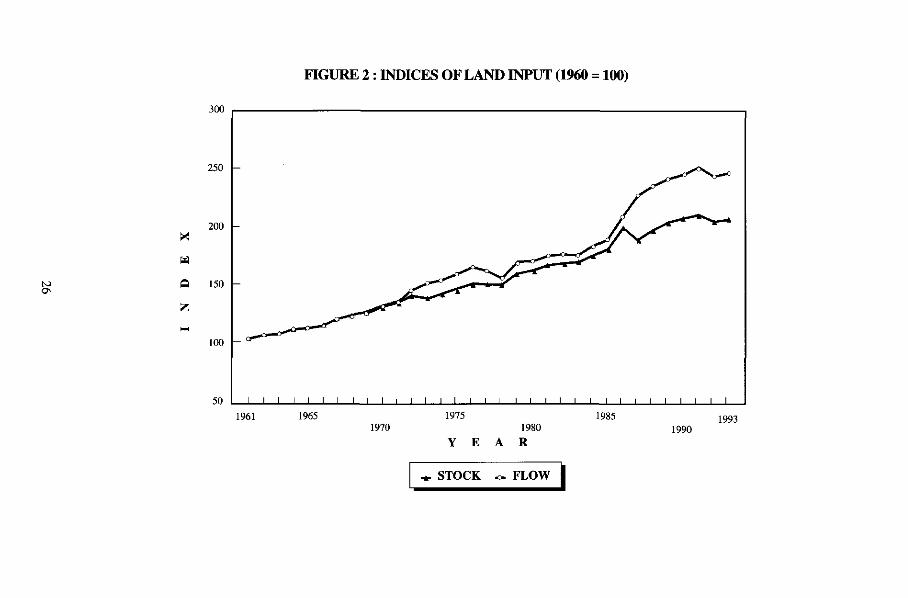
FIGURE 2: INDICES OF LAND INPUT (1960 = 100)
300
250
200
G 150
Z
100
1961 19651970
19751980
Y E A R
1985 19931990
STOCK <* FLOW

FIGURE 3: INDICES OF LABOUR INPUT (1960 = 100)160
140
120
100
80
1961 1965 1975 1985 19931970 1980 1990
Y E A R
— STOCK G. FLOW

NiCO
FIGURE 4: INDICES OF CAPITAL INPUT (1960 = 100)
200
150
— 100
1961 1965 19751970
1985 19931980 1990
Y E A R
- STOCK .a FLOW

FIGURE 5: INDICES OF LAND PRODUCTIVITY (1960 = 100)
to
300
250
«
Ed 200
Q
Z 150
NN
100
50 i i i i i i i i i i i i i i i i i (__ i i, i _ _ . . i i i i i i i i i i i i1961 1965 1975 1985 1993
1970 1980 1990Y E A R
— STOCK o FLOW

TABLE 2 :GROWTH RATES OF PARTIAL FACTOR PRODUCTIVITY
Period
1961-1970
1971-1980
1981-1990
1991-1993
1961-1993
Phase I
Phase II
Phase III
Land ProductivityStock Flow
3.70 3.55
3.52 3.10
1.67 0.49
2.65 2.70
2.93 2.41
2.26 2.27
4.54 4.26
1.75 1.18
Labour ProductivityStock Flow
2.96 2.85
5.12 6.08
4.63 4.47
8.48 8.48
4.62 4.83
3.76 4.36
3.88 4.32
5.33 5.57
Capital ProductivityStock Flow
8.49 9.74
-0.78 0.30
4.65 6.05
3.64 1.98
4.08 5.05
10.87 13.51
2.87 4.35
2.86 2.96
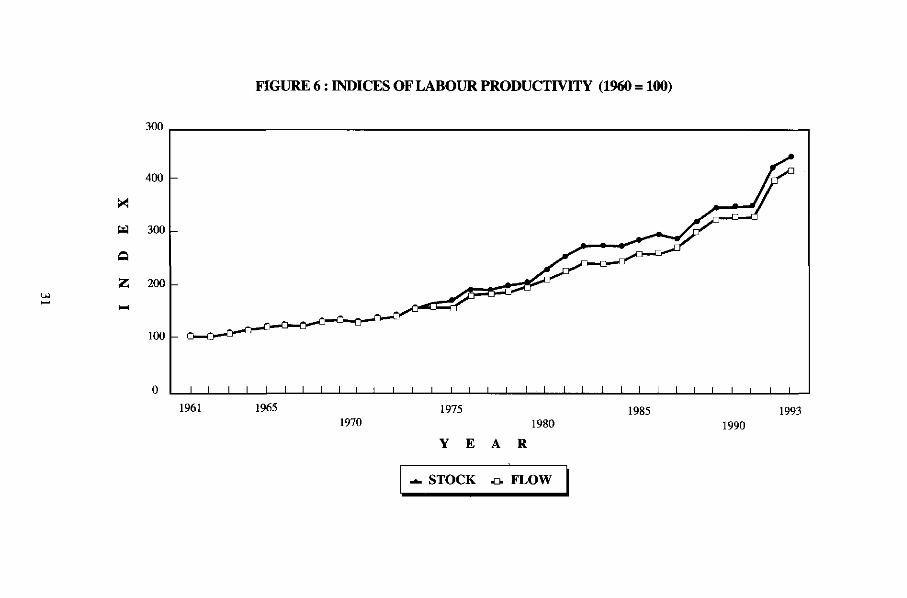
FIGURE 6: INDICES OF LABOUR PRODUCTIVITY (1960 = 100)
300
400
X
W 300
aZ, 200
M
100
0 i i i i i I I I I i
1961 1965 1975 1985 19931970 1980 1990
Y E A R
— STOCK 43. FLOW

FIGURE 7 : INDICES OF CAPITAL PRODUCTIVITY (1960 = 100)
OJto
X
400
300
200
100
0 i i i i i i i i i i i i i i i i i i i i i i i i i i i i t i i i i
1961 1965 1975 1985 1993
1970 1980 1990Y E A R
— STOCK & FLOW

TABLE 3: ESTIMATED COBB-DOUGLAS PRODUCTIONFUNCTIONS
Land
Labour
Capital
Current input
Intercept
Readjusted
Stock Terms
0.8356(2.6250)
0.0523(0.1763)
0.0119(0.0682)
0.1002(1.3620)
0.4371(2.1330)
0.9899
Flow Terms
0.7280(2.6150)
0.0863(0.3846)
0.1308(0.5450)
0.0549(0.8321)
0.4576(2.2500)
0.9916
33

FIGURE 8: INDICES OF AGRICULTURAL PRODUCTION, TOTAL INPUTAND TOTAL INPUT PRODUCTIVITY 1961-1993
(STOCK TERMS)
600
500
400
300
20°
100
1961 19651970
19751980
Y E A R
1985 19931990
.0. Agricultural Production -*. Total input ^ Total input Productivity

FIGURE 9: INDICES OF AGRICULTURAL PRODUCTION, TOTAL INPUTAND TOTAL INPUT PRODUCTIVITY 1961-1993
(FLOW TERMS)600
500
«* 400
Ed
Q 300
Z
M 2°°
100
I I I I I I I I I I
1961 1965 19751970
1985 19931980 1990
Y E A R
13. Agricultural Production Total input •*• Total input Productivity

TABLE 4: GROWTH RATE IN TOTAL PRODUCTION, TOTAL INPUT, TOTAL PRODUCTIVITY AND RELATIVECONTRIBUTION OF TOTAL PRODUCTIVITY TO OUTPUT GROWTH
Period
1961-1970
1971-1980
1981-1990
1991-1993
1961-1993
Phase I
Phase II
Phase III
Growth Rate (%)
Total Input
Stock Flow
2.46 2.19
2.96 3.28
3.59 3.59
4.42 2.41
3.13 2.96
2.38 1.29
2.26 2.58
3.64 3.20
Total Productivity
Stock Flow
3.92 4.19
2.89 2.55
0.69 0.70
-1.58 0.35
2.13 2.29
2.50 3.58
4.48 4.41
0.26 0.69
Relative Contributionof Total Productivity
to Production Growth
Stock Flow
60.59 64.83
49.44 43.56
16.28 16.66
-57.09 12.57
40.44 43.46
50.71 72.84
65.83 60.83
6.73 18.09
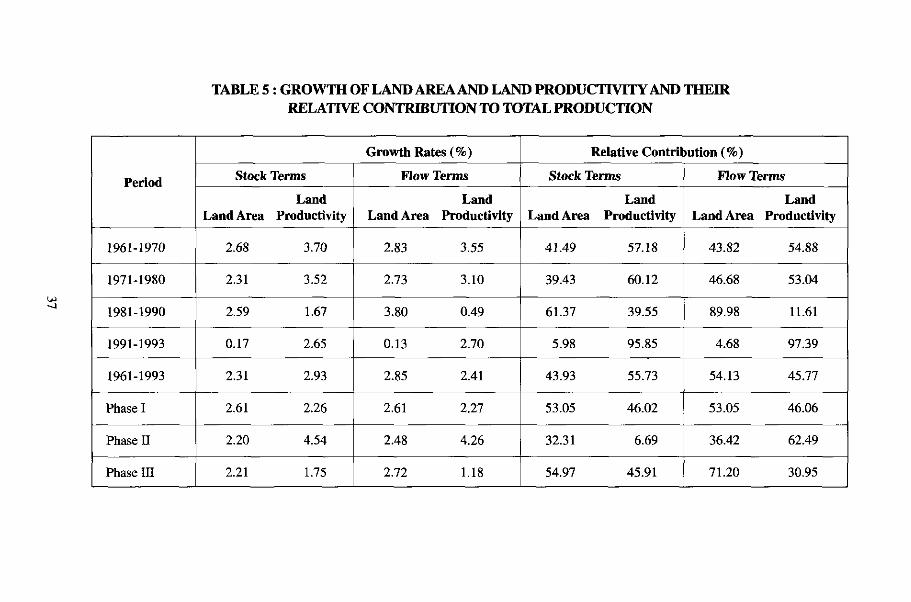
TABLE 5 : GROWTH OF LAND AREA AND LAND PRODUCTIVITY AND THEIRRELATIVE CONTRIBUTION TO TOTAL PRODUCTION
Period
1961-1970
1971-1980
1981-1990
1991-1993
1961-1993
Phase I
Phase II
Phase III
Growth Rates (%)Stock Terms
LandLand Area Productivity
2.68 3.70
2.31 3.52
2.59 1.67
0.17 2.65
2.31 2.93
2.61 2.26
2.20 4.54
2.21 1.75
Flow Terms
LandLand Area Productivity
2.83 3.55
2.73 3.10
3.80 0.49
0.13 2.70
2.85 2.41
2.61 2.27
2.48 4.26
2.72 1.18
Relative Contribution (%)
Stock TermsLand
Land Area Productivity
41.49 57.18
39.43 60.12
61.37 39.55
5.98 95.85
43.93 55.73
53.05 46.02
32.31 6.69
54.97 45.91
Flow TermsLand
Land Area Productivity
43.82 54.88
46.68 53.04
89.98 11.61
4.68 97.39
54.13 45.77
53.05 46.06
36.42 62.49
71.20 30.95
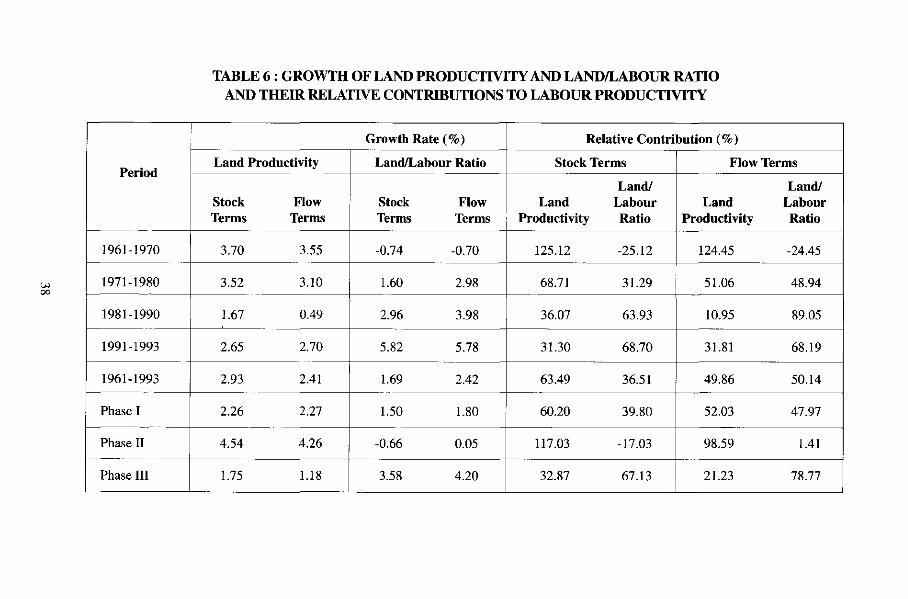
TABLE 6: GROWTH OF LAND PRODUCTIVITY AND LAND/LABOUR RATIOAND THEIR RELATIVE CONTRIBUTIONS TO LABOUR PRODUCTIVITY
Period
1961-1970
1971-1980
1981-1990
1991-1993
1961-1993
Phase I
Phase II
Phase III
Growth Rate (%)Land Productivity
Stock FlowTerms Terms
3.70 3.55
3.52 3.10
1.67 0.49
2.65 2.70
2.93 2.41
2.26 2.27
4.54 4.26
1.75 1.18
Land/Labour Ratio
Stock FlowTerms Terms
-0.74 -0.70
1.60 2.98
2.96 3.98
5.82 5.78
1.69 2.42
1.50 1.80
-0.66 0.05
3.58 4.20
Relative Contribution (%)
Stock Terms
Land/Land Labour
Productivity Ratio
125.12 -25.12
68.71 31.29
36.07 63.93
31.30 68.70
63.49 36.51
60.20 39.80
117.03 -17.03
32.87 67.13
Flow Terms
Land/Land Labour
Productivity Ratio
124.45 -24.45
51.06 48.94
10.95 89.05
31.81 68.19
49.86 50.14
52.03 47.97
98.59 1.41
21.23 78.77

TABLE 7: GROWTH OF CAPITAL PRODUCTIVITY AND CAPITAL/LABOUR RATIOAND THEIR RELATIVE CONTRIBUTIONS TO LABOUR PRODUCTIVITY
Period
1961-1970
1971-1980
1981-1990
1991-1993
1961-1993
Phase I
Phase H
Phase HI
Growth Rate (%)Capital Productivity
Stock FlowTerms Terms
8.49 9.74
-0.78 0.30
4.65 6.05
3.64 1.98
4.08 5.05
10.07 13.51
2.87 4.35
2.86 2.96
Capital/Labour Ratio
Stock FlowTerms Terms
-5.54 -6.89
5.90 5.78
-0.02 -1.57
4.84 6.50
0.55 -0.22
-7.11 -7.89
1.01 -0.02
2.47 2.50
Relative Contribution (%)
Stock TermsCapital Capital/
Productivity LabourRatio
287.39 -187.39
-15.25 115.25
100.33 -0.33
42.91 57.09
88.19 11.81
289.00 -189.00
74.00 26.00
53.72 46.28
Flow Terms
Capital Capital/Productivity Labour
Ratio
341.45 -241.45
4.92 95.08
135.12 -35.12
23.34 76.66
104.56 -4.56
309.83 -209.83
100.62 -0.62
53.10 46.69

TABLES: GROWTH RATE IN LAND, LABOURAND THEIR PRODUCTIVITY
Cultivated land area
Number of workers
Cultivated land areaper worker
Land productivity
Labour productivity
PHASE
I
1960-1965
2.60
1.12
1.47
2.26
3.76
II
1965-1978
2.20
2.86
-0.58
4.54
3.88
III
1979-1993
2.26
-1.23
3.79
1.76
5.61
40

FIGURE 10: INDICES OF LAND/LABOUR RATIO, LAND PRODUCTIVITY AND LABOUR PRODUCTIVITY
500
400
300
200
100
Phase II PhilSL III
1961 1965 1975 19851970
19931980
Y E A R1990
Agricultural Production -. Total input .*. Total input Productivity

BIODATA
Dr. Ab. Wahab bin Muhamad holds a Doctorate Degree in BusinessAdministration. Currently, he is the Director of Policy Research in NPCwhere he directs researches in issues related to Productivity and Quality(P&Q) for the purpose of formulating policy directions.
Guok Eng Chai obtained his Master of Arts degree in the field ofmanagement from Universiti Sains Malaysia in 1991. He has beeninvolved, as coordinator, in several NPC's research projects.
Izani bin Ishak graduated with a Bachelor of Science degree majoring inStatistics from Universiti Kebangsaan Malaysia in 1987. As a consultantin the Directorate of Manufacturing Research NPC, he undertakesproductivity performance studies.
42

RELATIONSHIP BETWEENPRODUCTIVITY AND CHARACTERISTICSOF FOREIGN DIRECT INVESTMENT (FDI)FIRMS IN SELECTED MANUFACTURING
INDUSTRIES
Written by:Dr. Ah. Wahab Muhamad, Guok Eng Chai & Izani bin Ishak
ABSTRACTThis article is a continuation of the earlier article entitled "Relationshipbetween Productivity and Characteristics of Foreign Direct Investment(FDI) Firms in Selected Manufacturing Industries"' which was publishedin Jurnal PRODUKTIVITI, Bil. 16, Disember, 1994. The purpose of thisarticle is to present the research findings and the implications of theabove study. The research findings will be analysed vis-a-vis (i) thefrequency distributions of productivity indicators and characteristics ofFDI firms; (ii) the tests of significant difference by types of industry,nationality of parent firm, and present ownership; and (Hi) the significantcorrelations between the productivity indicators and the characteristicsof FDI firms.
1.0 RESEARCH FINDINGS1.1 Frequency Distribution of Dependent Variables:
Productivity Indicators
Table 1 indicates 74.0 percent of the samples or firms in the studyrecorded added value per employee (Yi) of less than RM 200,000.Hence, 26.0 percent of the firms achieved added value per employeeof RM 200,000 and above.
In terms of added value per RM of fixed assets (Yi), 69.6 percent ofthe firms registered value of 0.99 and below, whereas 30.4 percentrecorded value of 1.00 and above.
The original study was completed in 1993 by a team ofNPC officers from the then ProductivityResearch Unit The officers involved include Dr Ab Wahab b Muhamad (Project Leader},Guok Eng Chai (Project Coordinator), Izani b hhak, Ghazi b Zakana, Hj Anuar Mahmud, AbRahmanb Khamis and Rokiah bteAziz
43
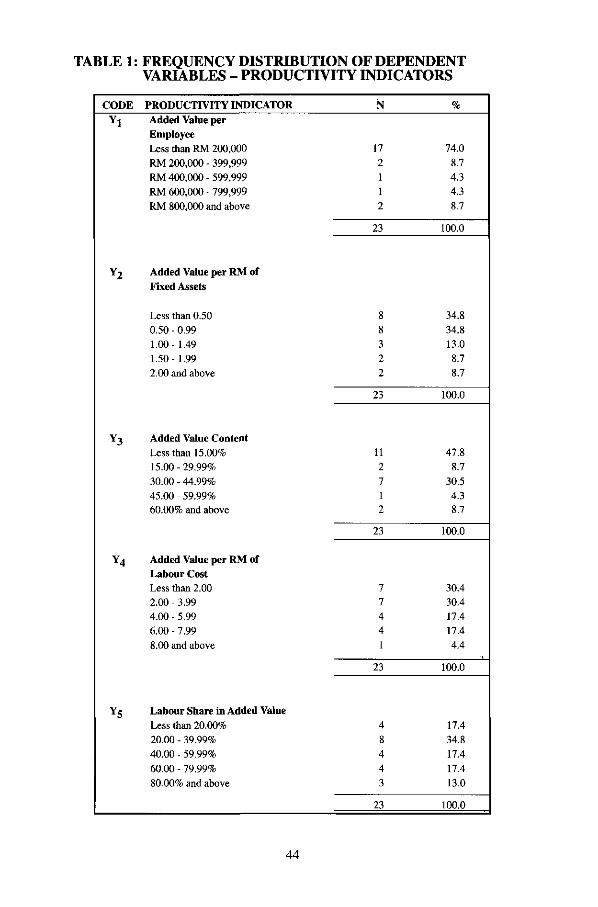
TABLE 1: FREQUENCY DISTRIBUTION OF DEPENDENTVARIABLES - PRODUCTIVITY INDICATORS
CODE PRODUCTIVITY INDICATORYj Added Value per
EmployeeLess than RM 200,000RM 200,000 - 399,999RM 400,000 - 599,999RM 600,000 - 799,999RM 800,000 and above
¥2 Added Value per RM ofFixed Assets
Less than 0.500.50 - 0.991.00- 1.491.50- 1.992.00 and above
Y3 Added Value ContentLess than 15.00%15.00-29.99%30.00 - 44.99%45.00 - 59.99%60.00% and above
Y4 Added Value per RM ofLabour CostLess than 2.002.00 - 3.994.00 - 5.996.00 - 7.998.00 and above
¥5 Labour Share in Added ValueLess than 20.00%20.00 - 39.99%40.00 - 59.99%60.00 - 79.99%80.00% and above
N
172112
23
88322
23
112712
23
77441
23
48443
23
%
74.08.74.34.38.7
100.0
34.834.813.08.78.7
100.0
47.88.7
30.54.38.7
100.0
30.430.417.417.44.4
100.0
17.434.817.417.413.0
100.0
44

As for added value content (¥3), 47.8 percent of the firmsrecorded a value of less than 15 percent. But 30.5 percent of thefirms registered a value of between 30.00 - 44.99 percent.
However, 60.8 percent of the firms achieved added value per RMof labour cost (¥4) of 3.99 and below and only 4.4 percentrecorded a value between 8.00 and above.
Finally, 17.4 percent of the firms registered labour share in addedvalue (¥5) of less than 20.00. Similarly, 17.4 percent of the firmsrecorded a value of between 40.00 - 59.99 percent and another17.4 percent indicated a value of between 60.00 - 79.99 percent.
Hence, the above data suggests that except for labour share inadded value which showed a more even distribution, theremaining productivity indicators' frequency distributionsexhibited different degree of skewness.
1.2 Frequency Distribution of Independent Variables1.2.1 Frequency Distribution of Technology Variables
Table 2 shows the frequency distributions for the followingtechnology variables: specialization (Xi), automation (Xz), labourrequirement (Xs), and cost of technology (X4), all of whichexhibited similar patterns of distribution with high percentagescores corresponding to the region of 5-7 scales.
TABLE 2: FREQUENCY DISTRIBUTION OF INDEPENDENTVARIABLES - TECHNOLOGY CHARACTERISTICS
CODE VARIABLE N %
Xj Specialization
1
2
34
56
Standardised
Fairly specialised
0
03
2
36
0
0
13.69.1
13.627.3
45

TABLE 2, CONT'D
789 Highly specialised
X2 Automation1 Mostly hand operated2345 Fairly automated6789 Highly automated
Xj Labour Requirement1 Low2345 Medium6789 High
X^ Cost of Technology1 Low2345 Medium6789 High
521
22*
012245611
22*
1022
106200
23
011238431
23
22.89.14.5
100.0
04.59.19.1
18.222.827.34.54.5
100.0
4.30
8.78.7
43.526.18.7
00
100.0
04.34.38.7
13.134.817.413.14.3
100.0
Missing Value
46

1.2.2 Frequency Distribution of Marketing Strategy VariablesTable 3 indicates the frequency distributions in terms of theemphasis of importance for the following marketing strategyvariables: price (X5), quality (Xg), reliable distribution (Xy), andbrand name and advertising (Xg), all of which showed similarpattern of distribution that is skewed towards higher degree ofimportance.
TABLE 3: FREQUENCY DISTRIBUTION OF INDEPENDENTVARIABLES - MARKETING STRATEGYCHARACTERISTICS
CODEXs
I23456789
Xg123456789
VARIABLEPriceUnimportant
Important
Most Important
QualityUnimportant
Important
Most Important
N
00000344
11
22*
00001002
19
22*
%
00000
13.618.218.250.0
100.0
0000
4.500
9.186.4
100.0
X7 Reliable Distribution
123456789
Unimportant
Important
Most Important
00002115
13
22*
0000
9.14.54.5
22.859.1
100.0
* Missing Value
47

TABLE 3, CONT'D
X8
123456789
Brand Name and Advertising
Unimportant
Important
Most Important
00103143
10
22*
00
4.50
13.64.5
18.213.645.6
100.0
1.2.3 Frequency Distribution of Management and OrganisationVariables
Table 4 shows the frequency distributions in terms of the degreeof importance for the variables pertaining to general problems inrelations to local employees. These variables are highabsenteeism (Xg), high turnover (X^)), lack of discipline (X^),and lack of efficiency (X^). with ^acn one showing differentpattern of distribution.
TABLE 4: FREQUENCY DISTRIBUTION OFINDEPENDENT VARIABLES - MANAGEMENTAND ORGANISATION CHARACTERISTICS
CODE
X9123456789
X10123
VARIABLE
High AbsenteeismUnimportant
Important
Most Important
High TurnoverUnimportant
N
222252413
23
102
%
8.78.78.78.7
21.78.7
17.54.3
13.0
100.0
4.30
8.7
* Missing Value
48
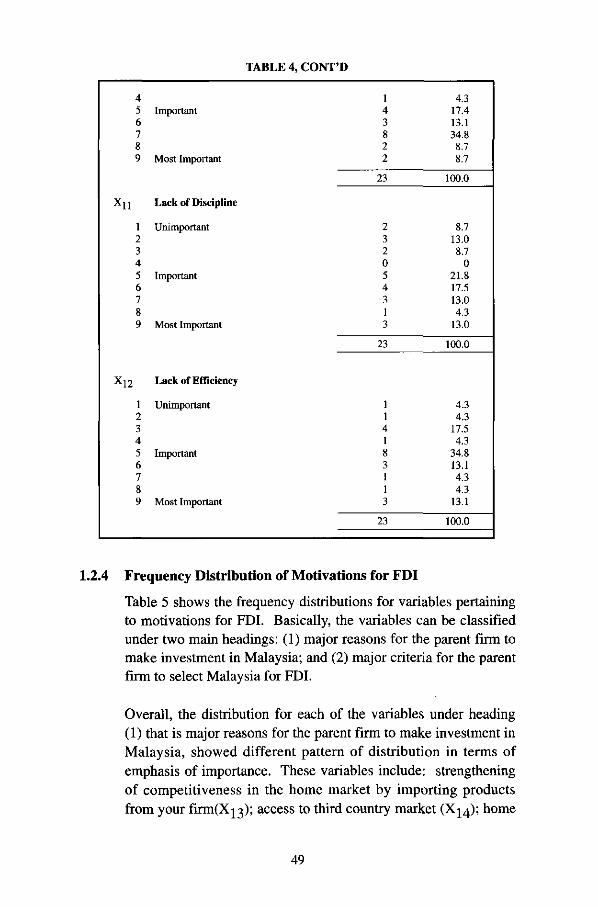
TABLE 4, CONT'D
456789
Xll
123456789
X12
123456789
Important
Most Important
Lack of Discipline
Unimportant
Important
Most Important
Lack of Efficiency
Unimportant
Important
Most Important
143822
23
232054313
23
114183113
23
4.317.413.134.88.78.7
100.0
8.713.08.7
021.817.513.04.3
13.0
100.0
4.34.3
17.54.3
34.813.14.34.3
13.1
100.0
1.2.4 Frequency Distribution of Motivations for FDI
Table 5 shows the frequency distributions for variables pertainingto motivations for FDI. Basically, the variables can be classifiedunder two main headings: (1) major reasons for the parent firm tomake investment in Malaysia; and (2) major criteria for the parentfirm to select Malaysia for FDI.
Overall, the distribution for each of the variables under heading(1) that is major reasons for the parent firm to make investment inMalaysia, showed different pattern of distribution in terms ofemphasis of importance. These variables include: strengtheningof competitiveness in the home market by importing productsfrom your firmtX^); access to third country market (X^); home
49

government incentives (X^); home government disincentives ingrowth restriction (Xjg); home government disincentives inenvironmental protection (X^); effective utilization of techno-managerial resource possessed by the parent firm (Xjg); export ofmachinery and capital (Xjg); small market at country of theparent firm (X2Q); and strengthening of capability to collectoverseas information
TABLE 5: FREQUENCY DISTRIBUTION OF INDEPENDENTVARIABLES - MOTIVATIONS FOR FDI
CODE
X13
123456789
X14123456789
Xl5123456789
VARIABLE
o Major Reasons for the Parent Firm toMake Investment in Malaysia
Strengthening of Competitiveness in the HomeMarket by Importing Products from Your FirmUnimportant
Important
Most Important
Access to Third Country MarketUnimportant
Important
Most Important
Home Government IncentivesUnimportant
Important
Most Important
N
415142222
23
404231144
23
205213523
23
%
17443
21743
17587878787
1000
1740
17487
1314343
174174
1000
870
2178743
13121787
131
1000
50

TABLE 5, CONT'D
CODEx16
123456789
xi?
123456789
X18
123456789
x19
123456789
VARIABLE
Home Government Disincentives in GrowthRestriction
Unimportant
Important
Most Important
Home Government Disincentiveshi Environmental ProtectionUnimportant
Important
Most Important
Effective Utilization of Techno-managerialResource Possessed by the Parent Firm
Unimportant
Important
Most Important
Export of Machinery and Capital
Unimportant
Important
Most Important
N
238330121
23
238141102
22*
012194131
22*
335451010
22*
%
8.813.034.813.013.0
04.38.84.3
100.0
9.113.636.54.5
18.24.54.5
09.1
100.0
04.59.14.5
40.918.34.5
13.74.5
100.0
13.613.622.718.222.74.6
04.6
0100.0
* Missing Value
51

TABLE 5, CONT'D
CODE
X20
123456789
X21
123456789
X22
123456789
X23123456789
VARIABLE
Small Market at Country of theParent FirmUnimportant
Important
Most Important
Strengthening of Capability to CollectOverseas Information
Unimportant
Important
Most Important
o Major Criteria for the ParentFirm to Select Malaysia for FDIProtection of Existing Market
Unimportant
Important
Most Important
Diversification of Political RiskUnimportant
Important
Most Important
N
538031210
23
413452211
23
102633224
23
403234313
23
%
21.813.034.9
013.04.38.74.3
0
100.0
17.54.3
13.017.521.78.78.74.34.3
100.0
4.40
8.726.113.013.08.78.7
17.4
100.0
17.40
13.08.8
13.017.413.04.4
13.0
100.0
52

TABLE 5, CONT'D
CODE
X24
123456789
X25123456789
X26123456789
X271234567S9
VARIABLE
Diversification of Economicand Financial RiskUnimportant
Important
Most Important
Circumvention of Tariffs and QuotasUnimportant
Important
Most Important
Host Government Investment IncentivesUnimportant
Important
Most Important
High Local ReturnsUnimportant
Important
Most Important
N
211143424
22*
512433311
23
000025745
23
203126422
22*
%
9.14.54.54.5
18.213.718.29.1
18.2
100.0
21.74.48.7
17.413.013.013.04.44.4
100.0
0000
8.721.730.517.421.7
100.0
9.10
13.64.59.1
27.318.29.19.1
100.0
* Missing Value
53

TABLE 5, CONT'D
CODE
X28123456789
X29123456789
X30
123456789
X3I
1234567S9
VARIABLE
Ethnic Ties with Local PartnerUnimportant
Important
Most Important
Access to Raw MaterialsUnimportant
Important
Most Important
Availability of Low Cost butRelatively High Quality of LabourUnimportant
Important
Most Important
Good Infrastructure such asTransport, Communication, Banking etc.Unimportant
Important
Most Important
N
813342000
21*
312264212
23
000132
1025
23
000022
1315
23
%
38.14.8
14.314.319.09.5
000
100.0
13.04.3878.7
26.217.48.74.38.7
100.0
000
4.313.087
43.68.7
21.7
100.0
0000
8.787
56.64.3
21.7
100.0
* Missing Value
54

TABLE 5, CONT'D
CODE
X32123456789
X33
123456789
X34
123456789
VARIABLE
Geographical LocationUnimportant
Important
Most Important
Prompt Decision Making by theHost GovernmentUnimportant
Important
Most Important
Exposure and Access to NewSophisticated Technologies
Unimportant
Important
Most Important
N
011213636
23
003146405
23
126241214
23
%
04.34.38.74.3
13.026.213.026.2
100.0
00
13.04.3
17.426.217.4
021.7
100.0
4.38.7
26.28.7
17.44.38.74.3
17.4
100.0
Similarly, the frequency distribution for each of the variablesunder heading (2) that is major criteria for parent firm to selectMalaysia for FDI showed different pattern of distribution in termsof emphasis of importance. These variables are: protection ofexisting market (X2z); diversification of political risk (X23>;diversification of economic and financial risk (Xz4);circumvention of tariffs and quotas (Xis); host government
55

investment incentives (Xie); high local returns (Xi?); ethnic tieswith local partner (X^); access to raw materials (Xzg); availabilityof low cost but relatively high quality of labour (Xso); goodinfrastructure such as transport, communication, banking etc.(Xsi); geographical location (Xai); prompt decision making by thehost government (Xas); and exposure and access to newsophisticated technologies (X.^).
1.2.5 Frequency Distribution of Host Government Policy Variables
Table 6 indicates the frequency distributions for each of thevariables pertaining to host government policy. The scores for theimposition of restriction (Xss), and the scores for the provision ofincentives (Xx>), showed similar pattern of skewness that isskewed to lower scores.
TABLE 6: FREQUENCY DISTRIBUTION OF INDEPENDENTVARIABLES - HOST GOVERNMENT POLICY
CODE
*351234
X361234
VARIABLE
Imposition of RestrictionScoreScoresScoresScores
Provision of IncentivesScoreScoresScoresScores
N
8211
12*
8942
23
%
66.716.78.38.3
100.0
34.839.117.48.7
100.0
1.3 Tests of Significant Difference Results
Another important set of findings relates to the results of tests ofsignificant difference by types of industry (electronic andelectrical products vs non-electronic and electrical products)! ,nationality of parent firm (Japanese vs non-Japanese), and presentownership (wholly-owned vs joint venture). However, except for
Missing ValueHenceforth, the types of industry wil be referred to as electronic and non-electronic industry inthe subsequent analysis of the findings. 56

nationality of parent firm, the results show that there aresignificant difference by types of industry and present ownershipin terms of productivity and characteristics of FDI firms.
1.3.1 Significant Difference by Types of Industry
Table 7 shows there is significant difference (based on observedvalues of Z of Mann-Whitney's test) for electronic and non-electronic industry in added value per employee (Yi); labourshare in added valuefYs); specialization (Xi);strengthening ofcompetitiveness in the home market by importing product fromyour firm (Xn); and ethnic ties with local partner (X2g).
TABLE 7: SIGNIFICANT DIFFERENCERESULTS BY TYPES OF INDUSTRY
Code
Y.
V5
X!
X13
X28
Variable
Added Value perEmployee
Labour Share in Added Value
Specialization
Strengthening of Competitivenessin the Home Market by ImportingProduct from Your Firm
Ethnic Ties with Local Partner
Electronic(N-16)
Mean Rank
10.06
14.50
13.83
13.84
8.25
Non-Electronic(N=7)
Mean Rank
16.43
6.29
6.50
7.79
16.50
ObservedValuesofZ
(P<0.05)
-2.0713
- 2.6753
-2.5137
- 1.9928
- 2.9734
1.3.2 Significant Difference by Present Ownership
Table 8 indicates that there is significant difference for wholly-owned firms and joint ventures in labour share in added value(Ys), specialization (Xi),high turnover (Xio), strengthening ofcompetitiveness in the home market by importing product fromyour firm(Xi3), and ethnic ties with local partner (X2g).
57

TABLE 8: DIFFERENCE RESULTS BY PRESENT OWNERSHIP
Code
Y,
Xi
X10
xn
X28
Variable
Labour Share inAdded Value
Specialization
High Turnover
Strengthening of Competitivenessin the Home Market by ImportingProduct from Your Firm
Ethnic Ties with Local Partner
Wholly -Owned(N=12)
Mean Rank
14.88
15.23
15.54
16.00
6.95
Joint Venture
Mean Rank
8.86
7.77
8.14
7.64
15.45
ObservedValuesofZ
(P<0.05)
-2.1254
-2.7431
-2.6835
-2.9868
-3.2440
1.4 Significant Correlations between Productivity andCharacteristics of FDI Firms
1.4.1 Added Value per Employee
The independent variables that were significantly correlated1 withadded value per employee (Yi) for the overall sample (N=23)include high absenteeism, high turnover, lack of discipline, lackof efficiency, export of machinery and capital, small market at thecountry of the parent firm, strengthening of capability to collectoverseas information, circumvention of tariffs and quotas, highlocal returns, and ethnic ties with local partner.
However, four of the above variables showed negativecorrelations with added value per employee. These include highabsenteeism, X? (r = -.50); high turnover, Xw (r = -.60); lack ofdiscipline, Xn (r = -.48); and lack of efficiency, Xiz (r = - .48). Onthe other hand, the variables that showed positive correlationswith added value per employee are export of machinery andcapital, X» (r = .47); small market at country of the parent firm,Xso (r = .45); strengthening of capability to collect overseasinformation, Xzi (r = .47); circumvention of tariffs and quotas, Xis(r = .49); high local returns, X2? (r = .44); and ethnic ties withlocal partner, Xis (r = .48).
All correlations discussed in this section are significant atp<0.05.
58

Difference in Types of Industry: When the types of industry washeld constant, it was found that there were four significantpositive correlations for added value per employee for theelectronic industry (N=16). These include automation, Xi (r =.56); cost of technology, X4 (r = .55); strengthening of capabilityto collect overseas information, X2i (r = .54); and circumventionof tariffs and quotas, Xzs (r = .67). However, the last twoindependent variables that is strengthening of capability to collectoverseas information (X2i), and circumvention of tariffs andquotas (Xzs) were also significantly correlated with added valueper employee in the overall sample.
As for the non-electronic industry (N=7), it was found that therewere two significant correlations for added value per employeethat is quality, Xe (r = .76) which showed positive correlation; andhigh absenteeism, X9 (r = -.76) which indicated negativecorrelation. The variable of high absenteeism (X?) was alsosignificantly correlated with added value per employee in theoverall sample.
Difference in Nationality of Parent Firm: When the nationalityof parent firm was held constant, this study shows there were sixsignificant correlations for added value per employee for Japanesefirms (N=10). These include automation, X2 (r = .83); cost oftechnology, X* (r = .65); brand name and advertising, Xs (r = .80);small market at country of parent firm, Xso (r = .72); andcircumvention of tariffs and quotas, X25 (r = .68); all of whichshowed positive correlations. However, the only negativecorrelation is high turnover, Xio (r = -.64). Besides, the variablesof small market at the country of parent firm (X2o), circumventionof tariffs and quotas (Xis), and high turnover (Xio) were alsosignificantly correlated with added value per employee in theoverall sample.
For non-Japanese firms (N=13), this study indicates there werefour significant correlations for added value per employee. Theseinclude high absenteeism, X9 (r = -.70); high turnover, Xio (r = -.63); lack of discipline, Xn (r = -.61); all of which showednegative correlations; and export of machinery and capital, X» (r= .61) which showed positive correlation. Incidentally, all thefour mentioned variables were also significantly correlated withadded value per employee in the overall sample.
59
Difference in Present Ownership: When the present ownershipwas held constant, it was found that there were four significantpositive correlations for added value per employee for wholly-owned firms (N=12). These include access to third countrymarket, Xw (r = .58); small market at country of parent firm, X2o (r= .67); diversification of political risk, Xis (r = .61); andcircumvention of tariffs and quotas, X:s (r = .65). However, thevariables of small market at country of parent firm (X»), andcircumvention of tariffs and quotas (Xa) were also significantlycorrelated with added value per employee in the overall sample.
In terms of joint ventures (N=ll), this study indicates that therewere three significant negative correlations for added value peremployee. They are high absenteeism, X9 (r = -.77); lack ofdiscipline, Xn (r = -.69); and lack of efficiency, Xiz (r = -.74). Allthese three variables were also significantly correlated with addedvalue per employee in the overall sample.
1.4.2 Added Value per RM of Fixed AssetsThe significant correlations for added value per RM of fixedassets (Yz) for the overall sample (N=23) include strengthening ofcapability to collect overseas information, Xai (r = .47);diversification of political risk, Xi3 (r = .47); and goodinfrastructure such as transport, communication, banking etc, XM(r = .45); all of which showed positive correlations.
Difference in T^pes of Industry: When the type of industry washeld constant, it was found that there were four significantpositive correlations for added value per RM of fixed assets in theelectronic industry (N=16). These include reliable distribution,X? (r=.67); strengthening of capability to collect overseasinformation, Xzi (r = .56); good infrastructure such as transport,communication, banking etc, Xsi (r = .67); and prompt decisionmaking by host government, XM (r = .65). Of these, the variablesof strengthening of capability to collect overseas information(Xzi), and good infrastructure such as transport, communication,banking etc (Xai) were also significantly correlated with addedvalue per RM of fixed assets in the overall sample.
However, this study shows there were no significant correlationsfor added value per RM of fixed assets for non-electronic industry(N=7).
60

Difference in Nationality of Parent Firm: When the nationalityof the parent was held constant, this study indicates that therewere no significant correlations for added value per RM of fixedassets for Japanese firms (N=10).
Nevertheless, it was found that there were two significantnegative correlations for added value per RM of fixed assets fornon-Japanese firms (N=13). These include high absenteeism, Xo(r = -.60); and high turnover, Xio (r = -.57).
Difference in Present Ownership: When the present ownershipwas held constant, it was found that there were twelve significantpositive correlations for added value per RM of fixed assets forwholly-owned firms (N=12). These include home governmentincentives, X» (r = .59); effective utilization of techno-managerialresource possessed by parent firm, Xis (r = .61); strengthening ofcapability to collect overseas information, Xai (r = .75);diversification of political risk, Xia (r = .58); diversification ofeconomic and financial risk, X24 (r = .65); home governmentinvestment incentives, X26 (r = .65); availability of low cost butrelatively high quality of labour, Xso (r = .70); good infrastructuresuch as transport, communication, banking etc, Xai (r = .67);geographical location, Xv (r = .61); prompt decision making byhost government, Xss (r = .83); exposure and access to newsophisticated technologies, Xs4 (r = .64); and provision ofincentives, X36 (r = .60). Of these, the variables of strengtheningof capability to collect overseas information QGi), diversificationof political risk (Xw), and good infrastructure such as transport,communication, banking etc. (Xsi) were also significantlycorrelated with added value per RM of fixed assets in the overallsample.
In the case of joint ventures (N=ll), this study shows that therewas only one significant positive correlation for added value perRM of fixed assets that is diversification of political risk, X23 (r =.61) . This variable was also significantly correlated with addedvalue per RM of fixed assets in the overall sample.
1.4.3 Added Value ContentThis research shows that there were three significant correlationsfor added value content (Ys) in the overall sample (N=23). Theyare high turnover, Xio (r = -.60) which showed negativecorrelation; and export of machinery and capital, Xw (r = .56); and
61
small market at country of the parent firm, X2o (r = .54); both ofwhich showed positive correlations.
Difference in Types of Industry: When the types of industry washeld constant, it was found that there were two significantpositive correlations for added value content for the electronicindustry (N=16). These include small market at country of theparent firm, Xzo (r = .66); and strengthening of capability tocollect overseas information, Xzi (r = .52). However, the variableof small market at country of parent firm (X:o) was alsosignificantly correlated with added value content in the overallsample.
In terms of non-electronic industry (N=7), this research indicatesthat there were three significant correlations for added valuecontent. The negative correlations are high turnover, Xio (r = -.95); and home government incentives, Xis (r = -.80). Whereas,the positive correlation is to high local returns, Xs? (r = .90).Moreover, the variable of high local returns (X2v) was alsosignificantly correlated with added value content in the overallsample.
Difference in Nationality of Parent Firm: When the nationalityof parent firm was held constant, it was found that there were foursignificant correlations for added value content for Japanese firms(N=10). These include quality, Xo (r = -.80) which showednegative correlation; and home government disincentives inenvironmental protection, Xn (r = .74); export of machinery andcapital, XIB (r = .68); and small market at country of the parentfirm, Xio (r = .84); whereby all three showed positive correlations.Besides, the variables of export of machinery and capital (X»)and small market at country of the parent firm (Xio) were alsosignificantly correlated with added value content in the overallsample.
However, this research shows that there were two significantnegative correlations for added value content for non-Japanesefirms (N=13). They are high absenteeism, X? (r = -.64); and highturnover, Xio (r = -.69). The variable of high turnover (Xn) wasalso significantly correlated with added value content in theoverall sample.
62
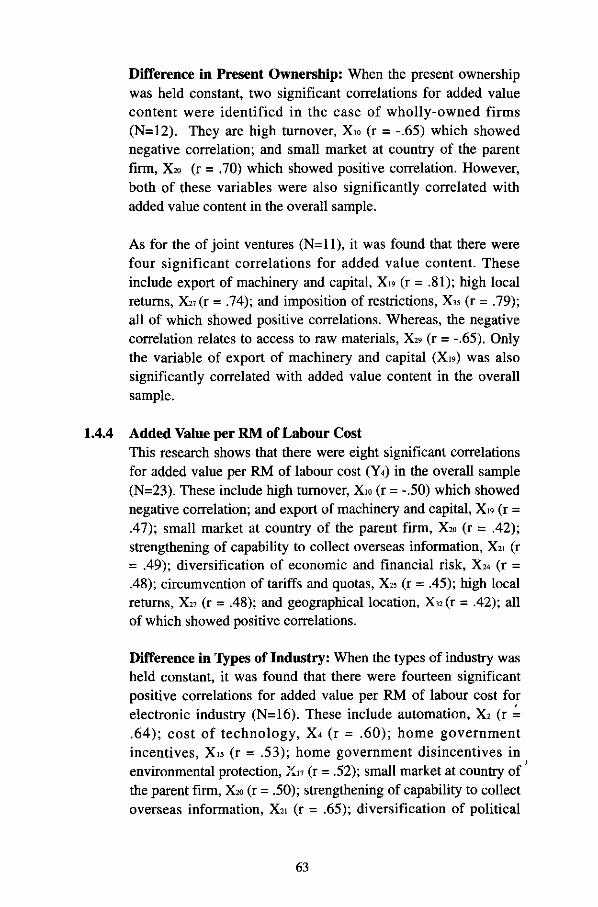
Difference in Present Ownership: When the present ownershipwas held constant, two significant correlations for added valuecontent were identified in the case of wholly-owned firms(N=12). They are high turnover, Xio (r = -.65) which showednegative correlation; and small market at country of the parentfirm, Xzo (r = .70) which showed positive correlation. However,both of these variables were also significantly correlated withadded value content in the overall sample.
As for the of joint ventures (N=ll), it was found that there werefour significant correlations for added value content. Theseinclude export of machinery and capital, Xw (r = .81); high localreturns, Xz7(r = .74); and imposition of restrictions, X35 (r = .79);all of which showed positive correlations. Whereas, the negativecorrelation relates to access to raw materials, Xz9 (r = -.65). Onlythe variable of export of machinery and capital (Xig) was alsosignificantly correlated with added value content in the overallsample.
1.4.4 Added Value per RM of Labour CostThis research shows that there were eight significant correlationsfor added value per RM of labour cost (¥4) in the overall sample(N=23). These include high turnover, Xio (r = -.50) which showednegative correlation; and export of machinery and capital, X« (r =.47); small market at country of the parent firm, Xio (r = .42);strengthening of capability to collect overseas information, Xzi (r= .49); diversification of economic and financial risk, Xz* (r =.48); circumvention of tariffs and quotas, X25 (r = .45); high localreturns, Xz? (r = .48); and geographical location, XV(T = .42); allof which showed positive correlations.
Difference in "types of Industry: When the types of industry washeld constant, it was found that there were fourteen significantpositive correlations for added value per RM of labour cost forelectronic industry (N=16). These include automation, Xz (r =.64); cost of technology, X* (r = .60); home governmentincentives, X« (r = .53); home government disincentives inenvironmental protection, Xn (r = .52); small market at country ofthe parent firm, Xzo (r = .50); strengthening of capability to collectoverseas information, Xzi (r = .65); diversification of political
63
risk, X2s(r = .51); diversification of economic and financial risk,X24 (r = .62); circumvention of tariffs and quotas, Xz5 (r = .65);availability of low cost but relatively high quality of labour, Xso (r= .54); good infrastructure such as transport, communication,banking etc, Xsi (r = .53); geographical location, X32 (r = .57);prompt decision making by the host government, XB (r = .64);and provision of incentives, Xas (r = .57). Of these, the variablesof small market at country of the parent firm (X»), strengtheningof capability to collect overseas information (Xn), diversificationof economic and financial risk (Xw), circumvention of tariffs andquotas (X2s), and geographical location (Xaz) were alsosignificantly correlated with added value per RM of labour cost.In terms of non-electronic industry (N=7), this study shows thatthere was only one significant positive correlation for added valueper RM of labour cost that is specialization, Xi (r = .81).
Difference in Nationality of Parent Firm: When nationality ofparent firm was held constant, this research indicates there weresix significant positive correlations for added value per RM oflabour cost for Japanese firms (N=10). These include automation,Xz (r = .70); brand name and advertising, Xs (r = .76); homegovernment disincentives in environmental protection, Xn (r =.70); small market at country of the parent firm, Xzo (r =.74)circumvention of tariffs and quotas, Xzs (r = .72); and highlocal returns, Xn (r = .78). Of these, the variables of small marketat country of the parent firm (X»), circumvention of tariff andquotas (Xzs), and high local returns (Xz?) were also significantlycorrelated with added value per RM of labour cost in the overallsample.
As for the non-Japanese firms (N=13), it was found that therewere two significant negative correlations for added value perRM of labour cost. They are high absenteeism, X9 (r = - .73); andhigh turnover, Xio (r = -.62). However, the variable of highturnover (Xio) was also significantly correlated with added valueper RM of labour cost in the overall sample.
Difference in Present Ownership: When the present ownershipwas held constant, it was found that there were eleven significantpositive correlations for added value per RM of labour cost forwholly-owned firms (N=12). These include cost of technology,
64

XA (r = .62); brand name and advertising, Xs (r = .79); access tothird country market, Xu (r = .65); home governmentdisincentives in environmental protection, Xn (r = .64); smallmarket at country of the parent firm, X2o (r = .68); strengtheningof capability to collect overseas information, Xzi (r = .67);diversification of political risk, X:s (r = .80); diversification ofeconomic and financial risk, X24 (r = .78); circumvention of tariffsand quotas, Xzs (r = .65); high local returns, Xj? (r = .59); andprompt decision making by the host government, XB (r = .66). Inaddition, the variables of small market at the country of the parentfirm (X2o), strengthening of capability to collect overseasinformation (Xzi), diversification of economic and financial risk(X24), circumvention of tariffs and quotas (X2s), and high localreturns (X2?) were also significantly correlated with added valueper RM of labour cost in the overall sample.
However, the research shows that there were no significantcorrelations for added value per RM of labour cost for jointventures (N=ll).
1.4.5 Labour Share in Added Value
This research shows that there were four significant correlationsfor labour share in added value (Ys) in the overall sample (N=23).These include high absenteeism, X9 (r = .43); and high turnover,Xio (r = .48), both of which showed positive correlations; whereasstrengthening of capability to collect overseas information, Xn (r= -.46); and ethnic ties with local partner, X2s (r = -.60) showednegative correlations.
Difference in Types of Industry: When the types of industry washeld constant, it was found that there were two significantcorrelations for labour share in added value for electronic industry(N=16). These include cost of technology, X* (r = .54) whichshowed positive correlation; and prompt decision making by thehost government, Xss (r = -.50) which showed negativecorrelation.
As for the non-electronic industry (N=7), this research shows thatthere was only one significant negative correlation for labourshare in added value that is specialization, Xi (r = -.87).
65
Difference in Nationality of Parent Firm: When the nationalityof parent firm was held constant, it was found that there was onlyone significant positive correlation for labour share in addedvalue for Japanese firms (N=10) that is strengthening ofcompetitiveness in the home market by importing products fromyour firm, Xi3 (r = .72).
However, this study shows that there were three significantcorrelations for labour share in added value among non-Japanesefirms (N=13). These include high absenteeism, X9 (r = .68) whichshowed positive correlation, whereas the negative correlations arestrengthening of capability to collect overseas information, Xii (r= -.60); and geographical location, X32 (r = -.58). The variablesfor high absenteeism (Xg) and strengthening of capability tocollect overseas information (Xii) were also significantlycorrelated with labour share in added value in the overall sample.
Difference in Present Ownership: When the present ownershipwas held constant, this research shows there were no significantcorrelations for labour share in added value for wholly-ownedfirms (N= 12).
Nevertheless, the study indicates that there was only onesignificant negative correlation for labour share in added value forthe sample of joint ventures (N=ll), that is geographical location,X32 (r = -.63).
1.5 Interpretations of Correlation Findings
Added Value per Employee: This study suggests that FDI firmsfrom developed countries (DCs) that registered higher addedvalue per employee or labour productivity tend to showunimportance to high absenteeism, high turnover, lack ofdiscipline, and lack of efficiency as general problems pertainingto local employees. Besides, these firms accorded greaterimportance to the major reasons for the parent firm to invest inMalaysia such as export of machinery and capital, small market atcountry of the parent firm, and strengthening of capability tocollect overseas information. Finally, these firms attached higherdegree of importance to high local returns, and ethnic ties with
66

local partner as criteria for the parent firm to select Malaysia forFT1TFDI.
Furthermore, FDI firms in the electronic industry that recordedhigher added value per employee tend to use more automatedtechnology and incurred higher cost of technology. Also, thesefirms attached greater importance to strengthening of capability tocollect overseas information as a major reason for the parent firmto invest in Malaysia as well as circumvention of tariffs andquotas as a criterion for the parent firm to select Malaysia forFDI.
On the other hand, FDI firms in the non-electronic industry thatregistered higher added value per employee tend to exhibitunimportance to high absenteeism as a general problempertaining to local employees. However, these firms stressedmore on the importance of quality in their marketing strategy.
Next, Japanese FDI firms that recorded higher added value peremployee tend to accord unimportance to high turnover as ageneral problem pertaining to local employees. Also these firmsused more automated technology and incurred higher cost oftechnology besides attaching greater importance to brand nameand advertising in their marketing strategy. Moreover, these firmsstressed more on the importance of small market at country of theparent firm as a major reason for the parent firm to invest inMalaysia as well as circumvention of tariffs and quotas as acriterion for the parent firm to select Malaysia for FDI.
However, non-Japanese FDI firms that achieved higher addedvalue per employee tend to show unimportance to highabsenteeism, high turnover, and lack of discipline as generalproblems pertaining to local employees. Nevertheless, thesefirms accorded greater importance to export of machinery andcapital as a major reason for parent firm to invest in Malaysia.
Besides, wholly-owned FDI firms that recorded higher addedvalue per employee tend to attach greater importance to access tothird country market, and small market at country of the parentfirm as major reasons for the parent firm to invest in Malaysia.
67

Furthermore, these firms also attached greater importance todiversification of political risk, and circumvention of tariffs andquotas as criteria for parent firm to select Malaysia for FDL
Finally, joint venture FDI firms that registered higher added valueper employee tend to exhibit unimportance to high absenteeism,lack of discipline, and lack of efficiency as general problemspertaining to local employees.
Added Value per RM of Fixed Assets: The findings suggest thatFDI firms from DCs that achieved higher added value per RM offixed assets or capital productivity tend to stress more on theimportance of strengthening of capability to collect overseasinformation as a major reason for the parent firm to invest inMalaysia. These firms also exhibited higher degree of importancefor diversification of political risk, and good infrastructure suchas transport, communication, banking etc. as criteria for parentfirm to select Malaysia for FDI.
However, FDI firms in the electronic industry that registeredhigher added value per RM of fixed assets tend to stress more onthe importance of reliable distribution in their marketing strategy.Also, these firms showed higher degree of importance ofstrengthening of capability to collect overseas information as amajor reason for the parent firm to invest in Malaysia. Finally,these firms also attached greater importance to the criteria for theparent firm to select Malaysia for FDI like good infrastructuresuch as transport, communication, banking etc. as well as promptdecision making by host government.
Whilst. non-Japanese FDI firms that recorded higher added valueper RM of fixed assets tend to indicate unimportance to highabsenteeism, and high turnover as general problems related tolocal employees.
Furthermore, the findings suggest that wholly-owned FDI firmsthat achieved higher added value per RM of fixed assets tend toattach greater importance to home government incentives,effective utilization of techno-managerial resource, andstrengthening of capability to collect overseas information as
68

major reasons for parent firms to make investment in Malaysia.Besides, these firms attached greater importance to the criteriafor the parent firm to select Malaysia for FDI which includediversification of political risk, diversification of economic andfinancial risk, host government investment incentives, availabilityof low cost but relatively high quality of labour, goodinfrastructure such as transport, communication, banking etc,geographical location, prompt decision making by hostgovernment, and exposure and access to new sophisticatedtechnologies. Finally, these firms were provided with moreinvestment incentives by our government.
Lastly, joint ventures FDI firms that recorded higher added valueper RM of fixed assets stressed more on the importance ofdiversification of political risk as the criterion for parent firm toselect Malaysia for FDI.
Added Value Content: This research suggests that FDI firmsfrom DCs that recorded higher added value content tend to showunimportance to high turnover as a general problem pertaining tolocal employees. However, these firms accorded greaterimportance to export of machinery and capital as well as smallmarket at country of the parent firm as major reasons for parentfirm to invest in Malaysia.
Moreover, FDI firms in the electronic industry that registeredhigher added value content tend to accord higher degree ofimportance to small market at country of the parent firm, andstrengthening of capability to collect overseas information asmajor reasons for the parent firm to invest in Malaysia.
However, FDI firms in the non-electronic industry that recordedhigher added value content tend to exhibit unimportance to highturnover as a general problem pertaining to local employees.Also, these firms stressed less on the importance of homegovernment incentives as a major reason for the parent firm toinvest in Malaysia. Nevertheless, these firms attached greaterimportance to high local returns as a criterion for the parent firmto select Malaysia for FDI.
69
Furthermore, Japanese FDI firms that recorded higher addedvalue content tend to emphasise less on quality in their marketingstrategy. But, these firms exhibited higher degree of importanceon home government disincentives in environmental protection,export of machinery and capital, and small market at country ofthe parent firm as major reasons for the parent firm to makeinvestment in Malaysia.
On the other hand, non-Japanese FDI firms that achieved higheradded value content tend to indicate unimportance to highabsenteeism, and high turnover as general problems pertaining tolocal employees.
Morever, wholly-owned FDI firms that achieved higher addedvalue content tend to show unimportance to high turnover as ageneral problem pertaining to local employees. Also, these firmsattached greater importance to small market at country of theparent firm as a major reason for parent firm to invest inMalaysia.
Finally, joint ventures FDI firms that registered higher addedvalue content tend to accord greater importance to export ofmachinery and capital as a major reason for parent firm to investin Malaysia as well as high local returns as a criterion for parentfirm to select Malaysia for FDI. On the other hand, these firmsstressed less on the importance of access to raw materials as acriterion for parent firm to select Malaysia for FDI. Finally, thesefirms tend to face more import restrictions.
Added Value per RM of Labour Cost: The findings suggest thatFDI firms from DCs that achieved higher added value per RM oflabour cost or labour cost competitiveness tend to showunimportance to high turnover as a general problem pertaining tolocal employees. They, however, attached greater importance tothe major reasons for the parent firm to invest in Malaysia such asexport of machinery and capital, small market at country of theparent firm, and strengthening of capability to collect overseasinformation. Also, these firms emphasised more on theimportance of the criteria for the parent firm to select Malaysiafor FDI which include diversification of economic and financial
70

risk, circumvention of tariffs and quotas, high local returns, andgeographical location.
Next, FDI firms in the electronic industry that recorded higheradded value per RM of labour cost tend to use more automatedtechnology and incurred higher cost of technology. Besides,these firms accorded greater importance to home governmentincentives, home government disincentives in environmentalprotection, small market at country of the parent firm, andstrengthening of capability to collect overseas information asmajor reasons for the parent firm to invest in Malaysia. Also,these firms attached greater importance to the criteria for theparent firm to select Malaysia for FDI which includediversification of political risk, diversification ofeconomic and financial risk, circumvention of tariffs and quotas,availability of low cost but relatively high quality of labour, goodinfrastructure such as transport, communication, banking etc,geographical location, and prompt decision making by the hostgovernment. Finally, these firms were provided with moreincentives by our government.
However, FDI firms in the non-electronic industry that achievedhigher added value per RM of labour cost tend to be highlyspecialised in the use of technology.
Whereas, Japanese FDI firms, that recorded higher added valueper RM of labour cost tend to use more automated technology aswell as emphasised more on the importance of brand name andadvertising in their marketing strategy. Furthermore, these firmsstressed more on the importance of the major reasons for theparent firm to invest in Malaysia such as home governmentdisincentives in environmental protection, and small market atcountry of the parent firm. Finally, these firms attached greaterimportance to circumvention of tariffs and quotas, and high localreturns as criteria for parent firms to select Malaysia for FDI.
On the other hand, the non-Japanese FDI firms that achievedhigher added value per RM of labour cost tend to showunimportance to high absenteeism, and high turnover as generalproblems related to local employees.
71

In the case of wholly-owned FDI firms that recorded higheradded value per RM of labour cost, they tend to incur higher costof technology and emphasised more on the importance of brandname and advertising in their marketing strategy. Moreover, thesefirms attached greater importance to the major reasons for parentfirms to invest in Malaysia such as access to third country market,home government disincentives in environmental protection,small market at country of the parent firm, and strengthening ofcapability to collect overseas information. Finally, these firmsalso emphasised more on the importance of the criteria for theparent firm to select Malaysia for FDI which includediversification of political risk, diversification of economic andfinancial risk, circumvention of tariffs and quotas, high loc^lreturns, and prompt decision making by the host government.
Labour Share in Added Value: This study suggests that FDIfirms from DCs that recorded lower labour share in added valuetend to attach unimportance to high absenteeism, and highturnover as general problems pertaining to local employees. But,these firms accorded greater importance to strengthening ofcapability to collect overseas information as a major reason forthe parent firm to invest in Malaysia. However, these firms alsoattached greater importance to ethnic ties with local partner as acriterion for the parent firm to select Malaysia for FDI.
Furthermore, FDI firms in the electronic industry, that achievedlower labour share in added value tend to incur lower cost oftechnology. In addition, these firms attached greater importanceto prompt decision making by the host government as a criterionfor the parent firm to select Malaysia for FDI.
However, firms in the non-electronic industry that registeredlower labour share in added value tend to be highly specialised intheir use of technology.
In addition, Japanese FDI firms that recorded lower labour sharein added value tend to attach less importance to strengthening ofcompetitiveness in the home market by importing products fromyour firm as a major reason for parent firm to make investment inMalaysia.
Please note that in this study lower labour share in added value indicates better utilization of labour.
72
Whilst, non-Japanese FDI firms that registered lower labour sharein added value tend to show unimportance to high absenteeism asa general problem related to local employees. Also, these firmsattached greater importance to strengthening of capability tocollect overseas information as a major reason for the parent firmto invest in Malaysia as well as geographical location as acriterion for the parent firm to select Malaysia for FDI.
Lastly, joint venture FDI firms that recorded lower labour sharein added value tend to attach greater importance to geographicallocation as a criterion for the parent firm to select Malaysia forFDI.
2.0 IMPLICATIONS OF THE STUDYEssentially, this study generates two critical implications onimproving productivity among FDI firms from developedcountries (DCs) in the electronic and electrical, basic metal, andchemical and chemical products industries. Of criticalimportance, the following implicators should be viewed inperspective line with the government emphasis on productivity-driven growth strategy as a complement to investment drivengrowth.
(i) Generally, the productivity of FDI firms from DCs in thisstudy is not hampered by problems of high absenteeism,high turnover, lack of discipline, and lack of efficiency thatare related to local employees. Thus, this positive workethics that prevail among Malaysian workforce willcontinue to ensure the qualitative improvement inproductivity or total factor productivity (TFP) which isessential for sustaining economic growth in this era ofincreasing global competition; and
(ii) To improve productivity among FDI firms from DCs, ourgovernment should pay particular attention to the factorsthat motivate the influx of FDI since this study indicatesmany significant relationships between productivity and themotivational factors which are grouped under the majorreasons and criteria for parent firms to make investment in
73

Malaysia. This implies that as host government, Malaysiashould continue to create more favourable investmentclimate through developing more attractive incentivepackages as well as sustaining political, economic andfinancial stability and further modernising our localinfrastructure to meet the needs of investors for high returnon investment.
74

BIODATA
Dr. Phang Siew Nooi is currently an Associate Professor in the PublicAdministration Division, Faculty of Economics & Administration, at theUniversity of Malaya.
She obtained her doctorate degree from University of Birmingham,United Kingdom, in the field of Local Government. She specialised inUrbanisation and local Government Management.
She has written several articles in this area. She has also written a bookon 'Sistem Kerajaan Tempatan di Malaysia' (Local Government Systemin Malaysia) published by DBP.
76

FUTURE DEVELOPMENT IN LOCALGOVERNMENT THROUGH STRATEGIC
MANAGEMENT
Phang Siew NooiFaculty of Economic & Administration
University of Malaya
INTRODUCTIONLocal government has been described as a stable set of institutions withestablished functions and a fixed structure. Contemporary localgovernment functions include formal duties, administrative structures andrelevant powers which are important to the whole system and survival oflocal government. With rapid development and political and economicschanges the structures of local government are under considerablepressure to change under the terms of restructuring and reorganisation.Certainly, the high growth rate of the economies of the Asia Pacificregion in particular has placed greater demands upon the role of localgovernment in these countries. The challenges facing every localauthority are enormous. Local government has always been criticised fordoing things and for not doing things. Some criticisms appear justified,while others are not. This has led many within the local governmentcircle and inside local government to ponder whether their efforts areworthwhile in the end. Yet local government will still plod on in thebelieve that it provides a crucial contribution as an effective and efficientpart of the entire governmental system. The overall importance of localgovernment cannot be denied as local authorities direct their energies andservices to the needs of their communities and respond to therequirements of the citizens whether in the urban or rural areas; large orsmall. This is the challenge addressed to local authorities.
ADAPTING TO CHANGEOrganisations and individuals always have to cope with change. Bothinside and out of local government there are major changes which can bedifficult to handle in the conventional kind of way. In a real sense, localgovernment is confronted with sharp discontinuities in its jurisdiction
77

which may require unconventional attention. Inside local governmentthere will be enormous changes, stemming often from new policies andregulations including privatisation of functions and services, newbuilding and planning procedures, new arrangements for solid wastemanagement, youth and community care effects. Capital and revenuefinancing becomes more difficult, yet expectations of quantity and qualityof service seem to grow. These changes are challenging the role of thelocal authority as a self sufficient provider of basic services and as an"enabling" authority.
At the same time local government also operates in an externalenvironment which is caught up in an intricate web of change. Societytoday is going through a series of social, moral, economic, technical anddemocratic changes which interact with each other to produce somedegree of unpredictability. As a consequence local authorities areconfronted with an enormous range of both problems and opportunities,many of which lie beyond their current capacity.
The consequences of successive changes to local government viapolicies, political pressures, financial uncertainty is that local governmentmanagement has also become fragmented. By fragmentation, we meanthe replacement of traditional forms of direct provision to a morecomplex form of delivering services. Figure 1.1 shows the old and newstyles and methods of local government management. (Fenwick, 1995).
Figure 1.1: Old and New Management in Local Government
Old
D Direct provision of all stages of service direct to user
Characteristics
D Hierarchical system of line-management
D Manager as professional qualified in the area of service delivery
D Real budgetary control retained at the centre of the authority
D Monopoly
D Stability of expectations from staff and public
D Public funding and public provision with peripheral chargingelement
78

Newn Provision of some services direct; partial provision of some services
via other public and private agenciesCharacteristics
n Management by contract (i.e. around a preset specification for aparticular service)
D Management by project (i.e. around a particular initiative,development or area of work)
D Manager as skilled in 'management' per se, transferable to variousprofessional settings
D Budgetary devolution
D Partial competition
D Changing expectations of public services
D Public and private funding and provision
Source: Fenwick, 1995
It is evident that this changed pattern of local authority servicemanagement requires rather different skills from the ones associated withtraditional line management. Therein lies the value of strategicmanagement and planning to develop, direct and guide the organisation toaccommodate such changes within the organisation and its employees.
MANAGEMENT PLANNINGStrategic management is an important step towards making a complexityof change more manageable. It is about sorting out what is significant,deciding how it needs to be handled and ensuring that it is. Eachorganisation and authority has different needs and operates with its ownpolitical and managerial culture, responding to a distinct environment.(Clarke and Stewart, 1991). A strategic plan is hence outlined whichseeks to balance two sets of forces: the organisation's externalopportunity and threats on the one hand, and its internal strengths andweaknesses on the other. (Dessler, 1991). A strategic plan is a usefulinstrument in management, recording the need for change andcommunicating a sense of direction. In developing strategic plans,managers and others take an organisation wide approach. The overallpurpose of strategic management and planning is to deal effectively with
79

environmental opportunities and threats in terms of the organisationsstrength and weaknesses. The major elements in strategic planning aremission, objectives, strategies and resource allocation (Hellriegel &Slocum, 1992).
Strategic management involves standing back from the everydayconcerns of operational management to take a broader, more long termview of the organisation and its function. Strategic management must notbe restricted by organisational, departmental or committee boundaries. Itmust take a more holistic or wide-ranging view while focusing on a broadspectrum of activities such as the environment (changing needs, problemsand opportunities); public aspirations, political objectives, organisationalcapacity and development and key issues which can be identified andprioritised. Needless to say, many of these issues will be beyond theorganisation's present capacity, which translates into the consequent needfor organisational change involving structure, process, culture andresources. Strategic management must add value to the working of thelocal authority. Through strategic management a local authority should beable to identify problems and opportunities, to shape and be shaped bythe political processes, to create the opportunities, overcomeorganisational weaknesses and to undertake new activities or to adoptways of working that are beyond the possibilities of the present. It issupposed to set a direction rather than a final destination. For a localauthority to meet the challenges of the future each has to recognise thevalue of strategic management and design its own model to suit itspeculiar circumstances. While each local authority will apply its ownbrand of strategic management to meet its own needs the basic elementsof what strategic management should be cannot be disregarded. It isimperative then that management should be the following (Clarke &Stewart, 1991):-
D Selective in action, because it focuses on the need for particularorganisational change
n Wide-ranging in review, because it requires understanding of theenvironment, political values and organisational capacity.
D Changing in focus, because its rationale lies in changing theorganisation to encompass new ways of working
D Linked to organisational development, because this is the meansthrough which it acts
D The expression of political purpose, because this must guideorganisational response to a changing environment
80

D Base on a closed partnership between members and officers,because there needs to be a shared understanding of roles
D Dependent change gains meaning. A strategic plan is an exercise incommunication for strategic management, not an end in itself
OPERATIONALISING STRATEGIC MANAGEMENTBY A LOCAL AUTHORITYSometimes, strategic management appears to be an elusive concept -neither easy to grasp nor clearly defined. However, from the experienceof some local authorities who have tried it out there are certain mainelements and steps and these are:-
D Strategic Review
D Strategic Exploration
D Strategic Choice
D Strategic Direction
D Strategic Leadership
D Strategic Organisational Change and Development
At the initial phase of strategic management, a local authority should taketime to pause and review its current situation and position vis-a-vis theenvironment trends, public attitudes, political issues and its organisationalviability. These should be viewed in their broadest sense whereby a localauthority should explore any probabilities and opportunities arising.From a wide review and exploration of the situation, choices can begin tobe made and directions set. (The practice of consultation, gatheringinformation through public opinion survey and data collection should beincreasingly adopted for local authorities in exploring the choicesavailable).
Choice is the core element of strategic management. It is all about whatto concentrate on and the changes to be made. Not all issues can bestrategic; if everything is then nothing really is. To make an issuestrategic is to give it priority and management focus. Hence, strategicchoice is about selecting the strategic issues and introducing ways ofensuring that the issues will be properly handled. It also involves settingthe direction to ensure that changes do take place.
81

Some local authorities have opted for a mission statement to try toarticulate their strategic issues. However, there needs to be caution in thisfor it is too easy for such a document to become an end in itself; strategicmanagement is then just seen to be about producing a strategy; a one-offexercise, whether it changes things or not.
One requirement of strategic management is a close partnership ofcouncillors and officers and an understanding of each other's role.Councillors and officers should talk openly about roles and relationshipsand about what is to be achieved. Sometimes officers complain thatcouncillors have difficulty in thinking strategically grasping strategicissues and organising strategic choices. Perhaps this perception arisesbecause presentations on strategy do not relate to the real problems facedby the councillors. To overcome this problem there has to be acommitment to foster a partnership. And in a sense, it is the chiefexecutive who has the role in supporting and maintaining this partnershipbecause he is uniquely place to oversee the entire organisation and itsprocesses. Strategic leadership is marked by concentration,communication and ability to act decisively when required. Both officersand councillors should possess responsibility and ability to accept theunexpected and to welcome innovation.
Strategic organisational change may involve changes in organisationalstructure and processes. It may even develop a new organisationalculture. There should be a strengthening of the organisation's capacity torealise its potential. This involves the full use and development of theentire authority - staff, information, power, equipment and otherresources. Hence strategic organisational change and development willinvolve an understanding of the organisation's strengths and weaknesses,getting the system of the organisation in tune with what is to be done,positive communicating skills, training policies and developmentopportunity for staff related to organisational changes and recruitmentand promotion policies geared to organisational change.
CONCLUDING COMMENTSStrategic Management is within the grasp of any local authority. It doesnot require exceptional human qualities or expensive technologicalgadgets. Yet local authorities need to be cautious in assuming that byfollowing it, strategic management will be the panacea for all their illsand weaknesses. Today, "strategy" has become the buzz-word in
82

management. Every organisation and authority wants to be seen doingsomething strategic; it is as if by using it, an organisation, in themanagement sense, has finally "arrived". It assumes an end-state, that alocal authority has achieved its objectives. But a local authority can neverachieve its objectives because the world is never still; the environment inwhich a local authority stands is forever changing. Local government willperpetually be confronted with challenges and the role of strategicmanagement will in a broad sense provide it the direction and vision toface these challenges.
End Notes1. Fenwick, John, Managing Local Government. Chapman & Hall,
London, 1995.
2. Clarke, Michael; Stewart, John, Strategies for Success. The LocalGovernment Management Board, Henley, 1991.
3. Dessler, Gary, Personnel/Human Resource Management (5th ed.),Prentice-Hall International, 1991.
4. Hellriegel, Don; Slocum, John W., Management: AnnotatedInstructor's Edition. (6th Ed.), Addison-Wesley, 1992.
83

BIODATA
Dr Rugayah Mohamed is an Associate Professor of the AnalyticalEconomics Division, Faculty of Economics and Administration,University of Malaya. Currently she is seconded to Johor ChiefMinister's Office as the State Economist and obtained her Ph.D degreefrom the Development Project Planning Centre, University of Bradford.She has published numerous articles in national and internationaljournals.
84

TECHNICAL EFFICIENCY OF FIRMSUSING FRONTIER PRODUCTION
FUNCTION
Rugayah Mohamed
INTRODUCTIONTheory holds that a firm's production function specifies the maximumoutput attainable from a set of inputs, given the technology available tothe firm. There are two approaches in the use of production functions todetermine the efficiency of the firms namely, the frontier productionfunction and the "average" production function.
In the frontier approach, each firm's technical efficiency is relative to theachieved efficiency frontier. Thus all firms have a technical efficiencyranking of one hundred per cent or less, and the lowest unit reaching zero.Zero efficiency occurs when firms employ inputs but produce no output.In the average production function, the firm's technical efficiency isdetermined by the scale parameter of the function. Those enterprisesshowing higher scale parameter values have advantages in using thefactor endowment efficiently. Frontier production functions have anadvantage over average function in that, if factor prices are known priceefficiency can be measured in relation to the technical efficiency of thefirm.
Figure 1: Relationship between technical efficiency and price efficiency(Nerlove, 1964)
85
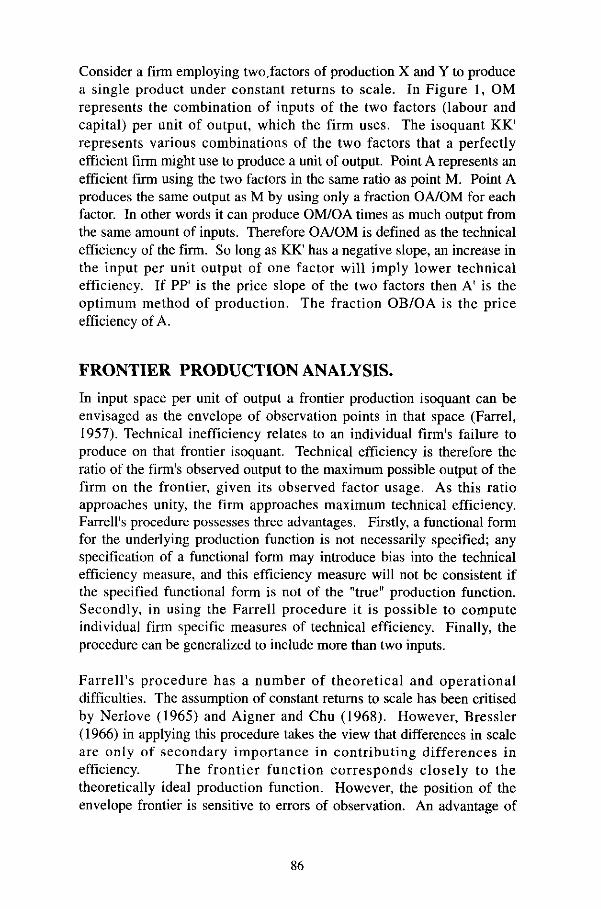
Consider a firm employing two.factors of production X and Y to producea single product under constant returns to scale. In Figure 1, OMrepresents the combination of inputs of the two factors (labour andcapital) per unit of output, which the firm uses. The isoquant KK'represents various combinations of the two factors that a perfectlyefficient firm might use to produce a unit of output. Point A represents anefficient firm using the two factors in the same ratio as point M. Point Aproduces the same output as M by using only a fraction OA/OM for eachfactor. In other words it can produce OM/OA times as much output fromthe same amount of inputs. Therefore OA/OM is defined as the technicalefficiency of the firm. So long as KK' has a negative slope, an increase inthe input per unit output of one factor will imply lower technicalefficiency. If PP1 is the price slope of the two factors then A' is theoptimum method of production. The fraction OB/OA is the priceefficiency of A.
FRONTIER PRODUCTION ANALYSIS.In input space per unit of output a frontier production isoquant can beenvisaged as the envelope of observation points in that space (Parrel,1957). Technical inefficiency relates to an individual firm's failure toproduce on that frontier isoquant. Technical efficiency is therefore theratio of the firm's observed output to the maximum possible output of thefirm on the frontier, given its observed factor usage. As this ratioapproaches unity, the firm approaches maximum technical efficiency.Farrell's procedure possesses three advantages. Firstly, a functional formfor the underlying production function is not necessarily specified; anyspecification of a functional form may introduce bias into the technicalefficiency measure, and this efficiency measure will not be consistent ifthe specified functional form is not of the "true" production function.Secondly, in using the Farrell procedure it is possible to computeindividual firm specific measures of technical efficiency. Finally, theprocedure can be generalized to include more than two inputs.
Farrell's procedure has a number of theoretical and operationaldifficulties. The assumption of constant returns to scale has been critisedby Nerlove (1965) and Aigner and Chu (1968). However, Bressler(1966) in applying this procedure takes the view that differences in scaleare only of secondary importance in contributing differences inefficiency. The frontier function corresponds closely to thetheoretically ideal production function. However, the position of theenvelope frontier is sensitive to errors of observation. An advantage of
86

using this technique is that the frontier depends only on actualobservations contained in the sample. A larger sample cannot contractthe frontier, but instead enlarges it. The frontier isoquant as proposed byFarrell (1957), only uses marginal data. Other observations do not enterthe estimation procedure at all. If we are to take into account allobservations, then fitting a smooth envelope according to some functionalform such as Cobb-Douglas is necessary. By constraining errors to onesign and fitting either least lines or least squares with linear or quadraticprogramming techniques, a fitted envelope function is obtained using allobservations in the estimation. This procedure is used by Aigner and Chu(1968) for a Cobb-Douglas function in output-input space, which isdifferent from the frontier isoquant introduced by Farrell (1957). We willlimit our discussion to the programming approach in output-input spaceof Aigner and Chu (1968) which we adopt in this study. The advantageof this method is that the assumption of constant returns to scale need notbe subscribed to and so the output hyperplane is not constrained to lie onstraight lines emanating from the origin.
THE MODELConsider the usual Cobb-Douglas model in the form of:
V = ALaK6e (1)where
V is value added,
L is labour input,
K is capital input,a,B are parameters,
e is a random error that contains a systematic efficiency term.Taking natural logarithms, eqn.(l) can be rewritten as;vi = a + ali + Bki + ei (2)
where the lower case notation indicates the logs of the variables indicatedabove. When estimated with the ordinary least squares, equation (2)represents an average production function. The error term ei is astochastic error, but with the Aigner and Chu approximation of theproduction frontier, the disturbance term assumes a different complexion.It is presumed to reflect efficiency differences, whilst measurement errorsare assumed to be negligible. By constraining all ei's to be non-positive,the estimated production surface depicts the best practice frontier or
87

envelope. Thus equation (2) should be estimated such thata + all + Bki = vi > vi (3)Only "efficient" firms satisfy the final equality; all others have smalleractual output than could be achieved if they too are efficient. Putting inthe constraint that all the error terms are non-positive, we then expresseqn.(3) as;
a + ali + Bki - ei = vi (4)
The production surface can be allowed to lie as close as possible to thefrontier of observed points by minimising either the sum of squares oferror terms or the linear sum of the error terms (through linearprogramming). Pursuing the latter approach, the programming problemthen is toMinimise A ei
subject to a + ali + Ski > 0
and a, a, 6 >0
Summing equation (4) over i and solving for Aei we obtain
A ei = A ai + Aali + A Bki - Avi (5)
For any particular set of data the term {-Avi) is a constant. Dividingequation (5) by n, the number of firms, we obtain the objective functionto be minimised by linear programming method. The objective functionis as follows;
Minimise a + al + Bk
subject to a + all + Bki > vl
a + aln + Bkn > vnand a, a, B > 0
This efficiency index differs slightly from that developed and used by Timmer (1971). Timmer usesx/xi; the ratio of the logarithms for observed output and efficient output respectively, since anymeasure of technical efficiency should reflect actual to potential ouput in absolute terms, Tyler'smeasurement appears to be more meaningful. Timmer's measurement will always be higherunless the firm is producing exactly on the frontier, for example, consider a firm which should beproducing 100 units of output on the frontier but in actuality only producing 70 units of output.Timmer's index gives a value of 0.923 but Tyler's index yields a value of 0.70.

The index of efficiency can now be computed by taking the vector vi/vi(Tyler, 1979)'.
In the approach described above, no provision for any stochasticdisturbance is made. This is only important when the possibility ofserious measurement error is likely to occur. The problem of separating astochastic measurement error from the efficiency error has been handledon a conceptual basis with the development of the stochastic frontierproduction function model by Aigner, Lovell and Schimdt (1977)2 .However, their empirical results from the application of this modelsuggest that the efficiency disturbance is relatively unimportant inaccounting for the variation in productivity levels.
FINDINGSIn this study, we follow Tyler's approach which assumes that thestochastic error is lognormally distributed with mean value of unity tomeasure technical efficiency of firms in the Malaysian manufacturingsector. Our sample consists government-owned firms (interchangeablynamed as public firms) and privately-owned firms. The data comprisesaverage values of value added, labour and capital inputs over 1980-1987for each firm . In order to arrive at the technical efficiency indices basedon the non stochastic production frontier, the estimations are carried outin accordance with the procedure explained in the preceding section usingthe linear programming approach. Each individual firm's measurement oftechnical efficiency is firstly calculated before their average values aretaken over all firms to arrive at a single estimate for public sector andprivate sector separately in each industry.
Table 1 shows the government and private firms' average actual valueadded together with the calculated maximum possible value added. Fromthis table the efficiency indexes are then computed and shown in Table 2.From the results obtained, we find rather widespread inefficiency for bothpublic and private firms in many of the industries covered in this study.
There are generally three approaches to the estimation of production Junction frontiers. They aredeterministic, prohabilistic and stochastic estimation techniques. The deterministic approachutilises the whole sample of observations but constrain all observed points in ouput space to lieon or below the frontier. The probabilistic and stochastic approaches basically attempt to reducethe sensitivity of the estimated frontier to truly random errors. The probabilistic approach,(Timmer, 1971), pre-specified percentage of the most efficient observation to lie above thefrontier. Stochastic frontiers (Aigner et all (1977), Meusen and van den Broek (1977), van denBroek et at. (1980) specify both efficiency distribution and pure random variation in the errorstructure of the estimated frontier. For the through survey of the estimation problem and anempirical application see van den Broek et al. (1980).
89
The total manufacturing sector yields an average efficiency index of 52per cent for public and 60 per cent for private owned firms. This suggestsan eight per cent better performance by the private firms. The leastefficient public firms are in the vegetable and animal oils industry. Theyare almost 94 per cent away from the frontier. The least efficient privatefirms are in the plastics products industry which are approximately 88per cent inefficiency gap.
The favourable indication of public sector firms' efficiency in themanufacture of dyeing, bleaching and printing, tanneries and leather,planning mills, industrial gases, chemical products, petroleum,shipbuilding and repairing and motor vehicle bodies is hardly surprising.Other performance measures used such as total factor productivity index,unit costs and profitability measurement (refer Rugayah 1992,1993) haveindicated quite similar findings. What is more distinct in our presentfindings is that both public sector as well as private sector firms appear toachieve optimal efficiency levels on the production frontier in industriessuch as tanneries and leather, petroleum, hydraulic cement, primary ironand steel and motor vehicle bodies. This may elucidate the postulationthat performance between firms are possibly invariant to the ownershiptype public or otherwise. Generally, private sector firms are found toexhibit production efficiency in consumer and intermediate industriessuch as dairy products, pineapple canning, fish canning & preserving,vegetable & animal oils, food products, natural fibre & weaving,plywood, containers, boxes & paperboard, structural clay and theassembly of motor vehicles.
REFERENCESAIGNER, D.J. AND CHU, S.F., (1968), "On Estimating the IndustryProduction Function", American Economic Review, 58 No. 4, 826-839.
AIGNER, D.J. LOVELL, C.A.K. AND SCHMIDT, P.J., (1977),"Formulation and Estimation of Stochastic Frontier Production FunctionModel", Journal of Econometrics, 6No.l, 21-37.
BRESSLER, R.G., (1966), "The Measurement of Productive Efficiency",Farm Economics Association, Proceedings, 1966.
FARRELL, M.J., (1957), "The Measurement of Productive Efficiency",Journal of the Royal Statistical Society, Series A (General), Volume 120,Part 111,253-290, 1957.
90

FORSUND, F.R., LOVEL, C.A.K., and SCHIDMT, P. (1980). "A surveyof Frontier Production Functions and on their Relationship to EfficiencyMeasurement". Journal of Econometrics 13, p5-25
HENDERSON, J.M., AND QVANDT, R.E., (1958), MicroeconomicTheory, New York, 1958.
MEEUSEN, W., AND J. VAN DEN BROECK, (1977), "EfficiencyEstimation From Cobb-Doughlas Production Functions With ComposedError", International Economic Review 18, No. 2, p435-44, 1977.
NERLOVE, M., (1964}. Estimation and Identification of Cobb-DouglasProduction Functions. Chicago.
NUNNENKAMP, P.K., (1981), "The Efficiency of State-OwnedEnterprises in the Manufacturing Industry in Taiwan", AcademiaEconomic Papers, Volume 9, No. 2, 87-124, September 1981.
RUGAYAH MOHAMED (1992), "Performance of Public and PrivateEnterprise in Malaysia: An Empirical Analysis." Singapore EconomicReview, Vol. 37No.2(1992)
RUGAYAH MOHAMED (1993) "Productivity, Profit and Cost of Private-owned firms and Government owned firms " Malaysian ManagementReview, Vol. 28, No. 1 (1993)
TIMMER, C.P., (1971), Using a Probabilistic Frontier ProductionFunction to Measure Technical Efficiency, The Journal of PoliticalEconomy, Volume 79, No. 4, July/August 1971, 776-794.
TYLER, W.G., (1979), "Technical Efficiency in Production in aDeveloping Country: An Empirical Examination of the Brazilian Plasticsand Steel Industries", Oxford Economics Papers (New Series), Volume31, 447-495, 1979.
VAN DEN BROECK, et. al, (1980), "On the Estimation of Deterministicand Stochastic Frontier Production Functions: A Comparison", Journalof Econometrics, 117-138.
WALTERS, A.A., (1963), Production and Cost Functions: AnEconometric Survey, Econometrica, Volume 31, No. 1-2, January-April1963, 2-65.
91
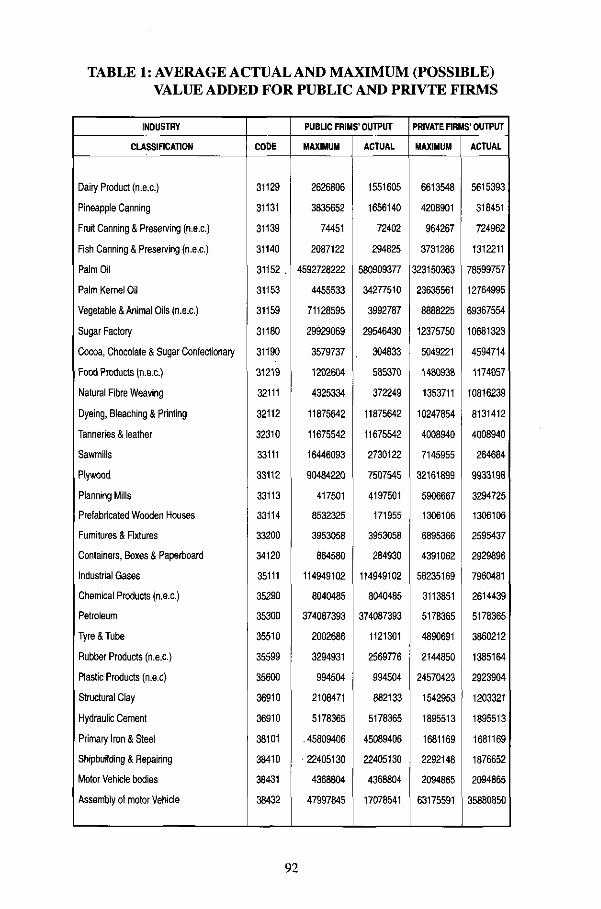
TABLE 1: AVERAGE ACTUAL AND MAXIMUM (POSSIBLE)VALUE ADDED FOR PUBLIC AND PRIVTE FIRMS
INDUSTRY
CLASSIFICATION
Dairy Product (n.e.c.)
Pineapple Canning
Fruit Canning & Preserving {n.e.c.)
Fish Canning & Preserving (n.e.c.)
Palm Oil
Palm Kernel Oil
Vegetable & Animal Oils (n.e.c.)
Sugar Factory
Cocoa, Chocolate & Sugar Confectionery
Food Products {n.e.c.)
Natural Fibre Weaving
Dyeing, Bleaching & Printing
Tanneries & leather
Sawmills
Plywood
Planning Mills
Prefabricated Wooden Houses
Furnitures & Fixtures
Containers, Boxes & Paperboard
Industrial Gases
Chemical Products (n.e.c.)
Petroleum
Tyre & Tube
Rubber Products (n.e.c.)
Plastic Products (n.e.c)Structural Clay
Hydraulic Cement
Primary Iron & SteelShipbuilding & Repairing
Motor Vehicle bodies
Assembly of motor Vehicle
CODE
31129
31131
31139
31140
31152 ,
31153
31159
31180
31190
31219
32111
32112
32310
33111
33112
33113
33114
33200
34120
35111
35290
35300
35510
35599
35600
36910
36910
38101
38410
38431
38432
PUBLIC PRIMS' OUTPUT
MAXIMUM
2626806
3835652
74451
2087122
4592728222
4455533
71128595
29929069
3579737
1202604
4325334
11875642
11675542
16446093
90484220
417501
8532325
3953058
864580
114949102
8040485
374087393
2002686
3294931
994504
2108471
5178365
. 45809406
• 22405130
4368804
47997845
ACTUAL
1551605
1656140
72402
294825
580909377
34277510
3992787
29546430
304833
585370
372249
11875642
11675542
2730122
7507545
4197501
171955
3953058
284930
114949102
8040485
374087393
1121301
2569776
994504
882133
5178365
45089406
22405130
4368804
17078541
PRIVATE FIRMS' OUTPUT
MAXIMUM
6613548
4208901
964267
3731286
323150363
23635561
8888225
12375750
5049221
1480938
1353711
10247854
4008940
7145955
32161899
5906667
1306106
6895366
4391062
58235169
3113851
5178365
4890691
2144850
24570423
1542953
1895513
1681169
2292148
2094865
63175591
ACTUAL
5615393
318451
724962
1312211
78599757
12764995
69367554
10681323
4594714
1174057
10816239
8131412
4008940
264684
9933198
3294725
1306106
2595437
2929896
7960481
2614439
5178365
3860212
1385164
2923904
1203321
1895513
1681169
1876652
2094865
35880850
92
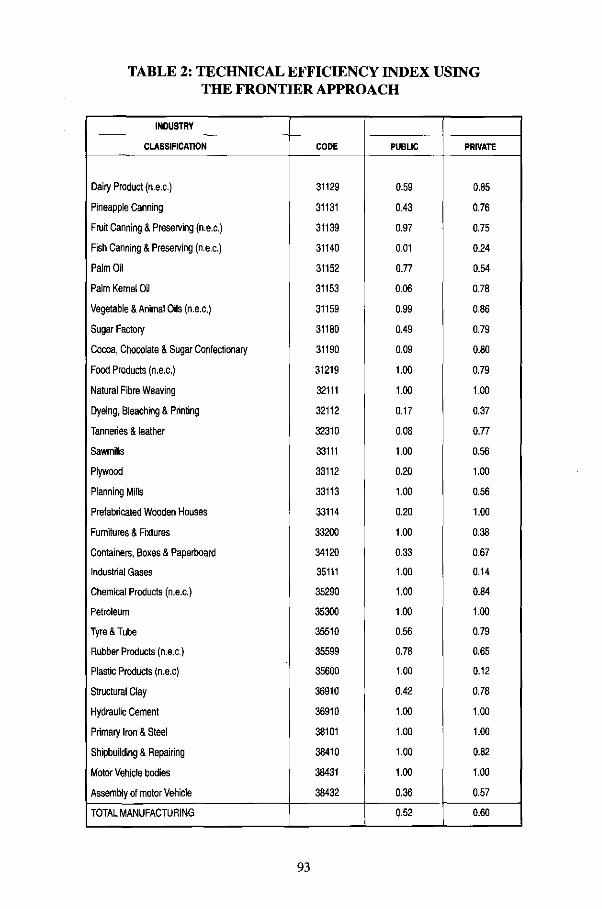
TABLE 2: TECHNICAL EFFICIENCY INDEX USINGTHE FRONTIER APPROACH
INDUSTRY
CLASSIFICATION
Dairy Product (n.e.c.)
Pineapple Canning
Fruit Canning & Preserving {n.e.c.)
Fish Canning & Preserving (n.e.c.)
Palm Oil
Palm Kernel Oil
Vegetable & Animal Oils (n.e.c.)
Sugar Factory
Cocoa, Chocolate & Sugar Confectionary
Food Products (n.e.c.)
Natural Fibre Weaving
Dyeing, Bleaching & Printing
Tanneries & leather
SawmillsPlywood
Planning Mills
Prefabricated Wooden Houses
Furnitures & Fixtures
Containers, Boxes & Paperboard
Industrial Gases
Chemical Products (n.e.c.)
Petroleum
Tyre & Tube
Rubber Products (n.e.c.)
Plastic Products (n.e.c)
Structural Clay
Hydraulic CementPrimary Iron & Steel
Shipbuilding & Repairing
Motor Vehicle bodies
Assembly of motor Vehicle
TOTAL MANUFACTURING
CODE
31129
31131
31139
31140
31152
31153
31159
31180
31190
31219
32111
32112
32310
33111
33112
33113
33114
33200
34120
35111
35290
35300
35510
35599
35600
36910
36910
38101
38410
38431
38432
PUBLIC
0.59
0.43
0.97
0.01
0.77
0.06
0.99
0.49
0.09
1.00
1.00
0.17
0.08
1.00
0.20
1.00
0.20
1.00
0.33
1.00
1.00
1.00
0.56
0.78
1.00
0.42
1.00
1.00
1.00
1.00
0,36
0.52
PRIVATE
0.85
0.76
0.75
0.24
0.54
0.78
0.86
0.79
0.80
0.79
1.00
0.37
0.77
0.56
1.00
0.56
1.00
0.38
0.67
0.14
0.84
1.00
0.79
0.65
0.12
0.78
1.00
1.00
0.82
1.00
0.57
0.60
93
BIODATA
Dr. Mohamed Zairi is a Unilever Lecturer in Total Quality Managementat the University of Bradford Management Centre, teaching atundergraduate, post-graduate and post-experience levels.
Prior joining the academia, Dr. Zairi had several years field of experiencein the manufacturing and production areas. Dr. Zairi is a renowned authorof several books on Total Quality Management and is the editor of thelatest journal in quality in the market ie. "Benchmarking for QualityManagement and Technology".
His current research interests include mission statements andperformance measurement, TQM implementation and innovation. Dr.Zairi has travelled extensively throughout Europe, America and Asiaadvising and lecturing on quality management.
94

BUSINESS PROCESS MANAGEMENT: ABOUNDARYLESS APPROACH TO
MODERN COMPETITIVENESSBy Prof. Mohamed Zairi
SABIC Chair in Best Practice ManagementUniversity of Bradford
ABSTRACT
This paper discusses the concept of Business Process Management as anapproach which relies on cross-functional contributions to organisationalperformance. The paper presented arguments on the importance of'hard'and 'soft' elements which are all required for determining effectivecompetitiveness. A review of the literature did suggest that although theterm 'Process Management' is increasingly being used in everydaybusiness language, the practical experience so far is very limited.
The paper presented the concept of Business Process Managementthrough its various key elements, supported by practical examples. Thiswas followed by a discussion which focused on methodologicalapproaches used in various contexts for creating a culture based onProcess Management.
The paper concludes with some useful guidelines to support efforts inestablishing a Business Process Management culture.
KEYWORDS:Business Process Management - Process - Total Quality Management -EN ISO 9000 - Accredited Quality Systems - Quality Policy Deployment- Continuous Improvement - Problem-Solving - Best Practice -Performance Measurement
95

1. INTRODUCTION:The literature on Business Process Re-Engineering, Benchmarking,Continuous Improvement and many other approaches of modernmanagement is very abundant. One thing which is noticeablehowever is the growing usage of the word process in every daybusiness language. This suggests that most organisations adopt aprocess-based approach to manage their operations and thatBusiness Process Management (BPM) is a well established concept.Is this really what takes place? On examination of the literaturewhich refers to BPM, it soon emerged that the use of this concept isnot really pervasive and what in fact has been acknowledge hithertoas prevalent business practice is no more than structural changes,the use of systems such as EN ISO 9000 and the management ofindividual projects.
What is a process?
A process is an approach for converting inputs into outputs It is theway in which all the resources of an organisation are used in areliable, repeatable and consistent way to achieve its goals.
Post Office Counters LTD for instance define a process as:
A related series of actions, directed to the achievement of a goal,that transforms a set of inputs into desired outputs, by adding value.
Essentially, there are four key features to any process [1]:
A A process has to have predictable and definable inputs;A It has to have a linear, logical sequence or flow;
A A set of clearly definable tasks or activities
A A predictable and desired outcome or result.
What is Business Process Management?
BPM is a structured approach to analyse and continually improvefundamental activities such as manufacturing, marketing,communications, and other major elements of a company'soperation.
96

Essentially, BPM is concerned with the main aspects of businessoperations where there is high leverage and a big proportion ofadded value. Business Process Management has to be governed bythe following rules:
A Major activities have to be properly mapped and documented;A BPM creates a focus on customers through horizontal linkages
between key activities;A BPM relies on systems and documented procedures to ensure
discipline, consistency and repeatability of qualityperformance;
A BPM relies on measurement activity to assess the performanceof each individual process, set targets and deliver output levelswhich can meet corporate objectives;
A BPM has to be based on a continuous approach of optimisationthrough problem-solving and reaping out extra benefits;
A BPM has to be inspired by best practice to ensure that superiorcompetitiveness is achieved.
A BPM is an approach for culture change and does not resultsimply through having good systems and the right structure inplace.
2. THE IMPORTANCE OF ACCREDITED QUALITYSYSTEMS:Accredited quality assurance systems such as EN ISO 9000 areessential and perhaps not enough by themselves in providing aculture based on Process Management. Quality systems are widelyacknowledged as a starting point and a key element for theimplementation of Total Quality Management [2] [3] [4]. Variouscompanies have reported the real value of quality assurance systemssuch as EN ISO 9000:
Carnaud Metalbox pic found that the ISO 9000 registrationprocess provided the foundation on which a quality culture was builtand helped the company move on in developing the total qualityprocess [2];
Tioxide Group Ltd found that the registration programme pushedquality to a much higher profile in the company as everyone was
97

actively involved in the process. In addition, Tioxide sawthemselves in a better position to meet the specific requirements ofcustomers [2];
Esso Research Centre (UK) found that the use of the discipline of arecognised industry accreditation such as ISO 9000 helps in theintegration of the quality process into the site culture.
"The systematic approach as stipulated under the various elementssuch as calibration and maintenance of laboratory equipment, stafftraining, and sample management assist in minimizing errors andincrease the incidents of 'right first time' [5][6] Nissan Motors UK,Federal Express and Club Med view operating standards as animportant requirement in the quality stakes. They do not howeversee the need to have a recognised industry accreditation [7].
In many cases however registration to internationally recognisedquality assurance systems such as ISO 9000 is not done by choicebut can be a necessary requirements imposed by customer minimalrequirements. The common message which seems to be coming outfrom this discussion is that quality assurance systems can assist inthe development of a process-based approach to competitivenesssince former's principles place emphasis on doing the 'right things''right first time' and to continue doing the same in a consistent,repeatable and predictable manner.
3. THE IMPORTANCE OF QUALITY STRUCTURE:Structure is often described as one of the 'hard' elements of modernmanagement. Although extremely important in the setting up of aBPM based culture, structure on its own is incapable of changing theculture of the organisation in order to do what the 'blue prints' maybe recommending. This is an area of great controversy. Theproponents of Business Process Re-Engineering (BPR) throughInformation Technology means have suggested that this is thequickest and most effective way of bringing about change.Referring to their Model of Integrated Management based on the7Ss, Peters and Waterman [8] have presented the following analysis:

"In retrospect, what our framework has really done is to remind theworld of professional managers that 'soft' is hard. It has enabled usto say, in effect, all that... you have been dismissing for so long asintractable, irrational, intuitive, informal organization can bemanaged. Clearly, it has as much or more to do with the way thingswork (or don't) around your companies as the formal structures andstrategies do."
Further, to make it explicitly clear that focusing on structuralchanges alone is not enough for inducing an effective process-basedculture, Waterman, Peters and Philips [9] have presented thefollowing justification:
"Our assertion is that productive organization change is not simply amatter of structure, although structure is important. It is not sosimple as the interaction between strategy and structure, althoughstrategy is critical too. Our claim is that effective organizationalchange is really the relationship between structure, strategy, systems,style, skills, staff, and something we call duperordinate goals."
The 7Ss Model is sometimes referred to as the 'happy atom'. Itreflects the following characteristics:
A Multiplicity of factors - all influence how organizationsbehave;
A Interconnectedness of variables - progress can be achieved bygiving attention to all areas;
A All seven variables act as a driving force - at particular pointsin time, one or more of the seven 'Ss' will emerge as the mostcritical variable(s).
In the process of implementing Total Quality Management, the type,role and usefulness of structure was found to vary from organisationto organisation [10]. It has also been suggested that differences instructural approaches may reflect cultural differences [11]. Structureis a sub-servant of strategy and has to be assessed and reviewed inline with corporate objectives:
99

In BP Chemicals the structure which served the purpose ofintroducing TQM, has been dismantled and changed as theprogramme moved from the planning to educational, to theimplementation phase [12];
In Thomas Cork SML the high-powered quality council set up atthe outset to oversee the introduction of total quality was disbandedand its functions taken over by the management committee once thequality initiatives got off the ground [2].
4. THE IMPORTANCE OF STRATEGY:The achievement of a BPM culture depends very much on theestablishment of total alignment to corporate goals and having everyemployee's efforts focused on adding value to the end customer.This is acknowledged by many authors [13] and all quality gurus.Deming [14] for instance through the first of his 14 points, 'strivefor consistency of purpose', stresses the need to link quality effortswithin an organisation to a larger sense of corporate purpose. Theobjectives of an organisation are best communicated to allemployees through a formal process of policy and strategydevelopment and deployment. In fact many strategies fail to deliverbecause what is planned and what is implemented are not the same[15][16]. It is acknowledged very widely that policy deploymentand implementation processes are difficult ones [17].
Examples of effective management of strategic processes have a lotin common:
Rank Xerox Corp. when they made the commitment to adopt TQMback in 1984, their first step was to articulate a simple and directquality policy and to communicate it to all employees [18];
Grundos have ensured that a quality policy is central to their effortsto win a sustainable competitive edge [7]. Typically, it is found thatthe quality policy, strategy, goals, vision/mission and values arecontained within the larger quality policy;
Procter and Gamble through their CEO, strategic planning ismanagement leadership's job [19][20];
100
Mitel Telecom Ltd UK views the publishing of its commitment toquality improvement [21];
Southern Pacific Airlines in implementing continuous qualityimprovement, have emphasized that a strong and clear leadership,statement of mission and strategy is essential. This statement mustmake clear that quality is the strategy.
World Class organisations such as Procter and Gamble, NEC Japan,Komatsu, Unilever Hewlett Packard, rank Xerox, Florida Power &Light in the process of ensuring success in developing,communicating and reviewing strategic plans at all levels, haveheavily depended on a structured planning process termed: QualityPolicy Deployment [23]. The latter is defined at Rank Xerox as:
"A key process which Rank Xerox can articulate and communicatethe Vision, Mission, Goals and Vital Few Programmes to allemployees. It provides answers to the two questions: What do weneed to do? And how are we going to do it?" [23]
NEC Japan - here, the quality policy deployment process (calledHosin Kanri) starts with the CEO first by setting the long-termpolicy in line with the aims and philosophy of the corporation [11].
5. THE IMPORTANCE OF PROCES MANAGEMENT:Kanji [24] argues that almost if not all, organisational activities areconsidered as processes which cut across traditional functionalboundaries. The functional approach creates barriers achievingcustomer satisfaction. It allows control points between departmentsto be vulnerable to organisational 'noise' [24], such as 'turfprotection' and poor communication. In contrast however, theprocess-based approach improves customer focus and avoids thelimitations of managing by vertical functions [25].
Best In Class organisations have recognised the need to move awayfrom the traditional functionally-based approach, to managingthrough a set of clearly-defined customer driven processes. This iscertainly the case of Rank Xerox [18], IBM [26], ICL and ShellChemicals UK [27].
101

The following are examples or World Class organisations where aradical change from a functionally-driven to a process-basedapproach took place:
• Elida Faberge Ltd:
• Elida Faberge is a leader in Personal Products, part of Unileverpic with famous Brands such as SURE, LYNX, BRUT,IMPULSE, ORGANICS, TIMOTEI, PONDS, VASELINE,MENTADENT, SIGNAL.
• Elida Faberge Ltd relies very much on TQM principles in therunning of its operations. Numerous benefits were achievedfrom the use of TQM, such as:
- Reduction in change over time- Improved TeamworkReduction in NPD cycle time
The driving themes of Total Quality are:- continuous improvement- The importance of the customer- Empowerment of employees- Business activities as PROCESSES
Elida Faberge decided to undergo a radical change for the creationof a Business Process Management Culture, driven by the followingfactors:
1. During the 1990s', a number of key challenges started to facecompany A, such as the need to improve its service to retaincustomers;
2. The need to move to a European Manufacturing Centre;
3. The need to move to a European then Global Innovation Centrefor Deodarant/Fragrance products;
4. The need to 'Right Size' the company, to improve productivityand competitiveness.
3 cross-functional teams were created, each led by a director andfacilitation was provided by a consultant. The results led to thecreation of:
102

New organisation based on 5 Core Processes, includingBusiness Planning/Strategy as one of Core Processes (Figure1); (seepage 174)Re-alignment of senior management responsibility;Responsibilities are based on natural boundaries betweenprocesses {not functional boundaries which cut acrossprocesses).
Rank Xerox Corp. [1]:
• From a manufacturer of copier, printer and fax products to aprovider of document tools and services
• Appreciated that processes are liberating and empoweringrather than constraining
• Focused on core processes to become customer focused andmore efficient and effective
British Telecom [1]:
• Changed from technology-based divisions to customer sectorand international market-based divisions
• Use to manage through a project-based approach by focusingon the management of risk rather than effective planning,continuously improving routine processes, eliminating wasteand duplication and learning from previous experience andinjecting innovation and best practice
SmithKline Beecham [1]:• Realised that the customer has changed and therefore decided
to move away from the doctor-driven approach• The 4 traditional divisions: pharmaceuticals, consumer health
care, animal health, clinical laboratories re-organised into 3 keyareas: care delivery, care management, and care coverage eacharea has many layers of sub-processes;
• The big task now is to ensure that each process is mapped,documented, with performance measures and a consistent,repeatable and predictable performance.
• SmithKline Beecham has recognised that it will take manyyears (at least 5) to become a full process-orientedorganisation.
103
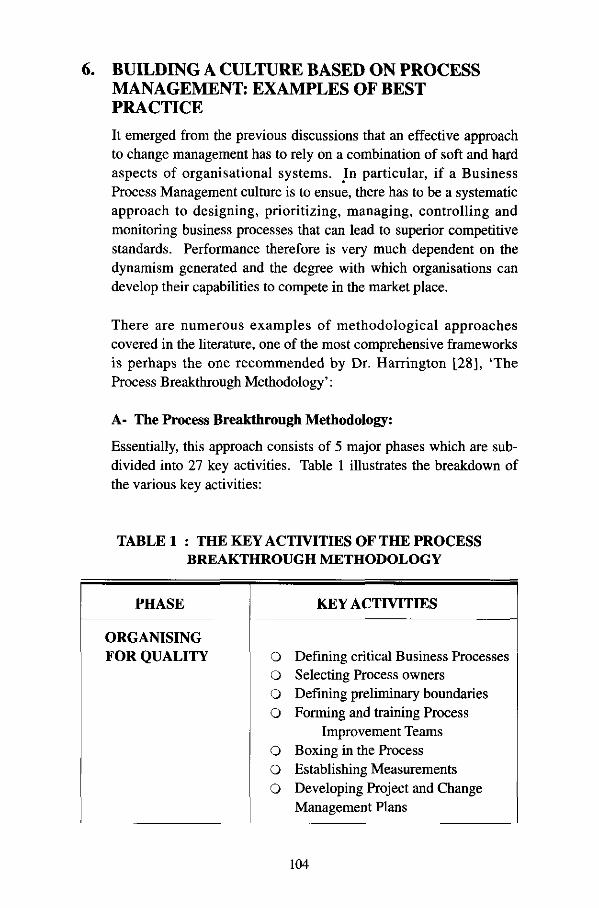
6. BUILDING A CULTURE BASED ON PROCESSMANAGEMENT: EXAMPLES OF BESTPRACTICEIt emerged from the previous discussions that an effective approachto change management has to rely on a combination of soft and hardaspects of organisational systems. In particular, if a BusinessProcess Management culture is to ensue, there has to be a systematicapproach to designing, prioritizing, managing, controlling andmonitoring business processes that can lead to superior competitivestandards. Performance therefore is very much dependent on thedynamism generated and the degree with which organisations candevelop their capabilities to compete in the market place.
There are numerous examples of methodological approachescovered in the literature, one of the most comprehensive frameworksis perhaps the one recommended by Dr. Harrington [28], 'TheProcess Breakthrough Methodology':
A- The Process Breakthrough Methodology:
Essentially, this approach consists of 5 major phases which are sub-divided into 27 key activities. Table 1 illustrates the breakdown ofthe various key activities:
TABLE 1 : THE KEY ACTIVITIES OF THE PROCESSBREAKTHROUGH METHODOLOGY
PHASE
ORGANISINGFOR QUALITY
KEY ACTIVITIES
O Defining critical Business ProcessesO Selecting Process ownersO Defining preliminary boundariesO Forming and training Process
Improvement TeamsO Boxing in the ProcessO Establishing MeasurementsO Developing Project and Change
Management Plans
104
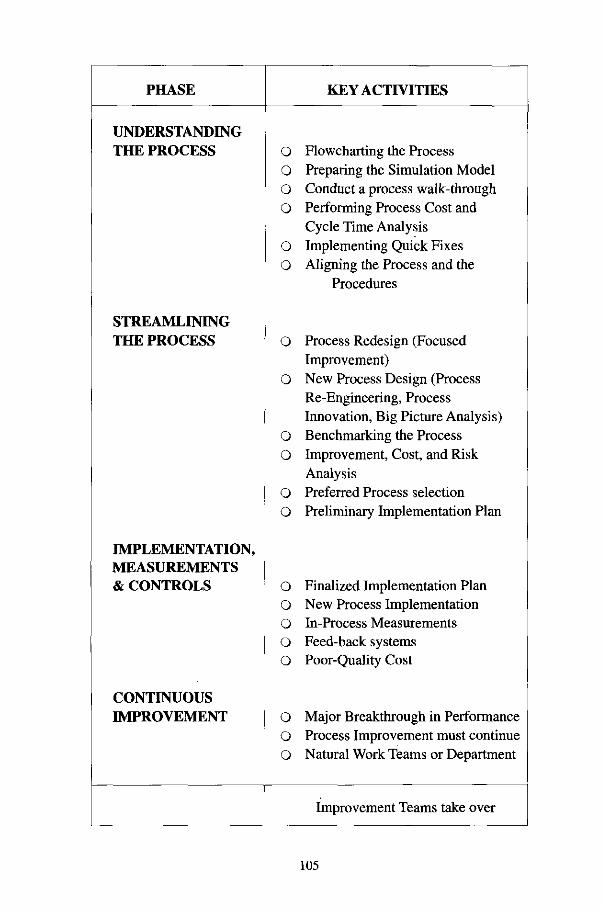
PHASE
UNDERSTANDINGTHE PROCESS
STREAMLININGTHE PROCESS
IMPLEMENTATION,MEASUREMENTS& CONTROLS
CONTINUOUSIMPROVEMENT
KEY ACTIVITIES
OoOo
oo
o
o
oo
oo
ooooo
ooo
Flowcharting the ProcessPreparing the Simulation ModelConduct a process walk-throughPerforming Process Cost andCycle Time AnalysisImplementing Quick FixesAligning the Process and the
Procedures
Process Redesign (FocusedImprovement)New Process Design (ProcessRe-Engineering, ProcessInnovation, Big Picture Analysis)Benchmarking the ProcessImprovement, Cost, and RiskAnalysisPreferred Process selectionPreliminary Implementation Plan
Finalized Implementation PlanNew Process ImplementationIn-Process MeasurementsFeed-back systemsPoor-Quality Cost
Major Breakthrough in PerformanceProcess Improvement must continueNatural Work Teams or Department
Improvement Teams take over
105
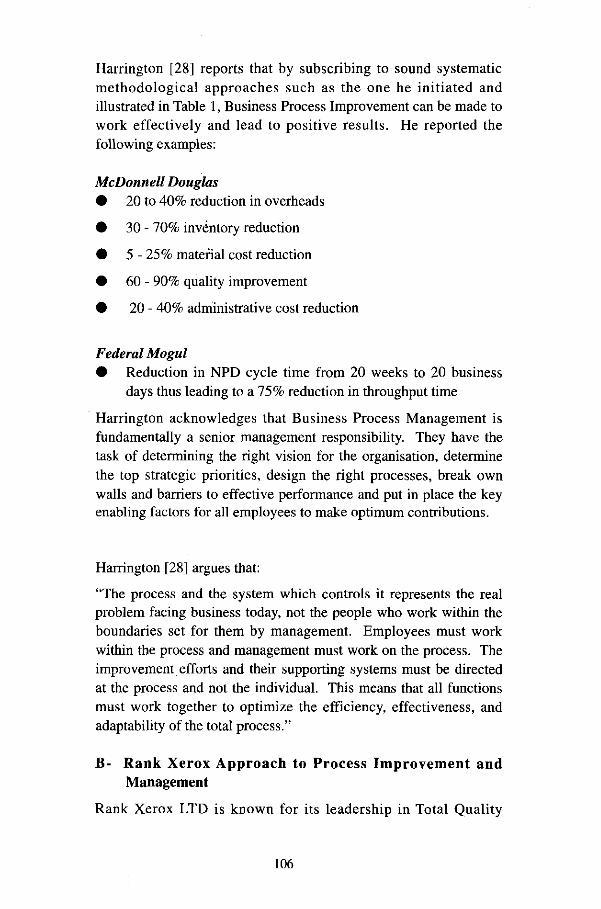
Harrington [28] reports that by subscribing to sound systematicmethodological approaches such as the one he initiated andillustrated in Table 1, Business Process Improvement can be made towork effectively and lead to positive results. He reported thefollowing examples:
McDonnett Douglas• 20 to 40% reduction in overheads
• 30 - 70% inventory reduction
• 5 - 25% material cost reduction
• 60 - 90% quality improvement
• 20 - 40% administrative cost reduction
Federal Mogul• Reduction in NPD cycle time from 20 weeks to 20 business
days thus leading to a 75% reduction in throughput time
Harrington acknowledges that Business Process Management isfundamentally a senior management responsibility. They have thetask of determining the right vision for the organisation, determinethe top strategic priorities, design the right processes, break ownwalls and barriers to effective performance and put in place the keyenabling factors for all employees to make optimum contributions.
Harrington [28] argues that:
"The process and the system which controls it represents the realproblem facing business today, not the people who work within theboundaries set for them by management. Employees must workwithin the process and management must work on the process. Theimprovement efforts and their supporting systems must be directedat the process and not the individual. This means that all functionsmust work together to optimize the efficiency, effectiveness, andadaptability of the total process."
B- Rank Xerox Approach to Process Improvement andManagement
Rank Xerox LTD is known for its leadership in Total Quality
106
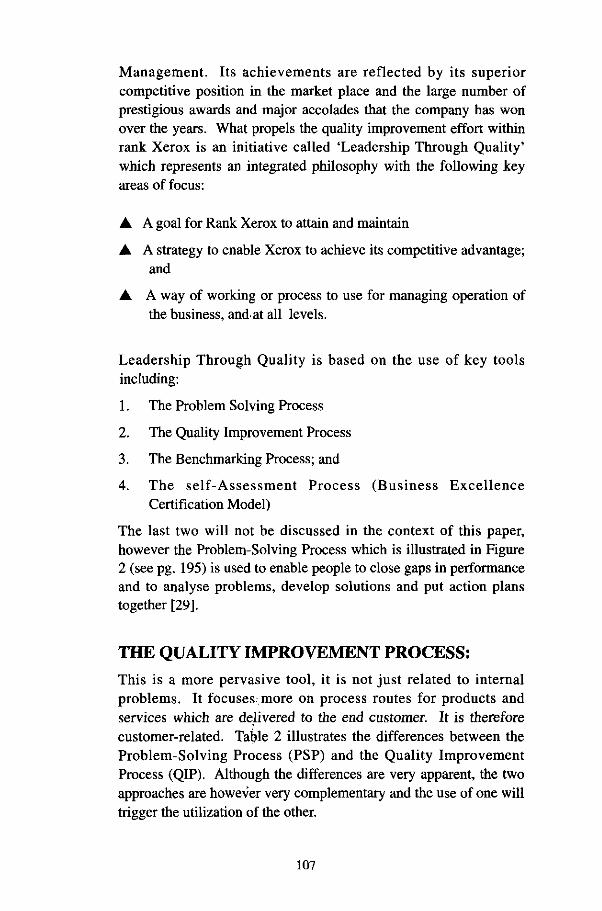
Management. Its achievements are reflected by its superiorcompetitive position in the market place and the large number ofprestigious awards and major accolades that the company has wonover the years. What propels the quality improvement effort withinrank Xerox is an initiative called 'Leadership Through Quality'which represents an integrated philosophy with the following keyareas of focus:
A A goal for Rank Xerox to attain and maintain
A A strategy to enable Xerox to achieve its competitive advantage;and
A A way of working or process to use for managing operation ofthe business, and. at all levels.
Leadership Through Quality is based on the use of key toolsincluding:
1. The Problem Solving Process
2. The Quality Improvement Process
3. The Benchmarking Process; and
4. The self-Assessment Process (Business ExcellenceCertification Model)
The last two will not be discussed in the context of this paper,however the Problem-Solving Process which is illustrated in Figure2 (see pg, 195) is used to enable people to close gaps in performanceand to analyse problems, develop solutions and put action planstogether [29].
THE QUALITY IMPROVEMENT PROCESS:This is a more pervasive tool, it is not just related to internalproblems. It focuses more on process routes for products andservices which are delivered to the end customer. It is thereforecustomer-related. Tatjle 2 illustrates the differences between theProblem-Solving Process (PSP) and the Quality ImprovementProcess (QIP). Although the differences are very apparent, the twoapproaches are however very complementary and the use of one willtrigger the utilization of the other.
107
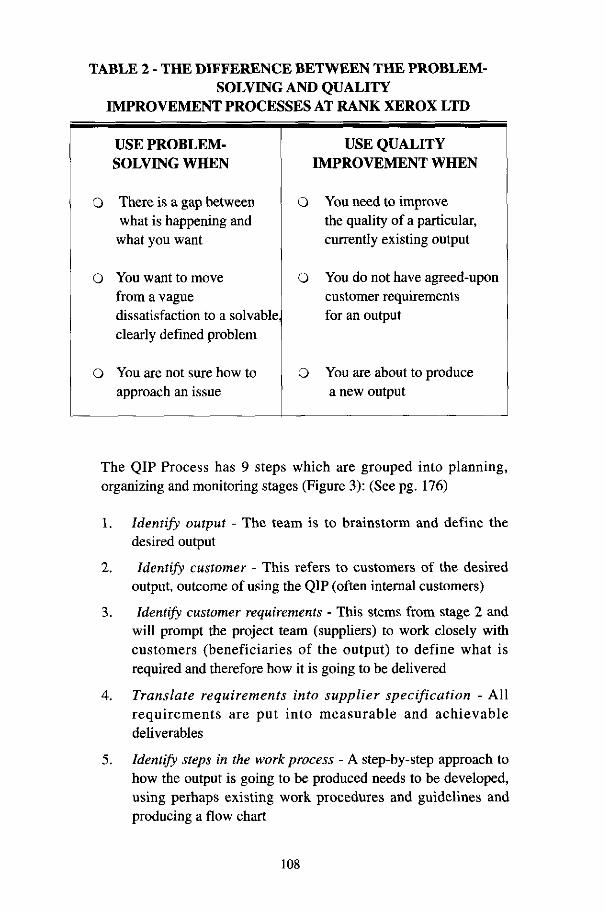
TABLE 2 - THE DIFFERENCE BETWEEN THE PROBLEM-SOLVING AND QUALITY
IMPROVEMENT PROCESSES AT RANK XEROX LTD
USE PROBLEM-SOLVING WHEN
O There is a gap betweenwhat is happening and
what you want
O You want to movefrom a vaguedissatisfaction to a solvableclearly defined problem
O You are not sure how toapproach an issue
USE QUALITYIMPROVEMENT WHEN
O You need to improvethe quality of a particular,currently existing output
O You do not have agreed-uponcustomer requirementsfor an output
O You are about to producea new output
The QIP Process has 9 steps which are grouped into planning,organizing and monitoring stages (Figure 3): (See pg. 176)
1. Identify output - The team is to brainstorm and define thedesired output
2. Identify customer - This refers to customers of the desiredoutput, outcome of using the QIP (often internal customers)
3. Identify customer requirements - This stems from stage 2 andwill prompt the project team (suppliers) to work closely withcustomers (beneficiaries of the output) to define what isrequired and therefore how it is going to be delivered
4. Translate requirements into supplier specification - Allrequirements are put into measurable and achievabledeliverables
5. Identify steps in the work process - A step-by-step approach tohow the output is going to be produced needs to be developed,using perhaps existing work procedures and guidelines andproducing a flow chart
108

6. Select measurement - Measures need to be selected to assessbefore, during and after scenarios and also measures need to bedesigned for continuous monitoring and prevention purposes
1. Determine process capability - This is to test the recommendedprocess and to ensure that it can do the right things right firsttime. Otherwise the team can use the PSP to fine-tune theprocess for full capability to deliver customer requirements
8. Evaluate results - This is to answer the following twoquestions:
O Did the process work?
O Did the results of what we did meet customerrequirements?
9. Recycle - This is for continuous monitoring and the changingof steps following changes in customer requirement andexploiting best practice and new learning opportunities.
C. PROCESS MANAGEMENT METHODOLOGY ATFORD MOTORS:Ford introduced a new Process Management Approach back in1992, called Quality Operating systems (QOS). Ford felt there is aneed for an operating system to guide improvement andoptimisation efforts. The following arguments were put forward inan internal document:
"Ford trained thousands of our people in the quality engineeringtools and we developed Q-l facilities only to find we needed more.QOS was the management 'glue* that improved our success with ourcustomers."
QOS is defined as a systematic, disciplined approach that usesstandardised tools and practices to manage business and achieveever increasing levels of customer satisfaction. QOS relies on thefollowing sets of policies for its effective implementation:
(D The assembly and analysis of existing data into a system of keyprocess and result measurable which are correlated and can bequickly reviewed and acted upon;
109

@ A set of standardised management practices and systemstandards which maximise performance through a total systemsapproach;
© A set of standardised tools and methodologies forimplementing continuous and breakthrough improvements inboth manufacturing and non-manufacturing applications;
© The establishment of effective communication links betweenall people in the system through cross-organisationaluniformity.
Figure 4 (See pg. 177) illustrates the QOS Process at Ford. TheQuality Operating System at Ford Motors is a generic process whichcan be applied in manufacturing and non-manufacturing operations.It is based on 8 steps driven by a continuous involvement of allemployees and the principle of Plan-Do-Check and Act. Thereported benefits of QOS include:
A Providing senior management with a tool to determine thecorrelation between customer expectations and companyresults;
A Enhances empowerment
A Combines the power of team dynamics and managementauthority.
D. PROCESS MANAGEMENT AT POST OFFICE COUNTERSLTD:
Post Office Counter LTD (POCL) has over 25 million customers. Inthe late 1980s, it appreciated the need to introduce quality in itsbusiness operations. In 1989, the 'Customer First' initiative waslaunched. Customer First was defined as:
"The way we manage the business in a way which continuallyfocuses on the customer and harness everyone's commitment."
The Business Process Improvement (BPI) Methodology wasintroduced as a structured approach which will assist with the
110

simplification and streamlining of business processes thus leading tothe efficient and effective use of resources such as facilities, people,equipment, time and capital.
BPI has 3 major objectives:
A Making processes more effective - producing the desiredresults
A Making processes more efficient - minimising theresources used
A Making processes adaptable - being able to meetchanging customer andbusiness needs
Similarly to Rank Xerox, POCL uses a Quality ImprovementProcess (QIP) as a Problem-Solving Process used within functionsand accross functions. Figure 5 (See pg. 178) illustrates the QIP atPOCL. The Business Process Improvement (BPI) however startsand ends with customer needs identification and their fulfillment tocustomer satisfaction:
A BPI provides a structured approach for focusing improvementactivity on external customer satisfaction and businessobjectives;
A Has a measurement framework which is clearly positioned;
A Emphasises the use of in-process measurement and display,especially promoting service level agreements.
Figure 6 (See pg. 179) illustrates the BPI at Post Office CountersLTD, which consists of five phases, each with a specific purposedescribed in Table 3.
Ill

TABLE 3: THE BUSINESS PROCESS IMPROVEMENTMODEL AT POST OFFICE COUNTERS LTD
PHASE
PREPARE FOR BPI
DETERMINECUSTOMER MEASURES& TARGETS
UNDERSTAND THEBUSINESS PROCESS
CRITIQUE THEBUSINESS PROCESS
IMPROVE THEBUSINESS PROCESS
PURPOSE
To ensure the success of BPIeffort by building, understandingand commitment
Define success criteria
To understand all dimensionsof the current business process
To determine the best solution(s)to improve the quality &
efficiency of the business process
To implement changes thatwill improve the effectiveness& efficiency of the business process
7. SUSTAINING BUSINESS PROCESSMANAGEMENT - SOME GUIDELINES:It is evidently clear that Business Process Management is anapproach which is all encompassing and is dependent on strategicelements, operational elements, use of modern tools and techniques,people involvement and more importantly on a horizontal focuswhich will best suit and deliver customer requirements in anoptimum and satisfactory way.
The development of a culture based on Business ProcessManagement can be greatly assisted by using Total Qualityprinciples, a systematic methodology, a problem-solving or QualityImprovement Process which can help with developing localsolutions within functions or across functions, the use of
112

performance measures for monitoring inputs, outputs and the controlof each process and a culture of continuous improvement based onlearning from within and outside the organisation.
The following are proposed as a set of rules which can assist in thedevelopment of a Business Process Management culture:
A Business Process Management is the way in which keyactivities are managed and continuously improved to ensureconsistent ability to deliver high quality standards of productsand services;
A Business Processes are the critical and all encompassingactivities of design, manufacture, marketing, innovation, salesand others which deliver quality to the end customers;
A Process management also refers to the way companiesconstantly strive for excellence and how they stimulateinnovation and creativity for process improvement andoptimisation;
A Business Process Management also includes activities whichrefer to supplier quality management issues;
A The management of processes is conducted throughperformance measurement for setting targets for improvementand also for measuring product/service capability, processcapability, supplier capability and efficiency/effectivenessaspects in terms of cycle time, quality standards, costs....
A Business Process Management, through continuousmeasurement and improvement will determine effectiveness ofprocess design for streamlining and simplification. It ensuresthe introduction of best practice through benchmarkinginformation and based on valuable inputs from customers;
A Process Management challenges practices (i.e. the dynamicaspects of each process and its behaviour) as much as theperformance of each process (its output/metrics). Further,process management seeks to continuously strengthen all
113

activities through the introduction of best practice, to ensurethat internal standards of performance are competitivelyacceptable;
Business Process Management relies on a systematicmethodology supported by a problem-solving methodology tostrengthen newly designed processes, to reinforce the linkagesbetween various functions and to ensure that optimumperformance can be achieved.
REFERENCES[1] Creating a Change Culture - not about structures, but winning
hearts and minds, BULLETPOINT, sample issue 1996, pp 12 - 13
[2] Oakland, J.S. Porter, L.J. (1994), Cases in Total QualityManagement, Butterworth Heinemann, Oxford, UK.
[3] Porter, L.J and Parker, A.J. (1993), "Total Quality Management -The Critical Success Factors", Total Quality Management, VI.4,N o l , p p l 3 - 2 2
[4] Price, M; Chen, E. Eva. (1993), "Total Quality Management in aSmall, High-Technology Company", California ManagementReview, Vol. 35, No 3, pp 96-117
[5] Price, F. (1990), Right Every Time, Gower Publishing Co. Ltd,Aldershot, England.
[6] Thiagarajan, T. (1996), An Empirical Study of Total QualityManagement (TQM) in Malaysia: A Proposed Framework ofGeneric Application, PhD Thesis, Bradford UniversityManagement Centre, Bradford, UK.
[7] Binney, G. (1992), Making Quality Work : Lessons fromEurope's Leading Companies, The Economist Intelligence Unit,London, UK.
114

[8] Peters, T.J., and Waterman, R.H. (1982), In Search of Excellence,Harper and Row, New York.
[9] Waterman, R.H., Peters, T.J., and Philips, J.R. (1980), "Structureis not Organization", Business Horizons, June PP 14 - 16
[10] Black, S.A. (1993), Measuring the Critical Factors of TotalQuality Management, Unpublished PhD thesis, University ofBradford Management Centre, Bradford: UK.
[11] Smith, S. (1994), The Quality Revolution, Management Books2000 Ltd, Didcot: UK
[12] Stark, J.A.L. (1990), "Experience of TQM at BP Chemicals", InProceedings of the 3rd International Conference on Total QualityManagement, Ed: Oakland, J.S, IPS Publications Ltd, Bedford,UK.
[13] Olian, J.D. and Rynes, S.L. (1991), "Making Total Quality Work:Aligning Organisational Processes, Performance Measures, andStakeholders", Human Resources Management, Vol. 30, No 3, pp303 - 333
[14] Deming, W Edward. (1986), Out of the Crisis, University Press,Cambridge: USA
[15] Zairi, M. (1995), "Strategic Planning through Quality PolicyDeployment: A Benchmarking Approach", in Total QualityManagement: Proceedings of the 1st world congress, Ed (Kanji,G.K.), Chapman & Hall, London : UK
[16] Easton, G.S. (1993), "The 1993 state of U.S. Total QualityManagement: A Baldrige Examiner's Perspective", CaliforniaManagement Review, Vol. 35, No 3, pp 32 - 54
[17] Groocock, J.M. (1986), The Chain of Quality, John Wiley,Chichester: UK
115
[18] Coleman, R. (1991), "People and Training - The ProgressiveEvolution of a Training Strategy in Support of the Implementationof Total Quality Management", in Proceedings of the 4thInternational Conference on Total Quality Management, Ed:Oakland, JS IPS Publications Ltd, Bedford: UK
[19] Bemowski, K. (1992), "Carrying on the P&G tradition", QualityProgress, Vol. 27, No 3, pp 51 - 54
[20] Davidson, A.R. (1995), Quality Management - Do We Believe init Totally'?, In Total Quality Management Proceedings of the 1stWorld Congress, Ed: Kanji, G.K., Chapman & Hall, London :UK.
[21] Boyer, S.M. (1990), "TQM and New Product Development", inProceedings of the 3rd International Conference on Total QualityManagement, Ed: Oakland, J.S., IPS Publications Ltd, Bedford:UK.
[22] Carman, J.M. (1993), "Continuous Quality Improvement as aSurvival Strategy: The Southern Pacific Experience", CaliforniaManagement Review, Vol. 35, No 3, pp 118 - 132
[23] Zairi, M. (1994), Measuring Performance for Business Results,Chapman & Hall, London : UK
[24] Edson, J. and Shannahan, R. (1991), "Managing quality acrossbarriers", Quality Progress, February, pp 45 - 47
[25] McAdam, R. (1996), "An Integrated Business ImprovementMethodology to Refocus Business Improvement Efforts", Journalof Business Process Re-Engineering and Management, Vol. 2, NoI ,pp63-71
[26] Snowden, D. (1991), "Business Process Management and TQM",in Proceedings of the 4th International Conference on TotalQuality Management, Ed: Oakland, J.S, IPS Publications Ltd,Bedford: UK
116

[27] Sinclair, D.A.C, (1994), Total Quality-based PerformanceMeasurement: An Empirical Study of Best Practice, UnpublishedPhD Thesis, University of Bradford Management Centre,Bradford: UK
[28] Harrington, J.J. (1995), Total Improvement Management - theNext Generation in Performance Improvement, McGraw HillInc., New York, USA.
[29] Zairi, M. (1996), Effective Benchmarking - Learning from theBest, Chapman & Hall, London, UK.
117
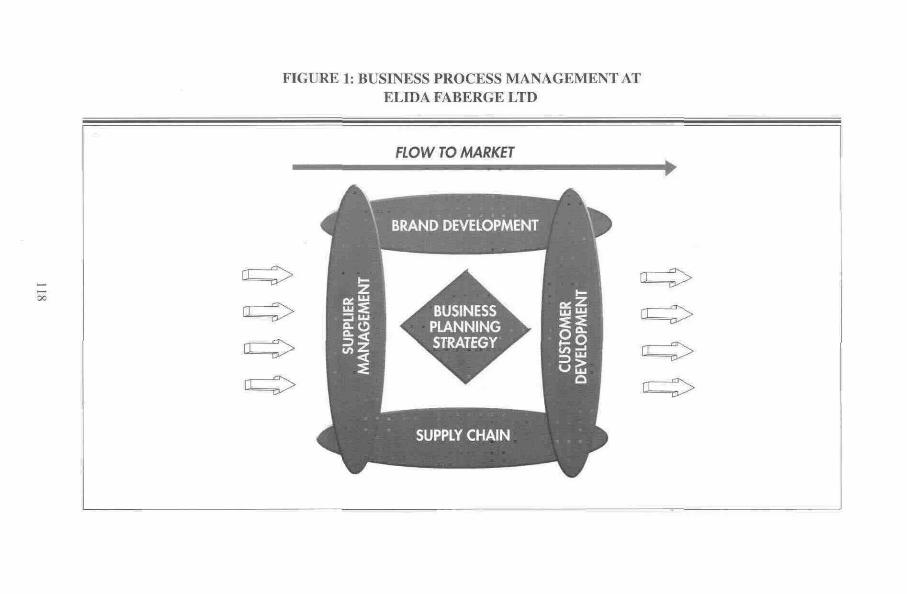
FIGURE 1: BUSINESS PROCESS MANAGEMENT ATELIDA FABERGE LTD
FLOW TO MARKET

FIGURE 2 : PROBLEM-SOLVING PROCESS AT RANK XEROX LTD
IDENTIFYING &SELECTINGPROBLEM ,
EVALUATING^SOLUTION
'ANALYZINGPROBLEM
________/ PROBLEM}_______1 SOLVING
.IMPLEMENTING^ PROCESS / GENERATING; SOLUTION rV % POTENTIAL
' SOLUTIONS
SELECTING &PLANNINGSOLUTION
FIGURE 2: PROBLEM-SOLVING PROCESS AT RANK XEROX LTD

FIFURE 3: QUALITY IMPROVEMENT PROCESS ATRANK XEROX LTD
QUALITY PROCESSMANAGEMENT AT RANK XEROX
FOR
QUALITY
1. IDENTIFY OUTPUT
2. IDENTIFY CUSTOMER
3. IDENTIFY CUSTOMER REQUIREMENTS
4. TRANSLATE REQUIREMENTS INTOSUPPLIER SPECIFICATIONS
5. IDENTIFY STEPS IN WORK PROCESS
6. SELECT MEASUREMENTS
7. DETERMINE PROCESS CAPABILITY
EXIT TO WORK PROCESS
8. EVALUATE RESULTS
PRODUCEOUTPUT
120
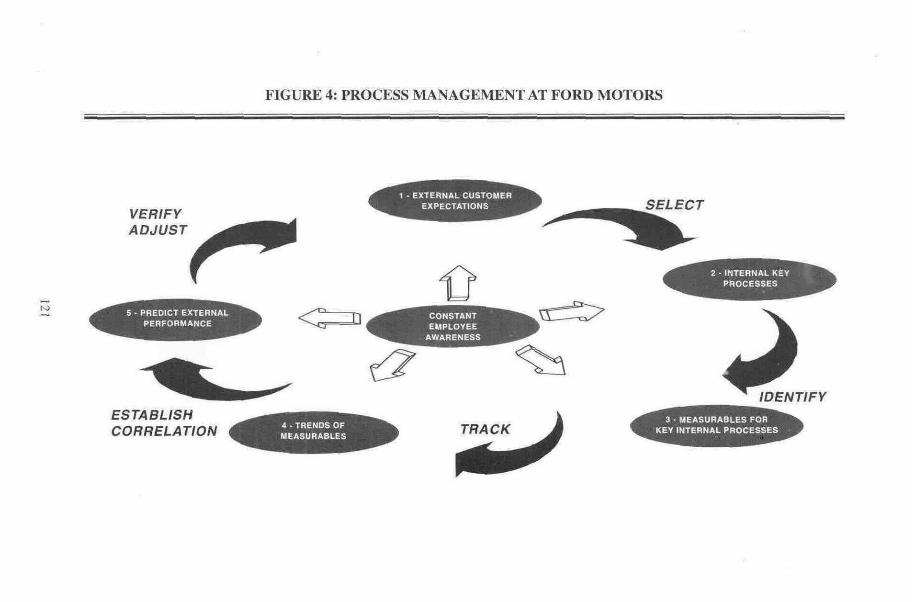
FIGURE 4: PROCESS MANAGEMENT AT FORD MOTORS
VERIFYADJUST
EXTERNAL CUSTOMEREXPECTATIONS
ESTABLISHCORRELATION
SELECT
IDENTIFY3 -MEASURABLES FOH
KEY INTERNAL PROCESSES

FIGURE 5: QUALITY IMPROVEMENT PROCESS AT POSTOFFICE COUNTERS LTD
Identify Improvement Opportunity
Prioritise & Select Quality Improvement Opportunities
Seek furtheropportunities
AnalyseEffectiveness
Identifyoutputs
' Identifycustomer
requirements
REVIEW FOCUSIdentifythe gap
122

FIGURE 6: BUSINESS PROCESS IMPROVEMENT AT POST OFFICE COUNTERS LTD
Continuous
fO
Prepare forBPI
DetermineCustomer
Measures &Targets
i '
Understandthe Business
Process
Improvement
Critique theBusinessProcess
Improve theBusinessProcess
BIODATA
Abd. Rahman bin Ibrahim is the Director of Manufacturing 1 ResearchDivision, National Productivity Corporation. His previous positions areDocumentation Officer, Malaysian Centre for Development Studies,Prime Minister's Department (1971-1972); Assistant District Officer(Rompin) and Assistant Commissioner of Land and Mines (Kuantan,Pahang ) (1972-1973); Administrative Officer, Food TechnologyDivision, Ministry of Agriculture, Serdang, Selangor (1973-1974);Training and Investigation Officer (1974-1980). Senior Training andInvestigation Officer (1980-1983), Assistant Director (1983-1991),Deputy Director, Accreditation and Training (1991-1992), Director ofNPC Northern Branch (1992-1993) and Director of Manufacturing 1Research Division (since 1993).
He holds Bachelor Of Economics Degree (University of Malaya, 1971)and Master of Business Administration (American University,Washington D.C., 1982).
124

WAGE RATES, LABOUR PRODUCTIVITYAND INFLATION IN MANUFACTURING
SECTORAbd Rahnian Ibrahim
INTRODUCTIONIt is quite common nowadays among workers and their unions to expectwages to be tied to price level movements. They want to make sure thatthey have sufficient wage in order to maintain their standard of living, inthe face of rising prices. Employers also tend to consider basing wagesincrements on current cost of living, which is basically influenced byinflationary pressures, besides performance factors. Therefore workerstend to be paid not in relation to their real performance. Instead, they arebased on extraneous factors such as the agreed policy of automatic annualincrement, rising cost of living as suggested above, relative strength ofbargaining position of workers in certain industries, etc.
What we would like to see is that wages be based mainly on the workers'productivity, their real contributions towards organisational wealth andexpansion.
Ideally, wage rates growth should lag behind workers' productivitygrowth. It should not be mainly tied to inflation. It is widely andlogically believed that wage increases exceeding productivity increasewill fuel further inflation and erode competitiveness. Productivity-basedwage determination is called for, especially in tight labour marketconditions which Malaysia is facing now.
It is therefore, the intention of this paper to portray to what extent labourproductivity and inflation have influenced wage rates increases, andassess its effects on competitiveness of the manufacturing sector ofMalaysia.
125

FIG. 1.1: MANUFACTURING SECTOR, 1987-94Annual Growth of Added Value per Employee, Wage Rate and
Competitiveness Indicators
1987 1990 19911992 1993 1994
TABLE 1.1: MANUFACTURING SECTOR, 1987-94
1987198819B919901991199219931994
AVALUE/EMP2.997.24
11.04-1.33
9.54
10.087.39
14.10
W.RATE
-0.56-1.943.28
3.719.52
11.617.53
10.33
CPI0.802.502.803.104.404.703.60
3.70
A. VALUBL. COST4.03
10.037.26
-5.29-2.17-0.55
1.643.53
UNIT LAB COST-11.27-11.84-2.32
6.253.183.610.27
-7.98
F.ASSETS/EUP
-3.07
-6.36
-0.07
10.6717.0721.0613.3616.51
Source: NPC, based on Annual Industrial Survey, Department of Statistics.
126

DID WAGES GROWTH LAG BEHINDPRODUCTIVITY IN THE MORE RECENT YEARS?An analysis based on manufacturing sector's annual growth data showsthat added value per employee in nominal terms, which is a proxy forlabour productivity, grew positively in the years between 1987 and1994, (except in 1990 at -1.33 percent). It rose from 2.99 percent in 1987to 11.04 percent in 1989, declined in the following two years, and roseagain in 1992 (10.08 percent), dropping slightly in 1993 but doubled itsgrowth in 1994 (14.1 percent). This was possible to some extent due togrowth in investment in fixed assets per employee or capital intensity.
It is noticeable that productivity exceeded wage rate (for all employees)growth in 1987-89. In 1990 and 1993 productivity growth lagged slightlybehind wage rates growth. It can be seen that as wage rate rose, unitlabour cost growth kept rising from a negative rate of -11.27 percent(1987) to 3.61 percent (1992). Labour cost competitiveness (i.e. addedvalue per labour cost) fell from 4.03 percent (1987) to -0.55 percent(1992). It rose slightly in 1993 (1.64 percent), and were still slightly highin 1994 (3.53%).
Wage rate increases for semi-skilled workers were higher than for skilledworkers, indicating existence of tighter labour market. In 1986-88, theskilled workers' wages rose at -0.46 percent, while the wages forsemiskilled workers declined at -3.97 percent. In 1994, it was reversed,growing at 9.6 percent and 11.66 percent respectively. This is commonduring tight labour market conditions, whereby semi-skilled workers areoffered higher rate of wage increases to overcome shortage of skilledworkers.
Inflation, one of the determinants of rising wages, displayed rising trend,reaching its peak in 1992 (4.7 percent). However, it declined to 3.6percent in 1993 and rose slightly to 3.7 percent in 1994.
There are some general observations which can be outlined here.
1. In the period 1987-94, wage rate exceeded productivity fewer timesand at lower percentage points. Productivity (added value/employee)superceded wage rate growth five times and at higher percentagepoints.
127

FIG. 1.2 : CONSUMPTION GOODS INDUSTRIES, 1987-94Annual Growth of Added Value per Employee, Wage Rate,
Competitiveness Indicators and CPI Change
20 r-
15 -
•20 L1987 1992 1993 1994
TABLE 1.2: CONSUMPTION GOODS INDUSTRY, 1967-94
19B7
1963
1989199019911992
19931994
AVALUE/EMP
-0841704
160•700-0271312867768
WRATE264•093-050772544995794
1081
CPI060250
280310440470360370
A VALUE/L COST•2021950-035
-130515741186350
-305
UNIT LAB COST-551
-1731
12316691459490234
1065
F ASSETS£MP-426715-413024
421951643
1308
Source NPC, based on Annual Industrial Survey, Department of Statistics
128
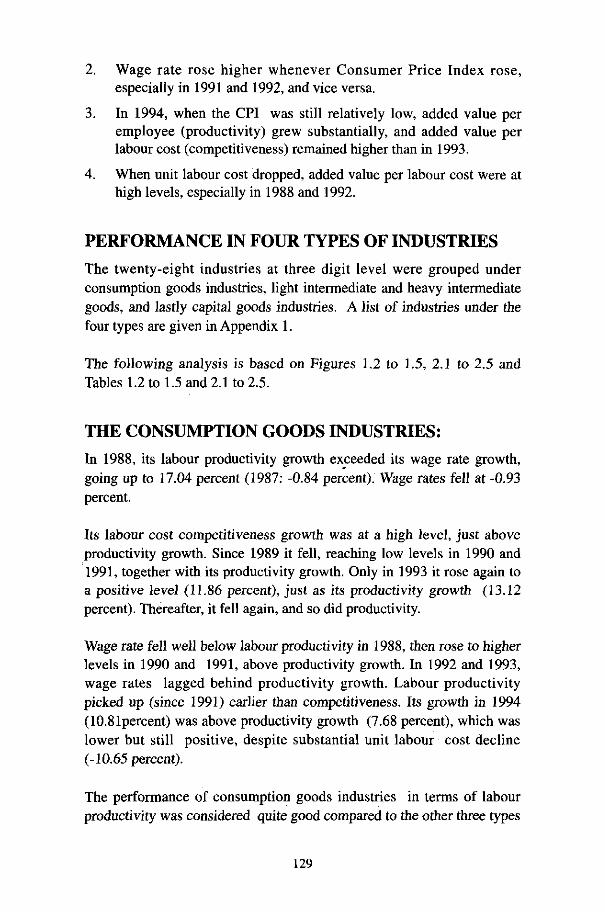
2. Wage rate rose higher whenever Consumer Price Index rose,especially in 1991 and 1992, and vice versa.
3. In 1994, when the CPI was still relatively low, added value peremployee (productivity) grew substantially, and added value perlabour cost (competitiveness) remained higher than in 1993.
4. When unit labour cost dropped, added value per labour cost were athigh levels, especially in 1988 and 1992.
PERFORMANCE IN FOUR TYPES OF INDUSTRIESThe twenty-eight industries at three digit level were grouped underconsumption goods industries, light intermediate and heavy intermediategoods, and lastly capital goods industries. A list of industries under thefour types are given in Appendix 1.
The following analysis is based on Figures 1.2 to 1.5, 2.1 to 2.5 andTables 1.2 to 1.5 and 2.1 to 2.5.
THE CONSUMPTION GOODS INDUSTRIES:In 1988, its labour productivity growth exceeded its wage rate growth,going up to 17.04 percent (1987: -0.84 percent). Wage rates fell at -0.93percent.
Its labour cost competitiveness growth was at a high level, just aboveproductivity growth. Since 1989 it fell, reaching low levels in 1990 and1991, together with its productivity growth. Only in 1993 it rose again toa positive level (11.86 percent), just as its productivity growth (13.12percent). Thereafter, it fell again, and so did productivity.
Wage rate fell well below labour productivity in 1988, then rose to higherlevels in 1990 and 1991, above productivity growth. In 1992 and 1993,wage rates lagged behind productivity growth. Labour productivitypicked up (since 1991) earlier than competitiveness. Its growth in 1994(lO.Slpercent) was above productivity growth (7.68 percent), which waslower but still positive, despite substantial unit labour cost decline(-10.65 percent).
The performance of consumption goods industries in terms of labourproductivity was considered quite good compared to the other three types
129

FIG. 13: LIGHT INTERMEDIATE GOODS INDUSTRIES, 1987-94Annual Growth of Added Value per Employee, Wage Rate and
Competitiveness Indicators
1989 1990 1991 1992 1993 1994
TABLE 1.3: LIGHT INTERMEDIATE GOODS INDUSTRY, 1987-94
19871988198919901991199219931994
AVALUE/EMP
7.94-2.6510.853.39
11.027.40
12.7116.56
W.RATE
•0.110.905.35
5.825.19
11.758.56
10.02
CPI0.802.502.80
3.104.404.703.60
3.70
A.VALUE/L.COST
8.33
-3.165.97
-3.083.61
-3.354.345.80
UNIT LAB COST-10.27-3.69-7.53
0.982.945.58
•0.30-4.12
F.ASSETS/EMP-6.13-2.0112.3131.4330.9729.2422.3917.95
Source: NPC, based on Amual Industrial Survey, Department of Statistics.
130
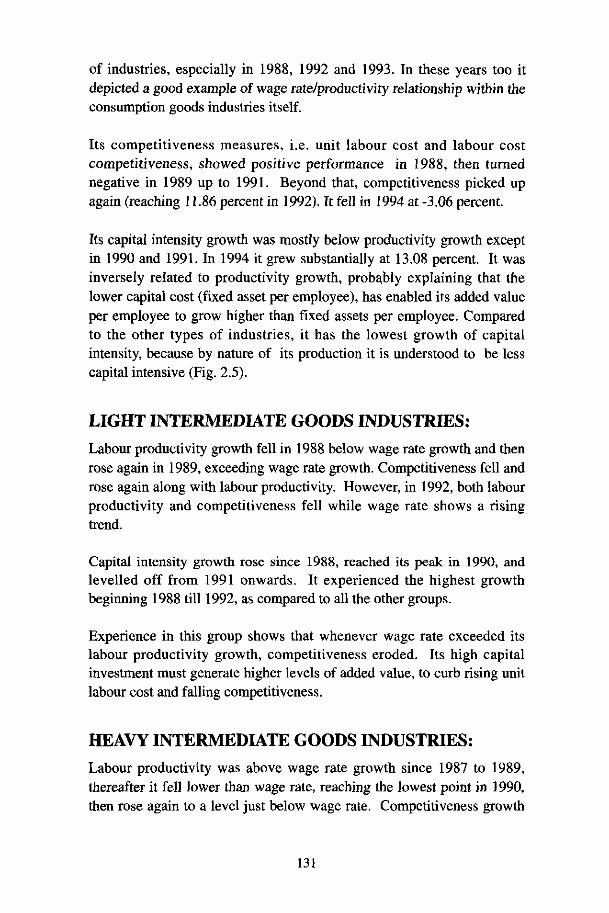
of industries, especially in 1988, 1992 and 1993. In these years too itdepicted a good example of wage rate/productivity relationship within theconsumption goods industries itself.
Its competitiveness measures, i.e. unit labour cost and labour costcompetitiveness, showed positive performance in 1988, then turnednegative in 1989 up to 1991. Beyond that, competitiveness picked upagain (reaching 11.86 percent in 1992). It fell in 1994 at -3.06 percent.
Its capital intensity growth was mostly below productivity growth exceptin 1990 and 1991. In 1994 it grew substantially at 13.08 percent. It wasinversely related to productivity growth, probably explaining that thelower capital cost (fixed asset per employee), has enabled its added valueper employee to grow higher than fixed assets per employee. Comparedto the other types of industries, it has the lowest growth of capitalintensity, because by nature of its production it is understood to be lesscapital intensive (Fig. 2.5).
LIGHT INTERMEDIATE GOODS INDUSTRIES:Labour productivity growth fell in 1988 below wage rate growth and thenrose again in 1989, exceeding wage rate growth. Competitiveness fell androse again along with labour productivity. However, in 1992, both labourproductivity and competitiveness fell while wage rate shows a risingtrend.
Capital intensity growth rose since 1988, reached its peak in 1990, andlevelled off from 1991 onwards. It experienced the highest growthbeginning 1988 till 1992, as compared to all the other groups.
Experience in this group shows that whenever wage rate exceeded itslabour productivity growth, competitiveness eroded. Its high capitalinvestment must generate higher levels of added value, to curb rising unitlabour cost and falling competitiveness.
HEAVY INTERMEDIATE GOODS INDUSTRIES:Labour productivity was above wage rate growth since 1987 to 1989,thereafter it fell lower than wage rate, reaching the lowest point in 1990,then rose again to a level just below wage rate. Competitiveness growth
131

FIG. 1.4: HEAVY INTERMEDIATE GOODS INDUSTRIES, 1987-94Annual Growth of Added Value per Employee, Wage Rate
and Competitiveness Indicators
•15 l_
1987 19S9 1990 1991 1992 1993 1994
TABLE 1.4: HEAVY INTERMEDIATE GOODS INDUSTRY, 1987-94
1987198B198919901991199219931994
AVALUE/EMP177872908
-737748943656
1708
WRATE-231061156356780978951954
CPI080250280310440470360370
A VALUE/I COST587835727
•1117035
-122-085646
UNIT LAB COST-797
•1085390705496666468
•524
FASSETS/EMP
-410•522•629895
1409239218442099 '
Source NPC, based on Annual Industrial Survey, Department of Statistics
132

at first exceeded productivity growth, and then it fell to the lowest levelin 1990. It picked up again but was well below productivity growth. Atits peak in 1988, and in 1989, labour productivity exceeded its wage rategrowth.
Capital intensity began rising since 1989 until it reached its peak in 1992.It is likely that the heavy investment in later years was unable to generatesufficiently large increases in added value yet, to maintain itscompetitiveness.
Again for this group, high level of competitiveness was experiencedwhen labour productivity growth exceeded wage rates growth. Finally in1992, its competitiveness was the lowest among the four groups andexperienced negative growth, due to high wage rate and low productivitygrowth (third after consumption goods and capital goods groups).
CAPITAL GOODS INDUSTRY:
Labour productivity growth exceeded its wage rate growth from 1987 to1990. Productivity was second lowest while wage rates growth was thehighest in 1992. Its competitiveness likewise grew at high levels until1989, but fell 1990 onwards. In 1992 it experienced lowest growth incompetitiveness among the four groups. This was probably due to itshigh growth in wage rate.
Wage rate growth exceeded labour productivity in 1991 and ended at thehighest position in 1992, compared to the other groups. Unit Labour Costwent up since 1990, and ended as the third highest in 1992. Capitalintensity rose since 1988, peaked in 1991, and then fell slightly.
In 1994, competitiveness remained positive at 2.65 percent growth whenproductivity growth exceeded wage rates growth.
Although it is a capital-intensive industry producing capital goods, itscapital intensity growth only came second after the light intermediategoods industry (Fig.2.5) in 1989-1991, and fourth after other types ofindustries in 1994. It was even lower than the average for manufacturingsector in 1994. More investment in fixed assets is called for to moderniseand improve added value generation.
133

FIG. 1.5 : CAPITAL GOODS INDUSTRIES, 1987-94Annual Growth of Added Value per Employee, Wage Rate
and Competitiveness Indicators
25 _
1987 19B8 1989 1990 1991 1992 1993 1994
TABLE 1.5: HEAVY INTERMEDIATE GOODS INDUSTRY, 1987-94
1987
1988198919901991199219931994
AVALUBEMP
295
560
1751
254
1233942
589263
WRATE
283-621543
029
13321230518
1007
CPI080250280310440
470
360370
A VALUE/L COST499
13151166135
-105•352249265
UNIT LAB COST20341286
•925007149503
-325-798
FASSETS/EMP-014-476884
121621611865
6641072
Source NPC based on Annual Industrial Survey, Department of Statistics
134

FIG. 2.1 :ANNUAL fcROWTH OF ADDED VALUEPER EMPLOYEE, 1987-94
Four Types of Industries and Manufacturing Sector
.,0 J987 1988 1989 1990 1991 1992 1993
TABLE 2.1: ANNUAL GROWTH OF ADDED VALUE PER EMPLOYEE
CONSUMPTION GOODS NDLIGHT INTERMEDIATE GOODS IHDHEAVY INTERMEDIATE GOODS INDCAPTTL GOODS INOUSTRESMANUFACTURING SECTOR
1987-0.84794
177
2,96
2,99
1968
17M
-2.65
872560724
19891.60
1095908
17511104
1990-7003.39•13!12.33954
1991
•027
1102
748
12,33954
199213.12740943942
1008
1993
8.67
1271
6,555.89739
1994788
16.56170612.63
1410
Source NPC, based on Annual hdustrial Survey Department ol Statutes
FIG. 2.2: ANNUAL GROWTH OF WAGE RATES, 1987-94Four Types of Industries and Manufacturing Sector
1987 1988 1989 1990 1991 1992 1993
TABLE 2.2: ANNUAL GROWTH OF WAGE RATES
CONSUMPTION GOODS INDLIGHT INTERMEDIATE GOODS NDHEAVY INTERMEDIATE GOODS IND
CAPmOtODSNDUSTHIESMANUFACTURING SECTOR
19872.64•011-1.69
-2.83
•056
1988
-0.93
090•6.24
•621194
1989•0.505354.695.43
3.28
19907725.82062
029
371
1991
6*4
5,19
133113.32952
1992955
1175
12.6312,3011*1
19939.96
B.566.795167.53
1994
108110.02
10 15
10071033
SOUKS NPG based on Annual Industrial Suvey Department of StateiKi
135
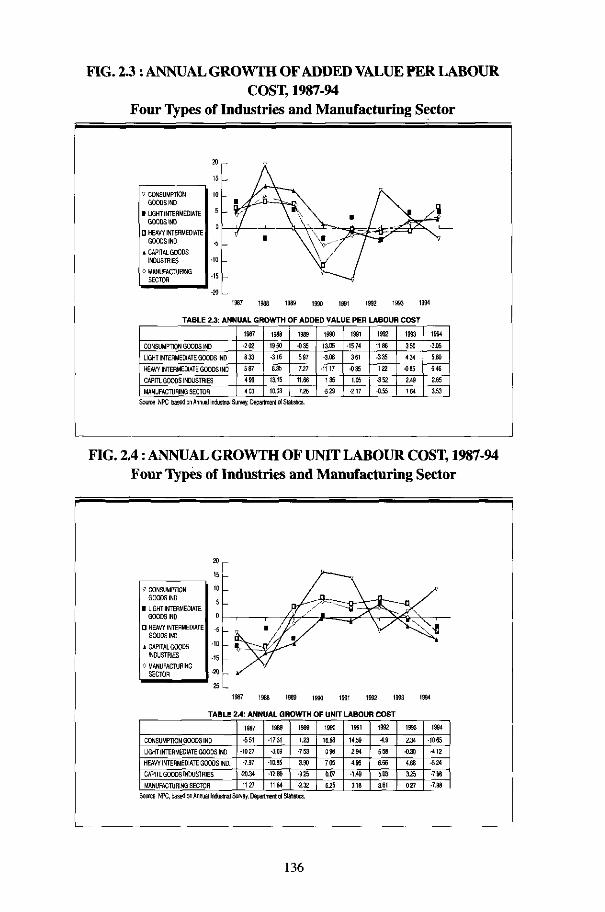
FIG. 23 : ANNUAL GROWTH OF ADDED VALUE PER LABOURCOST, 1987-94
Four Types of Industries and Manufacturing Sector
TABLE 2.3: ANNUAL GROWTH OF ADDED VALUE PER LABOUR COST
CONSUMPTION GOODS IND
LIGHT INTERMEDIATE GOODS INDHEAVY INTERMEDIATE GOODS IND
CAPITL GOODS INDUSTRIESMANUFACTURING SECTOR
1967
-202
833587499403
19881950-3168.35ins10.03
1989•036
5977.27
11.66
7.26
199013.05
-3.08
-1117
136
-529
1991-1574
361•036
1.05
•217
1992
1186.335
122
•352
-0.55
1993350
434
•085
2.49
164
1994
-3.055.80
646
2.65
3.53
Source MFC based on Annual Induslnal Survey, Department of Statsflcs.
FIG. 2A: ANNUAL GROWTH OF UNIT LABOUR COST, 1987-94Four Types of Industries and Manufacturing Sector
1987 1988
TABLE 2.4: ANNUAL GROWTH OF UNIT LABOUR COST
CONSUMPTION GOODS INDLIGHT INTERMEDIATE GOODS IND
HEAVY INTERMEDIATE GOODS IND.CAPIR GOODS INDUSTRIES
MANUFACTURING SECTOR
1987-551
-10 E7
-7.97
•20.34
1127
1988
-1731
•3.69
•10.85
-1286
1184
1989
1.23
•753
3.90-925•2.32
1990
16.580987050.076.25
1991
14.59
294
4,96-1.49318
1992
-4.9
558
6.66
5.03
3,61
1993
2,34
•0.30
4.68325027
1994
-1065-412-524-798-7.98
Source rVPC, based or Annual Industrial Suiwy, Department ot Slatstes.
136

FIG. 2.5: ANNUAL GROWTH OF FIXED ASSETS PEREM^LOyEE, 1987-94
Four Types of Industries and Manufacturing Sector
1987 1988 1989 1990 1991 1992 1993 1994
TABLE 2.3: ANNUAL GROWTH OF FIXED ASSETS PER EMPLOYEE
CONSUMPTION GOODS HO.LIGHT INTERMEDIATE GOODS IND.
HEAVY INTERMEDIATE GOODS ND.
CAPITL GOODS INDUSTRIESMANUFACTURING SECTOR
1987426-6.13-4.10-0.14-3.07
1966-7.15
-201
-5.22
-4.76
-6.36
1989
-4.1312.31
-6298.84
-0.07
19900.24
31.438.95
12.1610.67
1991
421
30.9714.0921.8117.07
1992
9.51
5.56
6.6618.6521 ,06
19936.43
•0.304.68S.S4
13.36
199413,08-4.12-5.2410.7216.51
Sou its NPC, based on Annual Industrial Survey, Department ol Statistics,
COMPARING PERFORMANCE OF THE FOUR TYPESOF INDUSTRIES IN 1986-88 AND 1992-94:Using geometric growth rates for manufacturing sector and the four typesof industries (consumption goods, light and heavy intermediate goods,and capital goods industries), it can be shown (as in Tables 3.1, 3.2, andFigures 3.1, 3.2) that in 1986-88 the wage rate grew slower than addedvalue per employee, unit labour cost fell, thus letting labour costcompetitiveness to rise at a positive rate of 6.99%. A similar feature isobserved in the case of the four groups of industries. Capital goodsexperienced the slowest growth of wage rate for all employees and unitlabour cost, but it has the highest growth in competitiveness (8.98%).
However, in 1992-94, the manufacturing sector, consumption goods,heavy intermediate goods and capital goods industries experienced a fallin labour cost competitiveness, due to faster growth in wage rates thangrowth in productivity. Only the light intermediate industry and capitalgoods experienced slower growth in wage rates compared to itsproductivity growth, and therefore it has a positive competitivenessgrowth of 0.11%.
137

FIG. 3.1: ADDED VALUE PER EMPLOYEE, WAGE RATE AND COMPETITIVENESS INDICATORSFour Types of Industries , Growth Rates 1986-88
i I
•-• n

cc&O58u
C0«
H
P5 S«£ w^o ^U** aa
SQ «g ctf< J3e sh o^ SHM OW "3 8^ *C•*• -^> %fcd -P
O o
l! I1^« =H o
Qid
A VALUE PER EMP
A VALUE/I. COST
5KL W. RATE
SEMISKW. RATE
TABLE 3!: ADDED VALUE PER EMPLOYEE, WAGE RATES AND COMPETITIVENESS INDICATORSFOUR TYPES OF INDUSTRIES, GROWTH RATES 1986
mNUF«u»*GSEcroflcowuMpraGocosm)IGHT Hig*MEtttIi KHXIS H)
lemNTEMWTEGOCCSI*CMItl GOODS INOSIDIES
»»UEPEftEMP111saw815
na
WMEMTt
10S8J?'»13
»TJ
E»
»V*UtLCOST•13S
IKon-OS
us
LCtsr.w112911
WJW
III
UMT L LffiT
31
IS
119Sffi
1M
MWRT!11miili'i4
US
»SKA HIEliftIS!
11 W
32
1816
SHIM HPC. trad w Annul lttSnil9nti.taH»Bil nl SBKta
139

In the above analysis, using annual growth and geometric growth rates ofthe two period of years (1986-88 and 1992-94), wage rates growthexceeded labour productivity growth in the more recent years, showingan alarming trend, since labour cost competitiveness was also indicating afalling trend. On the other hand inflation was showing an upward trend.
Consistently Rising Trends of Wages and Inflation
In the preceding analysis it was shown that wage rates seemed to berising with inflation. However, their relationships could not bequantified. A study by MIER [1], using manufacturing sector's data for alonger period of 1977-1994, found out that nominal wage rates tend to bemore strongly influenced by inflation (represented by percent changes inCPI), than by real labour productivity growth (measured by added valueper worker, in real terms). In the study, two regression equations wereused. In the first equation, percent change in nominal wages inmanufacturing sector is the dependent variable, while the independentvariables are inflation (percentage change in CPI), unemployment rate,real labour productivity (added value per employee in manufacturing),previous year's wage rates and a dummy variable for 1991 data (used tocorrect for outliers).
The Regression Equations:
i. w.
2. Pt
7.5213 + 0.9695 Pt - 1.2251 UNEMt + 0.3287 PRODt
(1.2364) (2.2742) (1.5841) (1.5376)
0.3407Wt.1 -f 9.068 DUM91
(1.994) (2.3354)
R* = 0.829 DW = 2.287 SAMPLE: 1977-94
3.0665 + 0.4967 GAP + 0.1605ULC + 0.2049 Pmt-1
(7.636) (4.363) (1.938) (1.959)
R = 0.797 DW = 1.709 Sample: 1977-94
140
For a one percent change in inflation, nominal wages increased by 0.97%(almost 1%), whereas for a one percent change in real productivity, itonly rose by 0.33%. Labour productivity did have some influence onwage rates, but it was not as strong as the impact of inflation.
Nominal wage rates are also influenced by previous year's wage rates, asindicated by its significant coefficient of 0.34. It shows workers andunions kept looking back at past wages in wage determination.
In the second equation inflation (prices) was used as the dependentvariable, while output gap (the difference between potential and actualGDP), unit labour cost and previous years' import price index are used asindependent variables. The coefficients for all variables were statisticallysignificant. A one percent increase in unit labour cost raises the inflationrate by 0.2 percent within a year, indicating the difficulty of passing oncosts to prices in an open economy like Malaysia. A one percent rise inoutput gap leads to 4.9 percent increase in domestic inflation. Output gaphas a stronger influence on inflation.
In the period of 1975-94,-productivity changes exceeded wage changes intwo periods, that is, in the period of 1975-78 and 1983-89. This is ahealthy trend. However, in 1985 and in the periods of 1979-82 and 1990-94, wage changes exceeded productivity changes. These gaps betweenproductivity and wages reached 14.55 in 1992, then fell to 7.98 in 1993and 1.58 in 1994. It shows a declining trend in the gaps, but wages arestill being paid in excess of productivity [2].
What is alarming us is that these positive gaps (wage changes beinghigher than productivity changes) are followed by increasing unit labourcost measured in foreign currency, indicating lower competitiveness.However this latter measure of unit labour cost improved from 21.68 in1992, to 6.34 in 1993 and slightly rose again to 9.07 in 1994.
These findings support the idea that wage rates in the Malaysianmanufacturing sector tend to be more strongly influenced by inflationthan labour productivity, and that the excess of wages over labourproductivity has lowered our competitiveness to some extent.
Should wage rates follow inflation?The mainstream idea is, ideally, wage rates should not be based on
141
inflation. Rather, it should be based on labour productivity orperformance. However, the current practice is both the workers andmanagement (employers) keep looking back at past wages, inflation andexpected wages, in order to maintain their living standard. While someconsideration should be given to inflation in determining wages, oneshould not fuel inflation further by overemphasising it, and ignoringperformance-based (productivity-based) consideration.
It is already proven in other countries, for example in Australia, [3] thatthe implementation of workplace productivity-bargaining has a positiveimpact on productivity and other performance and employee welfaremeasures.
CONCLUSIONThe relationships between wages, labour productivity and inflation in themanufacturing sector of Malaysia shown in the analysis of the data for1987-94 period and supported by the study for the period of 1977-94above, indicated that in general wage rates tend to be more stronglyinfluenced by inflationary presures than labour productivity growth. Ithas also been indicated that whenever wages growth exceededproductivity growth, unit labour cost in terms of local (in Ringgits) andforeign currencies went up, and labour competitiveness deteriorated.This is an undesirable trend.
However, in some years and in certain industry groups (for example, theconsumption goods industries in 1992) in the preceding analysis, wagesdid lag behind productivity resulting in positive competitivenessimprovement. So it was possible to attain this position in themanufacturing sector in the past, and it will be possible in the future.
It is imperative that Malaysia, especially the manufacturers, strivestowards higher levels of competitiveness by basing wages determinationon productivity growth.
While Malaysia has shown an impressive economic growth at 8.0-8.7%in 1990's and made relatively successful efforts in containing inflation,we can still improve further by upgrading productivity and consistentlypaying wages based on productivity performance, especially at thecorporate level in the manufacturing sector.
142
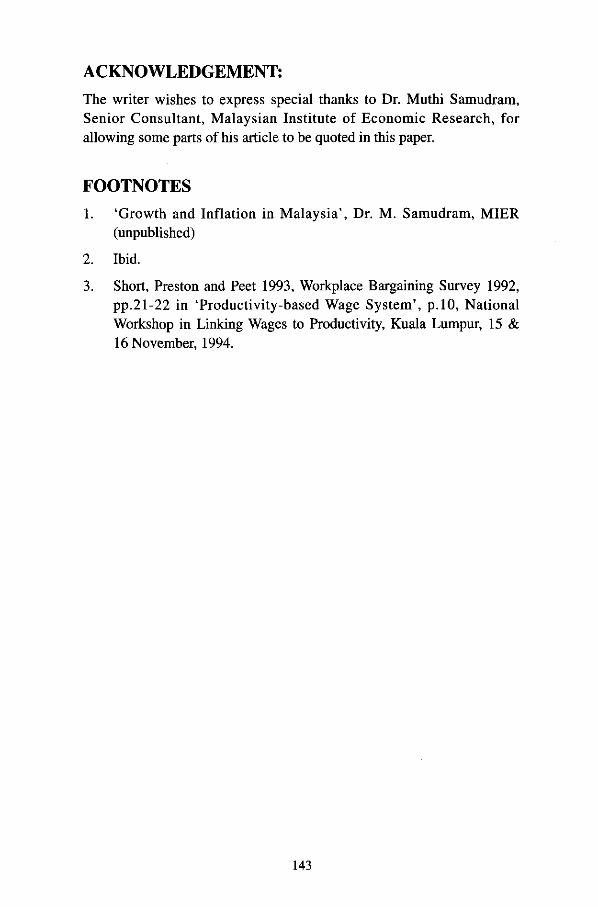
ACKNOWLEDGEMENT:The writer wishes to express special thanks to Dr. Muthi Samudram,Senior Consultant, Malaysian Institute of Economic Research, forallowing some parts of his article to be quoted in this paper.
FOOTNOTES1. 'Growth and Inflation in Malaysia', Dr. M. Samudram, MIER
(unpublished)
2. Ibid.
3. Short, Preston and Peet 1993, Workplace Bargaining Survey 1992,pp.21-22 in 'Productivity-based Wage System', p.10, NationalWorkshop in Linking Wages to Productivity, Kuala Lumpur, 15 &16 November, 1994.
143

APPENDIX 1The Four Types of Industries
1. Consumption Goods Industries:1.1 Food Manufacturing Industries1.2 Manufacture of Ice, Coffee, Tea, Meehon, Noodles, Spices,
Curry Powder, Strach, Prepared Animal Feeds & Others n.e.c.1.3 Beverage Industries1.4 Tobacco Manufactures1.5 Manufacture of Wearing Apparels except Footwear1.6 Manufacture of Footwear except Vulcanised or Moulded
Rubber or Plastic Footwear
2. Light Intermediate Goods Industries:2.1 Manufacture of Textiles2.2 Manufacture of Leather and Leather Products, Products of
Leather, Leather Substitutes and Fur, except Footwear andWearing Apparel
2.3 Manufacture of Wood, and Wood and Cork Products, exceptFurniture
2.4 Manufacture of Furniture and Fixtures, except Primarily ofMetal
2.5 Manufacture of Paper and Paper Products2.6 Printing, Publishing and Allied Industries
3. Heavy Intermediate Goods Industries:3.1 Manufacture of Industrial Chemicals3.2 Manufacture of Other Chemical Products3.3 Petroleum Refineries3.4 Manufacture of Miscellaneous Products of Petroleum and Coal3.5 Manufacture of Rubber Products3.6 Manufacture of Plastic Products, n.e.c.3.7 Manufacture of Pottery, China and Earthenware3.8 Manufacture of Glass and Glass Products3.9 Manufacture of Non-metallic Mineral Products3.10 Iron and Steel Basic Products3.11 Non-Ferrous Basic Industries
144

4. Capital Goods Industries:4.1 Fabricated Metal Products4.2 Manufacture of Machinery except Electrical Machinery4.3 Manufacture of Electrical Machinery, Apparatus, Appliances
and Supplies4.4 Manufacture of Transport Equipment4.5 Manufacture of Professional Equipment and Scientific and
Measuring and Controlling Equipment, n.e.c.
145

BIODATA
Awang bin Musa is Service Research Director at National ProductivityCorporation, Malaysia. He received his B. Soc., Sc. (Hons) from ScienceUniversity of Malaysia in 1977, and M.B.A from the National Universityof Malaysia in 1986. His PhD research at Aston University (1997),Birmingham, U.K., focuses on Japanese management transfer intoMalay si a-Japan strategic alliance companies.
146

THE PRACTICE OF PRODUCTIVITYAND QUALITY IMPROVEMENTTECHNIQUES IN MALAYSIA*
Awang bin MusaService Research Director
National Productivity CorporationMalaysia
ABSTRACT
This paper will explore the status of productivity and quality improvementtechniques which has been practiced within Malaysian industries andservice companies. A mail survey to 2,100 industries and servicecompanies was employed in December 1996. Firm surveyed were allfrom West Malaysia. Base on 7.5 percent response rate (i.e. 158responded companies), the study showed that nearly 43 percent ofcompanies still employed quality inspection. However, 60 percentclaimed that they practiced quality assurance activities, and more than40 percent of companies claimed that they had total quality managementprogrammes. For productivity management, more than 80 percent ofthem practiced productivity analysis. However, only a quarter of thembenchmark their productivity levels from year to year and benchmarkwith others.
The study also revealed that nearly two third of companies has beenadopting kaizen (continuous improvement) concepts and more than halfof them implementing productivity through team works philosophy.However, they were not fully supported by zero defects and right first timetargets and principles, as only 20 percent and 33 percent of respondentsimplemented them respectively.
Moreover, among implemented techniques, customer complaint was themost popular approach taken by companies and the least populartechniques was ISO 14000.
In terms of activeness, the most active techniques were quality meeting,conformance to quality standard, customer complaint, standard operatingprocedure and ISO 9000. The study also showed that some techniqueswhich had been implemented was not active. The least active techniqueswere BPR, ISO 14000, 3 M, CIM and VE.
* A paper presented at an International Conference on Quality Control Circle IICQCC'97],August 30 - September I, 1997, Beijing, China
147

It was also noted that those companies which implemented productivityand quality improvement techniques in their premises were mostly in late1980s and early 1990s.
1. IntroductionThe first quality control circle (QCC) recorded in Malaysia, in 1971,was with a Japanese multinational, Matsushita Co (M) Ltd.. Twelveyears later (1983), as an outcome of government Look East Policy-LEP (where Japan and Korea has taken as model and partner forMalaysian development and industrialisation process), the PrimeMinister of Malaysia launched a National Productivity Seminar andQuality Campaign. This was the turning point for a mass quality andproductivity revolution within companies and government agencies.
To what extent the techniques propogated has been practiced withinindustries since the commencement of campaign? What are the mostpopular techniques has been applied? How far the claimedtechniques are active? When were they introduced within firms? Thepaper shall explore and answer those questions.
2. Research methodologyA mail survey was employed to reach 2,100 companies. A structuredquestionnaires were sent to 1,200 manufacturing and 900 servicecompanies throughout West Malaysia. The sample frame wasderived from the Federation of Malaysian Manufacturer and NPC'sService Directories. The questionnaires was first tested and modifiedbefore the actual survey was launched. 7.5 percent (158) of themreplied. The primary informant for the survey was quality manager.The data was then processed by using SPSS package, wheredistribution, mean and cross tabulation analysis were employed.
3. Profile of companies.
3.1 The geo-economy distributionAlmost two third of the samples were from the most dynamicthree geo-economic regions; Klang Valley, Johor and Penang.The first is the most dynamic economic valley of Malaysia. Inthe early days it was one of the richest tin belts. The later twoare located in regional strategic economic growth triangles ofThailand-Medan-Penang and Bantam-Singapore-Johor. Thedetail of it is in Figure 1.
148
FIGURE 1: COMPANIES BY GROWTH CENTRES
Distribution by Region33.5%
15.8%
3.2 Economic sectors
In terms of economic sectors, 76 percent (120) weremanufacturing, and 24 percent (38) were services. Thedistribution of samples according to sectors is shown in Figure2.
FIGURE 2: SECTOR
Distribution by Sectors
24.0%
ManufacturingServices
149
3.3 Capital structure
The survey samples comprised of 26 percent of small andmedium industries and 74 percent big companies. More thanhalf of samples were companies with paid up capital betweenRM 2.5 to 5.0 million. In Malaysia any company with capitalof less than RM 2.5 mil l ion is categorised as small and mediumi n d u s t r y , and those capi ta l which is more than that isconsidered as big. The distribution by capital is in figure 3.
FIGURE 3: CAPITAL STRUCTURE
Capital Structure
3.4 Distribution of EmployeesA majority of 78 percent of samples had employees more than101. Nearly half of samples had workers between 101 to 500and nearly one third of samples had workers more than 501. Itreflects a high usage of labour in manufacturing and servicefirms. The actual distribution is in figure 4.
FIGURE 4: DISTRIBUTION OF EMPLOYEES
Distribution of Employees
150
3.5 Market outletThe study revealed that 35 percent of them exported theirproducts more than 90 percent and more than half of themexported 51 percent of their products. It shows that half ofsamples were export oriented companies. On other hand, 27percent of them marketed their products 70 to 99 percentlocally. Moreover, 11 percent of samples said that theirproducts were marketed 100 percent locally. For moreinformation see figure 5.
FIGURE 5: MARKET OUTLET
Local Market
27.0%
4. Productivity and quality practices analysis4.1 Total quality management (TQM)
As the result of productivity and quality campaign embarked in1983, the survey found out companies has been moving awayfrom conventional quality inspection to quality assurancestages. There were also a positive quality movement wheremany companies are started to implement TQM. Thedistribution of companies implemented quality inspection,quality assurance and TQM were 43 percent, 60 percent and 41percent respectively, as detailed in figure 6.
151
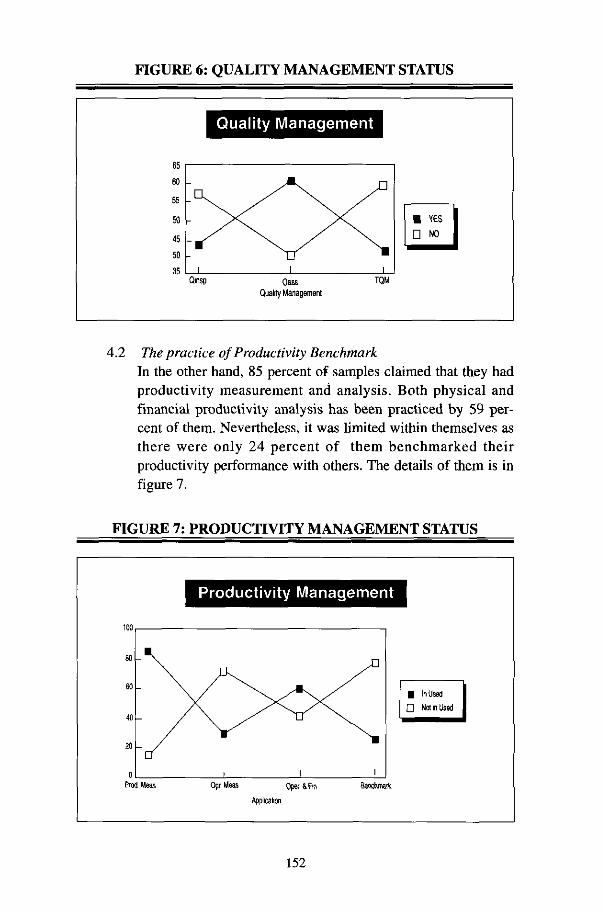
FIGURE 6: QUALITY MANAGEMENT STATUS
Quality Management
YES
D
Qinsp TQMQuality Management
4.2 The practice of Productivity BenchmarkIn the other hand, 85 percent of samples claimed that they hadproductivity measurement and analysis. Both physical andfinancial productivity analysis has been practiced by 59 per-cent of them. Nevertheless, it was limited within themselves asthere were only 24 percent of them benchmarked theirproductivity performance with others. The details of them is infigure 7.
FIGURE 7: PRODUCTIVITY MANAGEMENT STATUS
Productivity Management
100
0Prod Meas Oper 8 Fin Benchmark
Application
152

For those who did not have productivity exercise, 68 percent ofthem planned to have their productivity analysis in future.However, 32 percent of them still has no plan to do so.
In implementing it, 60 percent of them critically evaluatedthem, took some corrective actions (87 percent), use it as abase for productivity planning, (67 percent), does somereinforcement (45 percent). However, only 30 percent of themhad a gain sharing with their employees.
4.3 Productivity and Quality Improvement ConceptsThe study revealed that 63 percent companies adopted kaizenand 57 percent applied productivity teamworks principles.Nevertheless, only 33 percent of them practiced right first timeand 20 percent with zero defect concepts. The comparativepractices are shown in figure 8.
FIGURE 8: THE PRACTICE OF IMPROVEMENT CONCEPTS
Improvement Concept
• Kaizen0 Team Work
CH Right FirslTimeLH Zero Defect
Never Used No Answer
4.4 Improvement Techniques ApplicationCompanies were asked on the existence of 27 improvementtechniques within organisation. They had to state the threeappropriate utilisation stages; never used, in use and beingimplemented/ used for each technique. The survey revealedthat there were not even single techniques which had beenapplied by all respondent. The most popular techniques appliedwas customer complaint (67 percent in used), followed by
153
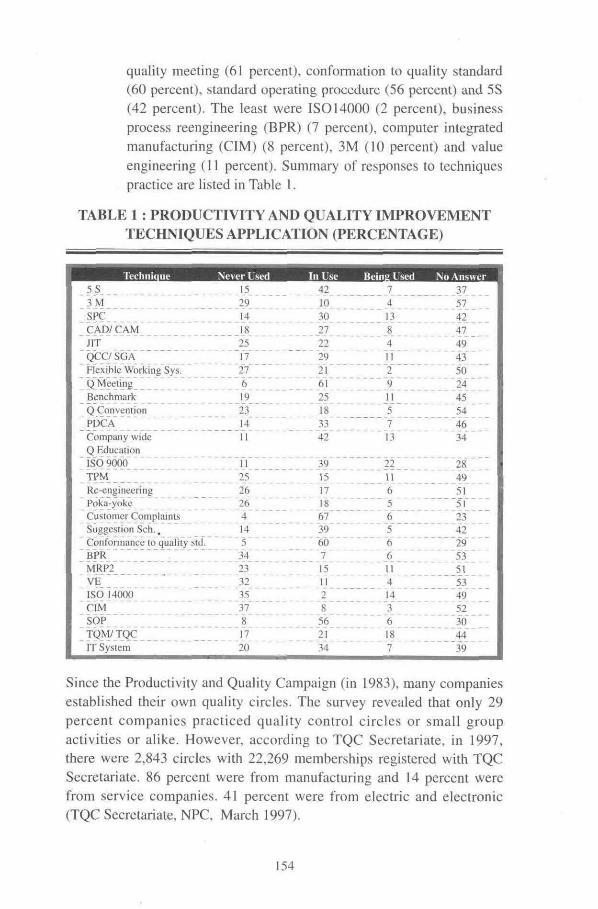
quality meeting (61 percent), conformation to quality standard(60 percent), standard operating procedure (56 percent) and 5S(42 percent). The least were ISO 14000 (2 percent), businessprocess reengineering (BPR) (7 percent), computer integratedmanufacturing (CIM) (8 percent), 3M (10 percent) and valueengineering (11 percent). Summary of responses to techniquespractice are listed in Table 1.
TABLE 1 : PRODUCTIVITY AND QUALITY IMPROVEMENTTECHNIQUES APPLICATION (PERCENTAGE)
Technique5S3MSPCCAD/ CAMJITQCC/ SGAFlexible Working Sys.Q MeetingBenchmarkQ ConventionPDCACompany wideQ EducationISO 9000TPMRe-engineeringPoka-yokeCustomer ComplaintsSuggestion Sch. .Conformance to quality std.BPRMRP2VEISO 14000CIMSOPTQM/TQCIT System
Never Used15291418251727619231411
112526264145342332353781720
In Use421030272229216125183342
391517186739607151128562134
7413841129115713
22116565661141436187
375742474943502445544634
284951512342295351534952304439
Since the Productivity and Quality Campaign (in 1983), many companiesestablished their own quality circles. The survey revealed that only 29percent companies practiced quality control circles or small groupactivities or alike. However, according to TQC Secretariate, in 1997,there were 2,843 circles with 22,269 memberships registered with TQCSecretariate. 86 percent were from manufacturing and 14 percent werefrom service companies. 41 percent were from electric and electronic(TQC Secretariate, NPC, March 1997).
154

The survey also showed that there were 62 companies (39 percent) whomade an effort to be certified with ISO 9000 certification. The qualityrevolution has lead private and public sectors in Malaysia to make stepsto be recognised internat ional ly through ISO 9000 cert if ication.According to Standard & Industrial Research Institute of Malaysia(SIRIM), in 1997, there were 1,058 companies had ISO 9000 registeredwith S1R1M as compared to only 5 in 1988. 90 percent were frommanufacturing and 10 percent were service companies. 26 percent werefrom electronic and telecommunication (SIRIM, 28 February 1997).
4.5 The activeness of the techniques choosedHow far those techniques implemented were active? The survey showedthat only four techniques were claimed to be active by 50 percent ofrespondent namely; conformation to standard, quality meeting, customercomplaint management and standard operating procedure. The leastactive technique was ISO 14000. The status of activeness for alltechniques are shown in Table 2.
TABLE 2: PRODUCTIVITY AND QUALITYTECHNIQUES ACTIVENESS (PERCENTAGE)
^^^^^^™^™5S3MSPCCAD/ CAMJITQCC/ SGAFlexible Working Sys.Quality MeetingBenchmarkQuality ConventionPDCACompany wide Q EducationISO 9000TPMRe-engineeringPoka-yokeCustomer ComplaintsSuggestion Sch.Conformance to quality std.BPRMRP2VEISO 14000CIM ^SOPTQM/TQCIT System
. Active41828251927185725182842491313165627586151078
512032
Not Active and No Answer599272758173824375827258518787844473429485909392498068
155

4.6 Productivity & Quality Improvement InfrastructureWith regards to the establishment of improvementinfrastructure, 61 percent of samples claimed that they hadquality organisation, 61 percent had quality policy, 68 percenthad quali ty inspectors/auditors. However only 24 percentclaimed that they had R&D budget and 24 percent had qualitybudget. The study also showed that 58 and 62 percent of themhad product ivi ty p lanning and had qua l i t y planningrespectively. The summary of them are shown in Table 3.
TABLE 3: IMPROVEMENT INFRASTRUCTURE
^OrganisationQuality PolicyQuality OfficeQuality Auditor/InspectorR & D BudgetP & Q Budget
Never Used13141812
3934
111 1st- I
61615368
2424
ttiii!> Inmlenieiited15141210
1722
11111719
2020
The study showed that although there were positive signs thatmany companies had their improvement infrastructure,nevertheless, the study showed that they were lack of financialsupports.
4.7 Productivity and quality improvement committeeFurthermore, the study revealed that 13 percent samplesclaimed that they did not have P&Q improvement committeestaff at all. However, 30 percent samples said that they hadtheir committee staff proportion which was less than 10 percentof their total employees. The details of the distribution is inFigure 9.
FIGURE 9: P&Q IMPROVEMENT COMMITTEE
P&Q Improvement Committee
156

The Implementation YearsMoreover, the study showed that there were very lit t letechniques which were implemented before 1980 such asconformance to quality standard (3 percent), standard operatingprocedure (3 percent), customer complaint (2 percent),suggestion scheme (1 percent) and company wide quali tyeducation (1 percent). The implementation of varioustechniques has been massively taken place only after 1985 andearly 1990s. The implementation trend are shown in Table 4.
TABLE 4 : IMPLEMENTATION YEARS(IN PERCENTAGE)
5S3MSPCCAD/ CAMJITQCC/ SGAFlexible Working Sys.Quality MeetingBenchmarkQuality ConventionPDCACompany wideQuality EducationISO 9000TPMRe-engineeringPoka-yokeCustomer ComplaintsSuggestion Sch.Conformance to quality std.BPRMRP2VEISO 14000CIMSOPTQM/TQCIT System
Before1980
0000000000I0
000021300000300
1980 to'1984
012002030111
000131301000111
1985 to1989
404113251433
111253411000311
1990 to199U
163101210136201091217
228673011231641420910
1995 and
17313758516103816
28994913759692151212
No •
639371808474875679837563
498284865171609383909094587776
The study revealed that on everage, 76 percent of companiesdid not answer either because of they did not implement thetechniques or did not remember when they embarked theirimprovement techniques.
157

5. The limitation of the researchThe findings of the study could not be generalised for the whole ofMalaysia, as the sample taken were confined to FMM list and NPCService Companies Directory. However, it can give some indicationon the patern of improvement technique practiced within Malaysiancompanies. The study also failed to get maximum answer for theimplementation year and the impacts of the techniques onproductivity and quality levels.
6. Potential future researchThe same study will be carried out periodically to see the trend oftechniques applied. The study results are useful for both thecompanies and government so that they could adjust their strategiesto make Malaysian companies more competitive.
7. ConclusionThe study showed that there are positive trend on the usage ofproductivity and quality improvement techniques within companies.However, there are needs to link the improvement programmes tototal business plans. There are significant demand too for financialand infrastructure support. Furthermore, programmes adoptedshould be integrated in their implementation.
158

REFERENCE
1. Bossink, B.A.G., Gieskes, J.F.B. & Pas, T.N.M. (1992), 'DiagnosingTotal Quality Management Part I', Total Quality Management, vol.3,no.3,pp.223-231.
2. Chen, F. (1992), 'Survey on Quality in Michigan Firms',International Journal of Quality & Reliability Management. Vol.9,no.4, pp. 46-52.
3. Oliver, N. and Wilkinson, B. (1992), The Japanization of BritishIndustry'. Oxford, Blackwell Publishers.
159

BIODATA
Sabitha Marican is currently a senior lecturer at UUM. Obtained herBachelor's Degree from Point Park College in 1985 and Master's (PublicAdministration) from the Pittsburgh University, Pennsylvania in 1987.Areas of speciality are 'Public Policy', Conflict Management and 'CareerDevelopment'. Has written some articles on management and publishedin several magazines and local newspapers. Has also produced severalbooks such as 'Hubungan Manusia Dalam Organisasi' and PengurusanMasalah dan Penyelesaian'.
160
ANALISIS TERHADAP PERKAITANSTRESS DAN KEPUASAN KERJA DIKALANGAN PENTADBIR WANITA:
CABARAN DAN PROSPER
Sabitha MaricanSekolah Pembangunan Sosial
Universiti Utara Malaysia
PENGENALANPenglibatan wanita dalam tenaga kerja bukan lagi satu mitos tetapi saturealiti. Hampir 50% dari jumlah penduduk Malaysia terdiri daripadakaum wanita dan mereka merupakan potensi sumber pembangunan yangpenting dalam meningkatkan produktiviti negara. Menurut Pejabat BuruhAntarabangsa (ILO) yang berpusat di Geneva, menjelang tahun 2000, 31peratus daripada gunatenaga bagi negara sedang membangun adalahwanita. Maka fenomena stress akan merupakan salah satu daripada kesanyang akan di alarm oleh wanita dwi kerjaya di masa-masa akan datang.
Kejadian stress di tempat kerja boleh dilihat sebagai reaksi individuterhadap ciri-ciri kerja yang kelihatan meijggugat dirinya. lamenunjukkan padanan yang kurang sesuai antara keupayaan individu danpersekitaran kerja yang mana individu dibebankan dengan pelbagaipermintaan (French, 1963). Punca stress juga boleh berpunca daripelbagai faktor sama ada dari tempat kerja seperti kerja berlebihan,kurang kerja, kesamaran kerja, struktur organisasi, konflik peranan(Gmelch, 1982; Caplan 1972; Gupta dan Beer, 1979) ataupun bukanberpunca dari tempat kerja seperti ciri-ciri personal, interpersonal dankeluarga (Near, 1984). Kedua-dua unsur stress yang berpunca daritempat kerja dan bukan kerja mempunyai perkaitan rapat dengankepuasan kerja. (Mitzberg, 1973; Neat, et. al. 1984; Gelmch, 1982).Malahan kajian menunjukkan bahawa hubungan dan kesan faktor-faktordi tempat kerja dan bukan kerja tidak boleh dilihat secara berasingan(Rensha, 1976).
Sehubungan dengan tugas pentadbir," kajian oleh Edwbrugon Fuiermendapati bahawa 83% pengurus mempercayai bahawa kebanyakan
161

stress yang dialami oleh mereka berpunca dari tempat kerja. Walaupundemikian, 30% mendapati stress tidak berpunca dari tempat kerja.Namun kajian yang melihat perkaitan antara stress dan sokongan sosialmenunjukkan bahawa sistem sokongan yang berkaitan dengan peranankeluarga boleh mengurangkan kesan stress yang berkaitan dengan kerjadan mampu meningkatkan kepuasan kerja. (La Rocco, et. al 1980.Thoits, 1982). Oleh yang demikian, seorang pengurus yang holistik danberkesan adalah mereka yang berjaya mengimbangkan antara di tempatkerja dan bukan berunsur kerja (Albrecht, 1979; Greiff, et.al. 1980)).
Secara umumnya dari kajian ini kita dapat melihat pentadbir menghadapistress dari pelbagai faktor. Fungsi seorang pentadbir yang perlumemainkan pelbagai peranan yang mana tugasnya (Stryker, 1957)melibatkan membuat keputusan, pelaksana, pengawal, pemupuk,pendisiplin, membuat dasar, dan orang tengah antara pengurusan atasandan bawahan. Ini menjadikan mereka seperti terperangkap (Gmelch,1977, Likert, 1961) dalam usaha menjalankan tugas mereka dengan baikdi samping memuaskan kehendak orang atasan dan bawahan.Tanggungjawab ini membuat mereka terpaksa berhadapan dengan stressyang tinggi. Namun setiap organisasi memerlukan pentadbir dalammelaksana dan menguasai perjalanan sesebuah organisasi. Oleh yangdemikian punca stress harus dikenalpasti agar ianya dapat dikawal untukmembantu pentadbir berfungsi dengan baik.
IMPAK STRESSKajian menunjukkan kesan stress yang negatif bukan sahaja akanmenjejaskan individu tetapi akan melibatkan kos yang tinggi bagiorganisasi. (Schuler, 1980). Jika dilihat dari aspek kesan stress ke atasindividu wanita dilaporkan mengalami kesan psikologi yang lebih ketarajika dibandingkan dengan kaum lelaki. Kesan ini wujud dalam bentukkebimbangan (Davidson & Cooper, 1985), kemurungan (depression)(Clearly & Mechanic, 1983; O'Neil & Zeichner, 1985) dan masalahuntuk tidur (Cox, Thirlaway & Cox, 1984; Zappert & Weinstein, 1985).Kesan dalam bentuk fizikal pula ialah wanita melaporkan masalahkesihatan yang lebih tinggi meliputi aspek (Cox, et. al., 1985) kerapmengalami sakit perut (Zappert & Weistein, 1985) dan kerap mengalamisakit kepala (Davidson & Cooper, 1985) jika dibandingkan dengan lelaki.Seterusnya kajian Jick dan Mintz (1985) menunjukkan kesan wanita lebih
162

kerap mengalami kesan stress yang berunsur psikologi (contoh: perasaanmurung, hati yang tidak tenang). Manakala pentadbir lelaki pulamengalami stress yang lebih berunsur fizikal iaitu sakit jantung, sakitbuah pinggang dan sepertinya. Dengan yang demikian wanita lebihcenderung menggunakan strategi dengan tindakan yang berunsur mencarisokongan sosial untuk tujuan emosi, berserah pada agama dan pemisahtingkah laku. Manakala pentadbir lelaki lebih cenderung dalammenggunakan strategi daya tindak yang berunsur alkohol/ubatan.
Walaupun kaum lelaki semakin ramai membantu dalam kerja rumah(Pleck, 1985), namun sumbangan wanita adalah jauh lebih banyak dalammenjaga anak dan mengurus rumah selain mempunyai kerjaya. (Berch,1982; Coverman, 1983). Ada kajian di Sweden menunjukkan bahawawalaupun pekerja lelaki diberikan cuti ketika isteri bersalin, namun satudaripada lima pekerja lelaki sahaja yang menggunakan insentifsedemikian (Svenska Institute, 1987). Di Norway pula, walaupun pekerjalelaki memendekkan masa bekerja mereka selama 5 hari dalam seminggunamun bantuan dari segi kerja rumah meningkat hanya sebanyak 12 minitsehari, dan yang selebihnya menjadi masa rehat. (Lingsom danEllingsaeter, 1983). Walaupun demikian, kajian juga menunjukkanbahawa perkahwinan boleh merupakan satu bentuk sokongan bagimenangani stress, dan secara langsung mengurangkan tekanan yangdihadapi oleh individu (Thoits, 1982).
HASIL KAJIANKajian ini bertujuan melihat punca-punca stress di kalangan pentadbir, disamping melihat punca stress yang manakah lebih ketara di kalanganpentadbir wanita jika dibandingkan dengan kaum lelaki. Kajian inimenggunakan rekabentuk tinjauan keratan rentas (Cross-SectionalSurvey). Data diperolehi dengan menggunakan ukuran Minnesota JobSatisfaction Questionnaire (MSQ) diperolehi dari soal selidik AssessingStressors, oleh Gmelch (1977).
Responden dalam kajian ini merupakan pentadbir terdiri daripada 73.8%pentadbir lelaki dan pentadbir wanita sebanyak 26.2%. Manakala 80%adalah responden bangsa Melayu, 10% adalah Cina, 8.5% adalah Indiadan 1.5% mengandungi bangsa-bangsa lain. Populasi dalam kajian inijuga merangkumi 90.3% telah berkahwin dan 69% mempunyai bilangananak 2 hingga 5 orang dan 17.5% tidak mempunyai anak.
163

JADUAL1: UJIAN UNTUK JANTINA DAN ANGKAUBAHKEPUASAN KERJA DAN PUNCA STRESS
ANGKAUBAHBERSANDAR
Kepuasan Kerja
Rumah
Kerja
Lebih
Kurang
Samar*
Struktur*
Konflik*
Urus
Jalan*
Inter
Personal
Keluarga
MIN/SP
LELAKI
74 42/12 62
29 64/3 46
19 36/5 44
14 92/3 42
14 32/4 14
12 66/3 91
1220/231
16 57/5 01
15 35/3 861
3 58/3 72
23 56/6 28
27 04/5 6
32 48/6 45
WANTTA
74 74/9 29
34 26/3 88
20 07/5 41
14 33/4 1
15 37/5 26
1533/465
1462/390
1835/525
1392/346
14 93/4 74
22 35/5 87
27 11/609
35 26/6 55
N
L
66
76
76
76
75
75
75
75
74
75
75
75
75
W
27
27
27
27
27
27
27
27
27
27
27
27
27
T
-0117
-2176
05904
07225
-10490
-2134
01163
-3051
00955
-216
08847
-0 0549
-3561
P
09066
00413*
05564
04717
02967
00313*
0 0326*
00025*
05360
00495*
0378
0956
0016*
Hasil kajian menunjukkan bahawa tidak ada perbezaan signifikan aspekkepuasan kerja antara pentadbir lelaki dan wanita. Namun kajianmendapati bahawa terdapat perbezaan yang signifikan dalam aspekpunca-punca stress dari aspek rumahtangga/persekitaran, kesamaranperanan, struktur organisasi, konflik peranan, perjalanan dankeluarga/penbadi. Secara umumnya dtdapati bahawa pentadbir wanitalebih cenderung menghadapi punca stress dari dua aspek iaitu dari tempatkerja yang berpunca dari kesamaran peranan, konflik peranan danstruktur organisasi. Manakala dari aspek luar organisasi ialah yangberpunca dari persekitaran rumahtangga dan keluarga/peribadi.
Seterusnya hasil kajian ini akan dibincangkan dalam dua aspek iaitupunca stress berunsur persekitaran keluarga dan kedua dari aspek kerjaya.
(i) Punca-punca Stress dari Aspek Persekitaran Keluarga
Antara punca stress yang mempunyai perkaitan signifikan denganstress adalah yang berkaitan dengan keluarga. Dalam hubungantanggungjawab keluarga, kajian juga menunjukkan bahawawalaupun wanita telah mula mengambil tanggungjawab sebagaipencari rezeki tetapi kaum lelaki masih kurang memberi sumbangan
164

dalam berkongsi kerja domestik. (Voydanoff, 1988). MalahanFreedman dan Phillips (1988) mengutarakan bahawa faktoi; stressyang berkaitan dengan kerjaya dan keluarga akan menjadi lebihmeruncing pada tahun 1990an. Mengikut kajian di Britain(Davidson & Cooper, 1985, Wiley & Eskilson, 1988) penguruswanita melaporkan stress yang lebih tinggi dari pengurus lelaki dariaspek tekanan dalam usaha mengimbangkan antara kerjaya danrumahtangga (Zappert & Weinstein, 1985).
Dalam kajian ini antara punca pentadbir wanita lebih cenderungmenghadapi stress dari aspek keluarga disebabkan tiada masa untukbermesra bersama keluarga, dan kurang rehat dan terpaksaberkongsi kerja rumah. Seterusnya pentadbir wanita juga lebihcenderung menghadapi stress dari aspek keluarga yang manamereka rasakan kurang masa untuk mereka berinteraksi denganorang lain atau melakukan satu-satu hobi yang digemari.Sehubungan dengan itu juga, mereka lebih cenderung terganggudengan masalah keluarga seperti dengan anak-anak, mertua, masalahsuami, isteri, menjaga yang tua atau yang berpenyakit dalamkeluarga.
Selaras dengan basil kajian ini, kajian Basset, (1985) menunjukkanbahawa kebanyakan kerja rumah dilakukan oleh wanita. Seterusnyahanya 10% daripada suami dalam keluarga sahaja didapatimenolong isteri secara sama rata dalam melaksanakan tugasan dirumah dan wanita meluangkan lebih banyak waktu dibandingkandengan lelaki untuk membuat kerja rumah dan tanggungjawabmengasuh anak (Yogev, S., 1981).
Oleh yang demikian, tanggungjawab terhadap keluarga meletakkanindividu tersebut dalam keadaan "sandwich generation" di manabeliau berhadapan dengan cabaran dwi kerjaya iaitu keluarga dankerjaya. Ini disebabkan masalah yang timbul dalam keluarga akanturut memberi kesan kepada kerjaya individu. Apabila kedua-duakeadaan ini mula bermasalah, ia akan lebih menekan individu. Inikerana kedua-dua situasi dan peranan tersebut adalah salingmempengaruhi.
Walaupun terdapat kajian yang menunjukkan bahawa tidak adaperbezaan yang signifikan dalam tahap kepuasan kerja antara
165
pentadbir wanita dan lelaki, namun terdapat kecenderungan untukwanita menghadapi stress dari beberapa aspek tanggungjawab ditempat kerja. Namun kajian oleh Valdez, dan Gutek, (1987)menunjukkan wanita yang menghadapi stress disebabkan olehlebihan kerja atau konflik peranan dapat diseimbangkan olehganjaran yang mereka dapati dari melaksanakan kerja-kerja rumahdan menjaga anak. Ini seterusnya disokong oleh kajian tersebutyang menyatakan bahawa wanita yang berkahwin dilaporkanmempunyai kepuasan kerja yang tinggi jika dibandingkan denganmereka yang belum berkahwin.
(ii) Punca-punca Stress dari Aspek Persekitaran Kerja SecaraUmum
Hasil kajian menunjukkan punca stress dari aspek strukturorganisasi adalah lebih ketara di kalangan wanita jika dibandingkandengan kaum lelaki. Pentadbir wanita dalam kajian ini merasakanbahawa mereka mempunyai sedikit sahaja hubungan langsungdengan penyelia. Dan pengurusan atasan seringkali tidak begitumudah menerima peringkat bawahan. Selain dari itu terlalu banyakperaturan dan polisi yang tidak mengizinkan mereka membuatkeputusan atau menggunakan idea mereka sendiri secara bebas.Undang-undang dan peraturan baru sering memerlukan merekamengubah cara mereka melakukan sesuatu. Pentadbir wanita jugamendapati organisasi mereka terlalu berhirarki.
Jika diteliti, hasil kajian itu didapati selaras dengan kajian-kajianyang lepas. Sebagai contoh ada yang menyatakan bahawa faktorstruktur organisasi adalah salah satu sebab yang menyebabkan tidakramai wanita yang boleh meningkat dalam kerjaya mereka. (Kanter,1977, Jack & Mintz, 1985). Malahan wanita kurang diberikanpeluang untuk menunjukkan keupayaan mereka dan dengan inimemberikan kesan terhadap peluang kenaikan pangkat. (Sherman et.al., 1987,Terborg, 1977).
Sehubungan dengan pendapat itu Friedman (1988) mengutarakanbahawa faktor-faktor "bias" dan "stereotaip" terhadap wanita turutmenghalang wanita untuk meningkat dalam kerjaya mereka dariaspek pentadbiran. Kajian mendapati bahawa wanita yang inginmenyandang jawatan yang lebih tinggi selalu terhalang disebabkantanggapan yang negatif terhadap mereka. (Burahill dan McPherson,
166
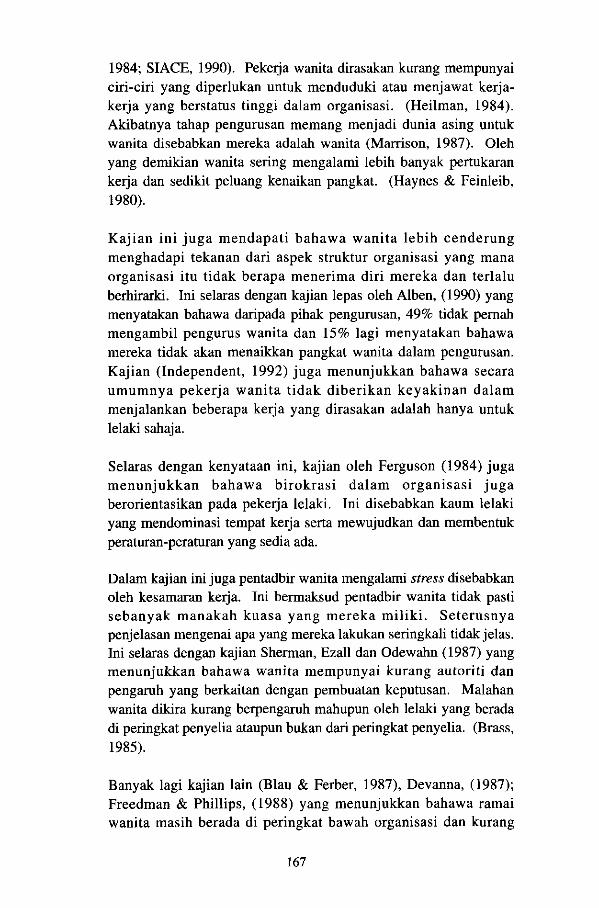
1984; SIACE, 1990). Pekerja wanita dirasakan kurang mempunyaiciri-ciri yang diperlukan untuk menduduki atau menjawat kerja-kerja yang berstatus tinggi dalam organisasi. (Heilman, 1984).Akibatnya tahap pengurusan memang menjadi dunia asing untukwanita disebabkan mereka adalah wanita (Marrison, 1987). Olehyang demikian wanita sering mengalami lebih banyak pertukarankerja dan sedikit peluang kenaikan pangkat. (Haynes & Feinleib,1980).
Kajian ini juga mendapati bahawa wanita lebih cenderungmenghadapi tekanan dad aspek struktur organisasi yang manaorganisasi itu tidak berapa menerima did mereka dan terlaluberhirarki. Ini selaras dengan kajian lepas oleh Alben, (1990) yangmenyatakan bahawa daripada pihak pengurusan, 49% tidak pernahmengambil pengurus wanita dan 15% lagi menyatakan bahawamereka tidak akan menaikkan pangkat wanita dalam pengurusan.Kajian (Independent, 1992) juga menunjukkan bahawa secaraumumnya pekerja wanita tidak diberikan keyakinan dalammenjalankan beberapa kerja yang dirasakan adalah hanya untuklelaki sahaja.
Selaras dengan kenyataan ini, kajian oleh Ferguson (1984) jugamenunjukkan bahawa birokrasi dalam organisasi jugaberorientasikan pada pekerja lelaki. Ini disebabkan kaum lelakiyang mendominasi tempat kerja serta mewujudkan dan membentukperaturan-peraturan yang sedia ada.
Dalam kajian ini juga pentadbir wanita mengalami stress disebabkanoleh kesamaran kerja. Ini bermaksud pentadbir wanita tidak pastisebanyak manakah kuasa yang mereka miliki. Seterusnyapenjelasan mengenai apa yang mereka lakukan seringkali tidak jelas.Ini selaras dengan kajian Sherman, Ezall dan Odewahn (1987) yangmenunjukkan bahawa wanita mempunyai kurang autoriti danpengaruh yang berkaitan dengan pembuatan keputusan. Malahanwanita dikira kurang berpengaruh mahupun oleh lelaki yang beradadi peringkat penyelia ataupun bukan dari peringkat penyelia. (Brass,1985).
Banyak lagi kajian lain (Blau & Ferber, 1987), Devanna, (1987);Freedman & Phillips, (1988) yang menunjukkan bahawa ramaiwanita masih berada di peringkat bawah organisasi dan kurang
167

dalam tahap organisasi yang mana mereka terlibat dalam membuatstrategi dan dasar-dasar. Malahan kajian Davidson & Cooper (1985)menunjukkan bahawa pengasingan wanita dalam memberikanpeluang yang sedemikian boleh membawa kesan stress dalam dirimereka. Faktor ini juga boleh dikaitkan dengan faktor-faktor yangmana mereka kurang berpeluang untuk mengembangkan kemahiranyang berkaitan dengan pengendalian kuasa kerana tidak ramaiwanita yang berada di peringkat pengurusan. (Schein, 1985).
Kajian ini mendapati bahawa pentadbir wanita mengalami stressdari aspek konflik peranan, yang membuat mereka berada dalamkeadaar* serba salah. Ini selaras dengan kajian lepas yang mendapatibahawa wanita jarang berada dalam peringkat penyeliaan, (Wolf &Fligstein, 1979) oleh yang demikian mereka mempunyai autoritiyang lebih kecil skopnya dibandingkan dengan kaum lelaki.Manakala lelaki lebih kerap mempunyai kerja yang memberikanmereka lebih banyak autonomi, kebebasan, boleh membuatkeputusan sendiri dan agak bebas dari penyeliaan yang terlalu rapi(Lincoln Kelleberg, 1990).
Kajian yang dilakukan untuk melihat punca-punca stress dalam 23pekerjaan yang berbeza, mendapati bahawa antara punca stress yangutama ialah tidak menggunakan kemahiran dan keupayaan secaramaksimum, tidak terlibat dalam membuat keputusan kesamaranperanan, konflik peranan, lebihan kerja dan tidak ada sokongansosial dari orang lain di tempat kerja.
CADANGAN DAN PROSPERBerdasarkan kepada kajian ini dan yang lepas, pengwujudan programstress merupakan satu keperluan dalam organisasi dan bukan kemewahan.Ini disebabkan kebanyakan organisasi kini menyara kos perubatanpekerjanya. Walaupun gaji pekerja telah meningkat, kadar kos perubatandianggarkan telah meningkat 3 kali ganda dibandingkan dengan kadarpeningkatan gaji (Bletcher dan Atchinson, 1987). Seterusnya kajian jugamenunjukkan bahawa pekerja yang tidak berpuas hati akan membuataduan pampasan kos perubatan dua kali ganda lebih kerap. Pengwujudanprogram pengurusan stress akan membantu mengurangkan kos disamping meningkatkan produktiviti organisasi.
168
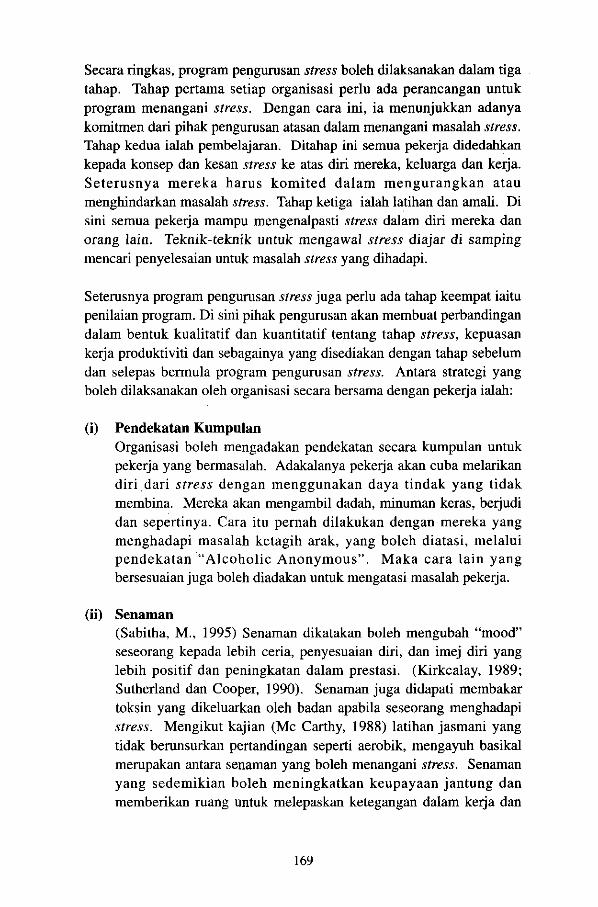
Secara ringkas, program pengurusan stress boleh dilaksanakan dalam tigatahap. Tahap pertama setiap organisasi perlu ada perancangan untukprogram menangani stress. Dengan cara ini, ia menunjukkan adanyakomitmen dari pihak pengurusan atasan dalam menangani masalah stress.Tahap kedua ialah pembelajaran. Ditahap ini semua pekerja didedahkankepada konsep dan kesan stress ke atas diri mereka, keluarga dan kerja.Seterusnya mereka harus komited dalam mengurangkan ataumenghindarkan masalah stress. Tahap ketiga ialah latihan dan amali. Disini semua pekerja mampu mengenalpasti stress dalam diri mereka danorang lain. Teknik-teknik untuk mengawal stress diajar di sampingmencari penyelesaian untuk masalah stress yang dihadapi.
Seterusnya program pengurusan stress juga perlu ada tahap keempat iaitupenilaian program. Di sini pihak pengurusan akan membuat perbandingandalam bentuk kualitatif dan kuantitatif tentang tahap stress, kepuasankerja produktiviti dan sebagainya yang disediakan dengan tahap sebelumdan selepas bermula program pengurusan stress. Antara strategi yangboleh dilaksanakan oleh organisasi secara bersama dengan pekerja ialah:
(i) Pendekatan KumpulanOrganisasi boleh mengadakan pendekatan secara kumpulan untukpekerja yang bermasalah. Adakalanya pekerja akan cuba melarikandid dari stress dengan menggunakan daya tindak yang tidakmembina. Mereka akan mengambil dadah, minuman keras, berjudidan sepertinya. Cara itu pernah dilakukan dengan mereka yangmenghadapi masalah ketagih arak, yang boleh diatasi, melaluipendekatan "Alcoholic Anonymous". Maka cara lain yangbersesuaian juga boleh diadakan untuk mengatasi masalah pekerja.
(ii) Senaman(Sabitha, M., 1995) Senaman dikatakan boleh mengubah "mood"seseorang kepada lebih ceria, penyesuaian diri, dan imej diri yanglebih positif dan peningkatan dalam prestasi. (Kirkcalay, 1989;Sutherland dan Cooper, 1990). Senaman juga didapati membakartoksin yang dikeluarkan oleh badan apabila seseorang menghadapistress. Mengikut kajian (Me Carthy, 1988) latihan jasmani yangtidak berunsurkan pertandingan seperti aerobik, mengayuh basikalmerupakan antara senaman yang boleh menangani stress. Senamanyang sedemikian boleh meningkatkan keupayaan jantung danmemberikan ruang untuk melepaskan ketegangan dalam kerja dan
169

ketenangan mental. Organisasi juga boleh mengusahakanpengwujudan gym untuk bersenam dan lain-lain aktiviti rekreasiuntuk pekerja di samping menolong mengurangkan stress dikalangan pekerja.
(iii) Terapi PerubatanCara ini merangkumi usaha menerangkan apakah kesan stress, disamping member! keyakinan kepada pekerja, memberikan ubatanda I am usaha mententeramkan keadaan pekerja. Usaha ini harusdifikirkan oleh organisasi kerana kebanyakan aduan yang diterimaseperti ponteng kerja, pusing ganti yang tinggi, ketidakpuasan kerjaadalah disebabkan oleh stress (Scheider & Snyder, 1975). Denganmengenalpasti punca stress dan mengawal pengambilan ubatan dikalangan pekerja boleh membantu mengurangkan stress di sampingmengelakkan diri terlalu bergantung pada ubatan.
(iv) KaunselingJika keadaan pekerja itu tidak memadai dengan terapi perubatan,individu itu boleh dirujuk untuk mendapatkan bantuan kaunselingatau pertolongan pakar psikiatri. Usaha kaunseling harus diadakandalam organisasi sebagai sumbangan organisasi untuk pekerja.
(v) Kaunseling KerjayaStress akan wujud apabila tidak ada keseimbangan antara keupayaanpekerja dan desakan dari kerjanya. Oleh yang demikian kaunselingkerjaya ini bukan sahaja sesuai untuk orang yang baru mula kerjatetapi juga untuk yang telah lama bekerja. Ini disebabkan perubahandari aspek maklumat dan lain-lain teknologi berlaku dengan begitupesat sekali. Tanpa kaunseling kerjaya ini, pentadbir mungkinmenghadapi stress yang begitu tinggi hingga ia tidak dapatmenyesuaikan diri dengan tempat kerjanya. Pengwujudan programkaunseling kerja juga diharapkan akan membantu mereka menilaiminat dan keupayaan mereka agar ianya dapat digunakan dengansebaik mungkin. Dengan cara ini organisasi boleh menggunakanpelbagai maklumat yang diterima untuk membantu membentuk danmenstruktur kembali kerjaya mereka, (contoh: perluasan kerja,pengayaan kerja) agar ada persamaan antara dirinya dengan kerjamereka. Cara ini juga dapat membantu mengurangkan stresspekerja dari aspek konflik kerja, kesamaran peranan, imej diri,lebihan atau kurang kerja serta masalah interpersonal.
170

(vi) Sistem SokonganSeterusnya kajian oleh Berkman (1977), Cassel (1976) French &Caplan (1972) menunjukkan bahawa pengekalan terhadap hubunganinterpersonal yang baik adalah penting dalam menangani stress. laboleh dikaitkan dengan sistem sokongan. Sistem sokongan ini bolehdilihat dari pelbagai sudut. Antaranya mengikut Seashore, (1979)ialah:
(i) Peranan Model: Diri individu itu dapat membantumengenalpasti matlamat pekerja tersebut. Di samping itumereka juga akan berkongsi maklumat-maklumat yang pentingmengenai peluang dan masalah yang terkandung dalam satuperanan yang diinginkan.
(ii) Teman Rapat: Bantuan mereka ini diperlukan pada waktukrisis. Mereka ini seringkali merupakan pakar dalammembantu menyelesaikan masalah-masalah tertentu. Danmereka bukanlah dari kategori individu yang dikira sebagai"teman rapat". Mereka ini adalah pakar yang mempunyaibanyak sumber-sumber maklumat dan dapat membantu apabilakebijaksanaan dan pengalaman mereka diperlukan.
Sistem sokongan ini bersama dorongan dari organisasi dapatmembantu pentadbir mengimbangkan kerja mereka.
KEJAYAAN PROGRAM PENGURUSAN STRESSSehubungan dengan itu, sesuatu program pengurusan stress juga haruspeka terhadap kejayaan dalam menangani stress. Sesuatu programpendidikan stress atau program pengurusan stress yang berjaya haruslahmempunyai ciri-ciri yang berikut:
(a) Isi kandungan program tersebut haruslah berkaitan dengan penggunaprogram stress tersebut. la memerlukan program yangmengambilkira keperluan dan kesesuaian pengguna programtersebut.
(b) Program haruslah fleksibel dan interaktif. Program itu tidaklahberbentuk ceramah sahaja tetapi dapat melibatkan peserta secara
171

individu atau kumpulan dalam memahami kandungan programtersebut. Program ini harus mempunyai pemindahcara yangberpengetahuan agar ia berupaya dalam mengkoordinasi danmengawal perbincangan kumpulan.
(c) Program ini juga harus mengadakan peluang untuk individumendapat maklumat secara langsung (personalized information). Inipenting kerana sesetengah individu mungkin merasa malu untukbertanyakan masalah atau subjek atau topik-topik stress yang beliaukurang tahu. Dengan itu wajar untuk setiap organisasi mengadakankaunseling atau pakar psikologi tetap dalam organisasi untukmembantu pekerja mendapatkan bantuan yang sedemikian.
(d) Program ini juga harus ada ruang untuk melibatkan ahli keluargapekerja kerana stress bukan sahaja berpunca dari aspek kerja tetapijuga dari persekitaran rumahtangga. Mungkin boleh diadakan sesiyang boleh melibatkan ahli-ahli keluarga pentadbir dalammeningkatkan pengetahuan mengenai stress. Ini penting keranaindividu harus menyedari punca-punca stress atau kesan stresssebelum ia boleh menangani stress.
(e) Pentadbir/Pekerja harus dil ibatkan dalam membentuk ataumenyesuaikan program pengurusan stress. Pekerja akan lebihkomited dan akan menghargai usaha terhadap sesuatu program yangmereka rasakan terlibat sama di dalamnya.
(f) Mekanisme untuk penilaian keberkesanan sesuatu program itu jugaharus disediakan agar ianya bersesuaian dengan kehendak pesertaprogram dan keperluan organisasi. Ini penting untukkesinambungan dan kewujudan sesuatu program itu dapat dinilaisecara berterusan untuk melihat keberkesanannya.
KESIMPULANMemandangkan penglibatan pentadbir wanita dalam dunia kerjaya dankhususnya dalam peringkat pentadbiran akan meningkat, maka satulangkah proaktif harus diambil oleh organisasi agar pekerja dapatmengurangkan kesan stress yang akan menjejaskan kepuasan kerja dan
172

prestasi pekerja. Dengan adanya program sokongan seperti ini, makapekerja dan organisasi dapat sama-sama mengembeling tenaga dalammenghadapi cabaran organisasi mahupun bentuk globalisasi di masadepan. Perlu juga diingatkan bahawa stress boleh diatasi bukan sahajadengan adanya sokongan'yang diperlukan dari peringkat pengurusantetapi juga dari usaha individu itu sendiri.
RUJUKAN(1988) Women's at Work. Watt Street Journal, April 7:27.(1992). Irish and Italians are the Sexist of Europe, Independent, 8,Oktober.
Alban - Metcalfe, B. (1990). Gender, Leadership and Assetment,disesuaikan dari kertas kerja yang dibentangkan dalam 3rd EuropeanCongress ont Ihe Assessment Centre Method. Belgium General: LesEaux.
Albrecht, K. (1979). Stress and the Manager. Englewood cliffs, NewJersey: Prentice-Hall.
Argyris. (1962). Interpersonal Confidence and OrganizatinoalEffectiveness. Homewood 111: Richard D. Irwing, Dorsey Press.
Basset, I (1985). The Basset Report: Career Success and CanadianWomen. Collins Toronto.
Berch, B (1982). The Endless Day: The Political Economy of Womanand Work. New York: Free Press,
Beehr, T.A. (1976). Received Situational Moderators of the RelationshipBetween Subjective Role Ambiguity and Role Strain. Journal of AppliedPsychology, 61: 1-10.
Bekher, D.W. dan Atchinson, T.J. (1987). Compensation Administration.Englewood Cliff: Prentice Hall.
Beehr, T.A., & Newman, J.E. (1978). Job Stress, Employee Health, andOrganizational Effectiveness: A Facet Analysis, Model and LiteratureReview. Personnel Psychology, 31: 665-699.
173
Blood, R. & Wolfe, D. (1960). Husbands and Wives. New York:Macmillan.
Brass, D.J., (1985). Men's and Women's Network. A Study of InteractionPatterns and Influcence in an Organization, Academy of ManagementJournal, 28, 327-33.
Brunning, N.S. and Frew, D.R. (1987). "Effects of Exercise, Relaxation,and Management Skills Training on Physiological Stress Indicator", "AField Experiment", Journal of Applied Psychology, 72: 515-521.
Burnhill, P. and McPherson, A. (1984). "Careers and Gender:, TheExperience of Able Scottish School Leavers in 1971 and 1981. SHREand NFER-Nelson; Guildford.
Caplan, R.D. (1983). "Person-Environment Fit": Post, Present andFuture. Dalam Cooper, C.L. (ed). Stress Research, Wiley London: 35-78.
Cassel, J. (1976). The Contribution of Social Environment to HostResistance. American Journal ofEpidenmlogy, 104 (2), 107-123.
Clearly, P.O. and Mechanic C.D. (1983). Sex Differences in PsychologyDistress among married people. J. of Health and Social Behaviour, 24:111-121.
Cox, T., Thirlaway, M. & Cox. S. (1984). Executive Stress and Health.Economics, 27,, 499-510.
Davidson, M., Cooper, C. (1983). Stress and the Women Manager.Oxford: Martin Robertson.
Davidson, M.J. and Cooper, C.C. (1984). She needs a wife: Problem ofWomen Managers. Leadership and Organizational DevelopmentJournal, 5.3.
Davidson, M. & Cooper, C. (1985). Women Managers: Work, Stress andMarriage. International Journal of Social Economics, 12,17 - 25.
Dunkin, A. (1993). "Meditation, The New Balm for Corporate Stress,"Business Week, May, 10: 86-87.
174

Farnham, A. (1991). Who Beats Stress. Best - and How. Fortune,Oktober, 7: 71-86.
Fergurson, K. (1984). "Different Meanings of Employment for Women.Human Relations, 24: 495 - 499.
Freedman, S.M., & Phillips, S.S. (1983). The Challenging Nature ofResearch on Women at Work. Journal of Management, 14, 231-251.
French, J.R.P. Caplan, R.D. (1972). Organizational Stress andIndividual Strain. Dalam A marrow (ed). The Failure of Success. NewYork: AMACOM.
French, J.R.P., Rodger, W. dan Cobb, S. (1974). Adjustment as Person-Environment Fit. Dalam Coelho, G.V. Hamburg, D.A. dan Adams, J.E.(eds). Coping and Adaptation; Basic Books, New York.
Folkman, S. (1984). Personal Control and Stress and Coping Process: ATheoretical-Analysis. Journal of Personality and Social Psychology, 46,4: 837-852.
Fraser, T.M. (1983). Human Stress, Work and Job Satisfaction: ACritical Approach. Occupational Safety and Health. Geneva:International Labour Office.
French, J.R.C. (1963). The Social Environment and Mental Health.Journal of Social Issues, 19: 39 - 56.
French, J.R.P. & Caplan, R.D. (1972). "Organization Stress andIndividual Strain" In. Marrow, A.J. (ED). The Failure of Success, NewYork; Amacom.
Greiff, B. & Munter, P. (1980). Trade offs: Executive, Family andOrganizational Life. New York: New American Library.
Gmelch, W.H. (1982). Beyond Stress to Effective Management. NewYork: John Wiley & Sons Inc.
Gmelch, W.H. , (1977). Beyond Stress to Effective Management,Eugene, Oregon: Oregon School Study Council, Universiti of Oregon.
175
Gupta, N. & Beehr. T.A. Job Stress and Employee Behaviours.Occupational Behaviour and Human Performance, 23 : 373-87
Hagnes, S.g. & Feinlab, M. (1980) Women, Work, and Coronary HeartDisease: Prospective Findings from the Framinggham Heart Study.American Journal of Public Health, 70, 133-141.
Harlan, A. and Weiss, C. (1980). Moving up: Women in ManagerialCareers: Third Progress Report, Wellesley Centre for Research onWoman, Wellesley, Mass.
Haw, M.A. (1982). Women, Work and Stress a Review and Agenda forthe Future. Journal of Health and Social Behaviour, 23: 132-144.
Herman, J.B., Dunham, R.B., & Hulin, C.L. (1975). OrganizationalStructure, Demographic Characteristics and Employee Responses.Organizational Behaviour and Human Performance, 13: 206-232.
Hirshman, A.O. (1990). Exit Voice and Loyalty. Cambridge, M.A.Harvard University Press.
Jackson, S.E. & Schuler, R.S. (1985). A Meta-Analysis and ConceptualCritique of Research on Role Ambiguity and Role Conflict in WorkSettings. Organizational Behaviour and Human Decision Processes,36: 16-78.
Jamal, M. (1984). Job Stress and Job Performance Controversy: AnEmpirical Assestment. Organizational Behaviour and HumanPerformance. 33: 1-21.
Jack, T.D. & Miltz, L.F. (1985). Sex Differences in Work Stress.Academy of Management Review, 10,408-420.
Jones, A.P & Butler, M.C. (1980). A Role Transition Approach to theStresses of Organizationally-Induced Family Role Disruption. Journalof Marriage and the Family, 42: 367-376.
Kahn, R.L., Wolfe, P.M., Quinn, R.P., Snock J.D. Rosenthal R.A. (1969)Organizational Stress: Studies in Role Conflict and Ambiguity: NewYork: John Wiley and Sons.
176

Kahn, A.L., Wolfe, D.M., Quinn. R.P., Snoek, J.D., Regentnal, R.Organizational Stress. New York: John Wiley and Sons
Kanter, R.M. (1977). Men and Women of the Corporation. New York:Basic Books.
Kirkcalay, B.D. (1989). Exercise as a Therapautic Modality. DalamB.D.Kirkcalay (ed), Normalities and Abnoronalities in Human Movement.Basel and New York: Karger.
Krasek, R. (1979). Job Demands, Job Decision Latitude and MentalHealth: Implications for Job Redesign. Administration ScienceOvaterly, 24, 285-308.
La Kocco, J.M., House, J.S., & French, J.R.P. (1980). Social Support,Occupational Stress, and Health. Journal of Health and SocialBehaviour, 21, 202-218.
Lazarus, R.S. (1966). Psychological Stress and the Coping Process.McGraw-Hill New York.
Likert, R. (1967). The Human Organization. New York: McGraw-Hill.
Lingsom, S. and Ellingsaeter, A.L. (1983). Arbeid, Fritid of Samraer,Central Bureau of Statistics, SA 49, OSIO.
Marshall, J. and Gary L.C. (1981). The Causes of Managerial JobStress. A research note on methods and initial findings. New York:John Wiley & Sons Ltd.
McCarthy, M.J. (1988). Stressed Employees Look for Relief in Workers'Compensation Claims, The Wall Street Journal, April, 7: 27.
McGregor, D. (1960). The Human Side of Enterprise. New York:McGraw-Hill.
Mitchell, R.E., Billings, A.G. dan Moos, R.R. (1982). "Social Supportand Well-being".
177

Michealson. L.K., Weitzel, W., & Jones. C.B. (1980). Work and ExtraWork Sources of Life Satisfaction. A Model and a ComparativeAnalysis of Four Income Occupation Groups. UnpublishedManuscript, University of Oklahoma, School of Business Administration,Norman, Oklahoma.
Milbank, O (1990), Managers are Sent to "Chorm Schools" to DiscoverHow To Polish UP Their Acts. The Wall Street Journal. December14:1.
Mintzberg, H. (1973). The Nature of Managerial Works. San Francisco,CA: Harper and Row.
Mootowidlo, S.J., Packard, J.S., & Manning, M.R. (1986). OccupationalStress: Its Causes and Consequences for Job Performance, Journal ofApplied Psychology. 71: 618-629.
Morrison, A. White, R.P. & Van Velsor, E. (1987). Breaking the GlassCeiling. New York: Addison Wosley.
Nathanson, C.A. (1975). Illness and the Feminine Role: A TheoreticalReview. Social Science and Medicine, 9: 57-62.
Oldham, G.R. and Fried, Y. (1987). "Employee Reactions to WorkStations as Potential Occupational Stress", "Journal of AppliedPsychology", 72: 75-34.
O'neil, C.P. & Zeichner, a. (1985). Working Women: A Study ofRelationships Between Stress, Coping and Health. Journal ofPsychosomatic Obstetrics and Gynaecology, 4, 105-116.
Piotrkowski, D. (1979). Work and the Family System. New York:Free Press.
Parker, L.E. (1993). When to Fit It and When to Leave: RelationshipAmong Perceived Control, Self Efficacy Dissent, and Exit. Journal ofApplied Psychology, 78: 949-959.
Parks, K.R. (1982). Occupational Stress Among Student Nurses "ANatural Experiment". Journal of Applied Psychology 167: 784-96.
178
Pestonjee, D.M. (1992). Stress and Coping: The Indian Experience,New Delhi, India: Sage Publications.
Pleck, J. (1985). Working Wives/Working Husbands. Beverly Hill,CA: Sage.
Pleck. J. (1979). Worker Family Conflict: A National Assestment.Paper Presented at the Annual Meeting of the Society for the Study ofSocial Problems, Boston.
Port, O (1991). "Does Your Job Satisfaction Prevent Back Injuries".Business Week, April, 7:82.
Quinn, R.P. dan Staines, G.L. (1978). The 1977 Novelty ofEmployment Survey. Institute for Social Research. M7: AnnAnbor.
Renshaw, J. (1976). An Exploration of the Dynamics of the OverlappingWorlds of Work and Family. Family Process, 15: 143-157.
Rice, R.W., Near. J.P. & Hunt, R.G. (1979). Unique Variance in Joband Life Satisfaction Associated With Work-Related and ExtraWorkplace Variable. Human Relations. 32 : 605-623
Sabitha, M (1995). Program Pengurusan Stress Ke Arah MembentukBudaya Kerja Produktif. Jurnal Produktiviti, Bil. 17 Dis.: 35-60.
Seashore, E.C. (1979). The Reading Book for Human RelationsTraining. NTC Institute for Applied Behavioural Science.
Selye, H. (1975). Stress without Distress. New York: Signet Books.
Schein, V.E. (1978). Sex Role Stereotyping, Ability and Performance:Prior Research and New Directions. Personal Psychology, 31, 259-268.
Schuler, R.S. (1979). "A Role Perception Transactional Process Modelfor Organizational Communication - Outcome Relationship",Organizational Behaviour and Human Performance, April: 268-291.
Sherman, J.D., Ezey, H.E., Odewahn, C.A. (1987). Centralization ofDecision Making and Accountability Based on Genden. Group andOrganizational Studies, 12,454-463.
179

Siage (1990). Efficiency and Equality: Training for women forManagement Edinburg : Scottish Institute of Adult and ContinuingEducation.
Singh, S. (1990). Organizational Stress and Executive Behaviour.New Delhi, India : Sri Ram Centre for Industrial Relations and HumanResources.
Srenska, Institute (1987). Fact Sheet on Sweden. Stockholm.
180