Urea Decomposition and SCR Performance at Low … · •It appears that urea decomposition kinetics...
22
1 OAK RIDGE NATIONAL LABORATORY U. S. DEPARTMENT OF ENERGY Urea Decomposition and SCR Performance at Low Temperature Scott Sluder, John Storey, Sam Lewis, Linda Lewis, Oak Ridge National Laboratory 10 th Annual DEER Workshop Coronado, CA September 2, 2004 Sponsors: DOE-OFCVT, Steve Goguen and Kevin Stork
Transcript of Urea Decomposition and SCR Performance at Low … · •It appears that urea decomposition kinetics...

1
OAK RIDGE NATIONAL LABORATORYU. S. DEPARTMENT OF ENERGY
Urea Decomposition and SCR Performance at Low Temperature
Scott Sluder, John Storey, Sam Lewis, Linda Lewis,
Oak Ridge National Laboratory
10th Annual DEER WorkshopCoronado, CA
September 2, 2004
Sponsors: DOE-OFCVT, Steve Goguen and Kevin Stork
2
OAK RIDGE NATIONAL LABORATORYU. S. DEPARTMENT OF ENERGY
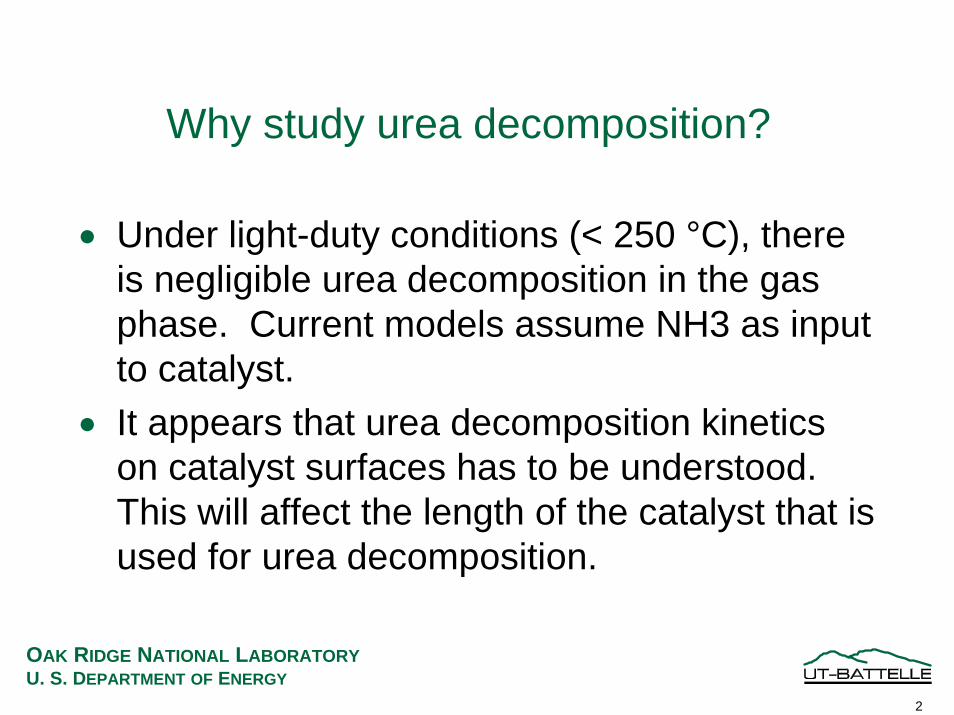
Why study urea decomposition?
• Under light-duty conditions (< 250 °C), there is negligible urea decomposition in the gas phase. Current models assume NH3 as input to catalyst.
• It appears that urea decomposition kinetics on catalyst surfaces has to be understood. This will affect the length of the catalyst that is used for urea decomposition.

3
OAK RIDGE NATIONAL LABORATORYU. S. DEPARTMENT OF ENERGY
Urea/SCR Chemistry
Ideally, injected urea decomposes to NH3
2 NH3 + NO + NO2 ⇔ 2 N2 + 3 H2O
O
NH 2 N H 2
HeatNH3 +
H2O, O2
OH C Nisocyanic acid
OH C Nisocyanic acid
Heat
H2ONH3 + CO2
then reacts with NOX to form N2.

4
OAK RIDGE NATIONAL LABORATORYU. S. DEPARTMENT OF ENERGY
Unusual things can happen, such as ammonium nitrate formation and decomposition at T < 200 °C.
2NH3 + 2NO2 →NH4NO3 + N2 + 3 H2O
NH4NO3 ⇔ NH3 + HNO3
2HNO3 + NO → 3 NO2 + H2O
M. Koebel et al. in Ind.Eng.Chem.Res.:39,p. 4120; 40, p. 52; 41, p.4008; 42, p.2093Also in Catal.Today, 73, p.239

5
OAK RIDGE NATIONAL LABORATORYU. S. DEPARTMENT OF ENERGY
Experimental Approach• Use engine controls to:
− Vary temperature − Keep constant: NOX and exhaust flow.
• Investigate urea decomposition (if any)upstream of SCR catalyst.
• Analyze exhaust products exiting undersized monoliths to elucidate urea decomposition− 3” and 6” monoliths = space velocities of 25K and 50K − const. urea residence time in the exhaust stream. (~0.1
sec)− From clean condition, begin injecting urea:Wait 20 minutes (3” monolith) or,40 minutes (6” monolith), Then collect data and samples.

6
OAK RIDGE NATIONAL LABORATORYU. S. DEPARTMENT OF ENERGY
Experiments conducted at NTRC cell 4 using Mercedes engine and BP15 fuel.
Urea
Injector
Oxidation catalyst (beneath engine)
Engine
SCR catalyst
To exhaust stack

7
OAK RIDGE NATIONAL LABORATORYU. S. DEPARTMENT OF ENERGY
Experiments conducted at NTRC using Mercedes engine and BP15 fuel.
Urea
Injector
Oxidation catalyst (beneath engine)
Engine
SCR catalyst
To exhaust stack
3” monolith

8
OAK RIDGE NATIONAL LABORATORYU. S. DEPARTMENT OF ENERGY
Experiments conducted at NTRC cell 4 using Mercedes engine and BP15 fuel.
Urea
Injector
Oxidation catalyst (beneath engine)
Engine
SCR catalyst
To exhaust stack
6” monolith

9
OAK RIDGE NATIONAL LABORATORYU. S. DEPARTMENT OF ENERGY
Measurement of actual NH3 in the presence of urea and isocyanic acid is difficult.
• Problematic if making measurements of urea decomposition products.
• Short experiments showed that urea decomposed (to ammonia) on instrument filter at T as low as 80 °C.
• Filters are required for sampling PM-laden exhaust gas.
• Instrument filter T is typically > 100 °C to prevent condensation and loss of water soluble NH3
• Using 60 °C filter allows measurement of NH3 without decomposition of precursors, but precludes same stream from being used for HC measurements.

10
OAK RIDGE NATIONAL LABORATORYU. S. DEPARTMENT OF ENERGY
Higher T decrease in NOX conversion (for 3”brick) implies competing processes….
0102030405060708090
100
150 170 190 210 230 250 270SCR inlet T (C)
App
aren
t Con
vers
ion
(%)
3 inch SCR6 inch SCR

11
OAK RIDGE NATIONAL LABORATORYU. S. DEPARTMENT OF ENERGY
The lower conversion of NOX is due at high temperature is due to lower NO2 conversion.
0102030405060708090
100
150 170 190 210 230 250 270SCR inlet T (C)
App
aren
t Con
vers
ion
(%)
3 inch SCR6 inch SCR

12
OAK RIDGE NATIONAL LABORATORYU. S. DEPARTMENT OF ENERGY
Undersized SCRs slipped some NH3 at all conditions, indicating ample reductant available for
NOX reduction.
0
10
20
30
40
50
60
150 170 190 210 230 250 270SCR inlet T (C)
Con
cent
ratio
n (P
PM)
3 inch SCR6 inch SCR

13
OAK RIDGE NATIONAL LABORATORYU. S. DEPARTMENT OF ENERGY
N2O slip indicates incomplete reduction in the shorter catalyst
05
101520253035404550
150 170 190 210 230 250 270SCR inlet T (C)
Con
cent
ratio
n (P
PM)
3 inch SCR6 inch SCR

14
OAK RIDGE NATIONAL LABORATORYU. S. DEPARTMENT OF ENERGY
HCN was also formed as an intermediate at low concentrations at the temperatures studied.
0
1
2
3
4
5
6
7
8
9
150 170 190 210 230 250 270SCR inlet T (C)
Con
cent
ratio
n (P
PM)
3 inch SCR6 inch SCR

15
OAK RIDGE NATIONAL LABORATORYU. S. DEPARTMENT OF ENERGY
Steady-state data suggest urea decomposition competes with NOX reduction processes.
• NO2 not converted as efficiently at high temperatures with the 3” SCR.
• High concentration of intermediate N2O in the 3”SCR could account for most NOX disappearance.
• Concentrations of intermediates drop with longer catalyst.
• NH3 slip indicates available reductant.• Temperature gradients associated with urea
decomposition and NOX reduction were too small to measure.

16
OAK RIDGE NATIONAL LABORATORYU. S. DEPARTMENT OF ENERGY
Results from onset of injection

17
OAK RIDGE NATIONAL LABORATORYU. S. DEPARTMENT OF ENERGY
NO, NO2 disappearance at 250 °C using urea and ammonia as reductants suggests similarity of
reduction processes.
0
20
40
60
80
100
120
140
0 200 400 600 800 1000 1200Time (s)
Con
cent
ratio
n (p
pm)
NO w/ Urea NO2 w/ Urea
NO with NH3 NO2 w/ NH3Injection Starts

18
OAK RIDGE NATIONAL LABORATORYU. S. DEPARTMENT OF ENERGY
Onset of N2O slip and NH3 slip at 250 °C is due to competition of urea decomposition process
0
2
4
6
8
10
12
14
0 200 400 600 800 1000 1200Time (s)
Con
cent
ratio
n (p
pm)
N2O w/Urea NH3 w/UreaN2O w/NH3 NH3 w/NH3
Injection Starts

19
OAK RIDGE NATIONAL LABORATORYU. S. DEPARTMENT OF ENERGY
NO and NO2 disappearance similar at 180 °C when using urea and ammonia as reductants.
0
40
80
120
160
0 200 400 600 800 1000 1200Time (s)
Con
cent
ratio
n (p
pm)
NO w/ Urea NO2 w/ UreaNO with NH3 NO2 w/ NH3
Injection Starts

20
OAK RIDGE NATIONAL LABORATORYU. S. DEPARTMENT OF ENERGY
Large NH3 slip again occurs much sooner with urea injection than with ammonia injection.
0
5
10
15
0 200 400 600 800 1000 1200Time (s)
Con
cent
ratio
n (p
pm)
N2O w/Urea NH3 w/UreaN2O w/NH3 NH3 w/NH3
Injection Starts

21
OAK RIDGE NATIONAL LABORATORYU. S. DEPARTMENT OF ENERGY
Urea decomposition hampers NOX reduction in at least the first 3” of SCR catalyst.
• Steady state data showed presence of NH3, intermediates downstream of 3” and 6” SCR.
• Transient data showed that NO, NO2 disappearance were similar using both NH3 and urea as reductants.
• Ammonia injection data showed intermediates (HCN, N2O) at ~1/3 of concentration vs. urea
• Ammonia injection data showed longer NH3 storage times before slip (~2X) than when urea was used.

22
OAK RIDGE NATIONAL LABORATORYU. S. DEPARTMENT OF ENERGY
Further investigation of the dynamics of urea decomposition is planned.
• Confirmatory, direct measurements of urea, isocyanic acid downstream of SCR are forthcoming.
• Study 3”+6” SCRs together (as a 9”) to determine whether same trends are observed in rear 3” of 6” monolith.
• Comparisons of urea and ammonia injection at other conditions to confirm