UrbanNet: Leveraging Urban Maps for Long Range 3D Object ...
8
UrbanNet: Leveraging Urban Maps for Long Range 3D Object Detection Juan Carrillo and Steven Waslander University of Toronto Abstract— Relying on monocular image data for precise 3D object detection remains an open problem, whose solution has broad implications for cost-sensitive applications such as traffic monitoring. We present UrbanNet, a modular architecture for long range monocular 3D object detection with static cameras. Our proposed system combines commonly available urban maps along with a mature 2D object detector and an efficient 3D object descriptor to accomplish accurate detection at long range even when objects are rotated along any of their three axes. We evaluate UrbanNet on a novel challenging synthetic dataset and highlight the advantages of its design for traffic detection in roads with changing slope, where the flat ground approximation does not hold. Data and code are available at https://github.com/TRAILab/UrbanNet I. INTRODUCTION Vehicular traffic continues to increase each year as cities grow around the globe, leading to challenges related to road safety and efficient mobility. Traffic accidents are among the top causes of death in many countries and road intersections are places of particularly high risk for such unwanted events. According to road safety statistics, intersections are the locations where about four of every 10 vehicle crashes take place in the United States [1], and is also where one third of fatalities and 40% of major lesions happen in Canada [2]. As a result, transportation offices at city governments have been looking at cutting-edge technologies to help prevent accidents at intersections while also improving traffic flow. Dynamic control of traffic lights based on real-time assess- ment of vehicles at intersections has shown to significantly reduce delays, with examples such as the City of Los Angeles and its Automated Traffic Surveillance and Control (ATSAC) System [3], which lowers travel time by as much as 32%. Smart intersections are an initiative gaining momentum globally which entails the use of advanced technologies to improve road safety as well as traffic flow [4]. One of the fundamental components in most of these systems is a mechanism to dynamically detect the location of vehicles, cyclists, and pedestrians, among other road users based on raw data collected from a variety of sensors including cameras, LiDAR, RADAR, and inductive-loop detectors. Object detection is the first step to enable a sequence of downstream tasks such as counting and tracking, as well as dynamic control of signals to lower the risk of accidents and optimize vehicle flow. In other words, smart intersections Juan Carrillo and Steven Waslander are with the Institute for Aerospace Studies, University of Toronto, 4925 Dufferin St, North York, ON, Canada. [email protected], [email protected] offer challenging scenarios to incorporate recent techniques in Computer Vision and Machine Learning that benefit from large amounts of data and are particularly well suited for complex tasks such as object detection. Fig. 1: Representing vehicles as 3D bounding boxes involves the definition of their size, location, and orientation. Object detection tasks are broadly categorized into 2D or 3D detection, with the second group being more challenging due to the increased complexity of the inputs and expected outputs. While competitive 2D object detection methods commonly require only images as inputs [5], state of the art 3D object detectors require additional input features to properly locate objects in 3D space. In particular, range information is often drawn from raw LiDAR point clouds, radar returns or dense depth maps from stereo vision [6]. Moreover, methods that only rely on monocular images for 3D object detection usually show a significant drop in performance as opposed to those using direct measurement of distance to object in the scene. An object is often represented in three dimensions as an oriented 3D bounding box, where at least nine parameters are needed to fully characterize the size and pose of such box. Three parameters for size (height, width, length), three for position (x,y,z), and three for orientation (pitch, yaw, roll). Depending on the specific application, we can approximate the road as a flat ground plane across the scene and therefore assume the pitch and roll rotations relative to the ground plane to be close to zero, making the problem significantly less complex [7]. In other words, assuming a flat ground plane provides a good approximation for close range objects that is also convenient when the road plane is parallel with the plane formed by two axis in the coordinate reference system of one or more sensors. In contrast, for long range 3D object detection using traffic cameras at intersections, the flat ground plane assumption is regularly invalidated, and it becomes essential to account for varying slope to correctly characterize the size and pose of each object. Figure 1 arXiv:2110.05561v1 [cs.CV] 11 Oct 2021
Transcript of UrbanNet: Leveraging Urban Maps for Long Range 3D Object ...

UrbanNet: Leveraging Urban Maps for Long Range 3D ObjectDetection
Juan Carrillo and Steven WaslanderUniversity of Toronto
Abstract— Relying on monocular image data for precise 3Dobject detection remains an open problem, whose solution hasbroad implications for cost-sensitive applications such as trafficmonitoring. We present UrbanNet, a modular architecture forlong range monocular 3D object detection with static cameras.Our proposed system combines commonly available urbanmaps along with a mature 2D object detector and an efficient3D object descriptor to accomplish accurate detection at longrange even when objects are rotated along any of their threeaxes. We evaluate UrbanNet on a novel challenging syntheticdataset and highlight the advantages of its design for trafficdetection in roads with changing slope, where the flat groundapproximation does not hold. Data and code are available athttps://github.com/TRAILab/UrbanNet
I. INTRODUCTION
Vehicular traffic continues to increase each year as citiesgrow around the globe, leading to challenges related to roadsafety and efficient mobility. Traffic accidents are among thetop causes of death in many countries and road intersectionsare places of particularly high risk for such unwanted events.According to road safety statistics, intersections are thelocations where about four of every 10 vehicle crashes takeplace in the United States [1], and is also where one thirdof fatalities and 40% of major lesions happen in Canada [2].As a result, transportation offices at city governments havebeen looking at cutting-edge technologies to help preventaccidents at intersections while also improving traffic flow.Dynamic control of traffic lights based on real-time assess-ment of vehicles at intersections has shown to significantlyreduce delays, with examples such as the City of Los Angelesand its Automated Traffic Surveillance and Control (ATSAC)System [3], which lowers travel time by as much as 32%.
Smart intersections are an initiative gaining momentumglobally which entails the use of advanced technologies toimprove road safety as well as traffic flow [4]. One ofthe fundamental components in most of these systems is amechanism to dynamically detect the location of vehicles,cyclists, and pedestrians, among other road users basedon raw data collected from a variety of sensors includingcameras, LiDAR, RADAR, and inductive-loop detectors.Object detection is the first step to enable a sequence ofdownstream tasks such as counting and tracking, as well asdynamic control of signals to lower the risk of accidents andoptimize vehicle flow. In other words, smart intersections
Juan Carrillo and Steven Waslander are with the Institute forAerospace Studies, University of Toronto, 4925 Dufferin St, NorthYork, ON, Canada. [email protected],[email protected]
offer challenging scenarios to incorporate recent techniquesin Computer Vision and Machine Learning that benefit fromlarge amounts of data and are particularly well suited forcomplex tasks such as object detection.
Fig. 1: Representing vehicles as 3D bounding boxes involvesthe definition of their size, location, and orientation.
Object detection tasks are broadly categorized into 2D or3D detection, with the second group being more challengingdue to the increased complexity of the inputs and expectedoutputs. While competitive 2D object detection methodscommonly require only images as inputs [5], state of theart 3D object detectors require additional input features toproperly locate objects in 3D space. In particular, rangeinformation is often drawn from raw LiDAR point clouds,radar returns or dense depth maps from stereo vision [6].Moreover, methods that only rely on monocular imagesfor 3D object detection usually show a significant drop inperformance as opposed to those using direct measurement ofdistance to object in the scene. An object is often representedin three dimensions as an oriented 3D bounding box, whereat least nine parameters are needed to fully characterizethe size and pose of such box. Three parameters for size(height, width, length), three for position (x,y,z), and threefor orientation (pitch, yaw, roll).
Depending on the specific application, we can approximatethe road as a flat ground plane across the scene and thereforeassume the pitch and roll rotations relative to the groundplane to be close to zero, making the problem significantlyless complex [7]. In other words, assuming a flat groundplane provides a good approximation for close range objectsthat is also convenient when the road plane is parallel withthe plane formed by two axis in the coordinate referencesystem of one or more sensors. In contrast, for long range3D object detection using traffic cameras at intersections, theflat ground plane assumption is regularly invalidated, and itbecomes essential to account for varying slope to correctlycharacterize the size and pose of each object. Figure 1
arX
iv:2
110.
0556
1v1
[cs
.CV
] 1
1 O
ct 2
021

shows an example of a 3D bounding box projected on atraffic camera image along with its representation in a 3Dcoordinate frame. As a result, this work emphasizes thedetection of a full 3DOF orientation estimate in the formof three Euler angle parameters for each detected boundingbox.
State of the art 3D object detection methods, studiedprimarily in the context of autonomous driving, make ex-tensive use of LiDAR data to obtain accurate spatial fea-tures. Similarly, 3D maps are rich sources of spatial datauseful to complement streams coming from sensors. Theseaccurate maps are created during the development of urbaninfrastructure projects and are therefore commonly availablefor most cities. The level of detail in these maps vary fromsimple elevation maps with contour lines to highly detailedand realistic 3D representations of most elements in urbanareas [8]. As a result, more attention has been given lately tourban maps as additional data sources and datasets publishedrecently for research purposes in autonomous driving nowincorporate some form of map [9][10][11].
In this paper we aim to bridge the gap between 2D and 3Dobject detection for applications in long range traffic surveil-lance by introducing the UrbanNet architecture (Fig. 2). Ourcontributions are summarized as follows:
• We design an efficient 3D object descriptor that usescropped image regions with driving lane maps as usefulpriors to output vehicle 3D bounding boxes along withsize and observation angle values.
• We introduce a novel normalization step that facilitatesthe encoding of vehicle keypoints with respect to itstight 2D bounding box and allows the modular use ofany out of the box 2D object detector in the first stageof the architecture.
• We incorporate detailed geometric information in theform of a 3D environment map that provides elevationand slope throughout the field of view of the camera.This allows us to accurately and efficiently determinethe pose of vehicles at long range.
The rest of the paper is organized in the following sections.In Section II we review previous work in the context of 2Dand 3D vehicle detection. In Section III we describe in moredetail the UrbanNet architecture and in Section IV we presentexperiments and results.
II. RELATED WORK
This review of related work focuses mainly on publicationstargeted at detection of vehicles from sensors installed at in-tersections; however, methods designed for data coming fromsensors onboard autonomous vehicles are also considered.
A. 2D Object Detection
Methods for 2D object detection at intersections are mostlyadaptations of methods designed for detection of objectsin generic datasets [12]. However, in recent years largedatasets have been published to train and evaluate objectdetectors specifically for objects at intersections, such asthe UA-DETRAC [13], CityFlow [14], and MIO-TCD [15]
datasets. Examples of such customized methods use DeepLearning architectures like Single Shot Detectors [16] andYOLO detectors [17]. The development on this front alsomakes use of conventional Computer Vision techniques suchas handcrafted features and optical flow [18], as well asGaussian mixture models [19]. In general, these methods aredesigned for objects at close range, where a flat layout of theintersection is sufficient to locate moving objects in bird’seye view.
B. Image-based 3D Object Detection
Previous work focused on 3D object detection at intersec-tions using only images is represented mostly by studies thatlocalize and track vehicles in bird’s eye view [20] [21], ratherthan fully characterizing the size and pose of the objects.Such methods are useful for traffic studies that require countsof vehicle turns and traffic queues, and not necessarily full3D bounding boxes to represent moving objects. While thesensors’ mounting is not the same, methods for 3D object de-tection in the context of autonomous driving have developedinteresting ideas such as carefully designed loss functions[22], the use of auxiliary CAD models [23], geometricconstraints between 2D and 3D bounding boxes [24], stereoimaging [25], and keypoint detection [26][27]. However,most of these methods are designed for 3D detection up to40m [25][28] and their direct implementation at a longerrange produces significantly less accurate results, especiallywhen looking at roads with changing slope.
C. LiDAR and Image 3D Object Detection
Methods using LiDAR sensors installed at intersectionsoffer more accurate distance measurements and commonlyprovide 3D detections with a full characterization of the sizeand pose of objects. Some of the common techniques inthese methods include voxel maps along with handcrafted3D features [29] or the combination of background filteringand point cloud clustering [30][31][32]. In the context ofautonomous vehicles, 3D object detection methods use DeepLearning techniques to achieve significantly higher perfor-mance when compared to image only methods [33][6][34].However, regardless of the sensor mounting (poles or vehi-cles), the operational range of these methods is often limitedto close and mid range distances because of the hardwarespecifications of the sensors and the sparsity of the resultingpoint cloud. Besides, LiDAR sensors are more expensivethan cameras and this reduces the chances of widespreadadoption for many city intersections.
D. Maps in 3D Object Detection
Methods in this category use one or more map repre-sentations to narrow down the vehicle detection task andimprove the accuracy of the output localization. Some of thecommon techniques at intersections take advantage of projec-tive geometry to determine correspondences between imagecoordinates and bird’s eye view coordinates [35][36] aswell as extraction of road surface area [37]. However, thesemethods do not account for elevation and slope variations

Fig. 2: UrbanNet’s system overview. The first stage uses a mature 2D object detector to find relevant objects and output atight 2D bounding box for each. The second stage uses an efficient 3D object descriptor in combination with an urban 3Dmap to accurately characterize the size and pose of objects in the road.
in the road, which are even more prevalent at long range.For applications in autonomous driving maps are widelyused to inform drivable surface [38][39], road boundaries[40], lane center lines [41], and volumetric occupancy grids[42]. Most of these methods also rely on the approximationof a flat ground plane in the proximity of the ego vehicle,and therefore only estimate heading instead of the full 3Dorientation of the vehicle.
III. THE URBANNET ARCHITECTURE
UrbanNet is a two stage modular architecture designed toachieve an effective balance between accuracy and efficiencyfor 3D object detection at long range using single cameraimages along with 3D urban maps (Fig. 2).
A. 2D Object Detection
The first stage uses a mature 2D object detector to processhigh resolution images and output tight 2D bounding boxesenclosing objects within the classes of interest. While othermulti stage architectures require customized 2D boundingboxes that fully enclose the projection of the corresponding3D box [24], UrbanNet only needs tight 2D boxes, whichallows maximum interoperability with a broad number ofpretrained 2D object detectors such as Detectron2 [5]. Inter-operability is key for us because it enables the interchange-able use of highly optimized 2D detectors tailored for edgecomputing applications. Since the main contributions of ourpaper are focused on 3D object detection we choose to useground truth 2D bounding boxes and image snippets for thenext stage.
B. Driving lanes map
Driving lanes are where vehicles are located most of thetime and are therefore a useful prior to guide computervision tasks. More specifically, we explore the use of lane
center lines [41] as an additional feature for the downstream3D object descriptor. We make a preliminary evaluation ofthis hypothesis by plotting the projection of 3D vehiclecentroids on the road surface along with the lane centerlines (Fig. 3). Based on this figure we visually confirmthe strong spatial correlation between both data sources inthis synthetic dataset, and surmize that a similar relationshipwould hold in real-world data as well. UrbanNet uses centerlines as an additional input, which are projected on the imageand passed as a fourth channel to the 3D object descriptor.In Section IV we present ablation experiments to furtherevaluate the contribution of the centerline map.
C. 3D Object Descriptor
Model inputWe concatenate the cropped 2D image snippet that tightly
encloses the vehicle and the driving lanes into a four channeltensor and pass it as input to the 3D object descriptor. Sinceimage snippets have different sizes depending on the actualdimensions of the objects and how close they are to thecamera, all snippets are rescaled and padded with zerosbeside their longer edges to fit in a square snippet withpredefined height and width.
Network designThe goal of the 3D object descriptor is to accurately
determine the keypoints that represent the projection of theobject’s 3D bounding box into the image 2D space, alongwith its size and observation angle. We implement this 3Ddescriptor as an efficient Deep Neural Network inspiredby the VGG architecture [43]. Even though more complexand competitive network architectures have been introducedlately for computer vision tasks [44], we use a genericnetwork model as the contributions of this work lie in theassessment of benefit of the additional information from
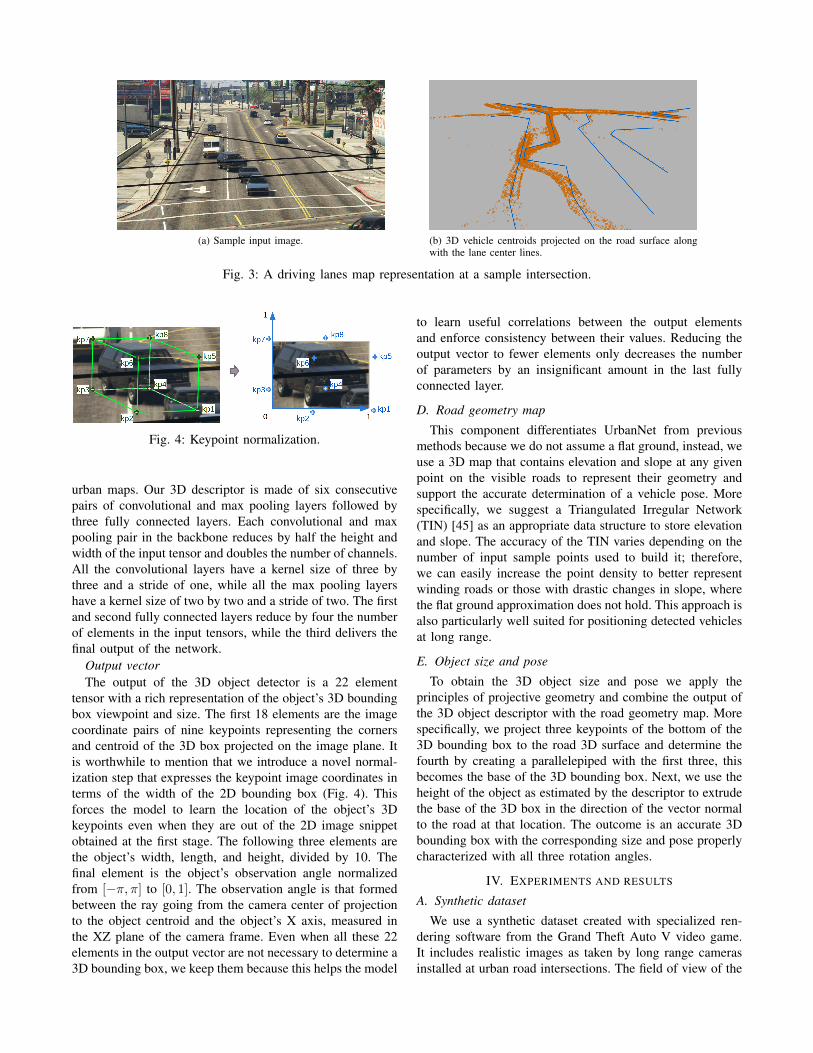
(a) Sample input image. (b) 3D vehicle centroids projected on the road surface alongwith the lane center lines.
Fig. 3: A driving lanes map representation at a sample intersection.
Fig. 4: Keypoint normalization.
urban maps. Our 3D descriptor is made of six consecutivepairs of convolutional and max pooling layers followed bythree fully connected layers. Each convolutional and maxpooling pair in the backbone reduces by half the height andwidth of the input tensor and doubles the number of channels.All the convolutional layers have a kernel size of three bythree and a stride of one, while all the max pooling layershave a kernel size of two by two and a stride of two. The firstand second fully connected layers reduce by four the numberof elements in the input tensors, while the third delivers thefinal output of the network.
Output vectorThe output of the 3D object detector is a 22 element
tensor with a rich representation of the object’s 3D boundingbox viewpoint and size. The first 18 elements are the imagecoordinate pairs of nine keypoints representing the cornersand centroid of the 3D box projected on the image plane. Itis worthwhile to mention that we introduce a novel normal-ization step that expresses the keypoint image coordinates interms of the width of the 2D bounding box (Fig. 4). Thisforces the model to learn the location of the object’s 3Dkeypoints even when they are out of the 2D image snippetobtained at the first stage. The following three elements arethe object’s width, length, and height, divided by 10. Thefinal element is the object’s observation angle normalizedfrom [−π, π] to [0, 1]. The observation angle is that formedbetween the ray going from the camera center of projectionto the object centroid and the object’s X axis, measured inthe XZ plane of the camera frame. Even when all these 22elements in the output vector are not necessary to determine a3D bounding box, we keep them because this helps the model
to learn useful correlations between the output elementsand enforce consistency between their values. Reducing theoutput vector to fewer elements only decreases the numberof parameters by an insignificant amount in the last fullyconnected layer.
D. Road geometry map
This component differentiates UrbanNet from previousmethods because we do not assume a flat ground, instead, weuse a 3D map that contains elevation and slope at any givenpoint on the visible roads to represent their geometry andsupport the accurate determination of a vehicle pose. Morespecifically, we suggest a Triangulated Irregular Network(TIN) [45] as an appropriate data structure to store elevationand slope. The accuracy of the TIN varies depending on thenumber of input sample points used to build it; therefore,we can easily increase the point density to better representwinding roads or those with drastic changes in slope, wherethe flat ground approximation does not hold. This approach isalso particularly well suited for positioning detected vehiclesat long range.
E. Object size and pose
To obtain the 3D object size and pose we apply theprinciples of projective geometry and combine the output ofthe 3D object descriptor with the road geometry map. Morespecifically, we project three keypoints of the bottom of the3D bounding box to the road 3D surface and determine thefourth by creating a parallelepiped with the first three, thisbecomes the base of the 3D bounding box. Next, we use theheight of the object as estimated by the descriptor to extrudethe base of the 3D box in the direction of the vector normalto the road at that location. The outcome is an accurate 3Dbounding box with the corresponding size and pose properlycharacterized with all three rotation angles.
IV. EXPERIMENTS AND RESULTS
A. Synthetic dataset
We use a synthetic dataset created with specialized ren-dering software from the Grand Theft Auto V video game.It includes realistic images as taken by long range camerasinstalled at urban road intersections. The field of view of the

(a) (b)
Fig. 5: Number of vehicle instances by range groups in the train (a) and test (b) sets.
virtual long range cameras is 21°, they are positioned at aheight of 11m over ground and angled 6° down relative to thehorizon. The images have 4k resolution (3840x2160). Thedataset labels have the same structure as the KITTI dataset[7], with three additional attributes that correspond to theobject’s orientations in X and Z axis as well as the name ofthe vehicle model. The dataset includes labels for other 3Dobject classes but we focus on the car and truck classes forour experiments.
B. Model training and evaluation
To train the 3D object descriptor we use 100 imagesfrom each of five camera installations for a total of 500images. For testing we use 100 images from each of twocamera installations for a total of 200 images. The camerainstallations and viewpoints for the training and test setsare different. Fig. 5 shows the number of vehicle instancescategorized by range in the train and test sets. For datapreprocessing we scale and zero pad the image snippets toobtain square tensors of 128 by 128 pixels and scale itsvalues into the [0, 1] range. An NVIDIA® GeForce® RTX2080 Ti is used to train the model for 120 epochs with theAdam optimizer, a batch size of 256, a learning rate of 1e-3,and L1 loss. To evaluate the UrbanNet architecture we usemean average precision (mAP) in bird’s eye view (BEV)as this is a standard metric for 3D object detection [7]. Inaddition, to evaluate the 3D object descriptor independentlyfrom the other components of the UrbanNet architecture wemeasure 3D IoU between each pair of predicted and groundtruth 3D bounding boxes.
C. Ablation experiments
The first set of ablation experiments introduce Gaussiannoise in the elevation of the road geometry map. Thereasoning behind this experiment is that available mapsof city roads have varying levels of uncertainty. As-builtcivil engineering maps documenting infrastructure projectshave an accuracy ranging from a few milimeters to severaldecimeters; therefore, we introduce two levels of Gaussian
noise in elevation, one with a standard deviation of 10cm andanother with a standard deviation of 40cm (Fig. 6). The slopeof the map was not perturbed. We see that results are notsignificantly affected when the noise has a standard deviationof 10cm; on the other hand, they degrade by about 15% to20% levels when the noise reaches 40cm.
The second set of ablation experiments ignores the drivingcenterlines map as input to the 3D descriptor. For thispurpose we set to zero all values in the fourth channel ofthe image snippet and maintain the same structure of theneural network. The results show that incorporating the lanecenterlines certainly contributes to the overall performance ofthe 3D object descriptor, especially for objects in the rangefrom 40 to 60m. Moreover, even when using the nominalroad geometry map the mean IoU values slightly surpass70% only for vehicles around 60m from the camera.
In the third set of ablation experiments the 3D objectdescriptor is trained to predict only the minimal informationrequired to generate 3D bounding boxes. In other words, itonly outputs the height and the vertices at the bottom of thebox.
Noise in elevation mapSetup Nominal STD 10cm STD 40cm
UrbanNet 8.069% 7.533% 7.031%No driving centerlines 6.622% 6.476% 6.075%Keypoints at bottom 7.287% 6.974% 6.890%
TABLE I: Average Precision (in %) measured in bird’s eyeview for all the vehicles in the test set. Using a thresholdIoU of 0.5 and 40 recall positions.
Table I summarizes the bird’s eye view results of theablation experiments in the test set. Adding Gaussian noiseto the road geometry map affects the performance across allexperiments. Predicting only the keypoints at the bottom ofthe 3D bounding box also reduces the quality of the resultsbut not as much as ignoring the driving centerlines as a priorfor the 3D object descriptor. These results are competitiveconsidering the hard challenges we are facing. In UrbanNetwe are using a monocular method to estimate boxes oriented

in three axes and located at long range.
(a)
(b)
(c)
Fig. 6: Mean 3D IoU by range bins in the test set. With (a)and without (b) driving lanes, and predicting only the verticesin the bottom and the height to generate the 3D bounding box(c). These figures also show the effect of adding Gaussiannoise in the elevation map where green lines correspond tonominal elevation, orange to a standard deviation of 10cm,and red to a standard deviation of 40cm.
D. Qualitative results
In Fig. 7 we present examples of 3D vehicle detectionsgenerated by the UrbanNet architecture. Each example showsthe predicted (red) and ground truth (green) 3D boundingbox. In general, we see competitive results for vehicles inthe range from 60 to 120m.
E. Memory requirements
The 3D object descriptor has a total of six convolutionallayers and three fully connected layers. This neural networkarchitecture comprises 673,902 trainable parameters, a rathersmall number when compared to other networks with ordersof magnitude more parameters. Using the 32-Bit float datatype for the network implementation requires less than 3Mbto store all its parameters, this makes the 3D descriptor anefficient model for deployment in edge devices [46][47].
(a)
(b)
(c)
Fig. 7: Examples of detected vehicles at 58m (a), 109m (b),and 139m (c) from the camera. Green boxes are groundtruth and red correspond to our predictions.
V. CONCLUSIONS
In this paper we introduce UrbanNet, a modular systemto perform monocular 3D object detection at long range.Our proposed architecture shows competitive experimentalresults for accurately detecting vehicles at long range evenwhen they are rotated along their three axes and in roads withchanging slope. To the best of our knowledge this is the firstattempt to perform full 3D object detection at a range up to120m. We introduce a novel 3D object descriptor that runswith minimal memory footprint and an innovative use of 3Durban maps to complement the prediction of the vehicles’size and pose. Last but not least important, UrbanNet allowsmaximum flexibility and interoperability with mature 2Ddetectors, opening the door to further improvements.

REFERENCES
[1] E.-H. Choi, Crash Factors in Intersection-related Crashes: An On-scene Perspective. US Department of Transportation, 2010. [Online].Available: https://crashstats.nhtsa.dot.gov/Api/Public/ViewPublication/811366
[2] Road safety in Canada. Ottawa, Ont: Transport Canada, 2011.[Online]. Available: https://tc.canada.ca/sites/default/files/migrated/tp15145e.pdf
[3] Los Angeles Signal Synchronization. Los Angeles Department ofTransportation, 2016. [Online]. Available: https://ladot.lacity.org
[4] M. Amirgholy, M. Nourinejad, and H. O. Gao, “Optimal traffic controlat smart intersections: Automated network fundamental diagram,”Transportation Research Part B: Methodological, vol. 137, pp. 2–18,2020.
[5] Y. Wu, A. Kirillov, F. Massa, W.-Y. Lo, and R. Girshick, “Detectron2,”https://github.com/facebookresearch/detectron2, 2019.
[6] S. Pang, D. Morris, and H. Radha, “Clocs: Camera-lidar objectcandidates fusion for 3d object detection,” 2020.
[7] A. Geiger, P. Lenz, and R. Urtasun, “Are we ready for autonomousdriving? the kitti vision benchmark suite,” in Conference on ComputerVision and Pattern Recognition (CVPR), 2012.
[8] K. Soon and V. Khoo, “Citygml modelling for singapore 3d nationalmapping,” The International Archives of Photogrammetry, RemoteSensing and Spatial Information Sciences, vol. 42, p. 37, 2017.
[9] J. Xie, M. Kiefel, M.-T. Sun, and A. Geiger, “Semantic instanceannotation of street scenes by 3d to 2d label transfer,” in Conferenceon Computer Vision and Pattern Recognition (CVPR), 2016.
[10] H. Caesar, V. Bankiti, A. H. Lang, S. Vora, V. E. Liong, Q. Xu, A. Kr-ishnan, Y. Pan, G. Baldan, and O. Beijbom, “nuscenes: A multimodaldataset for autonomous driving,” arXiv preprint arXiv:1903.11027,2019.
[11] W. Tan, N. Qin, L. Ma, Y. Li, J. Du, G. Cai, K. Yang, andJ. Li, “Toronto-3d: A large-scale mobile lidar dataset for semanticsegmentation of urban roadways,” in Proceedings of the IEEE/CVFConference on Computer Vision and Pattern Recognition Workshops,2020, pp. 202–203.
[12] T.-Y. Lin, M. Maire, S. Belongie, J. Hays, P. Perona, D. Ramanan,P. Dollar, and C. L. Zitnick, “Microsoft coco: Common objects incontext,” in European conference on computer vision. Springer, 2014,pp. 740–755.
[13] L. Wen, D. Du, Z. Cai, Z. Lei, M. Chang, H. Qi, J. Lim, M. Yang,and S. Lyu, “UA-DETRAC: A new benchmark and protocol formulti-object detection and tracking,” Computer Vision and ImageUnderstanding, 2020.
[14] Z. Tang, M. Naphade, M.-Y. Liu, X. Yang, S. Birchfield, S. Wang,R. Kumar, D. Anastasiu, and J.-N. Hwang, “Cityflow: A city-scalebenchmark for multi-target multi-camera vehicle tracking and re-identification,” in The IEEE Conference on Computer Vision andPattern Recognition (CVPR), June 2019.
[15] Z. Luo, F. Branchaud-Charron, C. Lemaire, J. Konrad, S. Li,A. Mishra, A. Achkar, J. Eichel, and P.-M. Jodoin, “Mio-tcd: A newbenchmark dataset for vehicle classification and localization,” IEEETransactions on Image Processing, vol. 27, no. 10, pp. 5129–5141,2018.
[16] M. Zwemer, R. Wijnhoven, and P. de With, “Ssd-ml: hierarchicalobject classification for traffic surveillance,” in 15th InternationalConference on Computer Vision, Imaging and Computer GraphicsTheory and Applications (VISAPP2020), G. Farinella, P. Radeva,and J. Braz, Eds., Feb. 2020, pp. 250–259. [Online]. Available:http://www.insticc.org
[17] X. Huang, P. He, A. Rangarajan, and S. Ranka, “Intelligentintersection: Two-stream convolutional networks for real-time near-accident detection in traffic video,” ACM Trans. Spatial AlgorithmsSyst., vol. 6, no. 2, Jan. 2020. [Online]. Available: https://doi.org/10.1145/3373647
[18] F.-f. Xun, X.-h. Yang, Y. Xie, and L.-y. Wang, “Congestion detectionof urban intersections based on surveillance video,” in 2018 18thInternational Symposium on Communications and Information Tech-nologies (ISCIT). IEEE, 2018, pp. 495–498.
[19] C. Premachandra, S. Ueda, and Y. Suzuki, “Detection and trackingof moving objects at road intersections using a 360-degree camerafor driver assistance and automated driving,” IEEE Access, vol. 8, pp.135 652–135 660, 2020.
[20] S. Hua, M. Kapoor, and D. C. Anastasiu, “Vehicle tracking and speedestimation from traffic videos,” in Proceedings of the IEEE Conferenceon Computer Vision and Pattern Recognition (CVPR) Workshops, June2018.
[21] Z. Liu, W. Zhang, X. Gao, H. Meng, X. Tan, X. Zhu, Z. Xue, X. Ye,H. Zhang, S. Wen, et al., “Robust movement-specific vehicle countingat crowded intersections,” in Proceedings of the IEEE/CVF Conferenceon Computer Vision and Pattern Recognition Workshops, 2020, pp.614–615.
[22] A. Simonelli, S. R. Bulo, L. Porzi, M. Lopez-Antequera, andP. Kontschieder, “Disentangling monocular 3d object detection,” inProceedings of the IEEE International Conference on ComputerVision, 2019, pp. 1991–1999.
[23] F. Chabot, M. Chaouch, J. Rabarisoa, C. Teuliere, and T. Chateau,“Deep manta: A coarse-to-fine many-task network for joint 2d and3d vehicle analysis from monocular image,” in Proceedings of theIEEE conference on computer vision and pattern recognition, 2017,pp. 2040–2049.
[24] A. Mousavian, D. Anguelov, J. Flynn, and J. Kosecka, “3d boundingbox estimation using deep learning and geometry,” in Proceedings ofthe IEEE Conference on Computer Vision and Pattern Recognition,2017, pp. 7074–7082.
[25] A. D. Pon, J. Ku, C. Li, and S. L. Waslander, “Object-centricstereo matching for 3d object detection,” in 2020 IEEE InternationalConference on Robotics and Automation (ICRA). IEEE, 2020, pp.8383–8389.
[26] Z. Liu, Z. Wu, and R. Toth, “Smoke: Single-stage monocular 3d objectdetection via keypoint estimation,” in Proceedings of the IEEE/CVFConference on Computer Vision and Pattern Recognition Workshops,2020, pp. 996–997.
[27] P. Li, H. Zhao, P. Liu, and F. Cao, “Rtm3d: Real-time monocular3d detection from object keypoints for autonomous driving,” arXivpreprint arXiv:2001.03343, 2020.
[28] C. Reading, A. Harakeh, J. Chae, and S. L. Waslander, “Categoricaldepth distributionnetwork for monocular 3d object detection,” CVPR,2021.
[29] A. K. Aijazi, P. Checchin, L. Malaterre, and L. Trassoudaine, “Auto-matic detection of vehicles at road intersections using a compact 3dvelodyne sensor mounted on traffic signals,” in 2016 IEEE IntelligentVehicles Symposium (IV), 2016, pp. 662–667.
[30] Z. Zhang, J. Zheng, H. Xu, and X. Wang, “Vehicle detectionand tracking in complex traffic circumstances with roadside lidar,”Transportation Research Record, vol. 2673, no. 9, pp. 62–71, 2019.[Online]. Available: https://doi.org/10.1177/0361198119844457
[31] J. Zhao, H. Xu, H. Liu, J. Wu, Y. Zheng, and D. Wu, “Detection andtracking of pedestrians and vehicles using roadside lidar sensors,”Transportation Research Part C: Emerging Technologies, vol. 100,pp. 68 – 87, 2019. [Online]. Available: http://www.sciencedirect.com/science/article/pii/S0968090X19300282
[32] J. Wu, H. Xu, Y. Tian, R. Pi, and R. Yue, “Vehicle detection underadverse weather from roadside lidar data,” Sensors, vol. 20, no. 12,p. 3433, Jun 2020. [Online]. Available: http://dx.doi.org/10.3390/s20123433
[33] J. Ku, M. Mozifian, J. Lee, A. Harakeh, and S. L. Waslander, “Joint3d proposal generation and object detection from view aggregation,”in 2018 IEEE/RSJ International Conference on Intelligent Robots andSystems (IROS). IEEE, 2018, pp. 1–8.
[34] S. Vora, A. H. Lang, B. Helou, and O. Beijbom, “Pointpainting:Sequential fusion for 3d object detection,” in Proceedings of theIEEE/CVF Conference on Computer Vision and Pattern Recognition,2020, pp. 4604–4612.
[35] H. Shi, “Geometry-aware traffic flow analysis by detection and track-ing,” in Proceedings of the IEEE Conference on Computer Vision andPattern Recognition Workshops, 2018, pp. 116–120.
[36] Y. Malinovskiy, Y.-J. Wu, and Y. Wang, “Video-based vehicle detectionand tracking using spatiotemporal maps,” Transportation researchrecord, vol. 2121, no. 1, pp. 81–89, 2009.
[37] H. Song, H. Liang, H. Li, Z. Dai, and X. Yun, “Vision-based vehicledetection and counting system using deep learning in highway scenes,”European Transport Research Review, vol. 11, no. 1, p. 51, 2019.
[38] B. Yang, M. Liang, and R. Urtasun, “Hdnet: Exploiting hdmaps for 3d object detection,” in Proceedings of The 2ndConference on Robot Learning, ser. Proceedings of Machine LearningResearch, A. Billard, A. Dragan, J. Peters, and J. Morimoto, Eds.,

vol. 87. PMLR, 29–31 Oct 2018, pp. 146–155. [Online]. Available:http://proceedings.mlr.press/v87/yang18b.html
[39] Y. Cai, D. Li, X. Zhou, and X. Mou, “Robust drivable road region de-tection for fixed-route autonomous vehicles using map-fusion images,”Sensors, vol. 18, no. 12, p. 4158, 2018.
[40] C. Yuan, H. Chen, J. Liu, D. Zhu, and Y. Xu, “Robust lane detection forcomplicated road environment based on normal map,” IEEE Access,vol. 6, pp. 49 679–49 689, 2018.
[41] M.-F. Chang, J. Lambert, P. Sangkloy, J. Singh, S. Bak, A. Hartnett,D. Wang, P. Carr, S. Lucey, D. Ramanan, et al., “Argoverse: 3dtracking and forecasting with rich maps,” in Proceedings of the IEEEConference on Computer Vision and Pattern Recognition, 2019, pp.8748–8757.
[42] B. Ravi Kiran, L. Roldao, B. Irastorza, R. Verastegui, S. Suss,S. Yogamani, V. Talpaert, A. Lepoutre, and G. Trehard, “Real-timedynamic object detection for autonomous driving using prior 3d-maps,” in Proceedings of the European Conference on ComputerVision (ECCV), 2018, pp. 0–0.
[43] K. Simonyan and A. Zisserman, “Very deep convolutional networksfor large-scale image recognition,” arXiv preprint arXiv:1409.1556,2014.
[44] Y. Xiao and R. Marlet, “Few-shot object detection and viewpointestimation for objects in the wild,” in Computer Vision – ECCV 2020,A. Vedaldi, H. Bischof, T. Brox, and J.-M. Frahm, Eds. Cham:Springer International Publishing, 2020, pp. 192–210.
[45] H. L. Pedrini, W. R. Schwartz, and W. R. Franklin, “Automaticextraction of topographic features using adaptive triangular meshes,”in Proceedings 2001 International Conference on Image Processing(Cat. No.01CH37205), vol. 3, 2001, pp. 732–735 vol.3.
[46] S. Ranka, A. Rangarajan, L. Elefteriadou, S. Srinivasan, E. Poasadas,D. Hoffman, R. Ponnulari, J. Dilmore, and T. Byron, “A vision ofsmart traffic infrastructure for traditional, connected, and autonomousvehicles,” in 2020 International Conference on Connected and Au-tonomous Driving (MetroCAD), 2020, pp. 1–8.
[47] S. Yang, E. Bailey, Z. Yang, J. Ostrometzky, G. Zussman, I. Seskar,and Z. Kostic, “Cosmos smart intersection: Edge compute and commu-nications for bird’s eye object tracking,” in 2020 IEEE InternationalConference on Pervasive Computing and Communications Workshops(PerCom Workshops), 2020, pp. 1–7.