Activity One: Water Cycle Water Cycle Activity Two: Water Idioms Water Idioms BACK.

Student Activity
Urbanizing the Water Cycle
Objectives As a result of these activities, students will be able to:
• Describe the natural movement of water in the hydrologic cycle • Identify the state of water as it moves through this cycle and the energy inputs that drive that
movement • Understand how increased urbanization impacts the hydrosphere and adjoining biosphere
Teacher Background Jacques Cousteau once said, “The sea is the universal sewer.” In many ways that assertion is very true. Let’s examine the systems designed to carry waste from homes, businesses, and industry. Sometimes the same network of pipes that carries waste also carries rainwater away from our streets and homes and deposits it directly into waterways. We have covered the natural landscape with materials that prevent the slow, natural flow of water across the Earth’s surface that is necessary to maintain the integrity of our rivers and streams. And even more surprisingly, in some parts of the world entire rivers are forced underground!
Often students relate the hydrologic cycle, or water cycle, in the simplest of diagrams including only natural systems, similar to the diagram below from NASA (http://pmm.nasa.gov/education/water-cycle). While this depiction of the hydrologic cycle is accurate, it does not represent the influence of urbanization on the system. All water exists in a watershed, an area or region that drains to a river, river system, or other body of water. Most, if not all, watersheds are impacted in some way by urbanization.
The water cycle is driven by heat from the sun and gravity that moves water underground. Water precipitates from clouds, falling as rain, then infiltrates or soaks into the ground to be stored as groundwater or taken up by plants. Some groundwater seeps deep into aquifers to be stored for long periods of time before recirculating back to our oceans or seeping up through underground springs. Energy from the sun powers evapotranspiration the evaporation of surface waters in lakes, rivers, and oceans combined with the release of water through the leaves of plants. Once the air becomes thick with water vapor, it condenses to form clouds. Then the cycle begins again with precipitation.

Student Activity
Materials Computer or tablet with Internet access Rainfall data sheets (either online or printed) for each small group Small paper bag or other opaque container
Printed Raindrops made from colored paper or plastic chips, templates included 37 Raindrops labeled Evapotranspiration 19 Raindrops labeled Shallow Infiltration 16 Raindrops labeled Deep Infiltration 29 Raindrops labeled Runoff
To set up this activity create four “community” stations in separate areas of the room or separate lab benches. Each station includes a small paper bag or other container with the following proportions of raindrops: **Do not reveal impervious cover identifiers until after simulation**
Community A: 10 raindrops labeled Evapotranspiration <10% Impervious Cover 6 raindrops labeled Shallow Infiltratio 7 raindrops labeled Deep Infiltration 2 raindrops labeled Runoff
Community B: 10 raindrops labeled Evapotranspiration 10 – 20% Impervious Cover 5 raindrops labeled Shallow Infiltration 5 raindrops labeled Deep Infiltration 5 raindrops labeled Runoff
Community C: 9 raindrops labeled Evapotranspiration 35 – 50% Impervious Cover 5 raindrops labeled Shallow Infiltration 3 raindrops labeled Deep Infiltration 8 raindrops labeled Runoff
Community D: 8 raindrops labeled Evapotranspiration 75 – 100% Impervious Cover 3 raindrops labeled Shallow Infiltration 1 raindrops labeled Deep Infiltration 14 raindrops labeled Runoff
Raindrop proportions for each community represent the distribution of rainfall through various pathways (Evapotranspiration, Runoff, Infiltration) based on the percent of impervious cover in a community. Do not reveal impervious cover estimates for each community prior to students conducting their experimental rainfall events. This will be the foundation for discussion during the explanation phase of this activity.

Student Activity
Vocabulary
Aquifer An underground layer of sand, gravel, or fractured rock, that is saturated with water
Condensation The conversion of water vapor to a liquid state
Evaporation The process by which water returns to the atmosphere in a gaseous state
Evapotranspiration The total from evaporation and plant transpiration that enters the atmosphere
Hydrologic Cycle The water cycle; the continuous movement of water on Earth and through the atmosphere
Impervious Cover Surfaces that water is not able to penetrate or move through
Infiltration The process in which water on the Earth’s surface seeps through the ground
Precipitation Water that falls from the atmosphere to Earth in the form of rain, sleet, hail, or snow
Runoff Excess water that flows over land instead of percolating through the ground, often containing contaminants
Watershed An area or region drained by a river, river system, or other body of water
Engage Have students watch the EarthEcho Expedition: Into the Dead Zone Day 2 video segment What Happens When we Build Cities? and explore the webpage for additional content.
Show the National Geographic gallery 11 Rivers Forced Underground at (http://environment.nationalgeographic.com/environment/photos/underground-rivers/)
Discuss the topography of your school campus or surrounding community. Ask students to identify places that flood or get “washed out” during large rain events. Have students relate their personal observations about the way rainfall moves on campus or in the community. Ask, “Do people affect the way the water cycle works?”
Student Activity
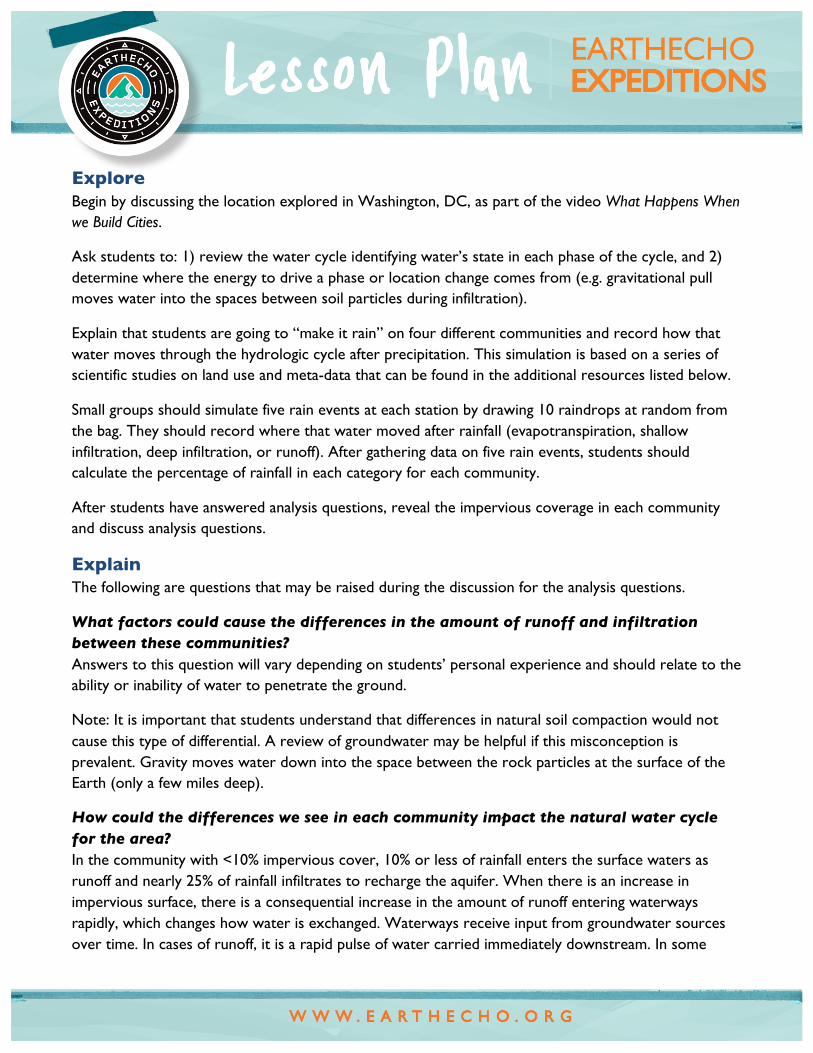
Explore Begin by discussing the location explored in Washington, DC, as part of the video What Happens When we Build Cities.
Ask students to: 1) review the water cycle identifying water’s state in each phase of the cycle, and 2) determine where the energy to drive a phase or location change comes from (e.g. gravitational pull moves water into the spaces between soil particles during infiltration).
Explain that students are going to “make it rain” on four different communities and record how that water moves through the hydrologic cycle after precipitation. This simulation is based on a series of scientific studies on land use and meta-data that can be found in the additional resources listed below.
Small groups should simulate five rain events at each station by drawing 10 raindrops at random from the bag. They should record where that water moved after rainfall (evapotranspiration, shallow infiltration, deep infiltration, or runoff). After gathering data on five rain events, students should calculate the percentage of rainfall in each category for each community.
After students have answered analysis questions, reveal the impervious coverage in each community and discuss analysis questions.
Explain The following are questions that may be raised during the discussion for the analysis questions.
What factors could cause the differences in the amount of runoff and infiltration between these communities? Answers to this question will vary depending on students’ personal experience and should relate to the ability or inability of water to penetrate the ground.
Note: It is important that students understand that differences in natural soil compaction would not cause this type of differential. A review of groundwater may be helpful if this misconception is prevalent. Gravity moves water down into the space between the rock particles at the surface of the Earth (only a few miles deep).
How could the differences we see in each community impact the natural water cycle for the area? In the community with <10% impervious cover, 10% or less of rainfall enters the surface waters as runoff and nearly 25% of rainfall infiltrates to recharge the aquifer. When there is an increase in impervious surface, there is a consequential increase in the amount of runoff entering waterways rapidly, which changes how water is exchanged. Waterways receive input from groundwater sources over time. In cases of runoff, it is a rapid pulse of water carried immediately downstream. In some

Student Activity
communities students will observe more than half of the rainfall becoming runoff. In addition, as deep infiltration decreases, the water table drops, thus reducing groundwater availability.
What community do you predict has the cleanest overall surface water (rivers, streams, lakes, and ponds)? Why? Waterways can also be overwhelmed by the amount of water that enters all at once during a rain event, which can increase the frequency and intensity of flooding. This can have long-term ecosystem impacts for the waterway, including reduced vegetation, bank destabilization, and reduced water quality. Students should make the connection that increased runoff potentially leads to decreased water quality through increased contaminants and sediment in the waterway.
Elaborate Have students depict one or each of the four communities graphically, calculating the impervious cover for each community. Would they make improvements to any of the communities? If so, have them propose new design ideas.
Explain how some of the BMP’s (best management practices) shown in What Happens When We Build Cities? can be used to increase infiltration.
References and Resources Chester L. Arnold and C. James Gibbons. "Impervious Surface Coverage: The Emergence of a Key Environmental Indicator." Journal of the American Planning Association. Spring, 1996. p. 255
CA Water & Land Use Partnership www.coastal.ca.gov/nps/watercyclefacts.pdf
Center for Watershed Protection www.cwp.org
National NEMO Network http://nemonet.uconn.edu/
Low Impact Development Center www.lowimpactdevelopment.org
The Stormwater Manager’s Resource Center www.stormwatercenter.net
Student Activity
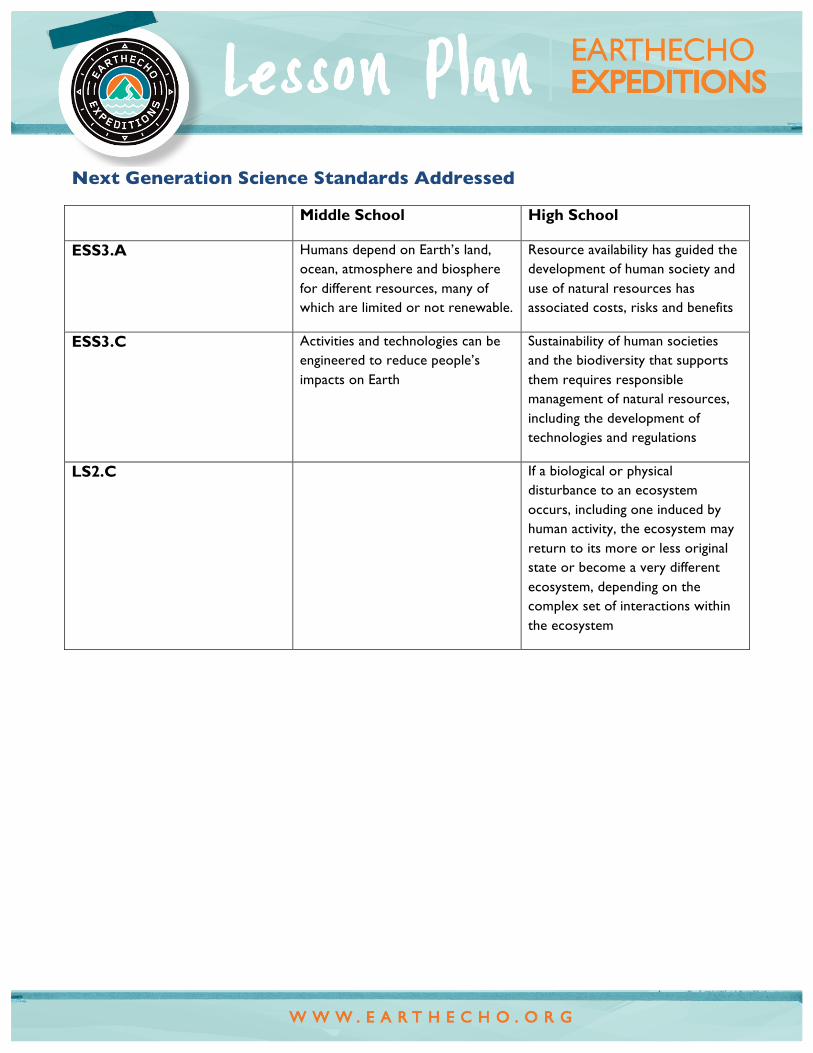
Next Generation Science Standards Addressed
Middle School High School
ESS3.A Humans depend on Earth’s land, ocean, atmosphere and biosphere for different resources, many of which are limited or not renewable.
Resource availability has guided the development of human society and use of natural resources has associated costs, risks and benefits
ESS3.C Activities and technologies can be engineered to reduce people’s impacts on Earth
Sustainability of human societies and the biodiversity that supports them requires responsible management of natural resources, including the development of technologies and regulations
LS2.C If a biological or physical disturbance to an ecosystem occurs, including one induced by human activity, the ecosystem may return to its more or less original state or become a very different ecosystem, depending on the complex set of interactions within the ecosystem

Student Activity
Evapotranspiration
Evapotranspiration
Evapotranspiration
Evapotranspiration
Evapotranspiration
Runoff
Evapotranspiration
Evapotranspiration
Evapotranspiration
Evapotranspiration
Evapotranspiration
Evapotranspiration
Evapotranspiration
Evapotranspiration
Evapotranspiration
Evapotranspiration
Runoff Runoff Runoff Runoff

Student Activity
Runoff Runoff Runoff Runoff Runoff
Runoff Runoff Runoff Runoff Runoff
Runoff Runoff Runoff Runoff Runoff
Runoff Runoff Runoff Runoff
Evapotranspiration
Evapotranspiration

Student Activity
Runoff Runoff Runoff Runoff Runoff
Shallow Infiltration
Shallow Infiltration
Shallow Infiltration
Shallow Infiltration
Shallow Infiltration
Shallow Infiltration
Shallow Infiltration
Shallow Infiltration
Shallow Infiltration
Shallow Infiltration
Shallow Infiltration
Shallow Infiltration
Shallow Infiltration
Shallow Infiltration
Shallow Infiltration

Student Activity
Deep Infiltration Shallow
Infiltration Shallow Infiltration
Shallow Infiltration
Shallow Infiltration
Deep Infiltration
Deep Infiltration
Deep Infiltration
Deep Infiltration
Deep Infiltration
Deep Infiltration
Deep Infiltration
Deep Infiltration
Deep Infiltration
Deep Infiltration
Deep Infiltration
Deep Infiltration
Deep Infiltration
Deep Infiltration
Deep Infiltration

Student Activity
Evapotranspiration
Evapotranspiration
Evapotranspiration
Evapotranspiration
Evapotranspiration
Evapotranspiration
Evapotranspiration
Evapotranspiration
Evapotranspiration
Evapotranspiration
Evapotranspiration
Evapotranspiration
Evapotranspiration
Evapotranspiration
Evapotranspiration
Evapotranspiration
Evapotranspiration
Evapotranspiration
Evapotranspiration
Evapotranspiration
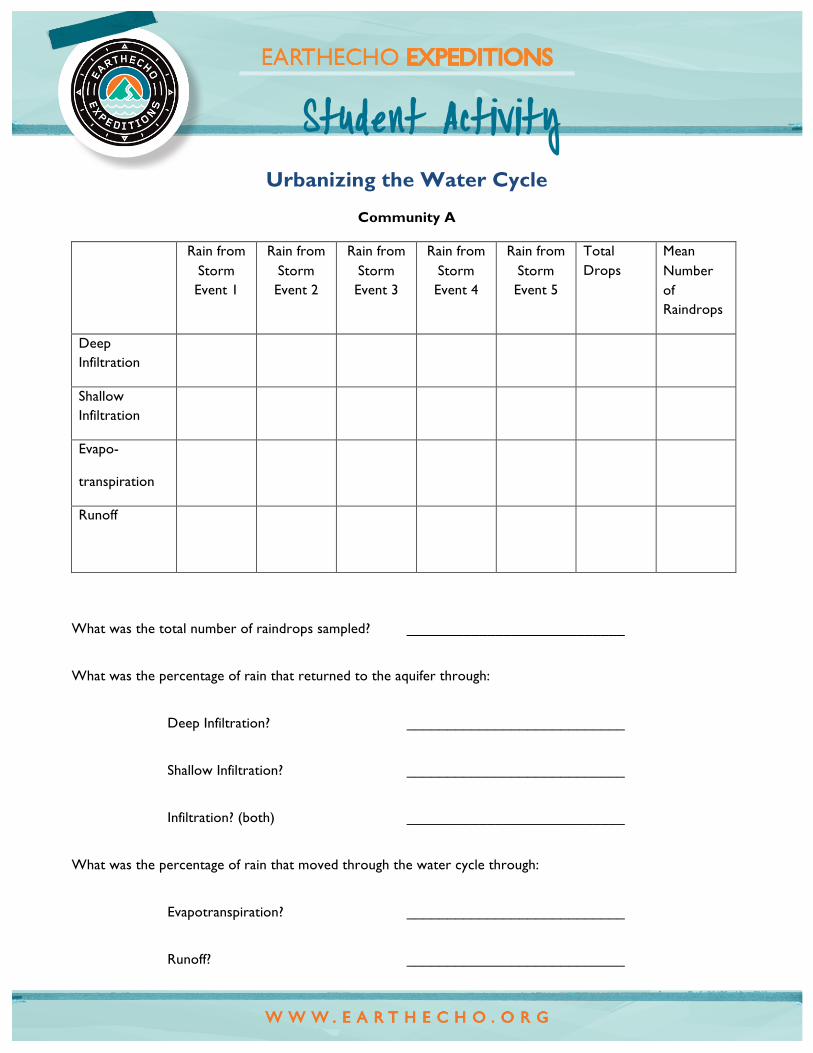
Student Activity
Urbanizing the Water Cycle
Community A
Rain from Storm Event 1
Rain from Storm Event 2
Rain from Storm Event 3
Rain from Storm Event 4
Rain from Storm Event 5
Total Drops
Mean Number of Raindrops
Deep Infiltration
Shallow Infiltration
Evapo-
transpiration
Runoff
What was the total number of raindrops sampled? ___________________________
What was the percentage of rain that returned to the aquifer through:
Deep Infiltration? ___________________________
Shallow Infiltration? ___________________________
Infiltration? (both) ___________________________
What was the percentage of rain that moved through the water cycle through:
Evapotranspiration? ___________________________
Runoff? ___________________________

Student Activity
Urbanizing the Water Cycle
Community B
Rain from Storm Event 1
Rain from Storm Event 2
Rain from Storm Event 3
Rain from Storm Event 4
Rain from Storm Event 5
Total Drops
Mean Number of Rain Drops
Deep Infiltration
Shallow Infiltration
Evapo-
transpiration
Runoff
What was the total number of raindrops sampled? ___________________________
What was the percentage of rain that returned to the aquifer through:
Deep Infiltration? ___________________________
Shallow Infiltration? ___________________________
Infiltration? (both) ___________________________
What was the percentage of rain that moved through the water cycle through:
Evapotranspiration? ___________________________
Runoff? ___________________________
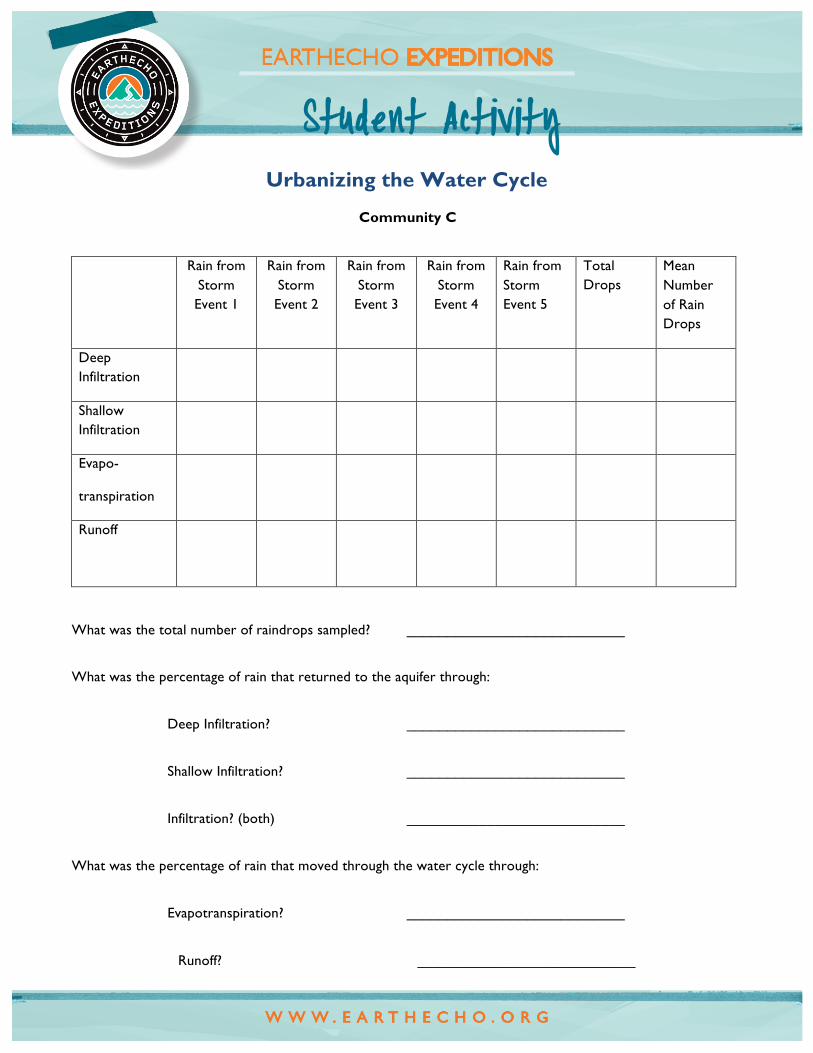
Student Activity
Urbanizing the Water Cycle
Community C
Rain from Storm Event 1
Rain from Storm Event 2
Rain from Storm Event 3
Rain from Storm Event 4
Rain from Storm Event 5
Total Drops
Mean Number of Rain Drops
Deep Infiltration
Shallow Infiltration
Evapo-
transpiration
Runoff
What was the total number of raindrops sampled? ___________________________
What was the percentage of rain that returned to the aquifer through:
Deep Infiltration? ___________________________
Shallow Infiltration? ___________________________
Infiltration? (both) ___________________________
What was the percentage of rain that moved through the water cycle through:
Evapotranspiration? ___________________________
Runoff? ___________________________

Student Activity
Urbanizing the Water Cycle
Community D
Rain from Storm Event 1
Rain from Storm Event 2
Rain from Storm Event 3
Rain from Storm Event 4
Rain from Storm Event 5
Total Drops
Mean Number of Rain Drops
Deep Infiltration
Shallow Infiltration
Evapo-
transpiration
Runoff
What was the total number of raindrops sampled? ___________________________
What was the percentage of rain that returned to the aquifer through:
Deep Infiltration? ___________________________
Shallow Infiltration? ___________________________
Infiltration? (both) ___________________________
What was the percentage of rain that moved through the water cycle through:
Evapotranspiration? ___________________________
Runoff? ___________________________
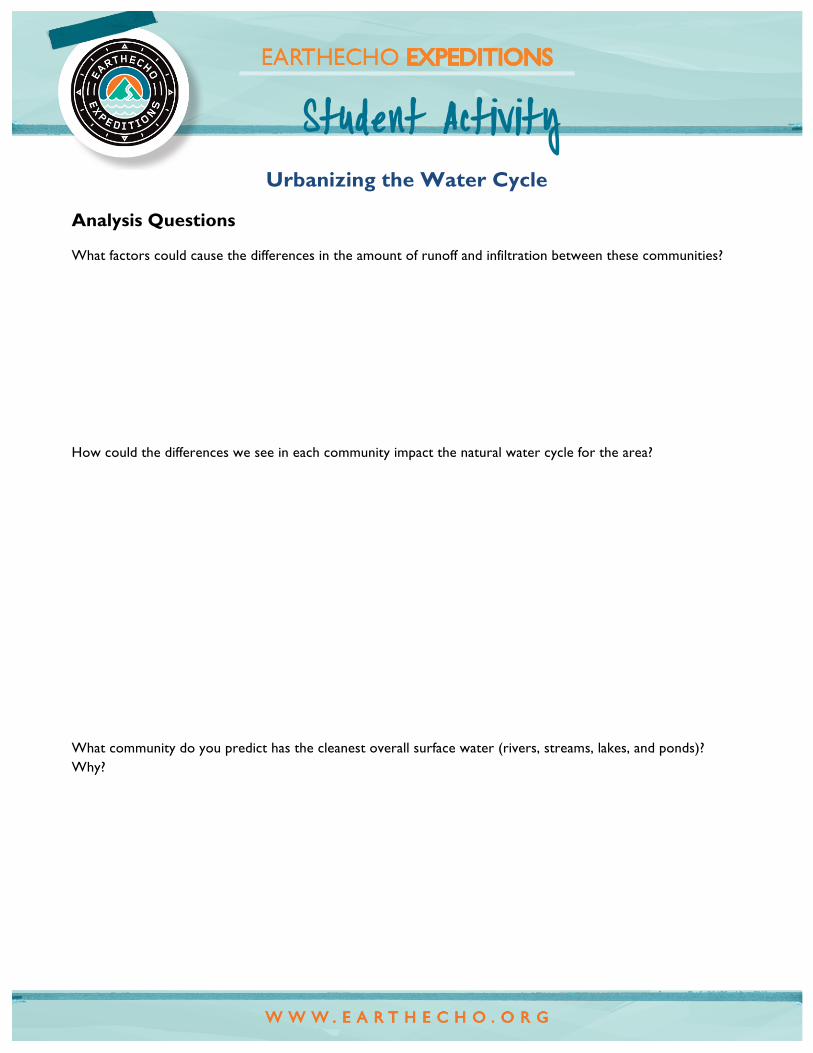
Student Activity
Urbanizing the Water Cycle
Analysis Questions
What factors could cause the differences in the amount of runoff and infiltration between these communities?
How could the differences we see in each community impact the natural water cycle for the area?
What community do you predict has the cleanest overall surface water (rivers, streams, lakes, and ponds)? Why?