Urbanization, Human Capital, and Cross-Country Productivity...
35
Urbanization, Human Capital, and Cross-Country Productivity Differences Alok Kumar * Brianne Kober ** April 2012 Abstract In this paper, we empirically examine the effects of health, education, and urbanization on the total factor productivity (TFP) of a large number of countries. We estimate TFP using a variant of augmented Solow growth model in which health capital is one of the factors of production. We find that both the level of urbanization and health capital proxied by life-expectancy, infant mortality rate and the risk of malaria significantly affect TFP. On the other hand, education has insignificant effect on TFP. Coefficients of the indicators of health and urbanization remain significant even after controlling for endogeneity. Keywords: Augmented Solow Growth Model, TFP, Health, Education, Life-Expectancy, Infant Mortality Rate, Malaria, Urbanization JEL Code: F43; E23; N10; N30; O47 Address: * Department of Economics, University of Victoria, Victoria, British Columbia, Canada, V8W 2Y2, Email: [email protected]. ** De- partment of Economics, University of Victoria, Victoria, British Columbia, Canada, V8W 2Y2, Email: [email protected]. This re- search is supported by the Social Sciences and the Humanities Research Council (Canada). We thank the participants of the CEA 2011 meeting for their useful comments.
Transcript of Urbanization, Human Capital, and Cross-Country Productivity...

Urbanization, Human Capital, andCross-Country Productivity Differences
Alok Kumar∗
Brianne Kober∗∗
April 2012
Abstract
In this paper, we empirically examine the effects of health, education,and urbanization on the total factor productivity (TFP) of a large numberof countries. We estimate TFP using a variant of augmented Solow growthmodel in which health capital is one of the factors of production. We find thatboth the level of urbanization and health capital proxied by life-expectancy,infant mortality rate and the risk of malaria significantly affect TFP. Onthe other hand, education has insignificant effect on TFP. Coefficients of theindicators of health and urbanization remain significant even after controllingfor endogeneity.
Keywords: Augmented Solow Growth Model, TFP, Health, Education,Life-Expectancy, Infant Mortality Rate, Malaria, Urbanization
JEL Code: F43; E23; N10; N30; O47
Address: ∗ Department of Economics, University of Victoria, Victoria,British Columbia, Canada, V8W 2Y2, Email: [email protected]. ∗∗ De-partment of Economics, University of Victoria, Victoria, British Columbia,Canada, V8W 2Y2, Email: [email protected]. This re- search is supportedby the Social Sciences and the Humanities Research Council (Canada). Wethank the participants of the CEA 2011 meeting for their useful comments.
1 Introduction
Economic development is the process of structural transformation. There arethree crucial aspects of this transformation process. Firstly, low productivityeconomies become high productivity economies. Secondly, primarily ruraleconomies become urbanized. Empirical evidence suggests that no countryhas ever reached middle-income status without a significant population shiftinto cities. Thirdly, low-income countries are characterized by low level ofhuman capital attainment, both in terms of education and health, while high-income countries are characterized by high level of human capital attainment(HDR 2010). Development process involves transforming economies withlow human capital into economies with high human capital. Urbanization,increase in human capital and productivity, and development go together.
The main aim of this paper is to empirically investigate the effects ofurbanization and human capital (both education and health) on total factorproductivity (TFP) across countries. This exercise is important for manyreasons. Firstly, TFP differences account for most of the cross-country dif-ferences in per-capita income and TFP growth is identified to be the maindriver of the long run increase in the standard of living (e.g. Hall and Jones1997, Klenow and Rodriguez 1997, Weil 2007). Secondly, there is a largetheoretical literature (see below) which suggests that both urbanization andhuman capital affect productivity levels in variety of ways. Thirdly, the-oretical literature suggests that urbanization and human capital formationinteract in important ways.
There is a large theoretical literature which suggests that urbanizationaffects the growth process and productivity levels in many ways (e.g. Landes1969, Williamson 1987, Burgess and Venables 2004, Henderson 2005, Lucas2004, 2007). Firstly, urbanization provides economies of scale which allowsspecialization among firms leading to low cost of production. It also allowsspecialized services– such as accounting, management services, intellectualproperty management to emerge. Economies of scale in cities also reducetransaction costs. High population densities in cities allow both workerswith differentiated skills and firms with specific needs to reduce their searchcost and mismatch of skills and jobs.
Secondly, urbanization enhances the flow of ideas and knowledge due toagglomeration effect. By bringing together large numbers of people, cities fa-cilitate interactions needed to generate, diffuse, and accumulate knowledge.Empirical evidence from developed countries suggests that agglomerationeffects on productivity are strong (see Rosenthal and Strange 2004 and Hen-derson 2005 for a review).
Thirdly, both economies of scale and agglomeration effect increase the
1

return from investment in human capital. This encourages more investmentin human capital. Also public services such as hospitals and universitiesrequire a critical mass of consumers to make them economically viable. Thepopulation density of urban areas increases the range of such services andfacilitates human capital formation. Thus, urbanization affects both thedemand and the supply of human capital.
There are variety of reasons education and health capital can affect TFP.Education capital determines the ability of a nation to develop new tech-nologies and adopt, implement, and effectively utilize existing technologies(Acemoglu et. al. 2006, Aghion and Howitt 2009). It affects the speed oftechnological catch up and diffusion ( Nelson and Phelps 1966, Benhabib andSpiegel 1994, 2005). Education also increases heath outcomes by spreadingknowledge of good health practices and hygiene.
Similarly, health influences TFP directly through its effect on labor pro-ductivity and technology adoption. Healthier workers are more productivebecause of their larger capacity to work. Poor health reduces the availabilityof workers. Lvovsky (2001) estimates that the burden of disease in the devel-oping countries measured in terms of disability-adjusted life years (DALYs)lost per million people is about twice that in the developed countries. It alsoworks as disincentive for acquiring and adopting newer technologies. Higherdisease burden also reduces TFP indirectly. Acemoglu et. al. (2000) arguethat higher mortality rate of European settlers in tropical countries inducedthem to develop exploitative institutions in these countries. Poor health re-duces the return from education and thus incentives of individuals to acquireeducation. There is also large number of studies which suggest that healthierchildren have better cognitive ability.
Our analysis involves two steps. First, we estimate TFP of 100 countriesusing a variant of augmented Solow growth model of Mankiw et. al. (1992).We use panel data approach of Islam (1995) for this estimation. Our dataspans the period 1960-2005 and we include health capital proxied by life-expectancy and infant mortality rate as one of the regressors. In the secondstep, we examine the determinants of TFP, especially the role of urbaniza-tion, health, and education. We proxy urbanization by the percentage ofpopulation living in urban areas. We use three measures of health capital– life-expectancy, infant mortality rate, and risk of malaria indicating bur-den of disease. We proxy education by average years of schooling and theschool completion rates. To control for potential endogeneity of urbanization,health, and education, we use instrument variable approach.
The main findings of this paper are as follows. Firstly, both urbanizationand health indicators significantly affect TFP. The coefficients of urbaniza-tion and health indicators remain significant even after controlling for their
2
endogeneity. The analysis suggests that health capital affects growth bothdirectly as a factor of production and indirectly through its effect on TFP.Secondly, none of the education variables has significant effect on TFP. Ed-ucation does not seem to have independent effect on TFP. Finally, apartfrom urbanization and health indicators, legal origin and natural resourcessignificantly affect TFP.
This paper relates to the large empirical literature which examines thedeterminants of TFP (see Isaksson 2007 for a review). In particular, thispaper relates to Miller and Upadhyay (2000), Hojo (2003), and Cole andNeumayer (2006). Miller and Upadhyay (2000) and Hojo (2003) study theeffects of mean years of schooling on TFP. Miller and Upadhyay (2000) findthat education has insignificant effect on TFP, while Hojo (2003) finds thateducation has significant and positive effect on TFP. Cole and Neumayer(2006) study the impact of risk of malaria, undernourishment, and water-borne disease on TFP and find that they significantly affect TFP.
Our paper differs from these studies in a number of ways. Firstly, thesestudies do not analyze the joint effects of urbanization, education and healthon TFP. Since, urbanization and health indicators significantly affect TFP,these studies suffers from the omitted variable bias. Secondly, none of thesestudies include health capital in their first-stage regression. Given that healthcapital significantly affects per-capita income and correlated with other fac-tors of production, their estimate of TFP suffers from the omitted variablebias. Finally, Miller and Upadhyay (2000) and Hojo (2003) do not controlfor the potential endogenity of education.
There is also a large empirical literature which examines the effects ofeconomies of scale and agglomeration effects on productivity (Rosenthal andStrange 2004, Henderson 2005). This literature is mainly focussed on theexperience of developed countries. Also they do not study the role of urban-ization in explaining international differences in TFP, which is the focus ofthis study.
Rest of the paper is organized as follows. Section II discusses the method-ology. Section III describes the estimation method and data. In Section IV,we present and analyze the results of our first-stage (growth) regression. InSection V we provide preliminary analysis of differences in TFP across coun-tries. In section VI we empirically examine the determinants of TFP, inparticular the role of urbanization, health, and education. This is followedby conclusion. The description of data is provided in Appendix I.
3

2 Methodology
Let the production function be
Yit = [AitLit]1−α−βKα
itHβit (1)
where Y is output, A is technology, L, K, and H are labor, physical andhealth capital respectively, α and β are the elasticities of output with respectto physical and health capital respectively, and the subscripts denote country(i) and time (t).1 Letting lower case letters with ˆ denoting variables per“effective” labor unit (e.g. yit = Yit
AitLit) the production function can be
written in the intensive form as
yit = kαith
βit. (2)
Assume that labor force in country i grows at the country specific rate,ni, and technology advances at the common rate, g, across all countries andthat the physical and human capital stocks depreciate at the rate, δ. Thus,Lit = Li0 expnit and Ait = Ai0 expgt.
Let k∗i and h∗i denote the steady state levels of physical and health capitalper-effective labor unit respectively in country i. Also let sK
i and sHi denote
the investment rates for physical and health capitals respectively in countryi. Then, k∗i and h∗i are given by
k∗i =
[(sK
i )1−β(sHi )β
ni + g + δ
] 11−α−β
; (3)
h∗i =
[(sK
i )α(sHi )1−α
ni + g + δ
] 11−α−β
. (4)
Let lower case letters denote variables per worker (e.g. yit = Yit
Lit), then,
using (2), (3) and (4) following the steps given in Mankiw et. al. (1992), onecan derive,
ln yit = ln Ai0 + gt− α
1− αln(ni + g + δ) +
α
1− αln sK
i +β
1− αln h∗i . (5)
1We do not include education as a factor of production. In the growth regression,none of the indicators of education turn out to be significant. These results are similarto previous studies, which show that education has insignificant effect on real per-capitaincome either when fixed-effects (e.g. Islam 1995) or health indicators (Knowles and Owen1995) or both (e.g. McDonald and Roberts 2002) are included in the growth regression.
4

Equation (5) is a steady state relationship. Let t1 and t2 denote theinitial period and the current period respectively. Let τ denote the differencebetween the current and initial periods, i.e. τ = t2 − t1. Then by linearizing(5) around the steady state, one can derive (see Mankiw et. al. 1992, Islam1995)
ln yit2 =(1− exp−λτ )α
1− αln sK
iτ −(1− exp−λτ )α
1− αln(niτ + g + δ)+
(1− exp−λτ )β
1− αln h∗iτ +exp−λτ ln yit1+g(t2−expλτ t1)+(1−exp−λτ ) ln Ai0 (6)
where λ = (1 − α − β)(n + g + δ) is the rate of convergence. yit1 and yit2
refer to per-worker real income in periods t1 and t2 respectively. sKiτ , h∗iτ , and
niτ refer to average savings rate, health capital, and labor force growth raterespectively over the period τ = t2 − t1 in country i.
Equation (6) represents a dynamic panel data model with (1−exp−λτ ) ln Ai0
as the time-invariant country-effect term. It can be written in the followingconventional form of panel data literature:
yi,t = γyi,t−1 +3∑
j=1
φjxjit + ηt + µi + vit (7)
with
yi,t = ln yit2 ; yi,t−1 = ln yit1 ; x1it = ln sK
iτ ; x2it = ln(niτ + g + δ);
x3it = ln h∗iτ ; ηt = g(t2 − expλτ t1) & µi = (1− exp−λτ ) ln Ai0 (8)
where vit is the idiosyncratic error term with mean zero. Note that Solowmodel puts the restriction that φ1 = −φ2. Also we expect φ1 & φ3 > 0 andφ2 < 0. In the first step, we use (7) and (8) to derive estimates of α, β, andAi0. Ai0 can be recovered from the following relation
ln Ai0 =µi
1− expλτ. (9)
In the second step, we analyze determinants of cross-country TFP differ-ences. For this analysis, we estimate the following regression:
ln Ai0 = ΞX + ui (10)
where Ξ is the vector of coefficients, X is the matrix of explanatory variablesincluding constant term, and ui is the idiosyncratic term with mean zero.
5
3 Estimation Method and Data
3.1 Estimation
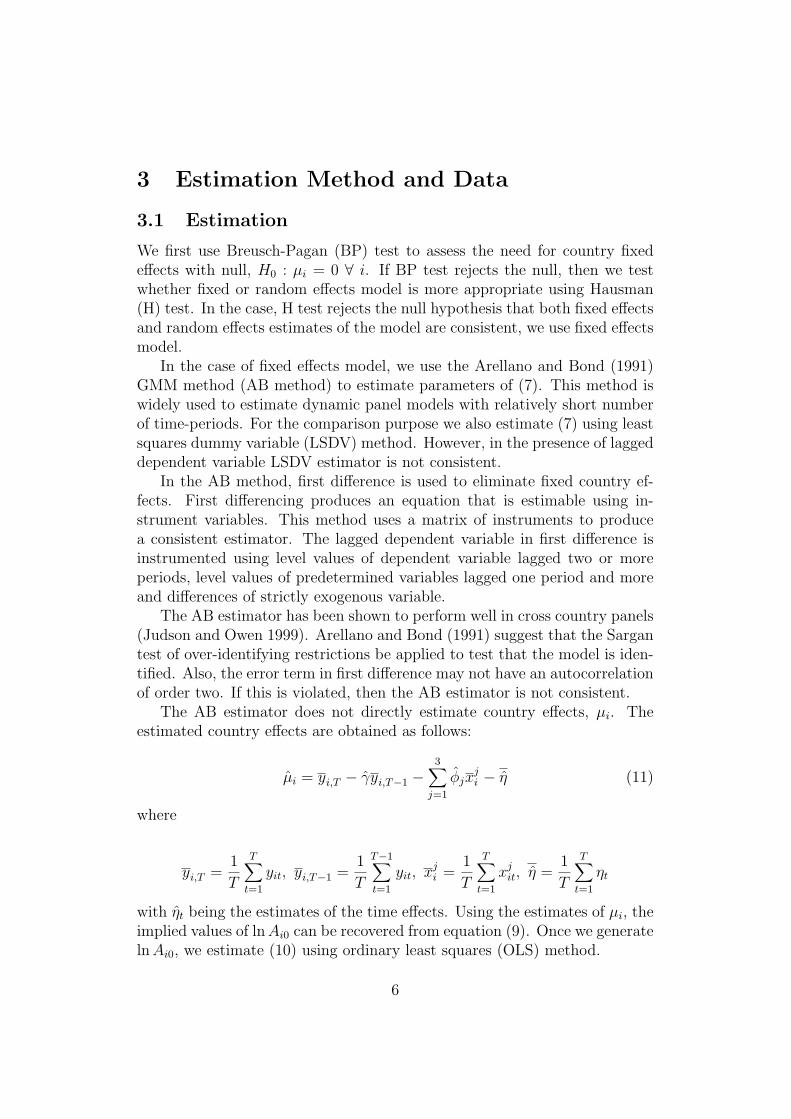
We first use Breusch-Pagan (BP) test to assess the need for country fixedeffects with null, H0 : µi = 0 ∀ i. If BP test rejects the null, then we testwhether fixed or random effects model is more appropriate using Hausman(H) test. In the case, H test rejects the null hypothesis that both fixed effectsand random effects estimates of the model are consistent, we use fixed effectsmodel.
In the case of fixed effects model, we use the Arellano and Bond (1991)GMM method (AB method) to estimate parameters of (7). This method iswidely used to estimate dynamic panel models with relatively short numberof time-periods. For the comparison purpose we also estimate (7) using leastsquares dummy variable (LSDV) method. However, in the presence of laggeddependent variable LSDV estimator is not consistent.
In the AB method, first difference is used to eliminate fixed country ef-fects. First differencing produces an equation that is estimable using in-strument variables. This method uses a matrix of instruments to producea consistent estimator. The lagged dependent variable in first difference isinstrumented using level values of dependent variable lagged two or moreperiods, level values of predetermined variables lagged one period and moreand differences of strictly exogenous variable.
The AB estimator has been shown to perform well in cross country panels(Judson and Owen 1999). Arellano and Bond (1991) suggest that the Sargantest of over-identifying restrictions be applied to test that the model is iden-tified. Also, the error term in first difference may not have an autocorrelationof order two. If this is violated, then the AB estimator is not consistent.
The AB estimator does not directly estimate country effects, µi. Theestimated country effects are obtained as follows:
µi = yi,T − γyi,T−1 −3∑
j=1
φjxji − η (11)
where
yi,T =1
T
T∑
t=1
yit, yi,T−1 =1
T
T−1∑
t=1
yit, xji =
1
T
T∑
t=1
xjit, η =
1
T
T∑
t=1
ηt
with ηt being the estimates of the time effects. Using the estimates of µi, theimplied values of ln Ai0 can be recovered from equation (9). Once we generateln Ai0, we estimate (10) using ordinary least squares (OLS) method.
6

3.2 Data
In this section, we describe data pertaining to the first stage (growth) re-gression. Our main sources of data are Penn World Tables 6.3 and WorldDevelopment Indicators. Income, savings, and labor force growth rate dataare from Penn World Tables. The income data are real GDP per-worker ad-justed for purchasing power parity (PPP). For savings rate we use the ratioof real investment to real GDP (series ki in Penn World Tables). The laborforce growth rate, ni, is calculated as follows. Using real GDP per capita andreal GDP per worker adjusted for PPP (GDPPOP and GDPWOK in PennWorld Tables), we generate labor force participation rate (LFPR) for eachcountry. Then, using LFPR and population we calculate labor force and itsgrowth. Following Mankiw et. al. (1992), we set (g + δ) to be equal to 0.05and assume this value to be the same for all countries and years.
We use two proxies for health capital: one based on life-expectancy (LLE)and the other based on infant mortality rate (LMR). Adopting the transfor-mation used by Anand and Ravallion (1993), we define LLE = − ln(90−LE),where (90 − LE) is the shortfall of average life expectancy (LE) at birthfrom 90 years. This proxy for health capital is widely used in the literature(Knowles and Owen 1995 2008, McDonlad and Roberts 2002). We defineLMR = ln IMR where IMR is the infant mortality rate. The data for thelife expectancy and the infant mortality rate are taken from the World De-velopment Indicators.
In the sample, we include only those countries for which data is availablefor the entire period, 1960-2005. Also we exclude countries with population ofless than one million at the end of 2005. Data for life-expectancy is availablefor 100 countries. But the data for infant mortality is available only for 71countries. Thus, in the case we use LLE, our sample includes 100 countries.But in the case of LMR, our sample includes 71 countries. The summarystatistics of data is given in Table 1 below.
Table 1Summary Statistics (1960-2005)
Variables Mean Std. Dev. Max Min
yi,t 9.27 1.10 11.39 6.71ln(sK
iτ ) 2.76 0.70 4.06 0.21ln(niτ + g + δ) -2.64 0.27 -1.92 -8.51
LLE∗iτ -3.27 0.45 -4.12 -2.11
LMR∗iτ 1.55 0.46 2.31 0.32
For panel analysis, similar to Islam (1995) we divide the total period into
7

several shorter time spans, each consisting of five years. Thus, we have tendata (time) points for each country: 1960, 1965, 1970, 1975, 1980, 1985,1990, 1995, 2000, 2005. When t = 1965 for example, then t− 1 = 1960, andsavings rate, sK
iτ , labor force growth rate, niτ , and health capital, LLE∗iτ or
LMR∗iτ , are averages over 1961− 1965. However, the real income per worker
for time t, yit, is the real income per worker for year 1965 and yit−1 is thereal income per worker for year 1960. The vit’s pertain to five year spansand hence less likely to be serially correlated and less influenced by businesscycle fluctuations than they would be in a yearly data setup.
4 Estimated Results: Growth Regression
Tables 2 and 3 present the results of the first stage regression. Table 2 showsresults based on LLE and table 3 shows results based on LMR. In both cases,we first perform BP and H tests. The results of these tests suggest thatfixed effects model is the appropriate model for estimating (7). The upperpanel presents the unrestricted version of (7) and the lower panel restrictedversion. To test for restriction implied by the Solow model (φ1 = −φ2), weuse Wald test. The implied restriction is not rejected for any of the estimatedequations.
The two columns report results from AB method. The third column re-ports results from LSDV estimation method. Standard errors are reported inthe parentheses. The AB method provides for one-step and two-step estima-tors. Before proceeding to discuss the results, we clarify their interpretations.The one-step method assumes the absence of heteroskedasticity and the Sar-gan test over-rejects when this is not true. The two-step estimator uses thedifferenced residuals from the first-step estimator for additional information.The standard errors of the two-step estimator tend to be biased downwardin the case of small samples (Baltagi 2005).
In what follows, we take two-step specification as our preferred model,though it exaggerates the efficiency of estimates. This is done for variety ofreasons. Firstly, Sargan test results support a two-step specification in placeof one-step estimates. Secondly, we have a large sample size. Thirdly, thesize and the sign of one-step estimates and two-step estimates are mostly thesame. Finally, one-step estimates of coefficients for key explanatory variablessuch as lagged dependent variable, health capital, and investment rate areall statistically significant.
Table 2 here
The regression results given in Table 2 show that all the explanatory
8
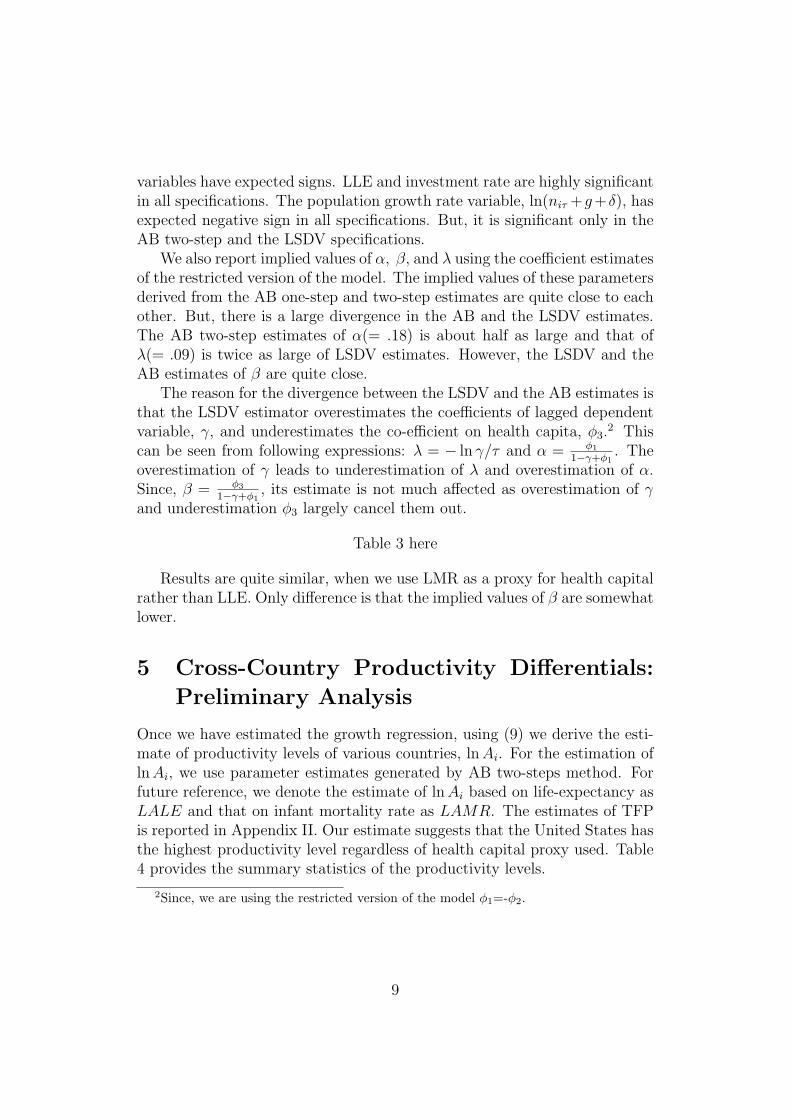
variables have expected signs. LLE and investment rate are highly significantin all specifications. The population growth rate variable, ln(niτ +g+δ), hasexpected negative sign in all specifications. But, it is significant only in theAB two-step and the LSDV specifications.
We also report implied values of α, β, and λ using the coefficient estimatesof the restricted version of the model. The implied values of these parametersderived from the AB one-step and two-step estimates are quite close to eachother. But, there is a large divergence in the AB and the LSDV estimates.The AB two-step estimates of α(= .18) is about half as large and that ofλ(= .09) is twice as large of LSDV estimates. However, the LSDV and theAB estimates of β are quite close.
The reason for the divergence between the LSDV and the AB estimates isthat the LSDV estimator overestimates the coefficients of lagged dependentvariable, γ, and underestimates the co-efficient on health capita, φ3.
2 Thiscan be seen from following expressions: λ = − ln γ/τ and α = φ1
1−γ+φ1. The
overestimation of γ leads to underestimation of λ and overestimation of α.Since, β = φ3
1−γ+φ1, its estimate is not much affected as overestimation of γ
and underestimation φ3 largely cancel them out.
Table 3 here
Results are quite similar, when we use LMR as a proxy for health capitalrather than LLE. Only difference is that the implied values of β are somewhatlower.
5 Cross-Country Productivity Differentials:
Preliminary Analysis
Once we have estimated the growth regression, using (9) we derive the esti-mate of productivity levels of various countries, ln Ai. For the estimation ofln Ai, we use parameter estimates generated by AB two-steps method. Forfuture reference, we denote the estimate of ln Ai based on life-expectancy asLALE and that on infant mortality rate as LAMR. The estimates of TFPis reported in Appendix II. Our estimate suggests that the United States hasthe highest productivity level regardless of health capital proxy used. Table4 provides the summary statistics of the productivity levels.
2Since, we are using the restricted version of the model φ1=-φ2.
9

Table 4Summary Statistics of TFP Level
Variable Mean Median Std. Dev. Max Min
LALE 10.44 10.51 0.75 11.68 8.68LAMR 10.32 10.54 0.63 11.27 8.64
Appendix II (columns 3 and 4) provides the relative position of variouscountries in terms of productivity (Ai) relative to the United States. Therelative productivity of country i is calculated as Ai
AUS∗ 100. Columns 3 and
4 show that countries vary enormously in terms of productivity. Column 3shows that the productivity level of Guinea-Bissau is just 4.95 percent of theUnited States. In general, we find bottom heavy distribution of productivitylevels, with most of the countries clustered in the lower end of the TFPdistribution.
To throw more light on the dispersion in TFP, we classify countries ac-cording to whether their TFP relative to the United States is 75 percent ormore, between 75 percent and 50 percent, 50 percent and 25 percent, andless than 25 percent. This classification is done on the basis of LALE. Re-sults are quite similar if we use LAMR. We call the corresponding groupsas I (Very High Productivity countries), II (High Productivity countries),III (Medium Productivity countries) and IV (Low Productivity countries).Column 3 shows that only 9 countries belonged to group I (very high produc-tivity) and 40 countries belonged to group IV (low productivity). Majorityof countries (67) belonged to either group III or IV.
Regarding geographical distribution, as expected the North Americanand the Western European countries belong to groups I and II. On the otherhand, groups III and IV are mainly dominated by the Asian and the Africancountries. Most of the Latin American countries are in group II (high pro-ductivity countries) or III (medium productivity countries). Most of theAsia-Pacific countries are in group II. All the South Asian countries are ingroup IV. There are some notable oil rich countries (e.g. Venezuela, Iran)which are in groups I and II. Both China and India, two of the largest coun-tries in terms of population, despite their very high per-capita income growthin the last two decades are in group IV.
10

6 Determinants of Cross-Country Productiv-
ity Differentials
In this section, we analyze the determinants of TFP. We estimate the follow-ing regression model
ln Ai0 = πU + Π1H + Π2S + Π3Z + ui (14)
where U is the indicator for urbanization and π is the associated coefficient, His the matrix of variables measuring health capital, Π1 is the associated vectorof coefficients, S is the matrix of variables measuring education capital, Π2 isthe associated vector of coefficients, Z is matrix of other explanatory variablesincluding constant term, Π3 is the associated vector of coefficients, and ui
is the idiosyncratic term with mean zero. The description of independentvariables used to estimate equation (14) and their data sources are given inAppendix 1.
Note that the estimate of TFP, ln Ai0, though derived using data from1960-2005 pertains to the initial productivity level i.e. the productivity levelin 1960. Due to this we use 1960 values of independent variables. We proxyurbanization level by the logarithm of the proportion of urban population(LUR) in 1960. All data are taken from the World Development Indicators(WDI). We proxy education capital by the logarithm of average number ofyears of schooling by adult in 1960 (LAV) and the fraction of population aged15 years and above completing primary (LPC), secondary (LSC), and tertiary(LTC) education in 1960. These variables are widely used in the literature.All data are taken from Barro and Lee (2001). We expect coefficients ofurbanization and education variables to be positive.
To capture the effect of health on TFP, we use three indicators captur-ing the mortality rate and the disease burden. For mortality rates we useLLE60 = − ln(90− LE60) and LMR60 = ln IMR60 where LE60 and IMR60
are life-expectancy and infant mortality rate for 1960. We proxy diseaseburden by the risk of malaria. Malaria is one of the most important dis-eases faced by developing countries, particularly African countries and hasreceived great deal of attention in the literature (e.g. Sachs 2003). Sincemalaria risk data is not available for 1960, we use Malaria Ecology (ME) asan indicator for malaria risk. ME is an ecologically-based variable combiningtemperature, mosquito abundance, and vector specificity. This variable iswidely used as an instrument for malaria risk (e.g. Sachs 2003, Knowles andOwen 2008). Also this variable is exogenous. We expect the coefficient ofLLE60 to be positive and that of LMR60 and ME to be negative.
Apart from urbanization and human capital, literature suggests that TFP
11

depends on many other factors such as trade openness, ethno-linguistic frac-tionalization (Easterly and Levine 1997, Alesina et. al. 2003), legal origin(La Porta et. al. 1999, 2008). We proxy trade openness by the log of theratio of export and import to GDP in current prices in 1960 (LOPEN). Tocapture the effects of legal origin and ethic heterogeneity, we use dummies forsocialist countries (SOC) and the index of ethno-linguistic fractionalization(ETH). The data is from La Porta et. al. (1999). We also use dummy forthe African countries (AFRICA). Finally, some countries may be endowedwith high value natural resources such as hydro-carbons. These countries arelikely to have higher TFP. We also use dummy for the oil exporting countries(OIL).
Note that trade openness, legal origin, and ethnic structure can affectTFP not only directly but also indirectly through their effects on health andeducation. These variables determine the quality of institutions and also theincentives to invest in human capital.
6.1 Urbanization, Human Capital and Cross-CountryProductivity Differentials: Estimated Results
Table 5 below reports the correlation among indicators of TFP, human cap-ital, and urbanization. Results show that indicators of human capital andurbanization are highly correlated.
Table 5TFP , Urbanization and Human Capital: Correlations
Variable LALE LAMR LLE60 LIM60 ME LAV LPC LSC LTC LUR
LALE 1 0.78 -0.73 -0.68 0.67 0.59 0.60 0.41 0.80LAMR 0.93 1 0.70 -0.61 -0.69 0.61 0.57 0.57 0.36 0.78LLE60 1 -0.96 -0.52 0.81 0.76 0.51 0.51 0.70LIM60 1 0.43 -0.79 -0.70 -0.49 -0.54 -0.63
ME 1 -0.61 -0.61 -0.45 -0.34 -0.50LAV 1 0.75 0.70 0.71 0.68LPC 1 0.28 0.39 0.52LSC 1 0.53 0.65LTC 1 0.48LUR 1
Next we examine the effects of health and education indicators on TFP
12

jointly. Results are given in Tables 6 and 7. In Table 6, the dependentvariable is LALE and in Table 7 the dependent variable is LAMR. Resultsshow that indicators of health have highly significant effect on TFP. Butexcept for LSC no other indicator of education has significant effect on TFP.3
Table 6 here
Table 7 here
Next, we incorporate urbanization and other independent variables in ourregression. Results are given in Tables 8 and 9. In Table 8, the dependentvariable is LALE and in Table 9 the dependent variable is LAMR.
Table 8 here
In Model 13, Table 8, we include all other independent variables exceptLUR. The results show that coefficients of LLE60 and LSC remain highlysignificant. The coefficient of ME remains significant, but only at 10% levelof significance. The other highly significant variables are SOC and OIL. Inparticular, socialist system has a negative and significant impact on TFP andoil-exports have a positive and significant impact on TFP. Trade openness,ethno-linguistic fractionalization, and the dummy for Africa do not havesignificant impact on TFP.
In Model 14, Table 8, we incorporate LUR. The result shows that LURhas a positive and highly significant effect on TFP. Introduction of LURhas two effects. First, it reduces the size of coefficients of both LLE60 andLSC. This happens because LUR is positively correlated with both LLEand LSC. Secondly, the coefficient of LSC becomes insignificant. However,the coefficient of both LLE60 and ME remain significant at 1% and 5%respectively. Similar is the result when we use LMR60 as a proxy for themortality rate rather than LLE60 (Model 15). Also apart from indicatorsof health and urbanization, legal origin and oil export remain significantdeterminants of TFP.
3We also examined the effects of urbanization and human capital on TFP in the singlevariable regression framework (not reported here). Results show that all indicators ofhealth, education, and urbanization are significantly related to TFP. LLE60, LMR60, andLUR explain more than 50 percent of variations in TFP on their own. Also compared toresults given in Tables 6 and 7, the size of coefficients of health and education variablesare much larger. Combining different components of human capital leads to a fall in thesize of estimated coefficients, because LLE60 and indicators of education are positivelycorrelated and LMR60 and ME and indicators of education are negatively correlated.
13

Table 9 here
Similar is the result, when the dependent variable is LAMR.4 The coef-ficients of health indicators and urbanization are highly significant. But thecoefficient of education variable remains insignificant.
The role of education in the growth process has been a subject of con-troversy due to mixed empirical evidence on the effect of education. Usingcross-country regression, Barro (1991, 1997) and Mankiw et. al. (1992) findthat educational capital has significant and positive effect on the per-capitaincome. But, there is a large number of empirical studies (e.g. Benhabib andSpiegel 1994, Knowles and Owen 1995, Islam 1995, Caselli et al. 1996, Mc-Donald and Roberts 2002) which find that education capital has insignificantand in many specifications negative effect on per-capita income.
Given the mixed evidence, it has been argued that treating educationcapital as an input in the production function miss-specifies its role in thegrowth process (Nelson and Phelps 1966, Benhabib and Spiegel 1994, 2005Islam 1995). Education does not affect per-capita income directly. Rather itaffects per-capita income indirectly through its effect on productivity.5 How-ever, our results show that education does not have independent effect onTFP. It affects TFP indirectly through its effect on health indicators andurbanization level. This result is similar to Miller and Upadhyay (2000) whofind that education has an insignificant effect on TFP, but different fromHojo (2003) who finds that education has a significant and positive effecton TFP. As mentioned earlier, neither of these studies include health indica-tors in the first-stage regression nor they jointly study the effects education,urbanization, and health on TFP.
6.2 Causality
Previous results show strong association between TFP, health, and urbaniza-tion level. However, from these results we cannot infer that improved health
4In the regression with LAMR, we could not use SOC as an independent variable sincein the smaller sample there is no country with socialist legal origin.
5There is another strand of literature which argues that measures of education capitalsuch as school completion rates and average years of schooling used in the previous litera-ture do not adequately measure educational capital (e.g. Hanusehk and Kimko 2000). Inparticular, these measures capture quantity of education and not the quality of education.These studies find that quality of education as measured by student performance in thecognitive skills such as math and science have significant and positive effect on growth (seeHanushek and WoBmann 2008 for a review of this literature). One draw back of thesestudies is that the measure of cognitive skills of student is available for only few countries,mostly developed countries. Given small sample of countries, it is difficult to generalizethese results.
14

status and increased urbanization lead to higher TFP. It is quite possiblethat the causation runs from the other direction with higher TFP leading tobetter health outcomes and urbanization level. Higher TFP increases returnfrom human capital investment and thus encourages more human capital in-vestment both in education and health. Also governments will have moreresources leading to more public investment in education and health. In ad-dition, with higher income people demand more amenities and greater varietyof goods and services leading to more urbanization.
To control for endoegeniety we use IV approach. There are five endoge-nous variables in the model LLE60, LMR60, LUR, LSC, and LOPEN. Weinstrument them using geographical, religious, and cultural indicators. Inparticular, we use proportion of area of a country under tropics (TROPIC),distance from equator (LATI), the proportion of population within 100 kilo-meters of coastal areas (LT100), dummy for land-locked countries (LAND),preference for sons (SON) and the percentage of Muslim (MUSLIM) andCatholic (CATH) population in a country as instruments.
These variables have been chosen as instruments as literature suggeststhat they are important determinants of human capital, urbanization, andtrade openness. Disease burden and nutritional status are significant deter-minants of mortality rate (Murray and Lopez 1996, Gallup et. al. 1999,Knowles and Owen 2008). Murray and Lopez (1996) provide evidence thatinfectious disease are important cause of death and these disease have heavytropical concentration. The intake of food to a great extent depends onthe domestic production of food particularly in developing countries, largelybecause of imperfections in international trade in food-grains and weak trans-port infrastructure. Climate and soil fertility and suitability are importantdeterminants of agricultural productivity. Gallup (1998), Bloom and Sachs(1998) and Gallup et. al. (1999) argue that the extreme heat and humidityin tropical countries contributes to low soil fertility and agricultural pro-ductivity. On the other hand, temperate zones have high soil fertility andagriculture productivity. Thus, we include TROPIC and LATI in the list ofour instruments.
One of the precondition for urbanization is the existence of surplus food.Thus, TROPIC and LATI are also likely to affect urbanization level. Apartfrom the existence of surplus food, lower transport cost and ease of exchangeof ideas are other important determinants of urbanization level. Gallup et.al. (1999) argue that coastal areas are conducive for urban growth and thuscountries with access to ocean are more likely to reap the benefit of agglomer-ation economies. Easy access to coasts enhances the extent of market (bothinternal and external) and thereby increases the opportunity of specializa-tion. Transport cost has historically played important role in the diffusion of
15
technology, ideas, and new products. Coastal areas with lower transporta-tion cost compared to land-locked countries are likely to be more exposed tonewer products, ideas and technical advancements. To capture the effects oftransportation cost we include LT100 and LAND in the list of instruments.Gallup et. al. (1999) also suggest that a coastal economy may face a highelasticity of output response with respect to trade taxes, whereas an inlandeconomy does not. This may induce governments in inland economies to im-pose harsh taxes on trade. These variables are also important determinantsof trade openness.
Empirical evidence suggests that son-preference (parental gender biasin favor of sons) is wide-spread in many regions of the world, particularlyin Asia, Middle-East, and North Africa (Williamson 1976, Boserup 1980,Behrman 1988). In recent years, particularly due to spread of sex-selectiontechniques, a large literature has emerged which studies the socio-economicdeterminants and consequences this bias. This literature suggests that son-preference disadvantages girl children particularly with respect to access tohealth facilities (Chen et. al. 1982, Pande, R. 2003), nutrition (Sen andSengupta 1983, Behrman 1988, Hazarika 2000) and education (Lee 2008).This in itself is likely to lead to a lower human capital. In addition, thereis a large literature which suggests that mother’s education and health sta-tus positively and significantly affect health and education of children (HDR2010). Due to this we expect human capital to be lower in countries withstrong son-preference. We use dummy for countries where son-preference isprevalent (SON). The list of countries in which son-preference is prevalent isgiven in Table 10. Data is from Williamson (1976) and Fuse (2010).
Religion has been used as a proxy for work ethic, tolerance, trust, andopenness to new ideas. Weber (1958) emphasizes the historical importance ofthe protestant ethic in the spread of capitalism. He suggests that Protestantshave better work ethics and more open to new learning and ideas. Landes(1998) argues that Catholic and Muslim religions have been historically hos-tile to new ideas and learning. These societies enormously increased powerof religious organizations and states to maintain their political and religiousinfluence. Since openness to new ideas is crucial for agglomeration effect andalso effectiveness of education, we use MUSLIM and CATH as instruments.In addition, in many muslim societies women have low status. In this regard,it can have effect on human capital similar to son-preference.
We find that these instrument variables explain significant proportion ofcross-country variations in human capital, urbanization, and trade opennessand are significant at the 1% level of significance. They explain 73% ofvariations in LLE and LMR and 52% of variations in LUR. The proportion ofvariations in LSC and LOPEN explained by these instruments are somewhat
16

lower at 35% and 22% respectively.Consistency of IV estimators requires that instruments be exogenous,
i.e., uncorrelated with the error terms. As there are more instruments thanendogenous variables, we report tests of over-identifying restrictions (Sargantest). These provide a test of the null hypothesis that the instruments areuncorrelated with errors in a correctly specified model.
Models (16) and (17) in Table 8 present 2SLS results when the dependentvariable is LALE. Model (16) shows that the coefficients of both LLE60 andLUR remain significant at 5% level of significance. However, the coefficientof ME is significant at only 10% level of significance. The coefficients of SOCand OIL remain significant. In Model (17), we use LMR60 as a proxy formortality rate. Results show that the coefficient of ME is significant at 1%level of significance. The coefficients of LMR60 and LUR are significant at10% and 5% level of significance respectively. The estimated p-values for theSargan tests imply that the over-identifying restrictions are not rejected.
The results are broadly similar when the dependent variable is LAMR.Models 20 and 21 in Table 9 show that the coefficients of ME and LUR arehighly significant. However, the coefficients of LLE60 and LMR60 becomeinsignificant. The coefficient of OIL remains significant but at 10% levelof significance. The estimated p-values for the Sargan tests imply that theover-identifying restrictions are not rejected. Overall, the results suggestthat health conditions, urbanization, legal origin, and natural resources aresignificant determinants of TFP. Education and trade openness have onlyweak direct impact on TFP.
7 Conclusion
In this paper, we studied the effects of health, education, and urbanizationon the total factor productivity (TFP) of a large number countries. Weestimated TFP using a variant of augmented Solow growth model in whichhealth capital is one of the factors of production. We find that health capitalaffects both per-capita income and TFP. Life-expectancy, infant mortalityrate and the risk of malaria affect TFP significantly. Urbanization has apositive and highly significant effect on TFP. However, education has aninsignificant effect on TFP. Apart from health and education, legal originand natural resources are other significant determinants of TFP. The IVestimates suggest that the effects of health and urbanization on TFP arecausal.
17

References
[1] Acemoglu, D., S. Johnson, and J. Robinson (2001), “The Colonial Ori-gins of Coparative Development: An Emprical Investigation”, AmericanEconomic Review, 91, 1369-401.
[2] Acemoglu, D., P. Aghion, F. Zilibotti (2006), “Distance to Frontier,Selection and Economic Growth”, it Journal of the European EconomicAssociation, 4, 37-74.
[3] Aghion, P. and P. Howitt (2009), The Economics of Growth, MIT Press,Cambridge, MA.
[4] Alesina, A., A. Devleeschauwer, W. Easterly, S. Kurlat and R. Wacziarg(2003), “Fractionalization”, Journal of Econoimic Growth, 8, 155-194.
[5] Anand, S. and M. Ravallion (1993), “Human Development in PoorCountries: On the Role of Private Incomes and Public Services”, Journalof Economic Perspectives, 7, 133-150.
[6] Arellano, M. and S. Bond (1991), “Some Tests of Specification for PanelData: Monte Carlo Evidence and an Application to Employment Equa-tions”, Review of Economic Studies, 58, 277-297.
[7] Barro, R. (1991), “Economic Grwoth in a Cross-Section of Countries”,Quarterly Journal of Economics, 106, 2, 407-433.
[8] Barro, R. (1997), “Education and Economic Growth”, available athttp://www.oecd.org/dataoecd/5/49/1825455.pdf.
[9] Barro, R. and J. Lee (2001), “International Data on Educational At-tainment: Update and Implications,” Oxford Economic Papers, 53(3),541-563.
[10] Baltagi, B. (2005), Econometric Analysis of panel Data, 3rd Ed., JohnWiley and Sons Ltd.
[11] Benhabib, J. and M.M. Spiegel (1994), “The Role of Human Capital inEconomic Development: Evidence from Agregate Cross-Country Data”,Journal of Monetary Economics, 34, 143-173.
[12] Benhabib, J. and M.M. Spiegel (2005), “Human Capital and TechnologyDiffusion”, in Handbook of Economic Growth , Ed. P. aghion and S.N.Durlauf, Amersterdam, North-Holland: 385-472.
18

[13] Behrman, J. R. (1988), “Intrahousehold Allocation of Nutrients in RuralIndia: Are Boys Favored? Do Parents Exhibit Inequality Aversion?”,Oxford Economic Papers, 40(1), 1988.
[14] Bloom, D. and J. Sachs (1998), “Geography, Demography, and Eco-nomic Growth in Africa”, Brookings Papers on Economic Activity, 2,207-273.
[15] Bloom, D, and D. Canning (2000), “The Health and Wealth of Nations”,Science, 287, 1207-1209.
[16] Boserup, E. (1980), “Women’s Role of Economic Development”, Lon-don: Allen and Unwin.
[17] Burgess, R. and A. Venables (2004), “Towards a Microeconomics ofGrowth”, World Bank Working Paper 3257, April, Washington D.C.
[18] Caselli, F., G. Esquivel, and F. Lefort (1996), “Reopening the Conver-gence Debate: A New Look at Cross-Country Empirics”, Journal ofEconomic Growth, 1, 363-389.
[19] Chen, L. C., E. Huq, and S. d’Souza (1982), “Sex Bias in the FamilyAllocation of Food and Health Care in Rural Bangladesh”, Populationand Development Review, 7(1), 55-70.
[20] Cohen, D. (1992), “Tests of the “Convergence Hypothesis”: A CriticalNote”, CEPR DP 691.
[21] Cole, M. and E. Neumayer (2006), “The Impact of Poor Health on TotalFactor Productivity”, Journal of Development Studies, 42, 918-938.
[22] Easterly, W. and R. Levine (1997), “Africa’s Growth Tragedy: Policiesand Ethnic Divisions”, Quarterly Journal of Economics, 112, 1203-50.
[23] Easterly, W. and R. Levine (2003), “Tropics, Germs, and Crops: HowEndowments Influence Economic Development”, Journal of MonetaryEconomics, 50, 3-39.
[24] Evans, P. and G. Karras (1993), “Do Standards of Living Converge?Some Cross-Country Evidence”, Economic Letters, 43, 149-155.
[25] Fuse, K. (2010), “Variations in Attitudinal Gender Preferences for Chil-dren Across 50 Less-Developed Countries”, Demographic Research, 123,1031-1048.
19

[26] Gallup, J., Sachs J., and Mellinger, A. D. (1999), “Geography and Eco-nomic Development”, International Regional Science Review, 22, 179-232.
[27] Hall, R. and C. Jones (1999), “Why Do Some Countries Produce SoMuch More Output Per Worker than Others?”, Quarterly Journal ofEconomics, 114, 83-116.
[28] Hanushek, E. and D. Kimko (2000), “Schooling, Labor-Force Quality,and the Growth of Nations”, American Economic Review, 90, 1184-1208.
[29] Hanushek, E. and L. WoBmann (2008), “Education and EconomicGrowth”, in International Encyclopedia of Education, 3rd. Edition.
[30] Hazarika, G. (2000), “Gender Differences in Children’s Nutrition andAccess to Health Care in Pakistan”, The Journal of Development Stud-ies, Vol. 37, No. 1, pp. 73-92.
[31] Henderson, J. (2005), “Urbanization and Growth”, in Handbook of Eco-nomic Growth, Vol. 1b, Ed. P. Aghion and S.N. Durlauf, Amesterdam,Elsvier.
[32] Hojo, M. (2003), “An Indirect Effect of Education on Growth”, Eco-nomic Letters, 80, 31-24.
[33] Human Development Report (2010), UNDP.
[34] Isakasson, A. (2007), “Determinants of Total Factor Productivity: ALiterature Review”, UNIDO.
[35] Islam, N. (1995), “Growth Empirics: A Panel Data Approach”, Quar-terly Journal of Economics, 110, 1127-1170.
[36] Judson, R. A. and A. L. Owen (1999), “Estimating Dynamic Panel DataModels: A Guide for Macroeconomists”, Economic Letters, 48, 99-106.
[37] Klenow, P. and A. Rodriguez-Clare (1997), “Economic Growth: A Re-view Essay”, Journal of Monetary Economics, 40, 597-617.
[38] Knowles, S. and P. D. Owen (1995), “Health Capital and Cross-CountryVariation in Income Per-Capita in the Mankiw-Romer-Weil Model”,Economic Letters, 48, 99-106.
20
[39] Knowles, S. and P. D. Owen (2008),“Which Institutions are God forYour Health? The Deep Determinats of Comparative Cross-CountryHealth Status”, University of Otago Economics Discussion Papers No.0811.
[40] Lavovsky, K (2001), “Health and Environment”, World Bank Environ-ment Strategy Paper No. 1, World Bank, Washington D.C.
[41] La Porta, R, Lopez-de Silanes, F., Schleifer, A. and Vishny, R. W.(1999), “The Quality of Government”, Journal of Law, Economics, andOrganization, 15, 222-282.
[42] La Porta, R, Lopez-de Silanes, F., Schleifer, A. (2008),“The EconomicConsequences of Legal Origins”, Journal of Economic Literature, 46,285-332.
[43] Landes, D. (1969), “The Unbound Prometheus”, Cambridge, CambridgeUinversity Press.
[44] Landes, D. (1998),“ The Wealth and Poverty of Nations: Why Some areRich and Some So Poor”, NY, Norton.
[45] Lee, J. 2008, “Sibling Size and Investment in Children’s Education: AnAsian Instrument”, Journal of Population Economics, 21, 855-875.
[46] Lucas, R. (1988), “On the Mechanics of Economic Development”, Jour-nal of Monetary Economics, 22, 3-42.
[47] Lucas, R. (2004), “Life-Eranings and Rural-Urban Migration”, Journalof Political Economy, 112, S29-S59.
[48] Mankiw, N. G., D. Romer, and D.N. Weil (1992), “A Contribution tothe Empirics of Growth”, Quarterly Journal of Economics, 107, 407-437.
[49] McDonald, S. and J. Roberts (2002), ‘Growth and Multiple Forms ofHuman Capital in an Augmented Solow Model: A Panel Data Investi-gation”, Economic Letters, 74, 271-276.
[50] Miller, S. M. and M. P. Upadhyay (2000), “The Effects of Opennes,Trade Orientation, and Human Capital on Total Factor Productivity”,Journal of Development Economics, 63, 399-423.
[51] Murray, C and A. Lopez eds.(1996), “The Global Burden of Disease”,Cambridge, M.A.
21
[52] Pande, R. (2003), “Selective Gender Differentials in Childhood Nutritionand Immunization in Rural India: The Role of Siblings”, Demography,40(3), 395-418.
[53] Rosenthal, S. and W. Strange (2004), “Evidence on the Nature andSources of Agglomeration Economies”, in Handbook of Regional and Ur-ban Economics, Vol. 4, ed. J. V. Anderson and J-F. Thisse, Amesterdam,Elsvier.
[54] Scahs, J. (2003), “Institutions’ Don’t Rule: Direct Effects of Geographyon Per-Capita Income”, NBER Working Paper 9490.
[55] Sen, A. and S. Sengupta (1983), “Malnutrition of Rural Children andthe Sex Bias”, Economic and Political Weekly, 18, 855-864.
[56] Temple, J. (1999), “A Positive Effect of Human Capital on Growth”,Economic Letters, 65, 131-134.
[57] Quah, D. (1993), “Galton’s Fallacy and Tests of the Convergence Hy-pothesis”, Scandinavian Journal of Economics, 95, 427-443.
[58] Weber, M. (1958), “The Protestant Ethic and the Spirit of Capitalism”,New-York: Charles Scribner’s Sons.
[59] Weil, D. (2007), “Accounting for the Effect of Health on EconomicGrowth”, Quarterly Journal of Economics, 122, 1265-1306.
[60] Williamson, N. E. (1976), “Sons or Daughters: A Cross-Cultural Surveyof Parental Preferences”, Sage Publications.
[61] Williamson, J. (1988), “Migration and Urbanization”, in Handbook ofDevelopment Economics Vol 1, ED. H. Chenery and T.N. Srinivas,Amesterdam, Elsvier.
22

Table 2Growth Regression Results: Health Capital (Life-Expectancy)
Explanatory Variables AB 1-Step AB 2-Step LSDV(1) (2) (3)
UnrestrictedConstant 1.6335(0.474)∗
yi,t−1 0.6589(0.055)∗ 0.6647(0.03)∗ 0.8203 (0.035)∗
ln(sKiτ ) 0.107(0.027)∗ 0.0961(0.019)∗ 0.1173(0.012)∗
ln(niτ + g + δ) -0.039(0.041) -0.0688(0.038)∗∗ -0.0561(0.024)∗
LLE∗iτ 0.1902 (0.066)∗ 0.2133 (0.037)∗ 0.1133 (0.064)∗∗
RestrictedConstant 1.7375(0.54)∗
yi,t−1 0.6415(0.057)∗ 0.652(0.03)∗ 0.8135 (0.035)∗
ln(sKiτ )− ln(niτ + g + δ) 0.0715(0.038)∗∗ 0.0785(0.018)∗ 0.0922(0.012)∗
LLE∗iτ 0.1968 (0.074)∗ 0.2151 (0.037)∗ 0.1337 (0.076)∗∗
Implied α 0.17 0.18 0.33Implied β 0.46 0.50 0.48Implied λ 0.09 0.086 0.04
p Values:BP Test 0.00H Test 0.00
Wald Test 0.15 0.47 0.14Restricted Model:
Sargan Test 0.003 0.13 NAH(0): AR(2) is absent 0.16 0.19 NA
R2 NA NA 0.99No. of Observations 796 796 900
No. of Countries 100 100 100
Note:1. ∗, ∗∗, and ∗∗∗ indicate significance levels of 1%, 5%, 10% respectively
against two-sided alternatives for the t-tests.2. Number in brackets are standard errors.3. All specifications included time specific effects (not reported).4. Implied values of α, β and λ have been derived using restricted model.5. We report values of Sargan Test, AR(2) test, and R2 for the restricted
model.
23

Table 3Growth Regression Results: Health Capital (Infant Mortality Rate)
Explanatory Variables AB 1-Step AB 2-Step LSDV(1) (2) (3)
UnrestrictedConstant 0.017(0.006)∗
yi,t−1 0.6172(0.07)∗ 0.566(0.03)∗ 0.8121 (0.04)∗
ln(sKiτ ) 0.1321(0.03)∗ 0.1062(0.02)∗ 0.1322(0.02)∗
ln(niτ + g + δ) -0.0241(0.03) -0.0399(0.03)∗∗∗ -0.0342(0.02)∗∗∗
LMR∗iτ -0.1662 (0.03)∗ -0.1952 (0.02)∗ -0.0781 (0.03)∗
RestrictedConstant 0.0191(0.006)∗
yi,t−1 0.6071(0.07)∗ 0.5221(0.03)∗ 0.8081 (0.04)∗
ln(sKiτ )− ln(niτ + g + δ) 0.1021(0.02)∗ 0.0962(0.02)∗ 0.1122(0.02)∗
LMR∗iτ -0.1682 (0.03)∗ -0.2012 (0.02)∗ -0.0881 (0.03)∗
Implied α 0.21 0.17 0.37Implied β 0.34 0.35 0.29Implied λ 0.099 0.129 0.043
p Values:BP Test 0.00H Test 0.00
Restricted Model:Wald Test 0.13 0.58 0.15
Sargan Test 0.59 0.85 NAH(0): AR(2) is absent 0.17 0.21 NA
R2 NA NA 0.99No. of Observations 592 592 664
No. of Countries 71 71 71
Note:1. ∗, ∗∗, and ∗∗∗ indicate significance levels of 1%, 5%, 10% respectively
against two-sided alternatives for the t-tests.2. Number in brackets are standard errors.3. All specifications included time specific effects (not reported).4. Implied values of α, β and λ have been derived using restricted model.5. We report values of Sargan Test, AR(2) test, and R2 for the restricted
model.
24

Table 6TFP (LALE) and the Multiple Forms of Human Capital
Variable (1) (2) (3) (4) (5) (6)
LLE60 1.117∗ 1.1014∗ 0.9584∗ 1.1711∗ 0.8524∗ 0.9634∗
(0.26) (0.21) (0.16) (0.19) (0.15)
ME −0.0246∗∗ −0.0247∗ −0.023∗∗ −0.023∗∗ −0.0237∗∗ −0.0263∗∗
(0.01) (0.01) (0.01) (0.01) (0.01) (0.01)
LAV 0.0309(0.12)
LPC 0.0356 0.031(0.07) (0.06)
LSC 0.1106∗∗ 0.1119∗∗ 0.0596(0.05) (0.05) (0.06)
LTC 0.0299 0.0117(0.05) (0.07)
R2 0.61 0.61 0.64 0.59 0.63 0.62
N 77 77 78 74 74 66Note:1. ∗, ∗∗, and ∗ ∗ ∗ indicate significance levels of 1%, 5% and 10% respec-
tively against two-sided alternatives for the t-tests.2. Numbers in parentheses are White Heteroskedasticity-Consistent stan-
dard errors.3. N : Number of included observations vary as data for LAV, LPC, LSC,
and LTC are not available for all countries.
25

Table 7TFP (LAMR) and the Multiple Forms of Human Capital
Variable (7) (8) (9) (10) (11) (12)
LMR60 −0.3509∗ −0.373∗ −0.3000∗ −0.3541∗ −0.2395∗ −0.3121∗
(0.11) (0.09) (0.08) (0.07) (0.07)
ME −0.0491∗∗ −0.0498∗ −0.047∗ −0.0568∗ −0.0483∗ −0.0507∗
(0.01) (0.01) (0.01) (0.01) (0.01) (0.01)
LAV 0.0803(0.11)
LPC 0.0529 0.0577(0.06) (0.04)
LSC 0.1139∗ 0.1118∗ 0.1098∗∗∗
(0.04) (0.04) (0.06)
LTC −0.0284 −0.0813(0.06) (0.07)
R2 0.65 0.65 0.66 0.59 0.68 0.63
N 63 63 64 56 62 56Note:1. ∗, ∗∗, and ∗ ∗ ∗ indicate significance levels of 1%, 5% and 10% respec-
tively against two-sided alternatives for the t-tests.2. Numbers in parentheses are White Heteroskedasticity-Consistent stan-
dard errors.3. N : Number of included observations vary as data for LAV, LPC, LSC,
and LTC are not available for all countries.
26

Table 8TFP (LALE), Human Capital, Urbanization, and Other Factors:
Variable (13) (14) (15) (16)/2SLS (17)/2SLS
LLE60 1.0682∗ 0.6315∗ 0.8945∗∗
(0.17) (0.15) (0.38)
LMR60 −0.3143∗ −0.2097∗∗∗
(0.05) (0.12)
ME −0.0235∗∗∗ −0.0254∗∗ −0.0337∗ −0.0158∗∗∗ −0.0371∗
(0.01) (0.01) (0.01 ) (0.02) (0.01)
LSC 0.1208∗∗ 0.0545 0.0527 0.1244 0.1279(0.05) (0.04) (0.03) (0.23) (0.13 )
LOPEN 0.0087 -0.0166 0.0085 0.0879 −0.0026(0.06) (0.05) (0.06) (0.20) (0.14)
LUR 0.3877∗ 0.3562∗ 0.5093∗∗ 0.3896∗∗
(0.08) (0.07) (0.21) (0.16)
SOC −1.07∗ −1.3633∗ −1.1365∗
(0.13) (0.14) (0.43)
OIL 0.3002∗∗ 0.2099∗ 0.2172∗ 0.1888∗∗ 0.1941∗∗
(0.12) (0.08) (0.07) (0.10) (0.08)
AFRICA −0.1417 −0.2557∗∗∗ −0.1994 −0.2236 −0.2595(0.18) (0.14) (0.15) (0.19) (0.15)
ETH −0.1238 −0.0638 −0.2503 −0.0702 −0.1704(0.26) (0.19) (0.17) (0.29) (0.24)
R2 0.74 0.83 0.87 0.75 0.85N 74 74 63 74 63
Sargan (p-value) 0.60 0.64Note: 1. ∗, ∗∗, and ∗ ∗ ∗ indicate significance levels of 1%, 5% and 10%
respectively against one-sided alternatives for the t-tests.2. Numbers in parentheses are White Heteroskedasticity-Consistent stan-
dard errors.
27

Table 9TFP (LAMR), Human Capital, Urbanization, and Other Factors:
Variable (18) (19) (20)/2SLS (21)/2SLS
LLE60 0.3464∗∗ 0.0294(0.15) (0.33)
LMR60 −0.1514∗ −0.0485(0.06) (0.13)
ME −0.0339∗ −0.0332∗ −0.0411∗ −0.0391∗
(0.01) (0.01) (0.01 ) (0.02)
LSC 0.0413 0.0412 0.0727 0.05(0.03) (0.04) (0.25) (0.24)
LOPEN −0.0215 -0.0264 0.0858 0.1044(0.06) (0.05) (0.25) (0.24)
LUR 0.331∗ 0.341∗ 0.4484∗∗ 0.4369∗∗
(0.07) (0.07) (0.18) (0.18)
OIL 0.2102∗ 0.2226∗ 0.1822 0.1978∗∗∗
(0.07) (0.07) (0.15) (0.12)
AFRICA 0.0718 −0.0851 −0.0908 −0.0835(0.14) (0.14) (0.72) (0.25)
ETH −0.0802 −0.1748 −0.0439 −0.1253(0.18) (0.17) (0.31) (0.29)
R2 0.81 0.82 0.77 0.78N 63 63 63 63
Sargan (p-value) 0.65 0.60Note:1. ∗, ∗∗, and ∗ ∗ ∗ indicate significance levels of 1%, 5% and 10% respec-
tively against one-sided alternatives for the t-tests.2. Numbers in parentheses are White Heteroskedasticity-Consistent stan-
dard errors.
28

Table 10List of Countries Where Son-Preference is Prevalent
Algeria, Bangladesh, Benin, Burkina Faso, Chad, China, Egypt, Ethiopia,Guinea, Hong Kong, India, Iran, Jordan, South Korea, Mali, Morocco, Nepal,Niger, Nigeria, Pakistan, Senegal, Syria, Tunisia
Source: Williamson (1976), Fuse (2010)
29

Appendix IVariables and Their Data Sources
• y: Real income per worker in 2005 constant price PWT 6.3
• sK : Investment share of real GDP per capita PWT 6.3
• n: Calculated using LFPR and population PWT 6.3
• LE: Life Expectancy World Development Indicators
• MR: Infant Mortality Rate World Development Indicators
• ME: Malaria Ecology Sachs 2003
• LAV: The average years of school for adults Barro and Lee (2001)
• LPC: The fraction of population aged 15 years and above completingprimary schooling Barro and Lee (2001)
• LSC: The fraction of population aged 15 years and above completingsecondary schooling Barro and Lee (2001)
• LTC: The fraction of population aged 15 years and above completingtertiary schooling Barro and Lee (2001)
• LATI: The absolute distance from equator La Porta et. al. (1999)
• TROPIC: The percentage of area of a country under tropics Gallup et.al. (1999)
• LT100: The proportion of population within 100 k.m. of coast Gallupet. al. (1999)
• LAND: Dummy for land-locked countries
• SOC: Countries with socialist legal system La Porta et. al. (1999)
• ELH: Index of ethno-linguistic fractionalization La Porta et. al. (1999)
• MUSLIM: Proportion of muslim population La Porta et. al. (1999)
• CATH: Proportion of catholic population La Porta et. al. (1999)
30

• SON: Dummy for countries where son-preference is prevalent Williamson1976, Fuse 2010
• OIL: Dummy for oil exporting countries
31

Appendix II
Productivity Index Productivity Index
Country LALE (TFPi/TFPus)*100 LAMR (TFPi/TFPus)*100
Life-Expectancy Infant Mortality
1 2 3 4 5
Group I Countries
United States 11.68 100.00 11.27 100
Puerto Rico 11.51 84.12
Netherlands 11.45 79.54
Norway 11.43 77.92 10.98 74.83
Canada 11.43 77.72 11.0 74.8
South Africa 11.42 77.25
Venezuela, RB 11.41 75.83 11.0 78.7
Switzerland 11.40 75.21 10.9 68.4
Belgium 11.40 75.10 11.1 80.3
Group II Countries
Austria 11.37 72.86 11.1 81.1
Australia 11.35 71.96 10.9 69.1
Israel 11.31 69.11
New Zealand 11.30 68.38 10.8 60.0
France 11.29 67.38 10.9 70.5
Gabon 11.26 65.29
Denmark 11.25 64.91 10.8 59.5
United Kingdom 11.25 64.84 10.9 65.7
Italy 11.23 63.75 11.1 80.3
Jordan 11.20 61.78 10.8 63.8
Ireland 11.20 61.56 10.9 68.4
Argentina 11.18 60.59 11.0 73.3
Sweden 11.18 60.32 10.7 54.9
Trinidad and Tobago 11.16 59.57 11.0 77.9
Iran, Islamic Rep. 11.16 59.06
Spain 11.12 56.92 10.9 65.7
Greece 11.11 56.51 10.9 71.2
Mexico 11.11 56.29 11.0 74.8
Finland 11.09 55.03 10.5 48.2
Hong Kong SAR, China 11.05 53.05
Singapore 11.03 52.32 10.6 51.2
Namibia 11.02 51.75
Mauritius 11.02 51.40 10.9 66.4
Chile 11.01 51.09 10.8 61.9
Group III Countries

Japan 10.94 47.71 10.6 52.2
Brazil 10.89 45.21 10.8 63.8
Portugal 10.80 41.37 10.6 49.7
Guatemala 10.79 40.92 10.7 57.7
Costa Rica 10.78 40.58 10.5 48.2
Algeria 10.77 40.33 10.6 52.7
Tunisia 10.77 40.28
Malaysia 10.75 39.44 10.5 46.8
Uruguay 10.75 39.36 10.6 48.7
Peru 10.66 35.96 10.1 30.7
Colombia 10.65 35.65 10.4 41.9
Korea, Rep. 10.63 34.85 10.3 38.3
El Salvador 10.62 34.50 10.4 43.6
Dominican Republic 10.61 34.21 10.6 48.7
Guinea 10.60 33.73
Morocco 10.59 33.63 10.7 56.6
Jamaica 10.52 31.36 10.3 39.5
Zimbabwe 10.50 30.69
Egypt, Arab Rep. 10.48 29.95 10.6 50.2
Ecuador 10.47 29.69 10.4 41.1
Sierra Leone 10.45 29.11
Bolivia 10.44 29.01 10.3 38.7
Turkey 10.42 28.40 10.6 53.3
Congo, Rep. 10.42 28.25 10.5 45.4
Panama 10.38 27.11 10.3 36.8
Cote d'Ivoire 10.38 27.09
Cameroon 10.34 26.06
Group IV Countries
Paraguay 10.29 24.90 10.1 30.7
Honduras 10.21 23.04 10.0 28.9
Senegal 10.19 22.50 9.9 24.2
Philippines 10.19 22.47 10.0 27.0
Syrian Arab Republic 10.19 22.44 10.0 28.4
Nicaragua 10.17 22.11 9.9 24.9
Chad 10.14 21.45
Nigeria 10.12 20.89
Pakistan 10.07 20.03
Romania 9.95 17.71
Zambia 9.93 17.34 9.6 19.6
Indonesia 9.92 17.17 9.9 25.9
Kenya 9.87 16.33 9.6 19.2
Haiti 9.85 16.01
Sri Lanka 9.80 15.25
Bangladesh 9.74 14.27 9.7 20.0

Mozambique 9.73 14.25
Thailand 9.73 14.15 9.7 21.0
Mauritania 9.71 13.95
India 9.70 13.73 9.8 23.7
Gambia, The 9.69 13.66 9.6 18.1
Papua New Guinea 9.66 13.27 9.6 18.1
Niger 9.65 13.12
Mali 9.65 13.09
Congo, Dem. Rep. 9.64 12.94 10.5 45.4
Nepal 9.60 12.46 9.6 18.3
Benin 9.52 11.53
Rwanda 9.51 11.35 9.3 14.5
Uganda 9.46 10.78 9.3 14.5
Central African Republic 9.44 10.57 9.2 12.9
Ethiopia 9.41 10.33
Madagascar 9.39 10.10
Togo 9.33 9.49 9.2 13.0
Ghana 9.31 9.35 9.3 13.9
Burkina Faso 9.20 8.36 9.2 12.2
Burundi 9.16 7.99 9.0 10.6
Malawi 9.09 7.48 9.1 11.9
China 8.83 5.77
Tanzania 8.71 5.11 8.6 7.2
Guinea-Bissau 8.68 4.95