URBAN GOVERNENT FINANCES IN KARACHI By Woo Sik Kee
54
DOMESTIC FINANCE STUDIES NO. 68 URBAN GOVERNENT FINANCES IN KARACHI By Woo Sik Kee The views presented in this paper are solely those of the author and do not necessarily reflect the official opinions of the World Bank or its affiliates.. January 1981 Public and Private Finance Division Development Economics Department Development Policy Staff Public Disclosure Authorized Public Disclosure Authorized Public Disclosure Authorized Public Disclosure Authorized
Transcript of URBAN GOVERNENT FINANCES IN KARACHI By Woo Sik Kee

DOMESTIC FINANCE STUDIES NO. 68
URBAN GOVERNENT FINANCES IN KARACHI
By
Woo Sik Kee
The views presented in this paper are solely those ofthe author and do not necessarily reflect the official opinionsof the World Bank or its affiliates..
January 1981
Public and Private Finance DivisionDevelopment Economics DepartmentDevelopment Policy Staff
Pub
lic D
iscl
osur
e A
utho
rized
Pub
lic D
iscl
osur
e A
utho
rized
Pub
lic D
iscl
osur
e A
utho
rized
Pub
lic D
iscl
osur
e A
utho
rized

TABLE OF COM'TEN'S
Page
I. Introduction . . . . . . . . . . . . . . . . . . . . . . . 1
II. Government Structure and Administration . .. . . . . . . . 5
tocal Government in Pakistan . . . . . . . . . . . . . . 5
Federal-Province-Local Relations . . . . . .. . . . . . 6
Budget Structure and Organization . . . . . . .. . . . 7
TTT Expendi'ture Trends . . . . . . . . . . . . . . . . . ...... 9
General Pattern. . . . . . . . . . . . . .. . . . ...... 9
The Sources of Finance . . . . . . . . .. .. . . ...... 13
IV. The Functional Sources of Expenditure Increase ....... 18
Water Supply . . . .. . . . . . . . . . . . . . . . . . 18
Drainage and Sewerage . . .. . . . . . . . . . . . . . 24
General Revenue Financed Services . . . . . . . . . . . 27
V. Revenue Structure and Trends . . . . . . . . . . . . . . . 30
Property Tax . . . .. . . . . . . . . . . . . . . . . . 30
Legal Structure . . . . . . . . . . . . . . . . . 34
Assessment Procedures . . .. . . . . . . . . . . . 36
Revenue Performance . . . . . ... . . . . . . . 38
Octroi . . . . . . . . . . . . . . . . . . . . . . . . . 42
VI. Summary and Conclusions . . . . . . . . . . . . . . .. . . 45

LIST OF TABLES
Table 1: Relative Importance of 'ederal, Provincial and LocalGovernments as Measured by Per Capita Expenditures
Table 2: Summary of KMC Finances, 1970/71 - 1978/79
Table 3: IKMC Expenditure Pattern, 1970/71 - 1978/79
Table 4: Increase in KMC Per Capita Expenditure by Function
Table 5: Percentage Distribution of KMC Expenditure by Function
Table 6: Financing Municipal Water Supply
Table 7: Summary of KDA Finances, 1973/74 - 1978/79
Table 8: Consolidated Accounts of KMIC Water Supply
Table 9: Financing Municipal Drainage and Sewerage Work
Table 10: KMC Expenditure Trends by Revenue Source
Table 11: Per Capita KMC Expenditures by Function, 1970/71 - 1978/79
Table 12: KMC Revenue Structure and Trends
Table 13: Percentage Distribution of KMC Tax Revenues
Table 14: Per Capita Tax Revenues, Income and Prices
Table 15: Property Tax Rate Structure
Table 16: Comparative Levels of Property Tax Effort in Selected Cities
Table 17: Ctroi Revenue Receipts by Collection Posts, 1973/74 - 1978/79

I. Introduction
Karachi, the largest city of Pakistan, has a population
of aDproximately 5.4 million accounts for 6.8 percent of the total
national population. It covers 136 square miles and has an overall
population density of 3,970 per square mile but at the core of the
city over 500,000 people live in a few square mile area. The popula-
tion of Karachi is growing at a rate much greater than the nation and
the rest of Sind province. The economic base of Karachi is dominated
by manufacturing, trade and services. Although it has only 30 percent
of the provincial population, it provides over three-quarters of manu-
facturing employment, over two-thirds of the reporting factories, and
it accounts for over three-quarters of value added in manufacturing.
Regionally Karachi may be separated from the rest of Sind. In many
respects it is a national rather than a regional center beirg the
countryts only international port, major banking center with 50 percent
of national deposits in 1972, and in the same year it accounted for 15
percent of gross domestic product and 25 percent of federal revenues.
The major local govrPrnm nt resnonsible for the provision
of public services in Karachi is the K-.rachi Municipal Corporation (KMC).
The KMC is responsible for the bulk of the city's urban services; it
employs over 32,000 people and administers the total budget of over
Rs 400 million. However, the KMC is overlapped by the Karachi Develop-
ment Authority (KDA) Cantonment Boards and various special purpose lo-
cal authorities. Among these authorities, the most important is the
KDA whose functions are divided into water supply, and land and housing

-2-
development divisions. The KDA employs 8,500 people and hlas an annlual
budget of over Rs 500 million.
Karachi, like many other big cities in the world has
pressing expenditure needs and inadequate government resources, i.e.,
is subject to a problem of public sector poverty. In Karachi, housing
and public utilities are particularly severe problems with the majority
of the city population living in conditions with inadequate housing
structures, overcrowding, few public service amenities and poor sanita-
tion. According to the latest estimates, for example, average water
availability is 22 gallons per capita per day; only 30 percent of house-
holds has water connections. Less than 30 percent of the city popula-
tion is served with the central sewerage system. The remainder rely on
night soil collection service, pit latrines or waste ground to dispose
of their wastes.- Moreover, nearly one riillion people live in squatter
slum communities where health and education needs are especially acute.
There are also serious deficiencies in Karachi's mass transportation
system.
On the other hand. Karachi's tax base and fiscal management
have been unsatisfactory in meeting the growing demand of the city's
services. For example, in 1977/78 total current revenue receipts of
KMC amounted to Rs 315.9 million, of which only Rs 28.6 million was
available for development expenditure. Current expenditures, particu-
larly in education and health and the deficit of water and sewerage
1/ Department of Master Plan and Environmental Control, Planning andDevelopment Problems of Karachi (Karachi, 1979).

account have increased as r;pidly as revenues and resulted in an over-
all deficit of Rs 84.2 million or 20.6 percent of total expenditures
of the KNMC in 1977/78 (Table 2). The fiscal position of KDA is even
worse than that of KI4C. In 1977/78 KDA registered an overall financ-
irg gap of Rs 313.6, reflecting mainly operational deficits of its
water supply schemes (Table 6). The present level of budgetary deficit
cannot be reduced without raising the water charges to local bodies.
In view of recent developments of KMC and KDA, the financial
problems of Karachi have undoubtedly reached critical proportions and,
call for an immediate fiscal reform to increase total reverlues of both
KMC and KDA. Four major areas where policy action is needed might be
mentioned briefly here, though each is explored in detail in the
forthcoming report. First, there is an urgent need to increase the pro-
ductivity and elasticity of the property tax through new assessment
of property values and structural reform. This is not only to meet
current and new expenditure needs, but also to begin to clear up the
backlog of infrastructure and service needs which plague particularly
the city's low income population. Second, there are both horizontal
and vertical inequities in the local tax which need reform. Third,
the bulk of water supply scheme, of which KDA is responsible on behalf
of local authoritites is being operated with large deficits and require
immediate adjustment on water rates. Fourth, action is needed to in-
crease revenue of the city through additional taxation and/or more
efficient tax collection and administration. Fifth, there is a poverty
of systematic fiscal planning and budgeting.
The formulation of remedial policy to deal with these problems
and the evaluation of other facets of the operation of the local fi-
nance system require detailed study of the overall functioniing of the
system. Such detailed study is the purpose of this exercise.

-5-
II. Government Structure and Administration
Local Government in Pakistan
In Pakistarn local governments first emerged as autonomous,
representative units which could deal with the local civic problems
following the Basic Demcncracies Order of 1959 and the promulgation of
the Municipal Administration Order of 1960. For a period of more than
a decade, the local government system of Pakistan was organised around
the concept of "Basic Democracies." During this period, the former
four provinces of the West Wing remained integrated into a single Wlfest
Pakistan Province and local bodies below that level were organized in
an elaborate four-tier structure.
After the change of government in December 1971, the four provinces
were re-established and the Basic Democracies system of local government
*was replaced by a new system of "People's Local Government." The new
system has introduced significant reforms in the structure and function
of local bodies. The major change introduced in financial arrangements
is that the provincial and local property tax have been integrated. The
Excise and Taxation Departments of the provinces are now responsible for
collecting the total tax which is shared between the local bodies and the
provinces after deducting the collection charges by the provinces. Under
the new system the local government insittutions were to be fully represen-
tative. Nominations of government officers of various departments in local
bodies which existed under the privous system were to be discontinued. The
head of every local body was to be chosen by election not by appointment.
| | | | | -

-6-
ut-der this system the privincial governments them5leh'es instead of dii3trict
olficers would exercise necessary supervision and control over local bodies.
Structurally, local governments in Pakistan are divided
into two borad categories; urban and rural councils. In the province of
Sind there are one municipal corporation, 19 municipal committees, 87 town
committees and 11 rural district councils. Of the four types of local
authorities in Sind only two--municipal corporation and municipal committees--
are fully functioning local government units. Both town conmittees and rural
district councils are set up for small towns and villages with limited func-
tions and they are not ready for full functions of the government. The
municipal government in Karachi is a corporation.
Federal-Province - Local Relations
The pattern of intergovernmental relations in Sind, as
in all Pakistan provinces, is one of close Federal-Province and Province-
Local ties. The Federal government exerts no direct regulatory controls
over local government bodies and direct Federal-l1cal government loan or
grant programs are virtually non-existent. Province-local relations are
more direct and important in terms of local government operations. The
government of Sind exerts a set of direct regulatory controls over local
governments, gives grants and loans to both KMC and KDA, shares its tax
revenues, and makes substantial direct expenditures within the urban area.
The most important of the direct controls over KMC and KDA by Sind govern-
ment are approval of their budgets, approval for the tax rate increase and
for borrowing beyond the prescribed statutory limits, and appointment of

the chief officer of both }fC (Administrator) and KDA (Director General).
Budget Structure and Oraanization
Formerly the principal governing body of the KMC is the Cit-
izen's Committee, but it has little executive or administrative power
or authority. The Committee is composed of 100 members who are niominated
by the KNIC Administrator and appointed by Sind government. The day-to-day
administration of the 4C is the responsibility of the administrator. He
is advised by the Citizen's Committee and assisted by the Financial Advi-
sor who is also appointed by the provincial government.
The budget is prepared initially by the chief financial officer
(Financial Advisor) and is presented first to the Citizen's Committee and
to the Sind government for consultation. If there is no demand for re-
vision, the draft budget automatically becomes effective, The governing
body of KDA is made of 6 members: 2 ex-officio members, 2 full-time mem-
bers and 2 part-time members. The Director General is the chief executive
officer who is responsible for the day-to-day adminstration. The KDA's
budget is prepared in a fashion same as that of KMC and it should be also
approved by Sind government.
The budget of local governments (KMC and KDA) is comprised
of a revenue budget and development budget. On the expenditure side, the
revenue budget includes all ordinary expenditures, all debt service pay-
ments, and all expenditures of the city water and sewerage systems. On
the income side the revenue budget includes all current revenues raised
from own sources, grants, and tax sharing.
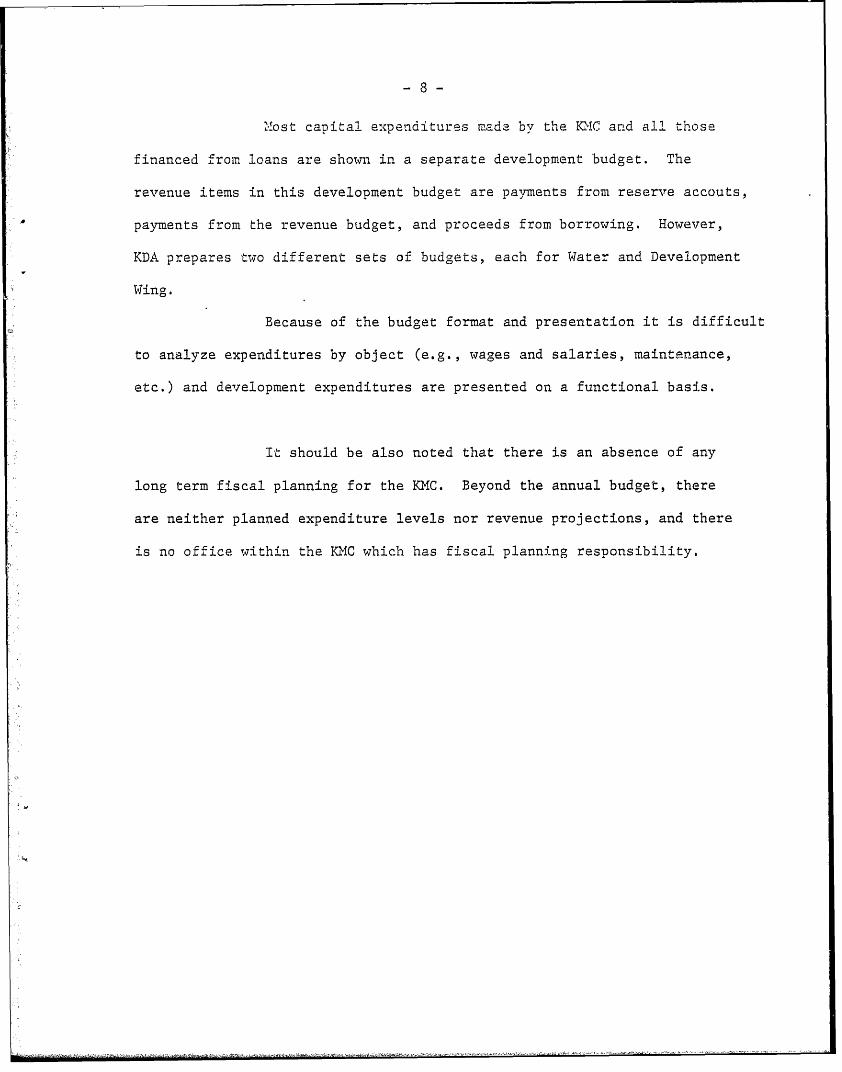
'eost L capital expen.ditures made by the IQ'C ard all those
financed fromr. loans are showna in a separate development budget. The
revenue items in this development budget are payments from reserve accouts,
payments from the revenue budget, and proceeds from borrowing. However,
KDA prepares two different sets of budgets, each for Water and Development
Wing.
Because of the budaet format and presentation it is difficult
to analyze expenditures by object (e.g., wages and salaries, maintenance,
etc.) and development expenditures are presented on a functional basis.
It should be also noted that there is an absence of any
long term fiscal planning for the KMC. Beyond the annual budget, there
are neither planned expenditure levels nor revenue projections, and there
is no ofLice within the 1MC which has fiscal planning responsibility.
-9-
IIL. Expenditure Trends
The purpose of this section is to describe and, if possible,
explain the pattern of increase in KMC and KDA expenditures. Three consid-
erations are relevant: the general pattern and trend of expenditure in-
crease, the sources of financing this increase and the functional components
of this expenditure increase, Throughout thLs section, there is special
emphasis on the extent to which any expenditure activities generate reve-
nues which account for some part of costs (are partially or wholly self-
financing) and therefore on the general revenue dependence of each expen-
diture category.
General Patterns
Public expenditure activities within Karachi metropolitan area
can be assigned to the KMC, the KDA, the government of Sind and the Fed-
eral Government. The Federal government keeps no records on direct expen-
ditures within the metropolitan area. Thus, it is not possible to qualify
their relative expenditure importance and to compare this with expenditures
of other governments. This is because expenditure records are kept by
purpose of expenditure, by function, or by object but not by location of
the expenditure. An estimate of the relative importance of the three
levels of government in Karachi might be made by comparing their overall
levels of per capita expenditures, i.e., by comparing per capita expendi-
tures by the government of Pakistan (less transfers to lower levels of
government), per capita expenditures by the Sind government, and per capita
expenditures of both KMC and KDA.

- 10 -
Such a comparison is presented in Table 1 and shows that
per capita KMC and KDA expenditures accounted for 22.8 percent of per
capita expenditures of all three levels of governmenits combined in
1977/78. The importance of KMC expenditure, however, has declined
somewhat between 1970/71 and 1977/78. Per capita expenditures of KMC
and KDA combined grew at average annual rate of 20.5 percent, while per capita
expenditure of the Federal and Sind government grew at average annual
rates of 23.5 and 15.8 percent respectively.
The time series data in Table 2 shows that the growth
of KMC expenditure has been sluggish. Data limitations are such that
a systematic study of the determinants of this growth is not possible.
However, the trend in per capita expenditures might be viewed as general-
ly effected by increases in the price level and increases in population.
Had per capita total expenditures remained constant in real terms at
Rs 33.9 between 1970/7. and 1977/78 total money expenditures
would have risen to Rs 551.3 million as compared with actual KMC expen-
ditures of Rs 408.1 million. Thus, increases in total expenditures
during this period have not caught up with rising population and price
increases.
The decline in real per. capita expenditures of KMC over
the past decade is primarily due to continued stagnation of its develop-
ment budget for water supply, schools, health, hospitals, roads and
bridges. Per capita expenditures in the current accounts especially in
the area of education, sewerage, health, hospitals and recreation have
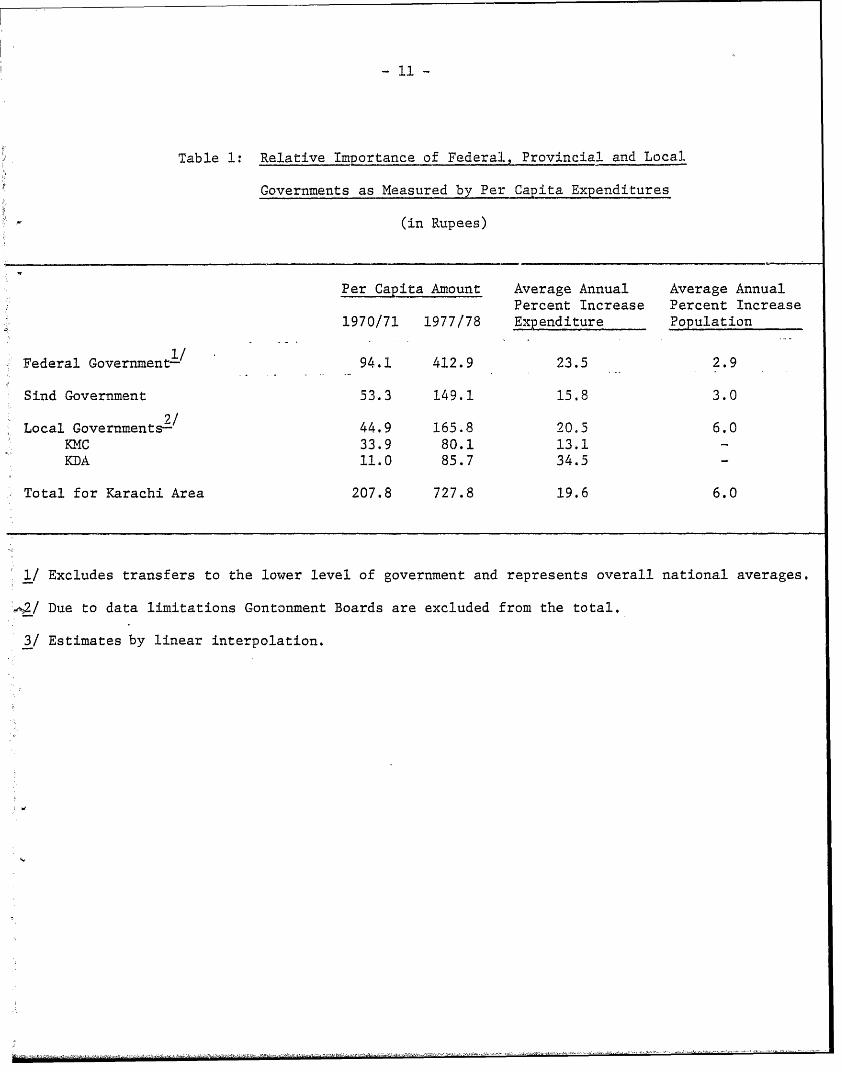
Table 1: Relative Importance of Federal, Provincial and Local
Governments as Measured by Per Capita Expenditures
(in Rupees)
Per Capita Amount Average Annual Average AnnualPercent Increase Percent Increase
1970/71 1977/78 Expenditure Population
Federal Goverment-/ 94.1 412.9 23.5 2.9
Sind Government 53.3 149.1 15.8 3.0
Local Governments2/ 44.9 165.8 20.5 6.0KMC 33.9 80.1 13.1KDA 11.0 85.7 34.5 -
Total for Karachi Area 207.8 727.8 19.6 6.0
1/ Excludes transfers to the lower level of government and represents overall national averages.
A 2 ! Due to data limitations Gontonment Boards are excluded from the total.
3/ Estimates by linear interpolation.

Table 2: Summary of KMC Finances, 1970/71 - 1978/79
(in million Rupees)
1970/71 1971/72 1972/73 1973/74 1974/75 1975/76 1976/77 1977/78 1978/79---------------------------------- Actual---------------------------------- (Revised (Budget)
Estimates) (ugt
Total Municipal Revenue-/ 100.8 103.5 113.2 162.5 191.3 243.4 253.8 323.9 388.2Total Municipal Expenditures 114.9 126.7 143.2 194.9 256.1 287.3 282.8 408.1 441.3
Current 78.2 88.2 98.6 134.7 167.7 197.5 207.2 287.4 320.5Development 36.7 38.5 44.6 60.2 88.4 89.8 75.6 120.7 120.8
Overall Surplus (+) orDeficit (-) 2/ -14.1 -23.2 -30.0 -32.4 -64.8 -43.9 -29.0 -84.2 -53.1
1/ Includes revenues from sales of government properties and development charges but excludes loans and grants forpriimary schools.
2/ Financed by government loans, grants and use of cash balances.
Sources: KMC, Explanatory Memorandum for respective fiscal years and supplementary data provided by KMC Finance Department,

- 13 -
registered varying amounts of real growth (Table 3). Indications are
that increases in these expenditures are more of a reflection of in-
creasing wage rate than that of an upgrading of municipal services.
Table 4 presents the composition of KMC expenditures.
In 1970-71 water supply, public health and roads and bridges were the
most important components of KIMC expenditures; together they accounted
for 63.0 percent of total outlays. In 1977/78, however, the relative
importance of these functions declined to 52.4 percent and especially
the share of water supply expenditure declined from 21.9 percent to
14.0 percent of total spendirg. The share of KMC expenditure on roads
and bridges also declined from 20.1 percent to 16.3 percent of the to-
tal during the same period. One explanation of this pattern is the
inability of KMC to generate required revenues. As a result of the
lack of financial resources and frequent pay revision enforced by the
Federal Government, the functional distribution of expenditures has been
accentuated toward more on the social service functions.L/ As may be seen
from Table 5, social service expenditures have increased from 53.2 percent
to 62.1 percent of total spending.
The Sources of Finance
A key to understanding and explaining the trends of
local government expenditures is measurement to the extent of which the
various sources of revenues -- taxes, specific fees and charges,
grants and loans -- have contributed to the financing of expenditure
1/ The broad definition of social services used here include health,education, hospitals, fire, fefuse collection and recreation,
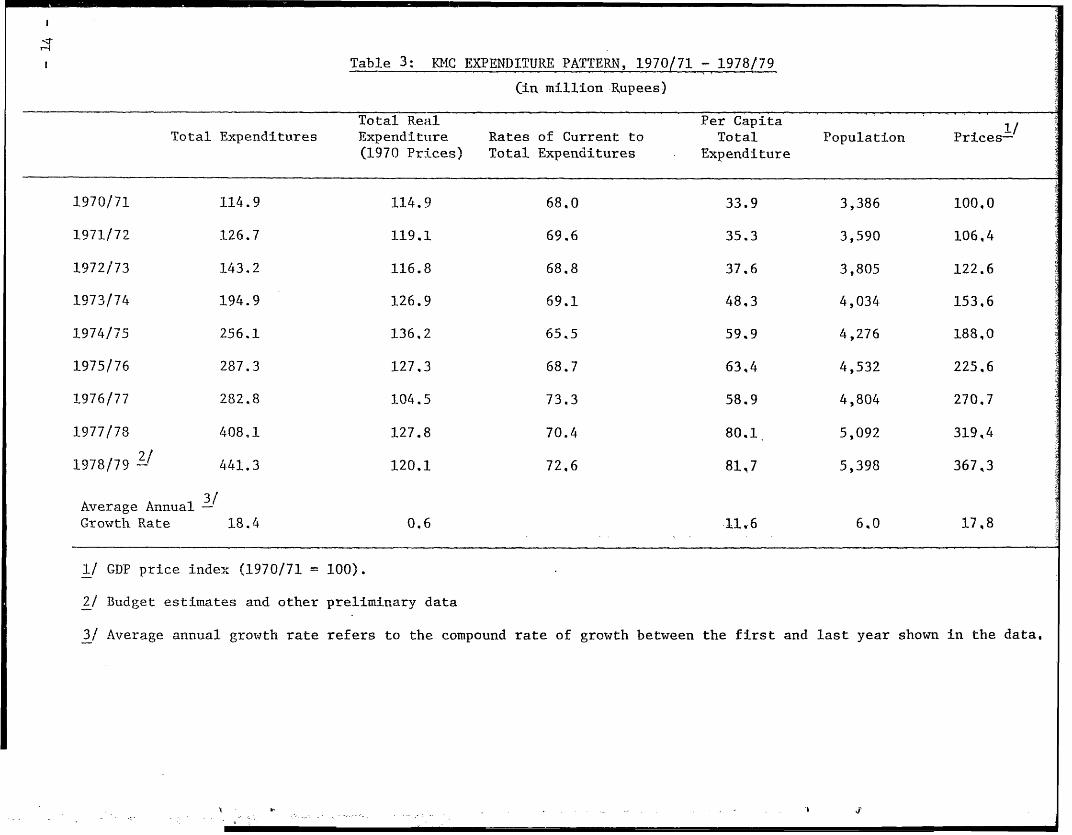
Table 3: KMC EXPENDITURE PATTERN, 1970/71 - 1978179
cim million Rupees)
Total Real Per Capita I/
Total Expenditures Expenditture Rates of Current to Total Population Prices-(1970 Prices) Total Expenditures Expenditure
1970/71 114.9 114.9 68,0 33.9 3,386 100.0
1971/72 126.7 119.1 69.6 35.3 3,590 106,4
1972/73 143.2 116.8 68.8 37.6 3,805 122.6
1973/74 194.9 126.9 69.1 48.3 4,034 153,6
1974/75 256.1 136.2 65.5 59.9 4,276 188,0
1975/76 287.3 127.3 68.7 63,4 4,532 225.6
1976/77 282.8 104.5 73.3 58.9 4,804 270.7
1977/78 408.1 127.8 70.4 80.1 5,092 319,4
211978/79 2/ 441.3 120.1 72.6 8147 5,398 367,3
Average Annual-Growth Rate 18.4 0.6 11.6 6.0 17,8
1/ GDP price index (1970/71 100).
2/ Budget estimates and other preliminary data
3/ Average annual growth rate refers to the compound rate of growth between the first and last year shown in the data.
1' ,b . .-

Table 4: INCREASE IN KMC PER CAPITA EXPENDITURES BY FUNCTION: 1970/71 - 1977/78
(in Rupees)
1970/71 1977/78 Annual 1970/71 1977/78 Annual(Revised Percent - (Revised Percent
Function Estimate) Increase Function Estimate) Increase
Water (Total) 7.39 11.19 6.1 Recreation (Total) 1.02 3.47 19.1Current 5.48 7.91 5.4 Current ,70 2.14 17.3Capital 1.91 3.28 8.0 Capital .32 1.33 22.5
Education (Total) 2.32 8.28 19.9 Road and Street 6.81 13.07 9.8Current 1.17 7.79 31.0 Lights (Total)Capital 1.15 .49 -12.9 Current 3.42 5,75 7.7
Capital 3.39 7.32 11.6Health (Total) 7.09 17.73 14.0
Current 5.30 15.73 16.8 Fire (Total) .34 1,42 22.5Capital 1.79 2.00 2.3 Current .29 .80 15.6
Capital .05 .62 43.5Sewerage and 1.61 6.06 20.7Drainage (Total) Others (Total) 4.75 12.17 14.4Current .70 2.37 19.0 Current 4.48 8.70 10.0Capital .91 3.69 22.3 Capital .27 3,47 44.2
Hospitals (Total) 1.53 6.62 14.7 Total 33.88 80.17 13.1Current 1.50 5.18 19.4 Current 23,06 56.46 13.6Capital 1.03 1.44 4.9 Capital 10.82 23.17 11,9
-tJ

- 16 -
Table 5: PERCENTAGE DISTRIBUTION OF KMC EXPENDITURES BY FUNCTION
1977/781970/71 (Revised Estimate)
Function Current Total Current Total
Water 23.9 21.9 14.0 14.0
Education 5.1 6.9 13.8 9.9
Health 23.1 21.0 27.9 22.1
Sewerage & 3.1 4.8 4.2 7.6Drainage
Hospitals 6.5 7.2 9.2 8.3
Recreation 3;1 3.0 3.8 4.3
Roads & Streets 14.9 20.1 10.2 16.3
Fire 1.3 1.0 1.4 1.8
Others 19.1 14.1 15.4 15.7
Total 100.0 100.0 100.00 100.0

- 17 -
increase. The revenue structure of the M{C is characterized by heavy
reliance on general tax revenues, while that of KDA mainly depends on
specific charges from the water and land development schemes and grants
and loans. When the financing of 1970/71 - 1977/78 changes in local
government expenditure is examined, it may be seen that the pattern is
generally reinforced, i.e., more than 60 percent of KMC expenditure
increase was financed th-r.gh general taxation; nearly same percentage
of KDA expenditure increase was financed through grants and loans and
the remainder through specific charges.

- 18-
IV. The Functional Sources of Expenditure Increase
Alternative approach to explain the local government
expenditure trend is to focus on expenditure increases on a functional
basis and to identify any part of expenditures which are covered from
resources other than general purpose revenues raised from own sources.
Accordingly, specific attention is accorded those functions which
recapture a portion of expenditures through specific charges or benefit
levies, and expenditure functions are viewed according to their financ-
ing arrangements, i.e; general revenue finances, or "self-financed" in
cases where the function is supported either wholly or in part by a
user charge or earmarked tax. While most of the ICIC functions are fi-
nanced by general revenues, KDA clearly belongs to the latte- category.
Although the water supply, sewerage and drainage function in KMC are in
practice,general revenue financed, they do have "designated" revenue
sources. For purposes explained below, the water supply, sewerage and
drainage functions are treated initially as though they were "self-
financed."
Water Supply
Both KMC and KDA are jointly responsiblie for water
supply in Karachi. KDA is responsible for development and maintenance
of water resources and operation of treatment plants. KDA also main-
tains the trunk mains and a small part of the distribution system.
It sells the water in bulk to a number of government and private groups
each at different rates; Rs 0.94 per 1,000 gallons to government bodies
and Rs 3.00 to agricultural and private consumers. The responsibility

- 19 -
for the distribution of the city water supply and collection of water
charges rests with local authorities, mainly with KMC.
Water is (officially) provided to about 45 percent of total
households in the city area, with in-house water connections for only
30 percent. According to recent estimates average availability of
IQrater per city resident is 22 gallons per day in 1977/78. Water is
supplied from the Indus River (about 90 percent) and tubewell sources,
and total system leakage is estimated at about 15 percent of water
production.
The growth in water supply expenditure was mainly due to
heavy capital spending and the ensuing debt servicing obligations of
KDA which have resulted from expansion of the city water supply. The
financing of water supply expenditures is from water rates and general
tax revenues in case of N4C (Table 6), while that of KDA is mainly
from borrowing (Table 7). There is no tariff differentials between
domestic, commercial, and agricultural purposes. Sales to distribution
agencies are based on meter readings, but a large number of existing
meters are believed to be inoperative. These deficient meters appear
to be reasons for frequent disagreement between KMC and KDA with regard
to the amount of water supplied and water charges due. In 1977/78, for
exalmple, KDA records show that it supplied the city with approximately
an average of 158 million gallons per day (MGD) of bulk water of which
an average of about 120 MGD was allocated to the KMC distribution system.
KDA, however, received a total water revenue of only Rs 55.2 million of
which Rs 32.9 million was collected from IKMC. The actual water receipts
from KMIC is equivalent to the amount sufficient to cover an average of
only 96 MGD at the present rate of Rs 0.94 per 1,000 gallons.

C."
Table 6: FINANCING MUNICIPAL WATER SUPPLY
(in thousand Rupees)
1970/71 1971/72 1972/73 1973/74 1974/75 1975/76 1976/77 1977/78 1978/79(Revised (Budget)Estimate) (ugt
lWater Rate Received 12,809 11,100 11,865 12,950 10,081 16,274 17,228 21,479 31,000
Current Expenditures 19,274 20,848 -',122 22,903 23,684 38,708 39,639 40,349 46,294
Current Surplus -6,467 -9,748 -12,257 -9,953 -13,603 -22,434 -22,411 -18,870 -15,294or Deficit
Capital Expenditure 4,282 5,438 5,197 11,202 10,263 8,241 10,271 16,730 20,076
Overall Surplus -10,749 -15,186 -17,454 -21,155 -23,866 -30,675 -32,682 -35,600 -35,370or Deficit

l.
Table 7: Summary of KDA Finances.. 1973/74 - 1978/79
(in million Rupees)
1973/74 1974/75 1975/76 1976/77 1977/78 1978/79- - -- Actual------------------ (Revised (Budget)
Estimates)
Current Receipts 103.8 94.1 132.4 117.6 122.8 255.6Sale of Water 33.8 34.8 37.9 49.6 55.2 124.0Sale of Plots 60.4 46.5 84.8 51.2 49.6 97.8Reneewal and Replacement 2.5 2.4 2.9 3.9 5.2 20.1Service Charges 2.1 3.7 4.2 3.6 4.6 5.3Miscellaneous receipts 5.1 6.6 2.6 9.3 8.2 8.5
Non-Development Payments 59.6 78.1 97.6 119.0 111.0 242.7Water Supply 33. 47.0 56.6 65.6 76.6 92.8Renewal and Replacements 2.5 2.4 2.9 3.9 5,2 20,1Debt Servicing (Water) 22.6 25.8 33.8 46.6 24.6 124.5Self-Contained Departments 1.3 2.8 4.2 2.8 4.6 5,3
Development Payments 47,3 80.0 118.3 153.8 325,5 270.8Land Development Schemes 42.5 64.5 62.4 v484 75,6 100,5Captial Works (Water) 4.9 15.5 55.9 105.4 249.9 170.3
Financing Cap 3.1 64.0 83.5 167.8 313.6 257.9
Capital Receipts 4.5 56.1 64.72 180.5 285.6 175.4Government Loans 4.5 56.1 9.2 0.5 2.8 1.9Bank Loans - - 55.0 180.0 253.1 167.8Other Receipts -29.7 5.7
Overall Surplus (+) or Deficit (-) +1.3 -7.9 -19.2 +25.2 -28.0 -82.4
Sources: KDA, Budget Estimates and Annual Accounts of Water Wing for respective fiscal years.
. .'I$
, -j

-22-
In contrast to a total revenue receipt of 1s 55. 2 KMll-oz, KDA's
current water expenditures am.ounted to Rs 101.2 million, resulting in
an operating deficit of Rs 46.0 million or 45 percent of current water
expenditures in 1977/78. If the capital outlays are included in this
total, KDA's water deficit would amount to Rs 296 million or 83 percent
of its total water expenditure. According to KDA's own estimates, the
rate required to cover total operating costs of water supply in 1978/79
amotnt to Rs 2.97 per 1,000 gallons representing 216 percent more than
the present rate. Furthermore, if KDA is to cover both its current and
capital expenditures, the present rate of Rs 0.94 has to be increased
by 483 percent,, an equivalent of Rs 5.48 per 1,000 gallons. The present
water ratein Karachi rank among the cheapest in the world for a major
city and they are not only major sources of local financial difficulties
but also lead to the waste of water resources in the city.
At present KMC is responsible for about 75 percent of
the city water distribtuion and about 60 percent of total water revenues
collected by KDA. There is a 6.0 or 6.5 percent property tax rate for
water supply; however this designation of revenues is more a justi-
fication for imposing additional tax on properties than an intended
1/means of self-financing.- That is, total expenditures are not limited
to this amount and the user charges is not based on consumption. In
fact, the designated water tax has represented a declining share of
1/ Households with individual water connections are charged 6.5 percentof net annual rental value and those without individual connectionsare charged 6.0 percent.
- 23 -
total water expenditures. As a result, KIC is forced to increase its
dependence on general tax revenues than the designated water rates,
wqhile KDA increases its dependence on borrowing. Since the water tax
rate in KMC remained constant for a number of years, the slow growth
irn water revenues is due to stagnation of rental (or property) value
assessment. Because of further extension of the water system (especi-
ally the 4th phase of Karachi Bulk Water Supply Scheme) is planned for
the next few years, the shortfall between water tax receipts and expen-
ditures for water supply will increase, and therefore increasingly more
general tax revenues for KMC and more borrowing for KDA will be required.
If the increasing drain on KMC revenues for water supply
financing is a result of a low property tax rate for water, then an
upward rate adjustment might be proposed. In this respect, it is possible
to estimate that water property tax rate at which all current water supply
expenditures are covered,. It is important to note that an increase in the
designated property tax rate for water financing in no sense improves
efficiency, since there :is no relationship between the water charge and
consumption.
The water-rate price equivalent may be estimated if only
assessed property value and the average cost of providing water are known.
The latter can be approximated with data from the consolidated accounts
of operating and capital costs of water supply in KMC (Table 8). Because
of the difficulty in deriving the cost function we use only a point esti-
mate of average costs, i.,e., cost per gallon in the most recent year for
which data is available.
e .4yi ':f i -r- X -; ,i- v,ga.z. 1;Z. '.>Z+Mt t2K5cj1'. ta@9."=r.... 0 S e,rwa >v ;-) .t: t1 .~f.e... ^ .--.....:.---....-
- 24 -
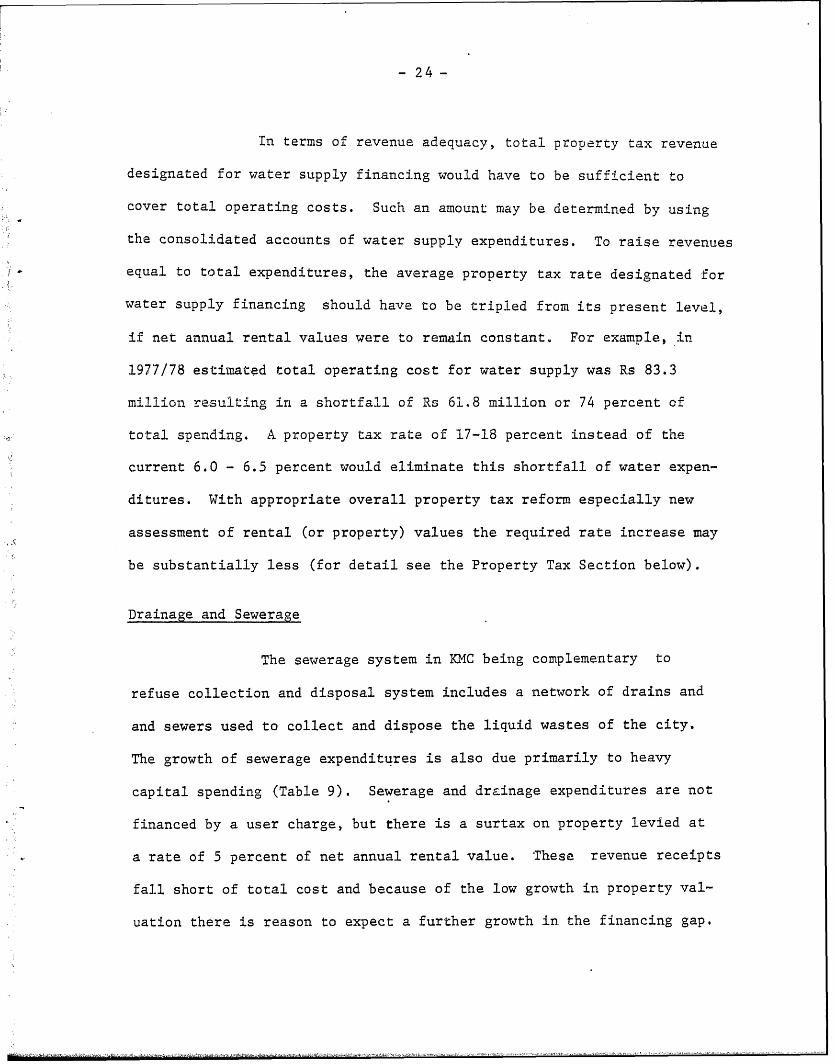
In terms of revenue adequacy, total property tax revenue
designated for water supply financing would have to be sufficient to
cover total operating costs. Such an amount may be determined by using
the consolidated accounts of water supply expenditures. To raise revenues
equal to total expenditures, the average property tax rate designated for
water supply financing should have to be tripled from its present level,
if net annual rental values were to remain constant. For example, in
1977/78 estimated total operating cost for water supply was Rs 83.3
million resulting in a shortfall of Rs 61.8 million or 74 percent of
total spending. A property tax rate of 17-18 percent instead of the
current 6.0 - 6.5 percent would eliminate this shortfall of water expen-
ditures. With appropriate overall property tax reform especially new
assessment of rental (or property) values the required rate increase may
be substantially less (for detail see the Property Tax Section below).
Drainage and Sewerage
The sewerage system in KMC being complementary to
refuse collection and disposal system includes a network of drains and
and sewers used to collect and dispose the liquid wastes of the city.
The growth of sewerage expenditures is also due primarily to heavy
capital spending (Table 9). Sewerage and drainage expenditures are not
financed by a user charge, but there is a surtax on property levied at
a rate of 5 percent of net -annual rental value. These revenue receipts
fall short of total cost and because of the low growth in property val-
uation there is reason to expect a further growth in.the financing gap.
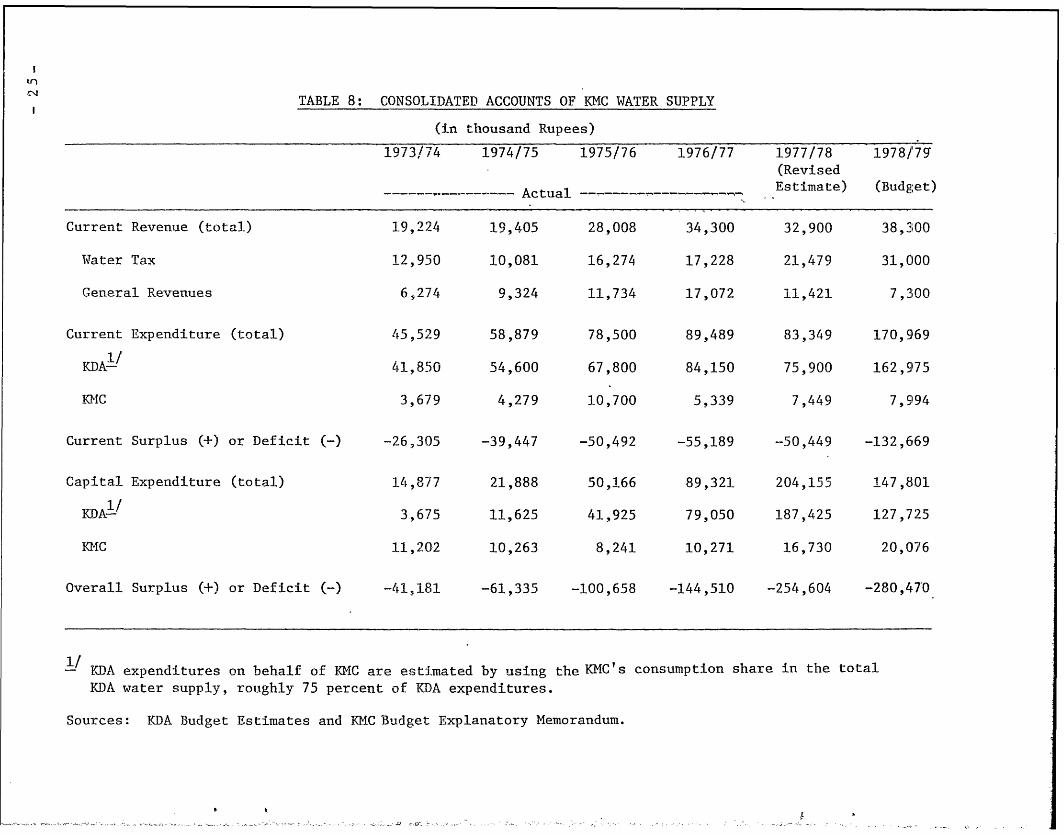
TABLE 8: CONSOLIDATED ACCOUNTS OF KMC WATER SUPPLY
(in thousand Rupees)
1973/74 1974/75 1975/76 1976/77 1977/78 1978/79(Revised
- - Actual ------------------ -- Estimate) (Budget)
Current Revenue (total) 19,224 19,405 28,008 34,300 32,900 38,300
Water Tax 12,950 10,081 16,274 17,228 21,479 31,000
General Revenues 6,274 9,324 11,734 17,072 11,421 7,300
Current Expenditure (total) 45,529 58,879 78,500 89,489 83,349 170,969
KDA-1/ 41,850 54,600 67,800 84,150 75,900 162,975
-KC 3,679 4,279 10,700 5,339 7,449 7,9194
Current Surplus (+) or Deficit (-) -26,305 -39,447 -50,492 -55,189 -50,449 -132,6169
Capital Expenditure (total) 14,877 21,888 50,166 89,321 204,155 147,801
I/KDA-!' 3,675 11,625 41,925 79,050 187,425 127,725
KMC 11,202 10,263 8,241 10,271 16,730 20,076
Overall Surplus (+) or Deficit (-) -41,181 -61,335 -100,658 -144,510 -254,604 -280,470
- K1DA expenditures on behalf of KIC are estimated by using the KMC's consumption share in the total
KDA water supply, roughly 75 percent of KDA expenditures.
Sources: KDA Budget Estimates and 'KMC Budget Explanatory Memorandum.
k

Table 9: FINANCING MUNICIPAL DRAINAGE AND SEWERAGE WORK
(in thousand Rupees)
1970/71 1971/72 1972/73 1973/74 1974/75 1975/76 1976/77 1977/78 1978/79(Revised (Budget)Estimate)
Current Revenues 6,767 8,729 9,735 11,348 8,598 15,517 12,649 16,158 20,000
Current Ex'penditures 2,363 3,970 4,066 6,058 7,280 8,574 5,339 12,099 12,541
Current Surplus or 4,404 4,759 5,669 5,290 1,318 6,943 7,310 4,059 7,459Deficit
Capital. Expenditure 3,107 4,257 6,874 7,132 20,681 17,062 12,409 18,777 24,612
Overall Surplus or 1,297 502 -1,205 -1,842 -19,363 -10,119 -5,099 -14,718 -17,153Deficit
---- ---- ----

-27-
To meet this shortfall, the designated property tax rate might be in-
creased. If, for example, in 1977/78 the property tax were to cover
full costs, the present tax rate haG to be raised by nearly 100 percent
or a rate of 9.6 percent of net annual rental value.
General Revenue Financed Services
The growth in total expenditure for the municipal water supply
and sewerage system was 13.8 and 27.3 percent per year between 1970/71
and 1978/79 respectively, while the growth rate in total KMC expenditure
for all other (general reven.ue financed), services was 18.6 percent per
year over the same period (Table 10). The composition of the growth is
presented in Table 11 below.
To the extent that the municipal water and sewerage system
operates in deficit, and use the general revenue of KMC to offset this
deficit, they leave less revenue to be spent on the services financed
from general revenue (revenues other than property tax). The deficit
of the water supply account in 1977/78 was Rs 35.6 million and the
deficit in the sewerage account was Rs 14.7 million. These feficits
which are financed from general revenues might be viewed as a result
of an intentional government subsidy. However, the merit of these
subsidies actually depends on the extent to which expenditures on water
supply and sewerage weigh more heavily on the incomes of the poor than
do the mainstays of the general account (mainly Octroi payments).

- 28 -
Table 10: KCN EXPENDITURE TRENDS., 1970/71 - 1978/79
(in thousand Rupees)
General Revenue Financed Water Drainage andSupply Sewerage
1970/71 85,929 23,556 5,470
1971/72 92,161 26,286 8,227
1972/73 102,950 29 s,319 10,940
1973/74 147,691 34,105 13,190
1974/75 194,121 33,947 27,961
1975/76 214,763 46,949 25,636
1976/77 215,153 49,910 17,748
1977/78 320,119 57,079 30,876
1978/79 337,829 66,370 37,153
Average AnnualPercent Increase 18.6 13.8 27.3

Table 11 Per Capita KL4C Expenditures by Functions, 1970/71 - 1978/79cl (in Rupees)
1970171 1971/72 1972/73 1973/74 1974/75 1975/76 1976/77 1977/78 1978/79l--------------------------------------------Actual------------------------------
(Revised (Budget)Estimates)
Water Supply 6.175 7.18 7.60 8.18 8.06 10.35 10.39 11.19 12.29Current 5.48 5.68 6,24 6.10 5.53 8.54 8.25 7.91 8.57Capital 1.27 1.50 1.36 2.08 2.47 1.81 2.14 3.28 3.72
Education 2.32 3.11 3.35 5.35 3.77 5.36 4.87 8.28 8.26Current 1.17 1.50 2.02 2.95 3.45 4.81 4.52 7.79 7.85Capital 1.15 1.61 1.33 2.40 .32 .55 .35 .49 .31
Public Healtlh 7.09 6.73 6.81 7.93 12.05 12.75 13.22 17.73 19.86Current 5.30 5.37 5.61 7.04 10.86 11.78 11.87 15.73 15.72Capital 1.,79 1.36 1.20 .89 1.19 .97 1.35 2.00 4.14
Sewerage & Drainage 1.61 2.30 2.01 4.72 6.53 5.66 3.68 6.06 6.86Current .70 1.11 1.07 1.48 1.70 1.89 1.10 2.37 2.31Capital .91 1.19 .94 3.24 4.83 3.77 2.58 3.69 4.55
Hospitals 2.53 2.08 3.16 3.52 4.29 5.29 5.89 6.62 6.66Ctirrent 1.50 1.75 1.83 2.48 3.66 3.64 3.95 5.18 5.59Capital 1.03 .47 1.33 1.04 .63 1.65 1.94 1.44 1.07
Recreation 1.02 1.39 1.46 2.49 4.31 2.26 3.06 3,47 3.49Current .70 .89 .89 1.38 1.56 1.67 1.81 2.14 2.22Capital .32 .50 .57 1.11 2.75 .59 1.25 1.33 1.27
Roads & Street Lights 6.81 7..21 7.60 8.73 10.11 10.16 9.07 13.07 10.70Current 3.42 3.59 3.96 4.96 4.34 4.12 4.22 5.75 6.48Capital 3.39 3.62 3.64 3.77 5.77 6.04 4.85 7.32 4.22
Fire .34 .41 .43 .46 .54 1.30 1.22 1.42 1.40Current .29 .33 .36 .44 .53 .55 ,52 .80 1,00Capital ,05 .08 .07 .02 .01 .75 .70 .62 .40
Other 6.38 4.70 5.11 6.90 10.18 10.26 7.44 12.17 12.28Current 4.48 4.31 3.85 6.52 7.50 6.57 6.88 8.70 9.59Capital .91 .39 1.26 .38 2.68 3.69 ,56 3.47 2.69
Total 33.88 35.28 37.57 48.35 59.83 63.41 58.91 80.17 81.72Current 23.06 24.56 25.87 33.42 39.18 43.59 43.16 56.46 59.35Capital 10.82 10.72 11.70 14.93 20.65 19.82 15.75 23.71 22.37
i'I S :-~..

- 30 -
V. Revenue Structure and Trend
The structure of KMC revenues shows a heavy dependence on two
major taxes -- Octroi and property tax. DIC rely very little on external
assistance. The two taxes together account in 1978/79 budget for over
98 percent of total tax or about 78 percent of total revenue. Revenues
from other taxes (mainly cinema and advertising tax) account for only
1.3 percent of total revenue. The balance is from non-tax revenue
sources. Non-tax revenues which are mainly receipts from rents on
government properties, fees and charges increased in importance from 11.1
percent of total revenue in 1970/71 to 20.7 percent in 1977/78. Over the
same period tax revenues have ranged between 78 and 90 percent of KMC
resources (Table 12).
On a per capita basis, tax revenues have grown at a rate of 9.4
percent per year, while the price level increased at a rate of 17.8 per-
cent. As a result real per capita tax revenue declined at a rate of 4.6
percent. The decline in per capita taxation reflects in the ratios esti-
mated of tax revenues to income which fell from 1.4 percent in 1970/71
to 0.7 percent in 1977/78. As shown in Table 14, there has been a steady
and continuous decline in this ratio and it implies that the tax effort
in KMC has been deteriorating greatly over this period. The negative
bouyancy in tax receipts has come abcut par,ticularly because of the
sluggish growth in property tax revenues -whose share in the total tax
shrank from 41.7 percent in 1970/71 to 28.0 percent in 1977/78,

Hn
Table 12: KUMC REVENUE STRUCTURE AND TRENDS
(in million Rupees)
1970/71 1971/72 1972 /773 1973/74 1974/75 1975/76 1976/77 1977/78 1978/79
Tax Revenues
1/Property Taxes- i37.1. 41.1 43.7 55.2 51.7 60.9 61.9 70.1 87.0
Octroi 50.3 49.9 56.2 88.6 116.9 128.5 154.2 177.5 200.0
Cinema Tax 0.6 0.4 0.3 0.3 0.4 0.3 0.4 0.4 0.5
Advertising Tax 0.7 0.7 0.8 2.3 1.8 2.5 1.9 2,5 4.0
Other Taxes 0.3 0.6 0.5 0.44 - 0.3 0.3 0.2 0.2 0.2
Total Tax Revenues 89.0 92.8 101.5 146.8 170.9 192.5 218.6 250.6 291.7
Non-Tax Re 2/enues-- 11.1 10.0 9.7 12.3 18,0 44.3 35.1 65.3 77.6
Total Current Revenues 100.1 102.8 111.2 159.1 188.9 236.8 253.7 315.9 369.3
Current Revenues atConstant Prices 100.1 96.6 90.7 103.6 100.5 105.0 93.7 98.9 100.5
1/ Includes general property tax, water tax, conservancy tax and fire tax.
2/ Includes rents, fees and grants from primary schools.
,- -- , - -

'e
Table 13: PERCENTAGE DISTRIBUTION OF KMC TAX REVENUES
1970/71 1971/72 1972/73 1973/74 1974/75 1975/76 1976/77 1977/78 1978/79Per Capita Total 26.25 25.85 26.64 36.43 39.93 42.49 45,54 49.23 54.02Tax Revenues (in Rupees)
Percentage Distribution:
General Property Tax 17.1 19.4 17.5 17.2 15.3 15.3 12.5 10.9 10.3Fire Property Tax 2.6 3.6 4.2 3.9 4.0 3.1 2.2 2.0 2.0Water Property Tax 14.4 12.0 11.7 8.9 5.9 8.5 7.9 8.6 10.6Conservancy Property Tax 7.6 9.4 9.6 7.7 5.0 4.8 5.8 6.5 6.9Octroi 56.5 53.8 55.4 60.4 68.4 66.8 70.5 70.8 68.6Cinema Tax 0.7 0.4 0.3 0.2 0.2 0.2 0.2 0.2 0.2Advertising Tax 0.8 0.7 0.8 1.6 1.1 1.3 0.9 1.0 1.4Other Taxes 0.3 0.6 0O5 0.3 0.2 0.2 0.1 0.1 0.1
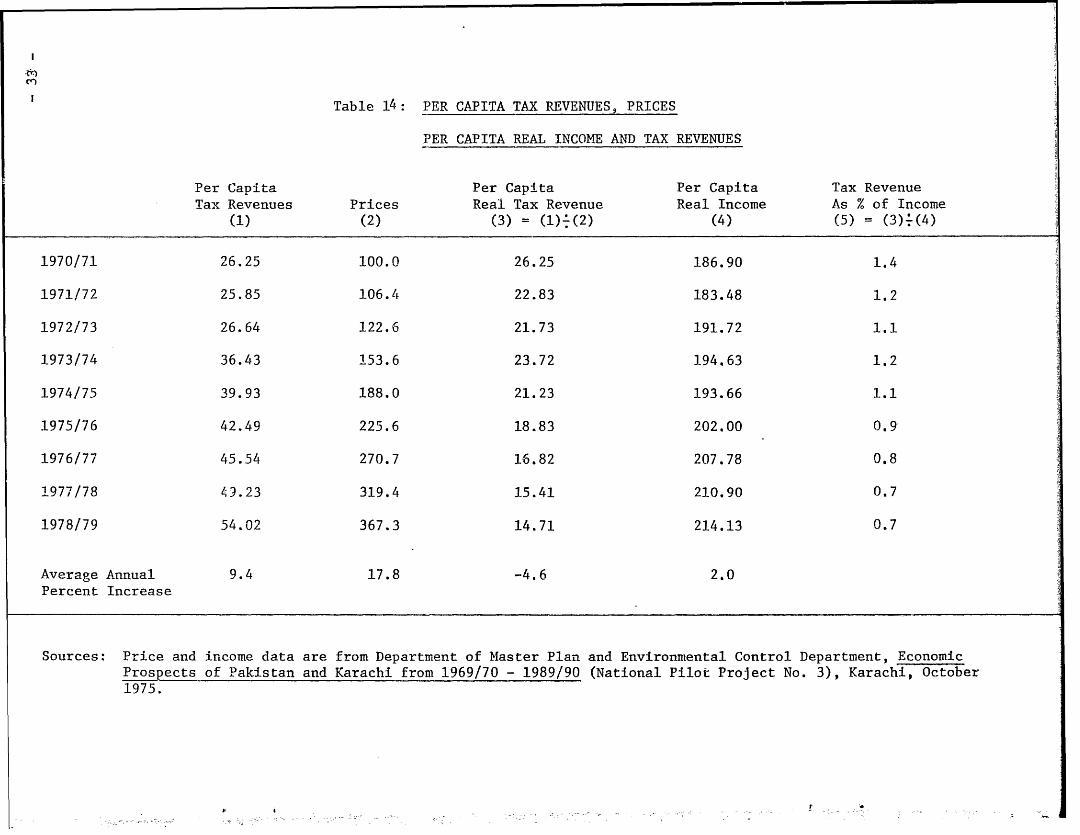
Table 14: PER CAPITA TAX REVENUESi PRICES
PER CAPITA REAL INCOME AND TAX REVENUES
Per Capita Per Capita Per Capita Tax RevenueTax Revenues Prices Real Tax Revenue Real Income As % of Income
(1) (2) (3) =(1)'(2) (4) (5) =(3)-(4)
1970/71 26.25 100.0 26.25 186.90 1.4
1971/72 25.85 106.4 22.83 183.48 1.2
1972/73 26.64 122.6 21.73 191.72 1.1
1973/74 36.43 153.6 23.72 194.63 1.2
1974/75 39.93 188.0 21.23 193.66 1.1
1975/76 42.49 225.6 18.83 202.00 0.9
1976/77 45.54 270.7 16.82 207.78 0.8
1977/78 49.23 319.4 15.41 210.90 0.7
1978/79 54.02 367.3 14.71 214.13 0.7
Average Annual 9.4 17.8 -4.6 2.0Percent Increase
Sources: Price and income data are from Department of Master Plan and Environmental Control Department, EconomicProspects of Pakistan and Karachi from 1969/70 - 1989/90 (National Pilot Project No. 3), Karachi, October1975.

-3 4
Property Tax
Legal Structure. The property tax for Karachi was established
by the West Pakistan Urban Immoveable Property Tax Act of 1958. The tax
was administered by MQC until 1972 when the government of Sind took over
the administrative responsibility for the tax. Under the Sind Finance
Act of 1972, KMC has been debarred from levying general property tax
but the City is entitled to receive 40 percent of the net property tax revenues
collected by the Province of Sind (net revenue being gross revenue
minus a 2 percent collection charge retained by the Province). Sub-
sequently, KIIC's share in the tax was increased to 50 percent and 85
percent in 1978/79 and 1979/80, respectively.
The base of the property tax is net annual rental value.
The liability for payment is on the property owner and the tax is paid
twice a year (January and July). The tax has four components: a
general tax which ranges from 20 to 25 percent of assessed annual rental
value, a water tax of 6.0 or 6.5 percent, a conservancy tax of 5 percent,
and a fire tax of 1.5 percent (Table 15). The normal water and property tax rate
does not include industrial properties such as factories and mills.
For industrial consumption of water, charges are based on meter readings.
In Karachi most of old properties are subject to a rent
control (The Karachi Rent Restriction Ordinance) but assessment by the
Government is still made on the basis of annual rental value. The rent-
control law, prescribing the conditions under which rents can be raised,
has the effect of freezing assessments on old properties while the assess-
ments on new but similar properties are increased. Over time this has
resulted in wide and clearly inequitable discrepancies in the assessed
value of similar properties which have been rented at different tlmes.

Ln
Table 15'. PROPERTY TAX RATE STRUCTURE
AnnualRental General Water Conservancy FireValue Rate Tax Tax Tax Total Rate
Rs 1 -- 250 Exempt (general) 6.0(6.5) 5.0 1.5 12.5(13.0)
251 - 540 Exempt (Residential) 6.0(6.5) 5.0 1.5 12.5(13.0)
541 -- 12,000 20.0 6.0(6.5) 5.0 1.5 32.5(33.0)
12,001 20,000 22.5 6.0(6.5) 5.0 1.5 35.0(35.5)
Above Rs 20,000 25.0 6.0(6.5) 5.0 1.5 37.5(38.0)
Note: Owner-occupied residences receive a 25 percent rebate on the first Rs 12,000 of annual rentalvalue.
I-K

- 36
The implications of the rent control issue are serious since virtually
all rented properties in Karachi are under the rent control.
Assessment Procedures. The process of assessing the taxable
value of properties in Karachi may be broadly divided into two different
categories; residential and non-residential properties. The assessment
of residential property values begins with the determination of the
annual (or monthly) rental value attributed to all residential properties
located in each district. To arrive at tax base (net annual rental value),
however, an automatic deduction of a 10 percent of gross annual rental
value is allowed for the cost of repairs and maintenance of such property.
Then, at the discretion of the assessor (ETO or his inspector), the pro-
perty is classified as very good, good, fair or poor, and the rental
value is adjusted accordingly. This is the value at which
the property tax is assessed. Although the size of the residential plot
is not formerly taken into consideration during the valuation process,
it is usually a fact in the discretionary good-fair-poor adjustment.
For owner-occupied residences, this amounts to a determination of a
"fair rental value" of the property.
With respect to renter occupied properties, on the
other hand, assessment is based on rents actually realized by the land-
lord, if such rents approximate a fair market rent. If the assessor
feels that the stated rent is not a fair one, the estimated market
rent for the neighborhood is used. Thus, in both of these cases the
judgement of the assessor plays a predominant role in determining
tax base.

37-
Commercial and industrial properties are assessed on a
different basis. Among the important considerations in determining
assessed value are types of construction and usage of properties.
Of commercial properties, cinemas, and hotels pose special assessment
difficulties and they are trea-ted as special cases. Assessors are
provided with an appraisal manual that is out of date and of little
practical use. The manual contains only three broad categories of
construction types and it does not spell out how each of the various
types of commercial and industrial properties should be appraised.
Because of the complexity oL commercial and industrial property val-
uation, the present rules and procedures of assessing these categories
of properties are even more unequitable than those applying to residen-
tial properties.
The last comprehensive property valuation for Karachi
was made in 1968. Initially the 1968 valuation list was to be effective
for only five years but in effect it has been extended by one year each
year since 1972 through special legislation. The most recent such
legislation is The Sind Urban Immoveable Property Tax Ordinance, 1979.
Thus, the valuation lists of properties other than the industrial
properties has not been changed since 1968.1/ The only changes which
have been made in the 1968 valuation list have been additions of new
buildings to the list. Even for adding new properties to the list,
the present procedures are unsystematic in nature. In addition, the
1/ The valuation of industrial properties is made on the basis of 4percent of land cost and 5 percent of building cost.
3 8
current method of property assessment in Karachi are neither periodic
nor uniform. The success of property taxation among other things depends
greatly on practical details reaarding the appraisal of property values.-
The present practice of assessing property value (or rental value) is
grossly inadequate in Karachi especially wnere property values rise very
rapidly.
Revenue Performance. Property tax revenues in Karachi over
the past eight years have grown at an average annual rate of 9.5 percent
in comparison with a 18 percent increase for the price and a 6 percent
increase for city population. The princiapl reason for the slow growth
is that the property tax base has not experienced rapid growth. Growth
in rental value, in theory, should result from one of two factors; a
natural growth in rent levels and/or property values, and new construction.
The latter usually is added to the assessment rolls, while the former
requires revaluation. Since 1968 there has been very little reassessment
of properties in Karachi and the growth of property tax during this per-
iod is mainly due to additions of newly constructed units to the rolls.
In an effort to highlight the growth in property tax reve-
nues the income elasticity of the tax has been estimated on the basis of
data during the 1970/71 - 1977/78. Because of the wide variation in the
annual changes in city income, the arc instead of average elasticity is
1/ Other factors necessary for the success of the property tax systeminclude availability of tax administrative facilities, the existenceof a fiscal cadastre and the availability of real estate market infor-mation. Due to the lack of information these aspects of taxation arenot discussed here.

3 -
used and estimated elasticity coefficient is 0.41. The reasons
for this low elasticity incluide too many exclusions from the tax
base, lack of reassessment, and a poor collection rate. The record
shows that 156,000 units of properties from a total of 295,568 units
or 52 percent were exempt fromtax in 1977/78. Since the elasticity of
property tax is also less than both the elasticity of total KMC
expenditure (0.78) and that of non-property tax revenue (0.76), it may
be concluded that revenues from the property tax are a shrinking
proportion of total tax revenues and of total expenditures. More speci-
fically, a 10 percent increase in city income tends to raise total
expenditures and non-property tax revenues by approximately 8 percent
each, but property tax revenues by only 4 percent.
In a recent study conducted by the World Bank, a comparison
of the property tax effort was made for 14 selected cities in LDCs, the
level of tax effort being measured here as a ratio of tax revenue to1/
income.- As shown in Table 16 the tax effort ratio for Karachi is
only 0.3 percent. For a city with Karachi's levrel of per capita income,
the ratio is extremely low. A normal ratio would lie between 1 and 2
percent. The mdeian for a sample of 15 cities is 1.9 percent.
The property tax effort ratio may be decomposed into two
parts; the ratio of tax to tax base (assessment) and .he ratio of base
(assessment) to income. If the former is low relative to other countries,
1/ Roy W. Bahl, Urban Property Taxation in Developing Countries (WorldBank, Urban and Regional Report No. 77-5), April 1976.

Table 16: COMPARATIVE LEVELS OF PROPERTY TAX EFFORT IN SELELTU.ELJ CITIES
Per Capita Taxes as aTotal Per Capita Assessed Value Percent of Property Taxes
Property Assessed as a Percent Assessed as a PercentTaxes Value of Incorne Value of Income
(Cities with Capital Value System)Bogota (1971) US$ 3.49 US$ 653 1.260 0.5 0.6
Cartagena (1972) 2.76 518 2.040 0.5 1.0
Jakarta (1972) 0.35 3 0.020 0.1
Kingston (1971) 4.75 90 0.109 5.7 0.6
Lusaka (1972) 9.60 845 5.709 114
Manila (1972) 14.20 1,276 2.463 1.1 2.7
Nairobi (1971) 12.04 317 0,635 3.8 2,4
Seou1 (1971) 2.20 840 1.935 0,3 0.5
Tunis (1971) 10.00 143 0.644 6.9 4.5
(Cities with Annual Value System)
Ahmedabad (1972) 3.75 15 0.142 24.9 3.5
Bombay (1971) 4.80 18 0.068 27.4 1.9
Calcutta (1971) 5.73 14 0.080 40.9 3.3
Hong Kong (1973) 15.20 131 0.111 11.6 1.3
Singapore (1968) 14.30 32 0.046 44.4 2.1
Karachi (1977/78) 1.78 5 0.008 35.0 0.3
1.9MEDIAN 4.80
Source: All cities except Karachi from: Roy W. Bahl, Urban Property Taxation in Developing Countries(TI'ord4ld,Bnnh.*Urban and Reaional Z2port No. 77-5), April 1976, p. 34. .

the underlying problem would seem to be the level and/or structure of tax
rate. If the latter is relatively low, the assessment level may be the
problem. Although the tax effort measure is comparable among all cities
in the sample, both of the decomposed ratios were comparable only among
cities using the same tax base (capital or annual value). Among the
cities with the rental value systems,.Hong Kong and Karachi would seem
to make the lowest tax effort -- Karachi because of a low ratio of assessed
value to income and Hong Kong because of both ratios are low. Among the
capital value cities, however, Kingston, Bogota, Jakarta and Seoul seem
to have lower level of property tax effort. Although the explanation for
the poor revenue performance differs among these cities, Kingston seems
to suffer from a problem of low assessment as is the case in Karachi.
The property values are assessed at a rate considerably
below true market value in virtually every city included in the above
study. The reasons for the underassessment vary widely. In some cases
it is due to a conscious underassessment of property, whereas in others
it is due to infrequent and outdated assessments. The latter seems to
be more of the reason for underassessment in Karachi and it calls for
the overall reassessment of property as a top prioritv of tax reform

- 42
Octroi
The most important local tax source in KMC is the Octroi, a
form of sales tax collected on imported goods for consumption, use or
sale within the city limits. It is levied on an ad valorem basis for
goods imported through sea and a specific duty on the weight of comodities
imported through road and rail routes. In both cases the rates are not high.
On the octroi schedule for goods imported by sea, 72 of the 99 items
listed are taxed at a rate of 0.5 percent to 1.5 percent. Sea dues are
levied as ad valorem tax on the CIF value of imported goods, which is
determined by customs authorities. Ad valorem tax is also levied at
the airport on commodities entering Karachi for local consumption. The
average octroi tax on goods imported through road and rail routes is
estimated at less than 1 percent of the value of commodities.
The tax is collected at 31 octroi stations -- 11 road, 17 rail,
1 air and 1 sea dues post. In 1977/78 gross receipts from the tax was
Rs 181.0 million of which nearly 80 percent was collected from goods
imported through sea routes (Table 17). Transit goods are supplied with
transit passes and taxed with octroi at the city of destination.
The growth in octroi collections over the past decade has ex-
ceeded that of all other locally raised taxes in KMC. Its annual rate
of growth of 19.8 percent exceeds tne annlual rate of price increase and
a real growth of about 2 percent per year. The arc income elasticity
of octroi tax is estimated at 0.78. The low elastici~:y is partly due to
specific duty levied per kg or ton of weight and to administrative inef-
ficiency in collection (smuggling, underassessment, corruption, etc.).
While sea dues being levied as ad valorem increase at the same rate as

- 43-
Table 17: OCTROI REVENUE RECEIPTS BY COLLECTION POSTS,
1973/74 - 1978/79
(in thousand Rupees)
Road Rail Air Sea Dues TotalPosts Posts Posts Posts
1973/74 20,269 5,227 1,561 61,-834 88,892
1974/75 21,532 5,025 2,834 91,062 120,454
1975/76 22,052 3,910 4,279 97,910 128,150
1976/77 25,915 3,250 5,867 118,768 153,802
1977/78 26,627 3,696 7,393 143,259 180,975
1978/79(Estimate) 30,500 5,050 9,100 175,000 219,650
Source: Data provided by KMC Octroi Taxation Department

4 4-
prices during inflation, the landside octroi remain constant per quanti-
ty of goods. Thus, it does not keep pace with inflationary trends and
greater loopholes are afforded to the collecting agencies by accepting
less weight of goods, especially at octroi posts where adequate weighing
facilities are not available. No equity exists for commodities taxed with sea
duty and the same commodities domestically produced and taxed with landslide
octroi. This means discrimination of imported commodities and revenue
loss. To restore equity and to generate larger revenues, it would be
necessary to levy ad valorem tax on the landside. However, considering
the difficulties envolved in establishing value of the goods entering
octroi limits from the landside, periodic change of the existing specific
duty rates should be considered as a more feasible alternative in the
short-run.
Notwithstanding its importance in local government revenue
source the octroi tax constitutes a hindrance to trade within the country.
For this reason it has been often suggested that the tax should be abo-
lished or replaced by other taxes (e.g., municipal sales tax). At pre-
sent, however, KMC is so heavily dependent on the octroi tax that it
should not be withdrawn without fully developing compensating sources
of revenue.

- 45 -
VI. Sunmary and Conclusions
The preceeding analysis of local government structure and
finance in Karachi reveals a number of problems. Two major causes of
these problems are inadequate amounts of public sector resources avail-
able to local governments and the fragmentation of local government
wqithin metropolitan area of Karachi. The resource bottleneck appears
to have resulted from the mismatch between expenditure responsibility
of local government and the share of total revenue sources allocated
to them. The result has been a large gap between the demand for "local"
services and the ability of local governments to finance these services
from self-raised revenues.
To provide the necessary services, this gap has been filled by
large amounts of loans especially in the case of KDA. Whereas rising
population and income have rapidly increased the demand for those ser-
vices for which local governments are responsible, the growth of local
revenues has not been stimulated in the same way and has continued to
lag far behind. Where the demand for services provided by local govern-
ments is more income elastic than the revenue sources utilized by local
governments, the result is increased reliance on external financing,
direct involvement of the provincial government in the provision of
these services, and/or simple deterioration of essential urban public
services. This appears to be what has happened in Karachi since the
early 1970's.
The persistent inability of local governments to finance
public services continues to raise the question as to the proper level

-46
of involvement of the provincial government in many activities (schools,
water supply, hospitals, streets, etc.) which have long been viewed as
a local government responsibility. Before one can make reciommendations
concerning the system of local finance in a country, it is essential to
understand the objectives which can realistically be achieved by using
local governments as the instrument. To the foregoing problem, the
following policy recommendations are suggested:
1. Local governments should be given the authority to plan
and carry out decisions with respect to those services for which local
governments are held responsible. Such services should include local
road and street lights construction amd maintenance, local inspection
and business service activities, parks and recreational facilities,
water and sewerage systems, land adjustment systems, housing, fire
protection and refuse collection.
2. Reveriue sources should be sufficient to ensure that
those services assigned to local governments can be provided by local
governments themselves. In addition to those revenue sources already
allocated to local governments, the list should include property tax
and motor vehicle tax as sources of local government revenue.
3. The provincial government should continue to specify
the revenue sources available to local governments. However, it would
be appropriate to allow a modicum of freedom in the setting of local
tax rates and fees and charges, and also greater freedom in borrowing.
4. There should also exist a set of responsibilities which
are recognized as jointly held by the local government and the provincial
government. With respect to these responsibilities, it would be appro-

- 47-
priate for the provincial government to continue a program of specific
purpose grants, as now exists for education. These responsibilities
should include primary education, water supply and hospital services.
The second problem, the fragmentation of local government in
metropolitan Karachi has res ted in fragmented approach to fiscal
planning and management. At present there is no consolidated local
government budget which shows the overall fiscal position of KMIC, KDA,
Contonment Boards, and other local authorities. In addition there is
no evidence of long-term fiscal planning by local governments in Karachi.
Revenues are not estimated for a period longer than one year, and there
exists no machinery or procedures for revenues forecasting. There is no
capital budget, and it appears that capital expenditures are made on a
year-to-year basis. The absence of a capital budget means that the acti-
vities and expansion of the local governments in Karachi has little con-
tinuity, tax reforms are ad hoc and not planned for, and in general there
is no translation of long term allocation and distribution goals into a
fiscal planning document.
The fragmentation of local government structure also resulted
in a totally inadequate long-term urban planning and lack of coordination
among local authorities and substantial intro-urban public service level
disparities. There are far too many government and/or civic authorities
having their own jurisdictions and controls within the metropolitan area.
Important plans are often not implemented according to sound planning
principles. Although some of the local authorities consult the KDA's
Master Plan Department (a regional planning agency) and are guided by
- 48
the planniaig principles, others especially those under the Federal
government do not consider it binding on themselves to consult the
Department.
Some of the cases where the local authorities have disregarded
planning principles are the establishment of the Pakistan Defense Service
Cooperative Housing Society whose plans are not subject to approval by
KDA, layouts of new Housing Societies, and construction activities
of the Contonment Boards. The existing relationship between KDA and
KIC with regard to urban water supply and its cost recovery system is
another example of the same dimension. As a result, the urban area has
grown in an ad hoc manners guided mainly by market forces and influenced
somewhat by inter-jurisdictional competition for the tax base. Efficient
organization of urban activities by such a process could only be by
accident. An additional element of the government fragmentation problem
is that it appears to give rise to wide disparities among local communities
in the level of public services.
In order to plan meaningfully and meet their responsibilities,
it is suggested that local governments must establish a body (Metropolitan
Coodinating Council) to coordinate and screen all joint projects which
require local participation. Under this plan, however, a coordination
council may have little or no direct expenditure or revenue powers. Thus
in order to create a strong area-wide financing unit, it might be desira-
ble to form a metropolitan area-wide government. This form of centralized
local government appears to hold greatest possibilities for reducing
problems arising from the fragmentation of local government in metropoli-
tan Karachi.

- 49 -
In recent years, there have been some changes in local govern-
ment structure and finance. The recent decrees issued by the Chief Martial
Law Administrator on real property tax, betterment tax and entertainment
tax will affect the future revenues of local governments in Karachi. The
new distribution formula of property tax revenue went into effect in
1978/79 and another one is scheduled for 1979/80. The changes in better-
ment and entertainment tax went into effect in 1977/78. In addition, the
recent merger of Landhi Korangi Municipal Committee (LKMC) with KMC has
improved the structure and finance of local government. Changes in the
local tax codes especially with the property tax will strengthen the over-
all financial resources of KMC and Contonment Boards. Despite these changes
tax revenues of local governments are expected to lag behind expenditures
in growth rate and there is some indication of important tax burden inequi-
ties. The reform is needed to raise more revenues, improve the elasticity
of the tax system, and to effect a more enuitabhle distribution of tax
burdens. The following recommendations center on how property tax reform
can contribute to these goals.
1. The general property tax, water tax, conservancy tax, and
fire tax should be consolidated as a means of simplifying the property tax
system and its administration. With an overall reassessment of property
(or rental) values and continued improvement in property tax administration,
the revenues from property-related taxes will greatly increase in the
future. Certainly improved use of existing property-related taxes should
accompany any other changes in the local revenue system. KMC continues to
- 50-
derive a bulk of its revenues from Octroi tax that cannot be commended
either on equity or efficiency grounds. However, without fully develop-
ing its alternative revenue soturces, Octroi should not be abolished.
2. The rate structure of the property tax should be re-examined
in light of slow growth of local government revenues and outcome of new
assessment of property (or rental) value suggested. If an adequate overall
reassessment is carried out under the current rate of property value in-
crease, it is possible to achieve a large revenue gain from the property-
related taxes together with a substantial reduction in the level of
existing statutory rates.

DOMESTIC FINANCE STUDIES
# 46. Innovations in Banking: The Syndicate's Experience. January 1978.
N.K. Thingalaya.
# 47. interest Rate. Transaction Costs and Financial Innovations. January 1978.V.V. Bhatt.
# 48. Decision Making in the Public Sector: A Case Study of Swaraj Tractor.* February 1978. V.V. Bhatt.
# 49. Portfolio Determinants of Commercial Bank Earnings in Selected Asian Countries.March 1978. Katrine Anderson Saito and Dan P. Villanueva.
# 50. Some Theory of the Financial Intermediation in Less Developed Countries.May 1978. Alan R. Roe.
# 51. Innovations in Banking: The Gujarat Experiments. August 1978. V.G. Patel.
# 52. Development. of the Japanese Bond Market. September 1978. Kazuko K. Artus.
$ 53. Transactions Costs of Credit to the Small-Scale Sector in the Philippines.
December 1978. K. Anderson Saito and D.P. Villanueva.
# 54. Ft4nancial Institutions and Technology Policy. January 1979. V.V. Bhatt.
2 55. Development Problem, Strategy and Technology Choice: Sarvodaya and Socialist
Approaches in India. January 1979. V.V. Bhatt.
2 56. Development Banks in the Financial System. June 1979. V.V. Bhatt.
0 57. The Violated Neutrality Assumption and Counterfactual Income or Where Do We
Put the Transfers? June 1979. Jacob Meerman.
# 58 Estimating Counterfactual Incomes in Studies of Budget Incidence. July 1979.J. Meerman and P. Shome.
0 59 Household Income or Household Income Per Capita: Is the Difference Important?October 1979. Gautam Datta and Jacob M4eerman.
2 60 An Analysis in Development Perspective of Bolivia's Largest Public Enterprises:COMIBOL, YPFB and ENAF. April 1980. J. Meerman.
0 61 Creating Capital Through Social Security Instructions: The Asian Experience(Singapore, the Philippines, Malaysia, India, and Sri Lanka). April 1980.
P. Shome and K.A. Saito.
t 62 Informal Credit Mar-ets in India. May 1980. T.A. Timberg and C.V. Aivar.
t 63 Innovations in Banking: The Indian Experience - Impact-on Deposits and Credit.
June 1980. C. Rangarajan.
t 64 The Philippine Experience with the Assertion of Citizenship Jurisdiction.November 1980. Richard Pomp.
1 65 Non-Interest Costs of Lending and Borrowing Agricultural Short-Term Credit.
November 1980. Thyra Riley.
# 66 Innovations in Banking: The Indian Experience - Cost and Profitability of
Commercial Banking. December 1980. Paul Mampilly.
1 67 Social Security and Savings Mobilization - A Case Study of Chile. January 1981.
Christine I. W4allich.