Urban Footprint Technical Summary - Pages - Home · These scenario “building blocks” represent...
34
URBAN FOOTPRINT Rev. 09 Jul 2012 Technical Summary Model Version 1.0
-
Upload
nguyenthuan -
Category
Documents
-
view
215 -
download
1
Transcript of Urban Footprint Technical Summary - Pages - Home · These scenario “building blocks” represent...

URBANFOOTPRINT
Rev. 09 Jul 2012
Technical Summary Model Version 1.0

Team CreditsU r b a n F o o t p r i n t Te chn i c a l S umma r y
2
UrbanFootprint was developed with funding and support from :
California High Speed Rail Authority
California Strategic Growth Council
Additional technical and data support was provided by :
Urban Land Use and Transportation Center
at the University of California at Davis
UrbanFootprint Development Team :
Model Developer:
Calthorpe Associates (www.calthorpe.com)
Transportation Model Development:
Fehr & Peers, Inc (www.fehrandpeers.com)
Public Health Model Development:
UrbanDesign4Health (urbandesign4health.com)
Programming Support:
Ragi Burhum (www.burhumllc.com) and Brian Hamlin

ContentsU r b a n F o o t p r i n t Te chn i c a l S umma r y
3
Introduction 4
UrbanFootprintModel Components 6
Open Source Tools 8
Base Data Loading 9
Place Types and Building Types 12
Existing Plan Translation 14
Base + Future Modeling 16
Scenario Painting and Editing 17
Scenario Analysis 18
Land Consumption Analysis 20
Fiscal Impact Analysis 21
Building Energy Analysis 22
Water Analysis 23
Transportation Analysis 26
Public Health Analysis 29
Endnotes and References 32

U r b a n F o o t p r i n t Te chn i c a l S umma r y
4
IntroductionThe UrbanFootprint model is a powerful land use planning, modeling, and data organization framework designed to facil-itate more informed planning by practitioners, public agencies, and other stakeholders. Built on fully open-source software platforms and tools, UrbanFootprint requires no proprietary software of any kind. Its development is led by Calthorpe Associates, a planning and urban design fi rm based in Berkeley, California.
UrbanFootprint comprises a suite of tools and analytical engines that vastly decrease the time and resources required to get up and running with scenario development, while signifi -cantly increasing the technical capacity of state, regional, and local users to analyze the fi scal, environmental, transportation, and public health impacts of plans and policies. Moreover, it provides a common data framework within which planning efforts at various scales can be integrated and synced.
Scenario-based planning with UrbanFootprint involves four stages: data organization, the translation of existing plans, scenario development, and scenario analysis. This guide describes how UrbanFootprint works through each of these stages to arrive at clearly defi ned scenarios and results.
The model currently includes analytical engines that produce results for the following metrics (with more to come as the model is advanced through deployment and research-based activities):
• Land consumption
• Vehicle miles traveled (VMT), travel mode, and fuel consumption
• Transportation greenhouse gas (GHG) and air pollutant emissions
• Building energy and water consumption, costs, and related GHG emissions
• Household costs for housing, transportation and utilities
• Public health impacts and costs (physical activity/weight-relayed, pollutant/respiratory-related, and pedestrian-safety)
• Local fi scal impacts (capital infrastructure and operations and maintenance costs, and tax/fee revenues)
UrbanFootprint is a comprehensive data and scenario planning ecosystem designed to break through the technical and fi nancial barriers that typically stand in the way of rigorous scenario development and analysis. Because it uses open-source software platforms and tools, the model can serve a broad community, and thrive via user participation in its deployment and ongoing advancement.

U r b a n F o o t p r i n t Te chn i c a l S umma r y
5
AnalysisScenarioDevelopment
DataDevelopmentandOrganization
ExistingPlanTranslation
ScenarioPainting /Editing
UrbanFootprint as an Ecosystem
The UrbanFootprint modeling framework functions as a data and scenario planning ecosystem. It includes data development and organization tools that streamline the creation, updating, and storage of detailed existing conditions data, existing city, regional, or other plans and policies, and future scenarios. It also includes novel translation tools that transform city, county, and regional plans into a common language of building and place types, and a web-based scenario painter that facili-tates scenario creation and editing. Finally, UrbanFootprint includes analytical engines that measure the fi scal, environ-mental, transportation, public health, and community impacts of future scenarios.
$$
BuildingEnergy Use
LandConsumption
HouseholdCosts
Greenhouse GasEmissions
BuildingWater Use
LocalFiscal Impacts
Public Health
Transportation
4
4
4444
444
11
88
66
1111
11
Base Data
Future Plan / Scenario Data

A complete library of place and building types is used to represent existing land use plans and
build new scenarios. These scenario “building blocks” represent the full range of existing and
future land development patterns, from mixed-use urban centers, to employment zones, to stan-
dard suburban residential areas. The default set of 35+ place types and 90+ building types can
be customized for specifi c model deployments.
Place Typeand
Building TypeLibrary
U r b a n F o o t p r i n t Te chn i c a l S umma r y
6
UrbanFootprintModel Components
library of placA complete l
cenarios. Thebuild new sc
development pfuture land d
an residential dard suburba
1
14
44
88
8
44
4
1
8
66
Base Data Loading
A dataset of existing conditions is required by the model’s scenario development tools and analytical engines. The model streamlines the development of this base environment dataset through scripts and processes that draw from diverse sources. Deploying the model in any jurisdiction or region within the United States requires only minor modifi cation; processes are also being developed to facilitate use of the model outside of the United States.
Existing Plan Translation
ScenarioPainting / Editing
The translation engine analyzes existing local and regional plans and integrates them into the model for subsequent analysis or modifi cation. “Translating” plans into the schema of UrbanFootprint Place Types facilitates the ongoing compilation or “stitching” of local plans and policies into a common regional or statewide fabric of land use and transportation plans.
The UrbanFootprint web-based painting tool facilitates scenario creation or editing. The current version of the model uses the 5.5-acre grid cell as the unit of painting and analysis; the model will be built to deploy at the parcel level as well the grid in the near future.

U r b a n F o o t p r i n t Te chn i c a l S umma r y
7
UrbanFootprint features a web-based, platform-neutral GUI
that operates in any web browser, on any operating system,
and on most hardware (desktop, laptop, or tablet computer).
The GUI can be used to control scenario setup, load Place
Types, paint scenarios, run primary scenario and analysis
engines, and report results. Scripts are used to perform other
model functions. In time, all primary model functions, includ-
ing public engagement functionality, will be integrated into
the web-based interface.
Graphical User Interface
(GUI)
Greenhouse Gas EmissionsTransportation (Liquid Fuel and Electricity) Emissions
Building Energy Emissions
Public HealthPhysical Activity/Weight Related Disease Incidence and Costs
Respiratory/Pollution-Related Disease Incidence and Costs
Pedestrian-Auto Collisions and Associated Costs
Household CostsTransportation (Driving and Related) Costs
Residential Energy and Water Costs
Land ConsumptionNew Land Consumed
Agricultural, Sensitive Lands Consumed
Local Fiscal ImpactsCapital Costs for Local Infrastructure
Operations and Maintenance Costs
Local Tax and Fee Revenues
TransportationVehicle Miles Traveled (VMT)
Travel Mode (walk/bike/auto/transit)
Congestion
Greenhouse Gas and Criteria Pollutant Emissions
Building Energy UseResidential Energy Use
Commercial Energy Use
Building-related CO2e Emissions
Building Water UseIndoor and Outdoor Water Use
Water-Related Electricity Use
Water-Related Electricity CO2e Emissions
AnalysisScenarios >
Analytical engines estimate travel impacts; greenhouse gas (GHG) and air pollutant emissions; building energy and water use; fi scal impacts (capital and operations and maintenance costs for local infrastructure); public
health impacts; and land consumption.

Open Source ToolsUrbanFootprint is built on a suite of open source software platforms and tools, and requires no proprietary software of any kind. Ubuntu Linux-based server or desktop hardware hosts major model databases and analytical engines, which are accessed or controlled via a ‘thin’ web browser client and other tools from any hardware or operating system (i.e. Windows, Mac OS, Linux, iOS, Android).
Major software components of UrbanFootprint v1.0 include:
DISTRIBUTED PROCESSING and QUEUING
Django, Celery, Redis. UrbanFootprint version 1.0 includes an advanced task
queue to manage processes running on servers and report status and results
back to the user interface for long running analysis.
OTHER PROGRAMMING LANGUAGES
PGSQL, Python, Apache, Django. SQLis used to write queries
to the Postgres database; PostgreSQL programming via pl-sql
and pl-R; Python is used to ‘wrap’ native SQL queries and
make them available to the rest of the model; Python, Apache
and Django are used for the GUI.
SPATIAL DATA VISUALIZATION
Geoserver serves geographic data layers to the user interface
via the web. Advanced users can access data in almost every
industry standard format in use today, with options for granular
security, custom data and performance enhancements.
GEOSPATIAL ANALYSIS
PostGIS 1.5 - PostGIS integrates with the PostgreSQL database
to provide maximum performance Geographic Information Sys-
tems (GIS) functionality within UrbanFootprint’s 64-bit multi-core,
multi-threaded computing environment.
SERVER OPERATING ENVIRONMENT
Ubuntu Linux 12.04 LTS was chosen for its stability, speed and
effi ciency, allowing UrbanFootprint to have true, scalable 64-bit
computing, including multi-threading capabilities.
DATABASE
PostgreSQL 9.1 – an industry standard, high
volume, high performance relational database.
DISPLAY / REPORTING
OpenLayers web maps, JQuery and Highcharts.
OpenLayers serves base data from multiple sources, such
as OpenStreetMap, Bing, or Google Maps; Highcharts
allows results to be displayed using a wide selection of
high-performance interactive charts and graphs.
CROSS-ENVIRONMENT DATA TRANSFER
ogr2ogr,part of GDAL, an evolving open-source toolset used to transfer
vector geodata in and out of UrbanFootprint’s PostgreSQL environment;
GDAL developers have published plug-in drivers for more than one hundred
industry standard vector data formats, notably including the ESRI GIS Geo-
database and ESRI Shapefi les.
U r b a n F o o t p r i n t Te chn i c a l S umma r y
8

Base Data LoadingU r b a n F o o t p r i n t Te chn i c a l S umma r y
9
CensuusPopulation aand Jddd JJJJobobobobs ss ChChChChCharararararrrrracacaccacacacacccteteteteteteteteteteteeriririririririririririririststststststststststststststicicicicicicicicicicicicicicssssssssssssss
ParcellslsHousing, JoJobs, as, and Land dddd UsUsUsUsUseseseseses
Land CCovererCCove
Urban, Greeeenfi eldfifielee d, and EEEEEEEEnvnvnvnvnvnvnvnvnvnvnnnnnvnvnvvvvvviririririrrirriirriririiriririrririririririrooononoooonooooononoooo mememmmmemm ntntntntntntnttttalaaalalalalallallala FFFFFFFFFFFFFFFFFFFFFFFFFFFFFeaeaeaeeaeaeaaaaeaeaeaeaaeaaaeaeaaaaeaeaeaeeaaeaaaaaeeaeaeaeaeaeeeattututtutttutttttttttttututttttttttttuttttttttttttututututututututututututututurerererererererererererererereeeereeeeereeeeeeereeeeeeereeeeeeeeeeeeeeeeereeeeeeeeeereressssssssssssssssssssssssssssssssssssssssssssssssssssssssssssssssssssssss
SPATIAL JOIN
SPATIAL JOIN BUFFER
Seamless coverage
with Parcel and
Land Cover data
Land CoverUrban, Constrained and
Greenfi eld Lands
Parcelswith uses and counts
controlled to TAZ totals
TAZPopulation, Housing,
and Jobs Counts
Parcelswith Land Uses
LOAD PARCELS with TAZ countsbased on Land Use Assumptions
UNION
TABLE CALCULATIONS
• Apply census data as rates
• Impute building square feet to variables
• Calculate the count of all variables by land type
Combined unit counts,
census characteristics,
land cover, and uses
Transit Proximity
and
Intersection Densities
BASEYEAR
LOADEDGRID
CensusPopulation, housing, and
jobs characteristics
TransitStations
and
Street Intersections
INTERSECT and convert results to CENTROIDS
SUMMARIZE
JOIN
Scenarios are built upon a base-year grid that describes the existing environment. This highly detailed “canvas” of data constitutes a baseline assessment of land use, demographic characteristics, and other conditions, providing the context for scenario painting and the foundation for analysis by the various model engines.
UrbanFootprint uses a series of scripts to normalize data of varying quality, type, and scale from a wide range of sources and import them into the model analysis grid. As described in the graphics below, the base loading process brings a range of data types together into the model’s 5.5 acre (150 meter x 150 meter) grid, including: land cover and environmental features data; parcel-based data on housing, employment, and population; Census population, housing, and jobs character-istics; control total data from MPOs or other agencies, generally at the traffi c analysis zone (TAZ) resolution; and roadway and transit data. The following pages describe the loading process for each of these data categories in more detail.
UrbanFootprint streamlines the development of the base data ‘canvas’ through scripts and
processes that draw from diverse data types and sources. Data from the categories above
are collected and processed via the general steps outlined in the fl ow chart.150 meter Grid
150 meter Grid
us
TranspportatiationIntersectionn Denensity and TTTraarararansnsnsnsnsnsnsnsnsnsnsititititit PPPPPrororororoxixixixixiiiiimimmimimmimim tytytytyty
pportat
150 meeter GGrid

Base Data LoadingU r b a n F o o t p r i n t Te chn i c a l S umma r y
10
The California Farmland Mapping and Monitoring Program (FMMP) dataset is used to
identify urban and greenfi eld lands, as well as specifi c categories of agricultural land.
Other sources, such as the California Protected Areas Database (CPAD) dataset, are used
to identify environmentally constrained land.
Parcel data is collected from state, regional, and local sources, including county assessor and commercial parcel databases. In this example, demographics and control totals are pro-
cessed from traffi c analysis zones (TAZs), attributed to appropriate land uses, and then distributed onto the landscape into parcels.
Parcel Data
Land Cover andEnvironmental Data
Assessor’s tax parcel data (cadastral data) is used as the fi nest grain of geographical resolution to which data is assigned in UrbanFootprint’s base data loading process. The existing land use attribute of each parcel is used as the basis for allocating dwelling units and employees, as well as assessing lot coverage for the purposes of energy use, water consumption, and other analyses.
UrbanFootprint classifi es the landscape into three broad land type categories: urban, greenfi eld or constrained. Urban land includes lands that have already been urbanized. Constrained land includes water and lands legally protected from devel-opment. Greenfi eld land includes all other non-urban devel-opable areas. In California, the primary dataset used to classify land as either urban or greenfi eld is the California Farmland Mapping and Monitoring Program (FMMP) dataset; greenfi eld data is further classifi ed by the sub-categories in the FMMP dataset. Constrained lands include protected areas defi ned by the California Protected Areas Database (CPAD) dataset, as well as water bodies as defi ned by a combination of: the California Spatial Information Library (CASIL) ‘Polygon Hydrologic Features’ dataset; the water features contained in the FMMP dataset; and the Tele-Atlas North America (TANA) ‘U.S. and Canada Water Polygons’ dataset.
CPAD
FMMP
U r b a n F o o t p r i n t Te chn i c a l S umma r y
11
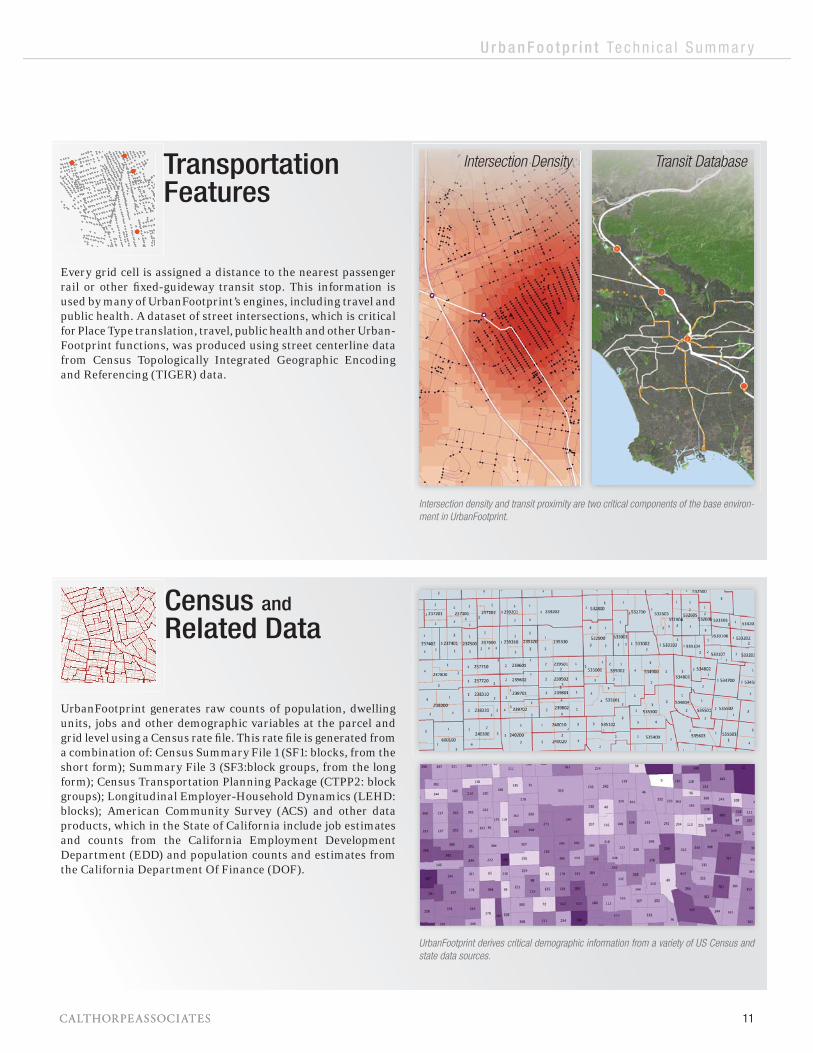
Intersection density and transit proximity are two critical components of the base environ-
ment in UrbanFootprint.
Census and Related Data
TransportationFeatures
UrbanFootprint generates raw counts of population, dwelling units, jobs and other demographic variables at the parcel and grid level using a Census rate fi le. This rate fi le is generated from a combination of: Census Summary File 1 (SF1: blocks, from the short form); Summary File 3 (SF3:block groups, from the long form); Census Transportation Planning Package (CTPP2: block groups); Longitudinal Employer-Household Dynamics (LEHD: blocks); American Community Survey (ACS) and other data products, which in the State of California include job estimates and counts from the California Employment Development Department (EDD) and population counts and estimates from the California Department Of Finance (DOF).
Every grid cell is assigned a distance to the nearest passenger rail or other fi xed-guideway transit stop. This information is used by many of UrbanFootprint’s engines, including travel and public health. A dataset of street intersections, which is critical for Place Type translation, travel, public health and other Urban-Footprint functions, was produced using street centerline data from Census Topologically Integrated Geographic Encoding and Referencing (TIGER) data.
UrbanFootprint derives critical demographic information from a variety of US Census and
state data sources.
Intersection Density Transit Database

Place Types and Building TypesU r b a n F o o t p r i n t Te chn i c a l S umma r y
12
UrbanFootprint includes a library of more than 35 Place Types and 50 building types that make up the palette of development options used to translate or “paint” scenarios. Place Types – each composed of a mix of Building Types (based on studies of over 300 real-world buildings) – are the land use building blocks of future scenarios, and represent the complete range of potential development types and patterns that make up a scenario. They include a range of mixed-use centers, residential areas of varying densities and types, employment and indus-trial areas, and other land use types that make up existing and future urban land uses.
Study Areas
UrbanFootprint’s Place and Building Types are calibrated based on studies of exemplary places across California and the US, as well as detailed studies of a complete range of building types across California and the West. The UrbanFootprint Place Type library can be utilized by cities, regions, or MPOs as they develop their own plans – either as an “off the shelf” library or customized for their specifi c needs.
UrbanFootprint’s Place Types represent a full range of existing and future land develop-
ment patterns, from mixed-use urban centers, to employment zones, to standard sub-
urban residential areas. The default set of 35+ Place Types and 90+ Building Types
includes detailed density, mix, demographic, and other characteristics
Building Type Studies
Place Type Studies
1
2
3
4
5
6
7
8
9
10
11
12
13
14
15
16
17
18
19
20
21
22
23
24
25
26
27
28
29
30
31
32
33
34
35
Mix
ed U
se C
ente
rs a
nd
Cor
ridor
s 1 Urban Mixed Use
2 Urban Residential
3 Urban Commercial
4 City Mixed Use
5 City Residential
6 City Commercial
7 Town Mixed Use
8 Town Residential
9 Town Commercial
10 Village Mixed Use
11 Village Residential
12 Village Commercial
13 Neighborhood Residential
14 Neighborhood Low
Emplo
ymen
t A
reas 15 Offi ce Focus
16 Mixed Offi ce and R&D
17 Offi ce / Industrial
18 Industrial Focus
19 Low-Density Employment Park
Suburb
anC
omm
erci
al /
Mix
ed U
se 20 High Intensity Activity Center
21 Mid Intensity Activity Center
22 Low Intensity Retail Centered Neighborhood
23 Retail: Strip Mall / Big Box
24 Industrial / Offi ce / Residential Mixed High
25 Industrial / Offi ce / Residential Mixed Low
Suburb
an R
esid
entia
l S
ingle
Use 26 Suburban Multifamily
27 Suburban Mixed Residential
28 Residential Subdivision
29 Large Lot Residential Area
Rura
l
30 Rural Residential
31 Rural Ranchettes
32 Rural Employment
Inst
itutio
nal 33 Campus / University
34 Institutional
35 Parks and Open Space

Uber Place Types
Meta Place Types ®
Place Types ® Urban MixedUse
UrbanResidential
UrbanCommercial
City Mixed Use City Residential City Commercial Town Mixed UseTown
ResidentialTown
CommercialVillage Mixed
UseVillage
ResidentialVillage
CommercialNeighborhoodResidential
NeighborhoodLow
Office FocuocusMixed Officeand R&D
Office/Industrial Industrialal FFocusLow DensityEmployment
Park
Buliding Types 1 2 3 4 5 6 7 8 9 10 11 12 13 14 15 16 17 18 19
Calibrated to Study Areas? Yes Yes Yes Yes Yes Yes Yes Yes Yes Yes Yes Yes Yes YesYes Yes Yes YeYes Yes Yes
BUILDING % CHECK 100.0% 100.0% 100.0% 100.0% 100.0% 100.0% 100.0% 100.0% 100.0% 100.00% 100.0% 100.0% 100.0% 100.0% 100.0% 100.0%% 100.0% 100.0% 100.0%MIXED USE 57.0% 15.0% 12.0% 44.0% 14.0% 5.0% 38.0% 12.5% 20.0% 20.0% 0.0% 10.0% 2.02.0%% 0.0% 0.0% 00.0% 0.0% 0.0% 0.0%0.0%
1 Skyscraper Mixed Use 7% 0% 1% 0% 0% 0% 0% 0% 0% 0% 0% 0% 0% 0% 0% 0% 0% 0% 0%2 High Rise Mixed Use 15% 2% 1% 0% 0% 0% 0% 0% 0% 0% 0% 0%% 0% 0% 0%% 0% 0% 0%% 0%3 Mid Rise Mixed Use 17% 3% 2% 10% 2% 1% 0% 0% 0% 0% 0% 00% 0% 0% 0% 0% 0% 00% 0%4 Low Rise Mixed Use 12% 3% 3% 9% 4% 1% 10% 0% 2% 0% 0% 0% 0% 0% 0% 0% 0% 0% 0%5 Parking Structure/Mixed Use 0% 2% 0%
6Main Street Commercial/MU High (3 5
Floors) 3% 5% 5%
7Main Street Commercial/MU Low (1 2
Floors) 3% 0% 0%RESIDENTIAL 23.0% 80.0% 0.0%
8 Skyscraper Residential 5% 12% 0%9 High Rise Residential 7% 15% 0%
10 Urban Mid Rise Residential 8% 34% 0%11 Urban PodiumMulti Family 3% 14% 0%12 Standard PodiumMulti Family 0% 5% 0%13 Suburban Multifamily Apt/Condo 0% 0% 0%14 Urban Townhome/Live Work 0% 0% 0%15 Standard Townhome 0% 0% 0%16 Garden Apartment 0% 0% 0%17 Very Small Lot 3000 0% 0% 0%18 Small Lot 4000 0% 0% 0%19 Medium Lot 5500 0% 0% 0%20 Large Lot 7500 0% 0% 0%21 Estate Lot 0% 0% 0%22 Rural Residential 0% 0% 0%23 Rural Ranchette 0% 0% 0%
COMMERCIAL/INDUSTRIAL 20.0% 5.0% 88.0%24 Skyscraper Office 0% 0% 8%25 High Rise Office 5% 0% 10%26 Mid Rise Office 0% 0% 13%%27 Low Rise Office 0% 0% 39%
28Main Street Commercial (Retail +
Office/Medical) 5% 0%% 8%29 Parking Structure+Ground Floor Retail 5% 0% 5%30 Parking Structure 0% 0% 0%31 Office Park High 0%% 0% 0%32 Office Park Low 0% 0% 0%33 Industrial High 0% 0% 0%34 Industrial Loww 0% 0% 0%0%35 Warehouse HigHigh 0% 0% 0%36 Warehohouse Low 0% 0% 0%37 Hotel High 5% 5%5% 5%38 Hotel Low 0% 0% 0%39 Regional Mall 0% 0% 0%40 Mediumdium Intensity Strip Commercial 0%0% 0% 0%
41Low Intentensity Strip Commercial (weighted
avg) 0% 0% 0%422 Rural Employmentent 0% 0% 0%%
INSTITUTIONAL (Itemized Civic) 5.0% 5.0% 1.01.0%43 Campuss/Co/College High 0% 0% 0%44 Campampus/College Low 0% 0%% 0%45 Hospital/CivCivicic/Other Institutional 1% 1% 1%46 Urban Elementary School 2.0% 2.0% 0.0%47 Non Urban Elementary School 0.0%% 0.0% 0.0%48 Urban Middle School 11.0% 1.0% 0.0%49 Non Urban Middle School 0.0% 0.0% 0.0%5050 Urban High School 1.0% 1.0% 0.0%51 Non Urban High Schochool 0.0% 0.0% 0.0%.0%
STREETS/PARKS/OTHER CIVIC 44.6% 44.6% 444.6%Streets 37% 37% 37%
Park 7.0% 7.0%7.0% 7.0%Detention/Utilities 1% 1% 1%
Total Civic 6% 6% 2%TOTAL 100%00% 100% 100%
City (Regional Center) Town (Subregional Center)Urban (Super Regional Center)Mixed Use Centers & Corridors Employment Areas
Village (Small Mixed Use LowCenter) Intensityg / y
0% 0%0% 0%5% 0% 0%
31% 5% 0%33% 20% 0%8% 5% 5%5%3% 15% 20%7% 12% 10%3% 5%
0%% 0% 0%0% 0% 0%
%
50% 15%5% 00%5% 0%0% 0%
% 0%0% 0%0% 0%0%0%0% 0%0%% 3% 5%
0% 0% 0%0
0%
%0
0%0%0%
00%
0% 0%% 0%%
0% 00%
%
%%%
03
0%0%0%
5
%%
%
0%0%0%0%
000
0%
0%0%
0%0%0%0%
%%%
000
0%
0%0%0%
0%0%0%
%%%
000
%0%0%0%
5% 7%0%
5% 1% 1% 5% 0% 3%% 0% 0% 0%0% 0% 0% 0% 0% 0% 0% 0%
15% 5% 1% 13% 0% 5% 5% 0% 0% 0%% 0% 0% 0% 0% 0% 0%
5% 2% 1% 10% 13% 10% 15% 0% 10% 2% 0% 0% 0% 0% 0% 0%%35.0% 81.0% 0.0% 35.0% 87.5% 0.0%.0% 60.0% 100.100.0% 0.0% 98.0% 100100.0% 0.0.0% 0.0%% 0.0% 0.0.0% 0% 0.0% 00.0%
0% 0% 0% 0%0% 0% 0% 0%% 0% 0% 0% 0% 0% 0% 0% 00%% 0%0% 0% 0% 0% 0% 0% 0% 0% 0% 0% 0% 0% 0% 0% 0% 0%
10% 20% 0% 0% 00% 0% 0% 00%% 0% 0% 0% 0% 0% 0% 0% 0%10% 26% 0% 10% 0% 0%0% 0% 0% 0% 0%0% 0% 0% 0%0% 0% 0% 0% 0% 0%5% 10% 0%% 5% 20% 0% 0%0% 0% 0%0% 0% 0% 0% 0% 0% 0% 0%0% 0% 0% 0%% 0% 0% 0% 0% 0% 0% 0% 0% 0% 0% 0% 0%
10% 20% 0% 220% 45%5% 0% 30% 555% 0% 0% 0% 0%0% 0% 0% 0% 0% 0%0% 5% 0% 0% 10% 00% 0% 0% 0% 0% 0% 0% 0%0% 0% 0% 0%0% 0% 0% 0% 13% 0% 0% 0% 00% 0% 0% 0% 0% 0%0% 0% 0%0% 0% 0% 0% 0% 0% 10% 35%35% 0% 68% 0% 0% 0% 0% 0%0% 0%0% 0%0% 0%0% 0%0% 0%0% 0%% 20% 10% 0% 25% 30% 0% 0%% 0% 0% 0%0%0% 0% 0% 0% 0% 0% 0%% 0% 0% 5% 220% 0% 0%0% 0% 0% 0%0% 0% 0% 0% 0% 0% 0% 0% 0% 0% 50% 0% 0% 00% 0% 0%0% 0% 0% 0% 0% 0% 0% 0% 0% 0%% 0% 0% 0% 0%% 0% 0%0% 0% 0%% 0%0% 0%0% 0%% 0% 0% 0% 00% 0% 0% 0% 0% 0%0% 0%0% 0%% 00% 0% 0% 0% 0% 0% 0% 0% 0% 0% 0% 0% 0% 0%
21.0%% 5.05.0% 995.0% 27.0% 0.0% 80.0% 20.0% 0.0% 90.0% 0.0% 0.0% 100.0% 100.0% 100.0% 100.0% 100.0%%0% 0% 0% 0% 0% 0% 0% 0% 0% 0% 0% 0% 0% 0% 0% 0%0% 0% 0% 0% 0%0% 0% 0% 0% 0% 0% 0% 0% 0% 0% 00% % 0%2% 0% 10%% 0%0% 0% 0% 0% 0%% 0% 0% 0% 0% 00% 0% 0% 0%3% 0%% 4422% 19% 0% 15% 0% 00% 0% 0% 0% 0% 0% 0% 0%0% 0%
5%% 0% 31% 5% 0% % 80% 0% 0% 0%0%33% 0% 5% 0% 0% 0% 0% 0% 0%3% 0% 0% 0%% 0% 0% 0% 0% 5% 0% 0% 0%0% 0%% 0%0% 0% 0% 0% 0% 0% 0% % 31% 5% 0% 0%0% 0%% 00% 0% 0% 0% 0% 0% % 33% 20% 0% 5%0%% 0%0% 0% 0% 0 0% 0% 0% 0%0%0% 0% 0% 0% 0 0% 0% 0% 20%00% 0% 0% 0% 0% 0% 0% 0% 0% 10 0%0% 0% 0% 0% 0% 0% 0% 0% 0% 5% 70%0%3% 3% 5%% 0% 0 0%2% 2% 22% 3%3% 0% 0% 0% 0% 0%0% 0%% 0% 0% 0% 0% 0% 0% 0% 0%0% 00% 0% 0% 0% 2% 0% 0% 20 % 0%
00% 0% 0% 0% 0% 0% 0% 2% 0% 00% 5% 7% 20% 5%0% 0% 0% 0% 0% 0% 00% 0% 0% 0% 0% 0% 0% 0% 0% 0%
5.0% 5.0% 1.0% 8.0% 8.0% 1.0% 8.0% 8.0% 2.0% 6.0% 6.0%% 5.0% 0.0% 0.0% 0.0% 0.0%0% 0% 0% 0% 0% 0% 0% 0% 0% 0% 0% 0% 0% 0% 0%% 00%0% 0% 0%% 0% 0% 0%0% 0% 0% 0% 0% 0% 0% 0% 0% 0% 0%0%1% 1% 1%% 1% 1% 1% 1% 1% 2% 1%% 1% 5% 0% 0% 0% 0%
2.0% 2.0%% 0.00% 4.0% 4.0% 0.0% 4.0% 4.0% 0.0% 2.02.0% 2.0% 0.0% 0.0% 0.0%% 0.0% 0.0%0.0% 0.0%0% 0.0.0% 0.0% 0.0%.0% 0.0% 0.0% 0.0% 0.0% 0.0% 0.0% 0.0% 0.0% 0.0.0% 0.0% 0.0%1.0% 1.0%0% 0.0.0% 2.0% 2.0% 0.0% 2.0% 2.0% 0.0% 2.0% 2.0% 0.0% 0.0% 0.0% 0.0% 0.0%0.0%% 0.0.0% 00.0% 0.0% 0.0% 0.0% 0.0% 0.0% 0.0.00% 0.0% 0.0% 0.0% 0.0% 0.0% 0.0% 0.0%1.0%0% 11.0% 0.0% 1.0%0% 1.0% 0.0% 1.0% 1.0% 0.0% 1.0% 1.0% 0.0% 0.00.0% 0.0% 0.0% 0.0%0.00% 0.0% 0.0% 0.0% 0.0% 0.0% 0.0% 0.0% 0.0% 0.0% 0.0% 0.0% 0.0% 0.0% 0.0% 0.0%44.4.0% 44.0% 44.0% 44.0% 35.6% 44.0% 43.0% 37.87.8% 52.0% 36.2% 36.2% 30.1% 30.1% 24.4% 25.5% 44.0%36% 36% 36% 36% 28% 36% 32% 27% 32% 25% 25% 221% 21% 17% 16% 35%7.0% 7.0% 7.0% 7.0% 7.0% 7.0% 10.0% 10.0% 15.0% 10.0% 10.0% 4.0% 4.0% 4.0% 4.0% 4.0%1% 1% 1% 1% 1% 1% 11% 1% 5% 1% 1% 5% 5% 3% 5% 5%6% 6% 2% 9% 9% 2% 9% 9% 7% 7% 77% 10% 5% 3% 5% 5%
100% 100% 100% 100% 100% 100% 100% 100% 100% 100% 100% 100% 100% 100% 100%0% 100%
0%0%
20%%
0%0%
0%0
1
0
%50%10%
0% 00%%
00%0%5%
%0% 80 %
U r b a n F o o t p r i n t Te chn i c a l S umma r y
13
Place TypePlace Types, and the buildings within them, are “loaded” with a unique set of assumptions that facilitate scenario modeling and testing at a variety of scales. Some assumptions are related to the individual buildings in a Place Type (i.e. commercial mid-rise, single family home, townhome), including:
• Building energy and water consumption
• Building-related greenhouse gas emissions
• Infrastructure cost/burden (including operations and maintenance costs)
• Household costs and tax burden for utilities
Other assumptions are related to each Place Type’s unique density, location, transportation network, demographic context, and combination of buildings. These assumptions combine to predict the travel behavior of a scenario’s residents and employees and are thus critical in measuring passenger vehicle miles traveled (VMT); roadway congestion; and trans-portation-related greenhouse gas emissions, air pollutant emissions, public health outcomes, and state, regional, local, and household cost burdens.
0%3%
5%0%
0%0%
0%0%0%
0%0%0%
0%0%
0% 0%%00%
0% 0%0%%05%
50%
0%0%%00% 80 %0%
000%0% 0%5% 0%5%
1
0%
0%
0%00000%
000
0%0%0%0%%%%%
%%%%%%
0%0%0%0%0%
%%
0%%%%
0%0%%
0%
0%00
0%0%0%%0%0%
0%0%0%00%
%3%8%3%%
0%0%%
0%0%0%00%%%%%%00%
00%% 11
%
%
0%000
%
%%%5%%
05
00
10%0%
%%%%
10%%%
0% 0%3%
000%3333 45%445%5%33% 45%33%12% 10%33% 45%45%5%%%33% 45%% 45%33%00%
333333333333%3%%%%%%%%%%%%%% 44545%45%4445%55%555%%%%%% %0%%0 0% 0%0%0%0%0%%% %%00000%0%0%0%0%0%%%
% 0%
50% 15%
%%
00
00%% %
0
0%%%
0%0%
1
00%
0%%
1
5% 0%
0% 0%00%
%
%
0%
%
05%0%05%
%
0%
%%%
%
0% 0
0% 0% % 20%5%
0% 0% 0
/ /arks / CivicParks / Civic5% 3% 0%5% 3% 0%k C cPaPaaPa0% 0%
0%Streetseetsets00retreeSStretr0%0%e teeeettretr%%e ttStreetse
Site Size
Block Size
Densities
Floor Area Ratio
Land Use
Population
Housing
Employment
Streets

Existing Plan TranslationUrbanFootprint includes tools that quickly translate any existing plan or scenario into the model’s common language of Place and Building types. The model can translate jurisdic-tional, county, regional, and other plans, no matter what tool or process was used to create them. Once an existing plan is translated into UrbanFootprint, additional editing or scenario painting can be performed, and analytical engines can be run. The translation tools also provide the capacity to maintain a common “quilt” of local land use and transport plans, and perform consistent, compatible analysis on individual plans or combinations thereof.
At the state and regional levels, UrbanFootprint can be used to integrate or stitch together Sustainable Community Strat-egies (SCSs), Regional Transportation Plans (RTPs) or similar regional scenarios, and general/local-scale plans as they are produced. This comprehensive plans database can be made available to local governments looking to coordinate their land-use assumptions with other localities and regions for SCS/regional planning and analysis.
U r b a n F o o t p r i n t Te chn i c a l S umma r y
14
UrbanFootprint analyzes city, county, regional, or other plans
based on their specifi c density, mix, street connectivity, and
use characteristics. It then translates each geographic area
(e.g., parcel, TAZ, or grid cell) of the input plan into one of the
UrbanFootprint place types.
Analyze KeyCharacteristics
UrbanFootprintScenario
Density / Mix / Connectivity
Translate
Existing Plans of Varying Scale or Input Type
Place Types
Scenarios
City County Region

U r b a n F o o t p r i n t Te chn i c a l S umma r y
15
San Joaquin Valley ‘UPlan’ Scenario
Sacramento Area Council of Governments ‘iPlaces’ Scenario
San Joaquin Valley UrbanFootprint Scenario
Sacramento Area UrbanFootprint Scenario
Translated Plans UrbanFootprint can translate local or regional plans or scenarios produced by other land use tools or “sketch models”, as well as those that were not cre-
ated using a specifi c tool or process.

U r b a n F o o t p r i n t Te chn i c a l S umma r y
16
Base + Future ModelingMany of the land use models in use today translate the existing environment into Place Types or similar theoretical building blocks, thus creating a virtual depiction of the present or base condition. The base environment is translated into the same language as that of the future. While this can be expedient, it can also lose valuable detail about the base environment, and limit the depth and research capacity of the models and resulting analysis.
The UrbanFootprint model is designed to overcome this limitation via processes that signifi cantly cut down on the time and effort required to build a detailed depiction of the physical, demographic, and other key characteristics of the base environment required by the model’s many analytical engines. The model includes tools that help methodically assess the intricate details of the existing urban (and non-urban) environment, and assign as much detail as possible to the
smallest level of geography. The resulting base data framework allows UrbanFootprint to analyze future scenarios as a mixture of places that have physically changed, and those that have not.
This depiction of the future as a combination of “change” and “no-change” areas is signifi cant, as physical changes in change areas can impact behavior in adjacent no-change areas. UrbanFootprint estimates travel and other impacts of these conditions (e.g., where infi ll or new development occurs around but not directly within a district or neighborhood, or where parcels receiving infi ll development are surrounded by parcels that remain the same as in the base year). It also allows for validation of the many analytical engines in the Urban-Footprint model, as model outputs can be compared to and calibrated against known qualities (using empirical data about existing conditions) and other model depictions of the existing/base environment.
Change
InputScenario Painting
TransportNetwork
PlaceTypes
AnalysisFutureScenario+ =
UrbanFootprint can analyze the Base / Existing Environment or a Future Scenario that combines the Base with Changes to land use and transportation networks.
Detailed depiction of the existing environ-
ments allows UrbanFootprint’s models to
be calibrated to known / empirical condi-
tions. At left a comparison of UrbanFoot-
print’s depiction of 2010 VMT per House-
hold compared to that of the Sacramento
Area Council of Government’s cutting-
edge SACSIM Travel Model.
SACOG SACSIM Model - VMT per HH UrbanFootprint - VMT per HH
( (BaseGrid
ExistingConditions

Scenario Painting and EditingU r b a n F o o t p r i n t Te chn i c a l S umma r y
17
Painting Tool
UrbanFootprint’s web-based painting tool is integrated into the model’s graphical user interface. It allows the user to edit or build upon a translated plan or scenario, or create new scenarios from scratch. The current version (1.0) of the model utilizes the 5.5-acre grid cell as the unit of painting and analysis. The model will soon be updated to work at parcel-level geography as well.
The web-based scenario painter can display and link to regularly updated base maps and data available on the web today (e.g., Google Maps, Mapquest, Bing), in addition to scenario- or
project-specifi c data or imagery. The scenario painter’s tools enable quick painting and editing of place types, and dynamic viewing of scenario results.
Place types are selected and applied to the landscape via a suite of selection
and viewing tools.
Scenario ResultsSelect scenario results can be viewed iteratively in order to inform the scenario
creation process.

U r b a n F o o t p r i n t Te chn i c a l S umma r y
18
Scenario Analysis
Scenario ‘Core’
ProcessesDevelopable Acres Analysis
Future Demographics EngineBase and Future Calculations
BaseGrid Change
InputScenario Painting
TransportNetwork
As described in the diagram below, UrbanFootprint’s scenario development and analytical engines produce a wide range of inter-related metrics that allow for robust, meaningful compar-isons of alternative land use + transportation scenarios. A series of scenario ‘core’ processes work to combine the existing physical and demographic environment with change or growth
input via existing plans and/or newly painted scenarios. These scenarios are then run through land use, transportation, fi scal impacts, public health, energy and water, household cost, and emissions engines that produce the range of metrics described below and detailed in the following pages.
PlaceTypes
FutureScenario
Vehicle PolicyOn-Road Fleet Mix and Effi ciency
Fuel PolicyVehicle Fuel Economy, Fuel Costs,
and Fuel Carbon Intensity
EnergyGeneration
PolicyFuels Mix and Carbon Intensity
• New Acres Consumed
by Type (Agriculture,
Habitat, etc.)
• Capital Infrastructure
• Operations and
Maintenance;
• Revenues
• Physical-Activity /
Weight-Related Diseases
and Costs
• Respiratory / Pollutant-
Related Diseases and
Costs
• Pedestrian-Auto
Collisions and Costs 8 ‘D’ Sketch Transport Model
• Vehicle Miles Traveled
(VMT)
• Mode Split (Transit,
Walk / Bike, Auto)
• Congestion
Land Consumption
Local Fiscal Impacts
Public Health
Transportation

U r b a n F o o t p r i n t Te chn i c a l S umma r y
19
EvapotranspirationZone
ClimateZone
BuildingEnergy and
Water Related Costs
CriteriaPollutant
Emissions
Vehicle Fuel Cost
Vehicle Fuel Consumption
BuildingPolicy
Rates applied to new buildings,
existing buildings,
and replacement buildings
EnergyGeneration
PolicyFuels Mix and Carbon Intensity
BuildingProgram
Jobsby building type
HousingUnits
by building type
• Indoor Water Use
• Outdoor Water Use
• Electricity Use
• Gas Use
• Buildings
• Transportation
• Gallons
• Kilowatt Hours
(PM2.5, SOx, NOx, CO, VOC)
• Housing
• Transportation
• Utilities
BuildingEnergy Use
GHG Emissions
Household Costs
$$
BuildingEnergy
and Water Consumption
BuildingWater Use

U r b a n F o o t p r i n t Te chn i c a l S umma r y
20
Agricultural Land
Consumed( acres )
Other Lands Consumed
by Type( acres )
EnvironmentallySensitive
Land Consumed( acres )
As a spatial model, UrbanFootprint produces fi ne-grained assessments of how land is developed. In the context of the model, “land consumption” refers to the measurement of land area needed to accommodate new growth. This includes ‘green-fi eld’ development on previously undeveloped land, as well as infi ll and redevelopment in existing urban areas.
Land consumption calculations for future scenarios are built upon an assessment of the base (existing) environment. The base data loading process assigns each grid cell descriptors of its land type conditions – including whether land is devel-opable, redevelopable, or constrained for environmental or other reasons (see page 12 for a more details about constraints in the base loading process). For a future scenario, UrbanFoot-print analyzes the greenfi eld land consumed to accommodate new residential and employment growth, as well as the growth that occurs via reuse or intensifi cation on previously urbanized land (refi ll development).
Given that the base environmental data includes suffi cient detail, UrbanFootprint will report the specifi c types of land that are consumed to accommodate growth, including types of agricultural lands, habitat lands, aquifers, or other land types. For the Vision California process, using UrbanFootprint version 1.0, the model uses California Farmland Mapping and Monitoring Program (FMMP) and California Protected Areas Database (CPAD) data loaded into the base grid to assess greenfi eld land consumption, including specifi c types of prime agricultural land. Additional base data components would allow the model to provide further detail on land consumption. Near term advancements to the model will include assigning cost and carbon implications to the portfolio of land consumption outputs.
Land Consumption Analysis
Previously Undeveloped
(Greenfi eld) Land
Previously
Urbanized Land
Growth accommodated on Greenfi eld
Land
Growth accommodated
on Infi ll / Redevelopment
Land

UrbanFootprint calculates three metrics that refl ect the fi scal impacts of new residential growth on local jurisdictions: capital infrastructure costs, operations and maintenance (O&M) costs, and revenues. Empirical data from local, regional, state, and utility sources are used to derive the cost and revenue factors, which vary by housing unit type, land development category, and land condition.
One-time capital costs for the following infrastructure ele-ments are included:
• Local streets and transportation
• Water supply
• Sewage and wastewater
• Local parks
Annual operations and maintenance (O&M) costs include the following categories of general fund expenditures:
• Public works functions
• General government services
• Public safety (police and fi re)
• Community services
Annual revenues are estimated from the following tax and fee types:
• Property taxes, property transfer taxes
• Vehicle license fees
The per-unit assumptions are applied as factors to counts of new housing units by type. Costs and revenues vary by land condition (greenfi eld or infi ll/redevelopment) and general land development category – a classifi cation that categorizes all place types as either urban, compact walkable, or standard suburban. The model’s current cost and revenue assumptions are derived from studies of exemplary places throughout California1, though assumptions can be localized for other study areas. Cost and revenue assumptions at a fi ner scale, generated through other processes or tools (such as the Sacramento Area Council of Governments’s iMPACS infrastructure cost model), can also be integrated. The cost and revenue assumptions are expressed in constant dollars, and are not assumed to change over time.
The current version of the model estimates the impacts of varia-tions in residential development unit types and patterns; future versions will incorporate the fi scal impacts due to commercial development variations, as well as other methods for calcu-lating fi scal impacts (i.e. the SACOG iMPACS model). The chart at right summarizes the process of calculating fi scal impacts.
U r b a n F o o t p r i n t Te chn i c a l S umma r y
21
Street curb
Street pavement
SewerSewerWater
Sidewalk
Cumulative Capital
andO&M Costs
Cumulative Revenues
Property Value and Tax
Data
ImpactFeeData
General Fund Expenditure
Data
Capital InfrastructureCosts per Unit
( one-time )
Revenuesper Unit( annual )
Operations and Maintenance (O&M)
Costs per Unit( annual )
TotalInfrastructure Cost
• Local streets and transportation
• Water supply• Sewage and waste-
water• Local parks
Annual O&M Costs
• Public works functions• General government
services• Public safety (police
and fi re)• Community services
Annual Revenues
• Property taxes, prop-erty transfer taxes
• Vehicle license fees Sewage and wastewater
• Local parks
Fiscal Impact Analysis
Natural Gas
Street Curb
Street pavement Stormwater
Electricity

U r b a n F o o t p r i n t Te chn i c a l S umma r y
22
ResidentialElectricity and Natural Gas
CommercialElectricity and Natural Gas
UrbanFootprint calculates residential and commercial building energy use, and their related costs and greenhouse gas (GHG) emissions, for both new and existing buildings. Scenarios ultimately vary in their building energy use profi les due to their building program, the location of where new growth occurs, and policy-based assumptions about improvements in energy effi ciency.
Calculating Energy Consumption
Residential energy use is calculated as a function of three factors: housing type, location by climate zone, and policy-based assumptions about building effi ciency. Base-year energy use for housing units varies by building type, with larger home types requiring more energy, and climate zone, which affects heating and cooling needs. Base-year residential energy use factors for California come from California Energy Commission (CEC) Residential Appliance Saturation Survey data2. Energy effi ciency policy assumptions lead to reductions in energy use in future years. These assumptions vary for new and existing buildings, with new buildings assumed to meet increasingly stringent standards, and existing buildings assumed to be retrofi tted or eventually replaced by new buildings. The fi gure at right summarizes the process of calculating energy use.
Similarly, commercial energy use is calculated using base-year rates and policy-based assumptions about future energy effi ciency. Commercial energy intensities (electricity and natural gas use per square foot) vary by building type and climate zone. In California, these rates come from CEC Commercial End-Use Survey data3. Effi ciency standards are different for new and existing units, with changes assumed to occur gradually over time as buildings age.
All calculations are based on data that resides at the grid-cell level – for instance, building square feet by commercial type. Thus, estimates can be made for user-defi ned geographies, such as a city within a region.
Calculating Energy Cost and Greenhouse Gas
Emissions
The costs and GHG emissions associated with residential and commercial building energy use are calculated by applying retail prices and emissions rates to electricity and natural gas use results. Base-year energy prices and emissions rates are derived from state-level data, while future-year prices and rates are dependent upon policy-based assumptions. If necessary, energy prices and emission rates can be localized to the regional, county, or even local scale.
ResidentialPer-Unit Electricity and Gas Use
Climate Zone
CommercialPer-Unit Electricity and Gas Use
Climate Zone
Policy-Based Effi ciency / Conservation FactorsApplied to new buildings, existing buildings,
and replacement buildings
HousingUnits
by building type
TotalEnergy Cost
and GHG Emissions
Total Energy Use
Jobsby building type
Commercial square feet
by type
Building Energy Analysis

U r b a n F o o t p r i n t Te chn i c a l S umma r y
23
UrbanFootprint calculates indoor and outdoor residential and commercial water use, and their related costs and greenhouse gas (GHG) emissions, for both new and existing buildings. Scenarios ultimately vary in their water use profi les due to their building program, as well as policy-based assumptions about conservation and improvements in effi ciency. Water use among scenarios varies most according to irrigation needs, or outdoor water use, which relates strongly to urban form and climate.
Calculating Water Consumption
Residential water use is calculated as a function of three basic sets of assumptions: base-year indoor water use per capita, which varies by building type; base-year outdoor water use per household, which varies by building type and location; and policy-based conservation/effi ciency assumptions that lead to reductions in water use in future years. Indoor water use factors refl ect statewide averages, while outdoor residential water use factors are estimated based on lot size and landscaped area assumptions, and subsequent irrigation needs as determined by evapotranspiration zone4, a locational designation related to climate. The water effi ciency policy assumptions vary for new and existing buildings, with new buildings assumed to meet increasingly stringent standards, and existing buildings assumed to be retrofi tted or eventually replaced by new buildings. The fi gure at right summarizes the process of calcu-lating water use.
Similarly, commercial water use is calculated using base-year rates and policy-based assumptions about future conservation and effi ciency policies. Indoor commercial water use is based on per-employee use assumptions, which vary by job category. Outdoor water use is based on landscaped area assumptions, which vary by building type, and irrigation needs as deter-mined by evapotranspiration zone. Effi ciency standards are different for new and existing units, with changes assumed to occur gradually over time as standards evolve.
All calculations are based on data that resides at the grid-cell level – for instance, jobs by type. Thus, estimates can be made for user-defi ned geographies, such as a city within a region.
Calculating Water-Related Costs, Electricity Use, and
Greenhouse Gas Emissions
The costs, electricity use, and GHG emissions associated with residential and commercial building water use are calculated by applying retail prices and energy intensities (expressed in kilowatt-hours per acre-foot of water) to water use results. Water-related electricity use refers to the energy required to transport, distribute, and treat water. Water-related GHG emissions are in turn calculated by applying electricity emission rates to the electricity use results. Base-year water prices and
energy intensities are derived from state-level data5,6, while future-year prices are dependent upon policy-based assump-tions. Energy intensities associated with delivering and treating water are not assumed to change over time. If necessary, water prices can be localized to the regional, county, or even local scale.
OutdoorResidential and Commercial Water Use
IndoorResidential and Commercial Water Use
IndoorGallons per capita
per day
IndoorGallons per employee
per day
Evapotranspiration Zone
Policy-Based Effi ciency / Conservation FactorsApplied to new buildings, existing buildings,
and replacement buildings
Residential irrigated
square feet
People per household,
by type
HousingUnits
by building type
TotalWater Cost
Total Water Use
Outdoor
Water Analysis
Jobsby building type
Commercial square feet
by type

U r b a n F o o t p r i n t Te chn i c a l S umma r y
24
Transportation Analysis
The diagrams below illustrate the relationship between land use and travel behavior. A more connected confi guration of streets, blocks, and land uses (right diagram) exhibits quantifi able
reductions in auto trip generation, lowering social costs related to traffi c congestion and air quality and increasing community livability, than a conventional suburban confi guration of
streets, blocks, and land uses (left diagram).
UrbanFootprint incorporates a comprehensive ”sketch” travel model that produces vehicle miles traveled (VMT), mode choice, and congestion estimates for land use + transportation scenarios, as well as transportation-related costs, greenhouse gas (GHG) emissions, and pollutant emissions. The travel forecasting capabilities within UrbanFootprint are based on a comprehensive body of research on the relationships between travel generation and the characteristics of the built environment7.
This and other research has found that urban form, transpor-tation supply, and management policies affect VMT, automobile, and transit travel through at least eight mechanisms, referred to as the “8 Ds”:
1. Density – residential and employment concentrations
2. Diversity – jobs/housing, jobs mix, retail/housing
3. Design – connectivity, walkability of local streets, and non-motorized circulation
4. Destination – accessibility to regional activities
5. Distance to Transit – proximity to high quality rail or bus service
6. Development Scale – critical mass and magnitude of compatible uses
7. Demographics – household size, income level, and auto ownership
8. Demand Management – pricing and travel disincentives
UrbanFootprint quantifi es these relationships to the fi rst seven “Ds” through a series of equations from the most recent and rigorous statistical study: Traffi c Generated by Mixed-Use Developments—Six-Region Study Using Consistent Built Environmental Measures, prepared for the United States Environmental Protection Agency and the American Society of Civil Engineers. The study developed hierarchical models that capture the relationships between the “D” factors and the amount of travel generated by over 230 mixed-use devel-opments in a wide variety of settings and sizes across the US, including developments in the Sacramento and San Diego regions. The predictive accuracy of the methods were validated through fi eld surveys of traffi c at almost 30 other development sites including locations in San Diego, Orange County, Sacra-mento, and the San Francisco Bay Area.
The MXD Method
The resulting method, known as the MXD method, uses a series of equations to estimate the likely degree to which a devel-opment area’s external traffi c generation will be reduced due to: a) trip internalization, b) walking, or c) transit use for off-site travel. The MXD method allows differentiation among a broad array of land use Place Types, the building blocks of UrbanFoot-print future scenarios, calculating the vehicle trip reductions resulting from the specifi c combination of “D” variables that characterize each Place Type. MXD transportation-demand

relationships allow the combination of intrinsic “D” variables for a specifi c Place Type, coupled with the extrinsic factors that describe a place’s location within the region, to dictate the degree to which the place generates more or less vehicle travel than the regional average.
The effects of the eighth “D” variable, Demand Management, are quantifi ed in UrbanFootprint using relationships reported in Guidelines for Quantifying the GHG Effects of Transpor-tation Mitigation, published by California Air Pollution Control Offi cers Association (CAPCOA). UrbanFootprint considers a set of demand management strategies relevant to regional planning and policy setting: pricing measures applied to automobile travel (through fuel charges, VMT charges, or roadway tolling), transit level of service improvements, parking policies, and employer trip reduction programs.
The use of “D” factors from the MXD and CAPCOA research allows UrbanFootprint to assess the amounts of travel and consequent energy consumption, GHG and pollutant emissions, and travel costs generated by land use types and scenarios for a variety of factors, such as:
• The effects of transit-oriented development
• Sensitivity to pricing schemes
• Impact of varying densities and use mixes
• Impacts of transit level of service and regional accessibility
U r b a n F o o t p r i n t Te chn i c a l S umma r y
25
ExtrinsicFactorsDistance to TransitDestinationsDemand Management
DemographicFactorsDemographics
IntrinsicFactorsDensityDiversityDesignDevelopment Scale
Base Yearand
Forecast Data
PlaceTypes
RegionalTravel Inputs
Trip Tables
Skim Matrices
Fleet Characteristics
VMT------
Trips by Mode------
Congestion
MXD ModelMode Choice
Trip Internalization
MXDMo
Trip
Modelhoice
alization
C
Per-Mile
Costs
Per-Mile
Emission Rates
Fuel Price
Fuel and Electricity
Emission Rates
VMT by Vehicle Type
Fuel Use------
Electricity Use
150 meter Grid
$
$$
Auto Ownership
and Maintenance
Costs
FuelCosts
Criteria Pollutant
Emissions
GHGEmissions

Transportation AnalysisU r b a n F o o t p r i n t Te chn i c a l S umma r y
26
Within UrbanFootprint, each Place Type is described in terms of the eight demand-side “D” variables, based on the combi-nation of the intrinsic characteristics of each Place Type and the location of the place within the regional context. Each geographic grid cell or place location is described in terms of its spatial relationship to all other locations within the study area, expressed in terms of travel time and cost by auto, transit, and non-motorized modes. As a result, every area described by a given Place Type and grid-cell location has vehicle, transit and non-motorized trips, and VMT associated with the Place Type’s density, diversity, design, destination accessibility, distance to transit, development scale, demographic, and demand management attributes.
Regional Travel Inputs
In addition to data contained within the Place Type and grid cell description of each region, UrbanFootprint exchanges, with each region’s offi cial travel demand model, data on trans-portation network characteristics, regional accessibility, and travel distances and times among regional activities. These data, obtained from each Metropolitan Planning Organization’s (MPO) transportation model, include baseline “trip tables,” or matrices of travel origins and destinations for the region’s baseline land use, as well as “skim matrices” that capture travel time, distance, and cost among travel origins and destinations for the MPOs’ existing or planned transportation infrastructure and services.
These data allow the “8D” MXD and CAPCOA methods contained in UrbanFootprint to assess key factors related to regional accessibility and to translate vehicle trips between locations in the region into travel distance and VMT and, in the case of initial deployment in the Vision California process, to do so consistently with the transportation system plans and modeling methods of California’s major MPOs: SACOG, MTC, SCAG, SANDAG, and the eight MPOs of the San Joaquin Valley.
UrbanFootprint also uses the MPO transportation networks to ascertain each region’s transportation network supply, including the number of existing and future lane miles of freeway, arterials and local streets. This information, coupled with UrbanFootprint estimates of regional VMT, is used to estimate average regional travel speeds for purposes of refi ning the estimate of greenhouse gas and other emissions per VMT. These calculations are based on traffi c data collected in over 100 regions across the US over the past 20 years by the Texas Transportation Institute (TTI) and the relationships between the TTI regional congestion indices and regional VMT per lane mile, as computed by the Oregon Department of Transportation for its GreenSTEP model.
Travel Model Validation
UrbanFootprint estimates of VMT, vehicle trips, and transit and non-motorized travel were validated, in the Vision California process, through a series of regional and local tests. The regional testing included comparing the UrbanFootprint travel estimates to those produced by the MPOs’ state-of-practice regional transportation models, which are themselves validated with respect to traffi c count data from Caltrans Highway Performance Monitoring System (H PMS), transit ridership data, and household travel surveys. These compar-isons were used to verify UrbanFootprint’s ability to replicate currently measured travel conditions in each region and to forecast change for future baseline scenarios in a manner consistent with the calibrated regional travel models developed under California Transportation Commission guidelines8.
Region
Base YearValidation Daily VMT
UrbanFootprint Modeled Base
Year Daily VMT
Sacramento Area (6 Counties, SACOG)
50,040,540 (Fehr & Peers, SACOG -
SACMET model, 2008 MTP)
53,632,530
San Francisco Bay Area (9 counties, ABAG/MTC)
143,681,890 (Fehr & Peers, MTC -
MTC model, 2009 RTP)
143,784,640
Southern California (6 Counties, SCAG)
378,105,370 (Fehr & Peers, SCAG -
SCAG model, 2008 RTP)
378,117,580
San Diego (SANDAG)80,584,670
(Fehr & Peers, SANDAG -
SANDAG model, 20011 RTP/SCS)
82,432,940
San Joaquin Valley (8 Counties)
114,532,890 (Fehr & Peers, UC Davis -
CSTDM 2009 Model)
111,197,210
Base-Year Vehicle Miles Traveled (VMT) Validation Chart
UrbanFootprint travel model validation included comparisons of base/existing environment
VMT to model outputs in the major regions of California. This chart shows base year daily
VMT as reported by the regions, and VMT as modeled by UrbanFootprint.
To assess UrbanFootprint’s ability to capture travel variations associated with regional, community, and local scale urban form, the 8D methods used in the model were validated in the following ways:
• Mapping of VMT Variations – SACOG produces maps of VMT generation for households in all neighborhoods throughout the greater Sacramento region from its sophisticated, validated activity-based travel model. This mapping of variability of VMT generation by neighborhood, or traffi c analysis zone, was compared with neighborhood VMT generation estimates produced by UrbanFootprint for the SACOG region.

• Community Types – Data developed by John Holtzclaw for his research on location-effi cient mortgages includes measures of annual VMT taken from California Department of Motor Vehicles odometer data on vehicles in households within different communities in the Los Angeles and San Francisco regions9. UrbanFootprint estimates of household VMT in the same communities or clusters of communities with similar built environment “D” variables were compared against these data.
• Place Types – UrbanFootprint estimates of VMT generation for each of its 35 Place Types were compared to household VMT reported in the National Household Travel Survey or most recent California Statewide Travel Survey for households located in settings comparable to each Place Type description. Recognizing that a given Place Type generates different amounts of VMT depending on its location in the region, a range of VMT generation was expressed for each type, representing the difference in generation rates for the Place Type when located in regionally centric versus remote suburban settings. The range of VMT rates from the household survey were compared with the range of rates estimated by UrbanFootprint.
In each of these tests, the variation in trip generation throughout the region estimated by UrbanFootprint as a function of the built environment, as represented by Place Types, compared well with the empirical travel data, demonstrating that the trans-portation model within UrbanFootprint produces reasonable sensitivity to fi ne-grained land use variations, in addition to matching well at an aggregate level with regional VMT.
Fuel Use, Emissions, and Costs
UrbanFootprint calculates transportation fuel use, green-house gas (GHG) and criteria pollutant emissions, and costs by applying policy-based assumptions to output VMT. Travel model outputs interact with preset or user-defi ned assumptions for vehicle effi ciency, fl eet mix, fuel mix, energy generation, and fuel and energy costs.
Fuel Use
Passenger vehicle fuel consumption estimates in UrbanFoot-print are a function of VMT and assumptions about the mix of vehicle types in the on-road vehicle fl eet (fl eet mix), the effi ciency of those vehicles, and the types of fuels they consume. Vehicle types include gas and diesel internal combustion engine (ICE) vehicles, battery electric vehicles (BEV), hybrid electric vehicles (HEV), plug-in hybrid electric vehicles (PHEV), and other zero-emission types (fuel cell, etc). VMT estimates from the travel modeling engine are assigned to the passenger vehicle fl eet by type, and effi ciency rates are applied to those types to generate liquid fuel and electricity use. Version 1.0 of the model accepts horizon-year effi ciency rates by vehicle type, which are created using the fl eet-mix model built into Calthorpe Associates’ RapidFire10 model. Near-term advancements to UrbanFootprint will integrate the fl eet mix model into Urban-Footprint’s user interface. Vehicle effi ciency is applied via a miles-per-gallon (mpg) estimate for the liquid fuels component of VMT, and miles per kilowatt hour (m/kWh) for the portion of VMT driven by electricity. This in turn produces liquid fuel (in gallons) and electricity consumption (in kilowatt hours) for a given scenario.
SF Bay Area (ABAG/MTC) Region VMT per Household Southern California (SCAG) Region VMT per Household
U r b a n F o o t p r i n t Te chn i c a l S umma r y
27
Lowest HighestLowest Highest

Transportation Analysis
Greenhouse Gas Emissions
Transportation GHG emissions are calculated by applying carbon intensity assumptions, expressed in pounds of carbon dioxide equivalent (CO2e) per gallon or per kilowatt hour, to fuel consumption. The carbon intensity of liquid fuel is a product of the fuel mix in a given model year, and can be adjusted by the user. The carbon intensity of electricity is derived from user-defi ned assumptions about the overall power generation mix (which also impacts electricity generated by buildings and other non-transport sectors).
UrbanFootprint was designed to calculate emissions that occur upon fuel combustion (“tank-to-wheel” emissions), as well as those emitted during the full fuel lifecycle, from extraction and processing to transport and storage (“well-to-wheel” emissions). Users can look to either or both; typically, emission inventories compare tank-to-wheel emissions, although full well-to-wheel assessments are critical to developing climate change mitigation strategies. UrbanFootprint has the capacity to calculate both types of emission rates based on fuel mix assumptions, enabling an analysis of the role of fuel carbon intensity standards in meeting GHG reduction goals.
Criteria Pollutant Emissions
Transportation criteria pollutant emissions include Nitrogen Oxides (NOx), Particulate Matter (PM2.5 and PM10), Sulfur Oxides (SOx), Carbon Monoxide (CO), and Reactive Organic Gases/Volatile Organic Chemicals (ROG/VOC). To calculate transportation criteria pollutant emissions, UrbanFootprint is loaded with default assumptions that are calculated using the California Air Resources Board’s latest Emissions Factors model (EMFAC 2011). EMFAC was run using default assumptions to determine regional-average criteria pollutant emissions for passenger vehicles (light-duty vehicles and motorcycles) for the years 2005, 2010, 2020, and 2035; 2035 rates (the last year for which EMFAC 2011 produces projections) were used for 2050. Emissions factors should be localized for different study areas.
Fuel and Other Driving Costs
UrbanFootprint estimates three components of transpor-tation costs, including fuel, auto ownership, and maintenance. These costs are calculated separately using different assump-tions. Fuel costs are calculated by multiplying fuel consumed by fuel price per gallon or per kilowatt hour. Auto ownership and maintenance costs are calculated by multiplying VMT by average price-per-mile factors. All per-gallon and per-mile prices change year upon year according to horizon-year projec-tions.
U r b a n F o o t p r i n t Te chn i c a l S umma r y
28
Fleet Characteristics
VMT------
Trips by Mode------
Congestion
MoMoModededelllMXMXMXDDD MMMMXMXMXDDDM dModModMMoMo
TriTrip Ip IntenteTriTripp
ModelMo elh ihoihoiceceh ihoihoicece
aalizlizatiationonalizlizatiati
D Mddd Ce Ce ChhhCC
teternarna
Per-Mile
Costs
Per-Mile
Emission Rates
Fuel Price
Fuel and Electricity
Emission Rates
VMT by Vehicle Type
Fuel Use------
Electricity Use
$
$$
Auto Ownership
and Maintenance
Costs
FuelCosts
Criteria Pollutant
Emissions
Greenhouse Gas
Emissions
U r b a n F o o t p r i n t Te chn i c a l S umma r y
29
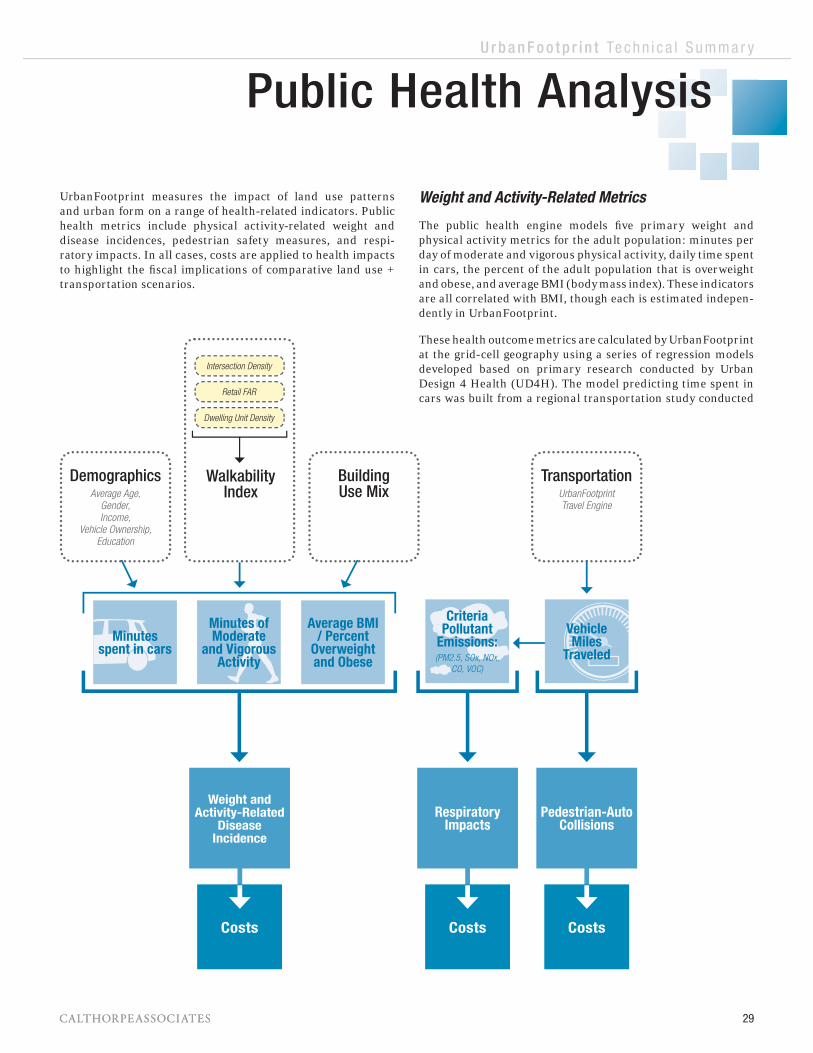
UrbanFootprint measures the impact of land use patterns and urban form on a range of health-related indicators. Public health metrics include physical activity-related weight and disease incidences, pedestrian safety measures, and respi-ratory impacts. In all cases, costs are applied to health impacts to highlight the fi scal implications of comparative land use + transportation scenarios.
DemographicsAverage Age,
Gender,
Income,
Vehicle Ownership,
Education
Building Use Mix
TransportationUrbanFootprint
Travel Engine
Costs Costs Costs
Pedestrian-Auto Collisions
Respiratory Impacts
Weight andActivity-Related
Disease Incidence
Retail FAR
Intersection Density
Dwelling Unit Density
WalkabilityIndex
Weight and Activity-Related Metrics
The public health engine models fi ve primary weight and physical activity metrics for the adult population: minutes per day of moderate and vigorous physical activity, daily time spent in cars, the percent of the adult population that is overweight and obese, and average BMI (body mass index). These indicators are all correlated with BMI, though each is estimated indepen-dently in UrbanFootprint.
These health outcome metrics are calculated by UrbanFootprint at the grid-cell geography using a series of regression models developed based on primary research conducted by Urban Design 4 Health (UD4H). The model predicting time spent in cars was built from a regional transportation study conducted
Public Health Analysis
Criteria Pollutant
Emissions:(PM2.5, SOx, NOx,
CO, VOC)
Minutesspent in cars
Minutes of Moderate
and Vigorous Activity
Average BMI / Percent
Overweight and Obese
VehicleMiles
Traveled

Public Health Analysis
Daily Minutes of Physical Activity Per Capita
U r b a n F o o t p r i n t Te chn i c a l S umma r y
30
as part of the Atlanta Regional Commission’s Household Travel Survey11, and the weight and physical activity models came out of the Neighborhood Quality of Life Study in Seattle and King County, Washington12. Where possible, data from California Health Interview Survey (CHIS)13 and the San Diego Council of Governments (SANDAG)14 was used to validate the use of the public health models in California.
Primary data inputs for these fi ve models include both measures of the built environment (intersection, retail fl oor area, and dwelling unit densities as well as building use mix) and demographics (gender, age, household income and auto ownership, and level of educational attainment). For public health modeling, future demographic variables were held constant with the base/existing conditions year data, calcu-lated using US Census 2010 rates; this has the effect of isolating the effect of land use on public health.
A series of intermediate variables are calculated at the grid-cell level to allow the weight and activity-related models to run, including:
• Walkability Index. Produces a walkability rating via calcula-tions of dwelling unit density, retail fl oor area ratio, and intersection density - all measured in a one-kilometer grid-cell buffer.
• Building Use Mix. Measures the distribution of residential, retail, offi ce, and service sector building square feet within a one-kilometer grid-cell buffer.
• Dwelling Unit Density. A measure of housing density within a one-kilometer grid-cell buffer.
• Network-Based Street Intersection Count and Density. An estimate of network-based street connectivity within a one kilometer grid-cell buffer.
• Household Income Categories Ranking Mean. A weighted count of households in various income groups in each grid cell.
• Educational Attainment Categories Ranking Mean. A weighted count of population by educational attainment in each grid cell.
A series of coeffi cients, unique to each model, was applied to these intermediate variables as a part of a regression analysis to estimate fi nal metrics.
As overweight and obesity rates are associated with numerous co-morbid health conditions, these weight metrics formed the basis for a series of post-process models predicting the adult incidence of type II diabetes, hypertension, coronary artery disease, osteoarthritis, chronic back pain, and colorectal and kidney cancer. Coeffi cients for these models were adapted from
a range of published studies and validated and calibrated using CHIS data.
Relationships derived from published studies were used to calculate three classes of per capita fi scal impacts of estimated weight and activity-based health conditions. These costs are expressed in constant dollars, and include:
1. Medical costs: direct capital expenses related to a medical condition, such as doctor and hospital visits, prescription medicine, emergency services, etc.
2. Productivity costs: indirect costs related to lost or reduced work productivity as a result of a medical condition.
3. Quality-adjusted life years (QALYs) lost: an estimate of the economic value of a reduction in quality-of-life years lost as a result of a medical condition.
All public health models produce predictions that enable comparison not only across the range of future scenarios, but between base year and future states.
Pedestrian Safety
UrbanFootprint’s estimates of pedestrian-vehicle collisions are informed by data that associates per capita vehicle miles traveled (VMT) and pedestrian-auto collisions15. This data demonstrates a strong relationship between changes in per capita VMT and changes in per capita collisions.
UrbanFootprint measures physical activity levels based on the urban form and
demographic characteristics of scenarios.
Lowest Minutes
Highest

U r b a n F o o t p r i n t Te chn i c a l S umma r y
31
UrbanFootprint’s public health engine produces future scenario-wide estimates of pedestrian-auto collisions based on a predicted collision rate. A per capita collision rate is calcu-lated by multiplying change in daily per capita VMT over time, as estimated by the UrbanFootprint travel engine, by the 2009 per capita California pedestrian-vehicle collision rate, as documented by California Highway Patrol data16. A scenario’s collision incidence is calculated by multiplying this rate by future population.
As with weight and activity-related conditions, cost factors for medical costs, productivity costs, and QUALYs lost are applied to pedestrian-vehicle collisions to produce estimates of the fi scal impacts of a scenario’s pedestrian-vehicle collisions estimates.
Respiratory Impacts
UrbanFootprint calculates the public health impacts of automobile transportation-related air pollution. The number of health incidences, and their related costs, are calculated on the basis of criteria air pollutant emissions (measured in tons). Note that these metrics express differences among scenarios, rather than measurements of total health incidences or costs.
UrbanFootprint’s respiratory health assumptions were initially developed by TIAX LLC for the American Lung Association. Health incidence and valuation assumptions are based on research and national data from the EPA, Offi ce of Air Quality Planning & Standards, Air Benefi t and Cost Group17, 18. Version 1.0 of the model includes system-wide respiratory impacts. That is, it examines the respiratory impacts and costs associated with changes in overall VMT and pollutant emissions. Model advancements will allow for additional measurements of geographically-specifi c emissions and their associated health impacts.
Respiratory health incidences include cases of: premature mortality; chronic bronchitis; acute myocardial infarction; respiratory and cardiovascular hospitalizations; respi-ratory-related ER visits; acute bronchitis; work loss days; asthma exacerbation; and acute, lower, and upper respiratory symptoms. Per-ton assumptions for each of these incidences are individually applied to emissions of the following criteria pollutants: PM2.5, SOx, NOx, and VOC. The incidences are then totaled.
Respiratory health costs are based on per-ton valuations of emissions of the following pollutants: PM2.5, SOx, NOx, CO, VOC, and indirect PM from NOx, SOx, and VOC. As for health incidences, these valuations are applied to emissions of individual pollutants, and then totaled.
Weight-Related Disease Rates
UrbanFootprint measures weight-related disease rates based on the urban form
and demographic characteristics of scenarios.
Lowest Disease Rates
Highest

1. Berkeley-based fi rm Strategic Economics gathered data from rep-resentative cities throughout California to develop a statewide fi s-cal impacts assumptions set. Regional assumptions were also de-veloped for the Southern California Association of Governments (SCAG) region.
2. California Energy Commission. California Statewide Residential Appliance Saturation Survey (RASS). Sacramento: CEC. 2010.
3. California Energy Commission. California Commercial End-Use Survey (CEUS). Sacramento: CEC. 2006.
4. California Irrigation Management Information System. Reference Evapotranspiration (map). 1999.
5. Water price data from Public Policy Institute of California (PPIC) calculations using data from Black & Veatch and U.S. Census. California Water Plan Update. Department of Water Resources. 2005.
6. Water energy intensities from California Energy Commission. California’s Water-Energy Relationship. Sacramento: CEC. 2005.
7. References include:
• Ewing and Cervero. Travel and the Built Environment. 2010.
• Ewing and Walters, et al. Traffi c Generated by Mixed-Use Developments—Six-Region Study. 2011.
• 2010 California Regional Transportation Plan Guidelines.California Transportation Commission. 2010.
• Caltrans, DKS. Assessment of Local Models and Tools for Analyzing Smart-Growth Strategies. 2007.
• Ewing and Walters; et. al. Growing Cooler – The Evidence on Urban Development and Climate Change. 2008.
• California Air Pollution Control Offi cers Association. Guidelines for Quantifying the GHG Effects of Transportation Mitigation. 2010.
8. Vehicle miles traveled (VMT) for both the regional transportation models and UrbanFootprint were calculated using the “origin-des-tination” method as recommended by the California Air Resource Board’s Regional Targets Advisory Committee. VMT attributable to land uses within a region were calculated as the VMT resulting from all trips traveling between origins and destinations within the region, and 50% of the VMT generated by trips with one end in the region and the other end outside the region. VMT due to trips traveling through the region without a stop in the region were not included.
9. Holtzclaw, J. VMT Analysis based on DMV Odometer Readings (data only). 1998.
10. For more information about the RapidFire model, see www.calt-horpe.com/scenario_modeling_tools.
11. Frank, L. D., Sallis, J. F., Conway, T. L., Chapman, J. E., Saelens, B. E., & Bachman, W. Many Pathways From Land Use to Health: Associations Between Neighborhood Walkability and Active Transportation, Body Mass Index, and Air Quality. Journal of the American Planning Association, 72(1), 75–87. 2006.
12. Ibid.
13. California Health Interview Survey. CHIS 2009 Adult Public Use File, Los Angeles, CA: UCLA Center for Health Policy Research. Available: www.chis.ucla.edu/ (accessed June 21, 2012).
14. Urban Design 4 Health, Inc. Unpublished data used for Health Impact and Forecasting Assessment, Project No. 5001527 for The San Diego Association of Governments. June, 2012.
15. Ferreira J, Minikel E. Pay-as-you-drive Auto Insurance in Massachusetts: A Risk Assessment and Report on Consumer, Industry, and Environmental Benefi ts, Conservation Law Foundation Report. November 2010.
16. California Highway Patrol. 2009 Annual Report of Fatal and Injury Motor Vehicle Traffi c Collisions. Available: www.chp.ca.gov/switrs/switrs2009.html (accessed July 11, 2011).
17. Cases-per-ton estimates from Neal Fann of US Environmental Protection Agency (EPA). Premature mortality is the average of the American Cancer Society study (Pope et al. 2002) and the Six-Cities study (Laden et al., 2006). The rounded Six-Cities benefi ts per ton results are presented in the EPA’s Environmental Benefi ts Mapping and Analysis Program website: www.epa.gov/oaqps001/benmap/bpt.html. As presented by Chan, M. and Jackson, MD (TIAX LLC) for the American Lung Association in California. Health Impact of Land Use VMT and In-Use Vehicle Fleets. 2011.
18. PM-related valuations (Neal Fann of EPA) used average of American Cancer Society study (Pope, CA III et al. Cardiovascular mortality and long-term exposure to particulate air pollution: epi-demiological evidence of general pathophysiological pathways of disease. Circulation 109(1):71–77. 2002) and the Six Cities Study (Laden, F. et al., Reduction in Fine Particulate Air Pollution and Mortality: Extended Follow-up of the Harvard Six Cities Study. 2006). Ozone and visibility valuations calculated based upon na-tional results presented in a 2011 EPA report (EPA. “The Benefi ts and Costs of the Clean Air Act from 1990 to 2020”. 2011). As pre-sented by Chan, M. and Jackson, MD (TIAX LLC) for the American Lung Association in California. Health Impact of Land Use VMT and In-Use Vehicle Fleets. 2011.
Endnotes and ReferencesU r b a n F o o t p r i n t Te chn i c a l S umma r y
32

U r b a n F o o t p r i n t Te chn i c a l S umma r y
33