URBAN ENERGY INSTITUTE ir. Herman van der Bent 10-03-2021
13
URBAN ENERGY INSTITUTE ir. Herman van der Bent 10-03-2021 Towards energy efficiency in Dutch social housing Insights from Energy Performance at the housing stock level
Transcript of URBAN ENERGY INSTITUTE ir. Herman van der Bent 10-03-2021

URBAN ENERGY INSTITUTEir. Herman van der Bent10-03-2021
Towards energy efficiency in Dutch social housingInsights from Energy Performance at the housing stock level

Content
• Dutch social housing associations
• Sustainability policies towards 2020
• Current renovation strategies
• Discrepancy theoretical and actual energy savings
• Modelling actual energy savings
• Sustainability policies beyond 2020
IEBB THEMA 2: DATAGEDREVEN OPTIMALISATIE VAN RENOVATIECONCEPTEN

Dutch social housing associations
IEBB THEMA 2: DATAGEDREVEN OPTIMALISATIE VAN RENOVATIECONCEPTEN
Country Share socialhousing
Netherlands 30 %Denmark 21 %
Norway 20 %Sweden 19 %France 17 %… ….Poland 8 %
Italy 4 %Spain 3 %
Croatia 2 %Greece 0 %*The state of housing 2019, Housing Europe
• Own 30% of the Dutch housing stock
• Highest percentage in Europe
• Organized in 296 housing associations
• Small (<100 dwellings) to large (>77.000 dwellings)
• Have own decision power
• But governed by strong central law
• Both in maximum rent and tenant allocation
• Play an important role in Dutch strategy to enhance a sustainable build environment
• Umbrella organization: Aedes –> sponsor project
Rent social
Rent private
Owner-occupied
Distribution Dutch housing stock
0
20000
40000
60000
80000
100000
Distribution size ofhousing associations

Sustainable development Dutch social housing associations towards 2020
• Main driver: Improvement of energy labels
• Energy Performance of Building Directive• Dutch legislation 2010-2015: NEN 5128
• Dutch legislation 2015-2020: NEN 7120
• Dutch legislation 2021+ : NTA 8800
• Energy label = Energy Index (EI) = Calculation of a theoretical energy consumption of a dwelling given its building characteristics, divided by a building specific budget.
• Range Energy label from A++ to G
• Climate agreement 2013 → Housing associations have an average energy label B (EI 1.40) in 2020
• Monitoring system AEDES/TU DELFT• SHAERE → annual EI + building characteristics of 2.0+ million dwellings
• Research period 2017-2020
IEBB THEMA 2: DATAGEDREVEN OPTIMALISATIE VAN RENOVATIECONCEPTEN
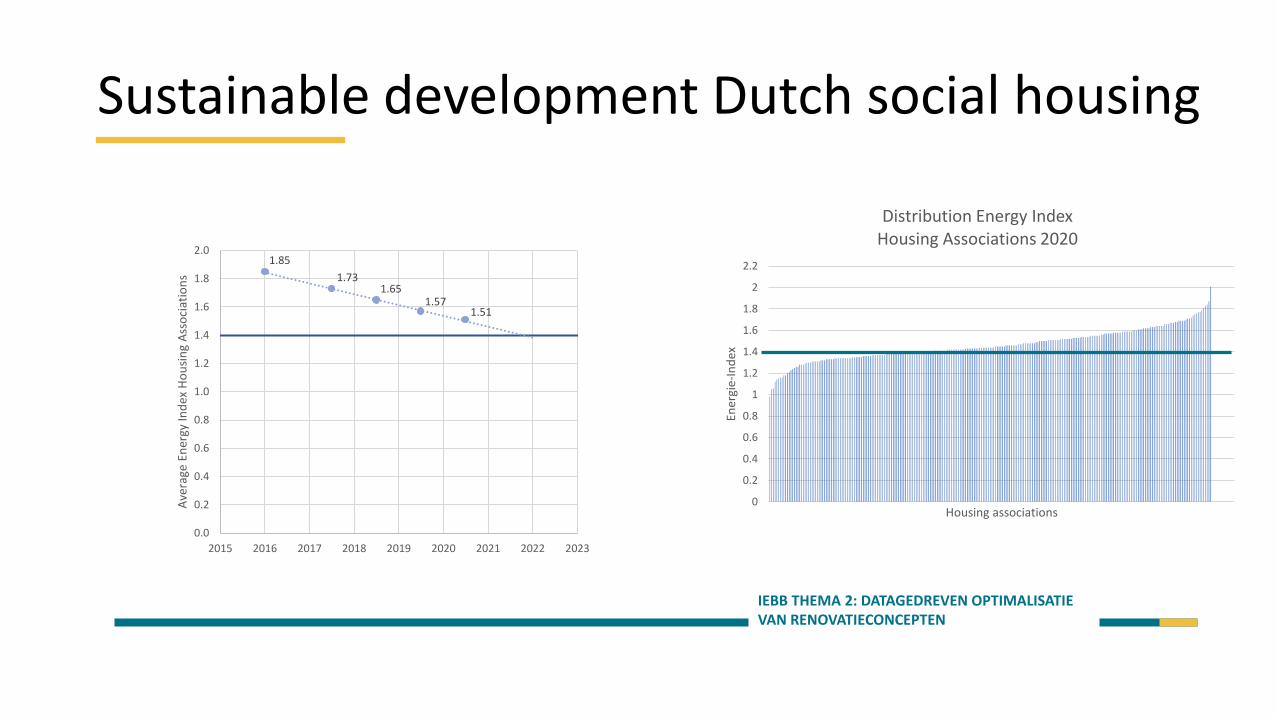
Sustainable development Dutch social housing
IEBB THEMA 2: DATAGEDREVEN OPTIMALISATIE VAN RENOVATIECONCEPTEN
1.85
1.731.65
1.571.51
0.0
0.2
0.4
0.6
0.8
1.0
1.2
1.4
1.6
1.8
2.0
2015 2016 2017 2018 2019 2020 2021 2022 2023
Ave
rage
Ener
gy In
dex
Ho
usi
ng
Ass
oci
atio
ns
0
0.2
0.4
0.6
0.8
1
1.2
1.4
1.6
1.8
2
2.2
Ener
gie-
Ind
ex
Housing associations
Distribution Energy Index Housing Associations 2020

2017-2020 dominant renovation strategies
IEBB THEMA 2: DATAGEDREVEN OPTIMALISATIE VAN RENOVATIECONCEPTEN
Insulation roof Rc=2+
Insulation floor Rc=2+
Insulation envelope Rc=2+
Windows HR+/HR++/tripple
Ventilation systems mechanical in and out
Ventilation systems mechanical out
Solar panels
Heat pump
External heating
High efficiency boiler (HR107)
Number of dwellings
Measures 2017 -> 2018 -> 2019->2020
2017->2018
2018->2019
2019->2020
0
0.05
0.1
0.15
0.2
0.25
Ch
ange
in E
ner
gy In
dex

Discrepancies theoretical vs actual savings
IEBB THEMA 2: DATAGEDREVEN OPTIMALISATIE VAN RENOVATIECONCEPTEN
• Prebound effect and rebound effect

Modelling actual consumption
IEBB THEMA 2: DATAGEDREVEN OPTIMALISATIE VAN RENOVATIECONCEPTEN
• SHAERE database 2.0+ million dwellings + building characteristics
• Actual energy consumption from Central Bureau of Statistics (anonymized at address level)
• Three different modelling techniques: linear regression, non-linear regression, machine learning (GBM).
• GOAL: model average actual energy consumption by building characteristics. A change in building characteristic is a renovation.
• Challenges:• A large set of different building characteristics (60 parameters) = different renovation measures
• We need to deal with occupant behavior = Natural spread in actual energy consumption → large set to average mean consumption
• The different modelling techniques have pros and cons
• We need to be aware of conceptual flaws in underlying data. Challenge to validate.

Preliminary results sector
IEBB THEMA 2: DATAGEDREVEN OPTIMALISATIE VAN RENOVATIECONCEPTEN

Preliminary results – case study 23 renovations
IEBB THEMA 2: DATAGEDREVEN OPTIMALISATIE VAN RENOVATIECONCEPTEN

Conclusions modelling actual consumption
IEBB THEMA 2: DATAGEDREVEN OPTIMALISATIE VAN RENOVATIECONCEPTEN
• All three examined empirical models give more realistic predictions on a sector level.
• However, detailed predictions for all different kinds of renovations give a higher range of uncertainty.
• Especially, for dwellings with future prove systems which are less dominant in the dataset.
• Secondly, some conceptual flaws need to be resolved.
• Preliminary conclusion, the linear model is too simplistic, the non-linear and GBM model are most promising.
• More research is needed.

Sustainability policies beyond 2020
IEBB THEMA 2: DATAGEDREVEN OPTIMALISATIE VAN RENOVATIECONCEPTEN
• Climate agreement 2019 and beyond – Housing associations• Less focus on energy label (but still present)
• Not a new goal formulated in energy label
• Change in method, energy index becomes primary fossil energy consumption per m2
• Still obliged to have an energy label per dwelling. Counts in the WWS.
• More focus on actual CO2 reduction.• 49% reduction of CO2, by total Dutch build environment
• Introduction of neighborhood approach• Choice of source of heat per neighborhood.
• Municipality in the lead. Housing associations follow/adopt.
• Introduction of Insulation standard (“Standaard & Streefwaarden”)• Trias energetica -> first lower demand
• Improve the insulation of dwellings significantly towards 2050.
• What we want to add: Support tool for housing associations to predict actual effects of renovations• Predict effects on actual energy savings / decrease of CO2 emissions / decrease of actual energy costs

Questions?
IEBB THEMA 2: DATAGEDREVEN OPTIMALISATIE VAN RENOVATIECONCEPTEN