
URBAN AGE CONFERENCE GOVERNING URBAN FUTURES · “I regard the growth of cities as an evil thing,...
19
URBAN AGE CONFERENCE GOVERNING URBAN FUTURES
Transcript of URBAN AGE CONFERENCE GOVERNING URBAN FUTURES · “I regard the growth of cities as an evil thing,...

URBAN AGE CONFERENCE
GOVERNING URBAN FUTURES

“I regard the growth of cities as an evil thing, unfortunate for mankind and the world. ”

0.2
.4.6
.81
Sh
are
Urb
aniz
ed
$0-1000 $1000-2000 $2000-3000 $3000-4000 $4000-5000
Source: World Bank
Share of Countries over 1/3 Urbanized, by GDP per Capita (2012 $)1960 and 2010
1960 2010

67
89
10
11
0 .2 .4 .6 .8 1% Urbanization, 2010
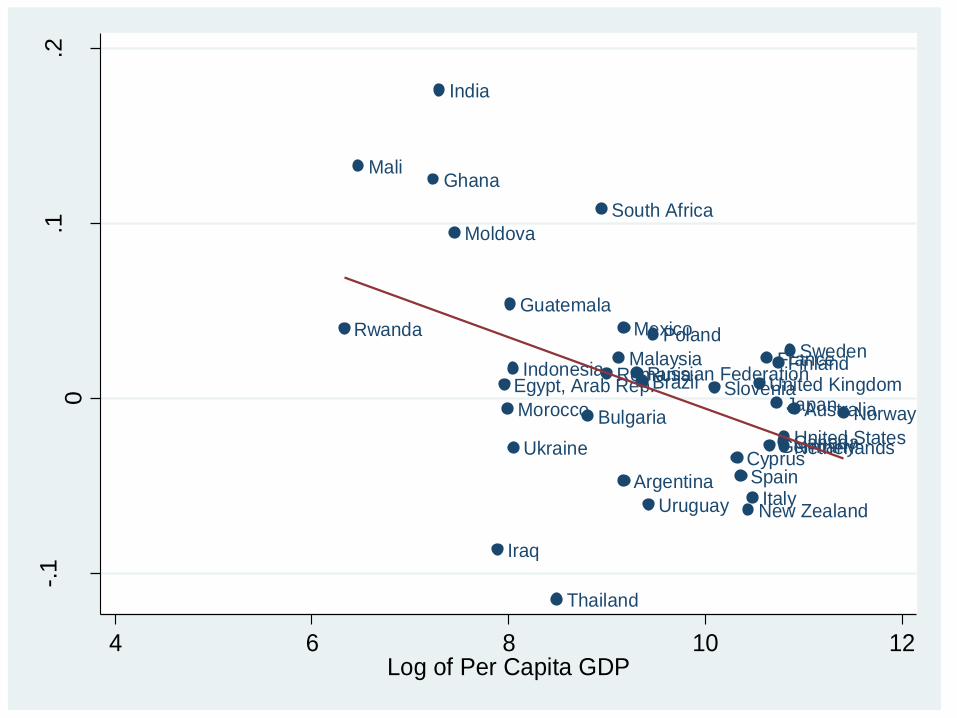
Log of P.C. GDP 2010 PPP Fitted values
Rwanda
MaliGhana
India
Moldova
Iraq
Egypt, Arab Rep.
Morocco
Guatemala
Indonesia
Ukraine
Thailand
Bulgaria
South Africa
RomaniaMalaysia
Argentina
Mexico
Russian FederationBrazil
Uruguay
Poland
Slovenia
CyprusSpain
New ZealandItaly
United Kingdom
France
Germany
Japan
Finland
CanadaUnited StatesNetherlands
Sweden
AustraliaNorway
-.1
0.1
.2
Urb
an
-Ru
ral H
ap
pin
ess
4 6 8 10 12Log of Per Capita GDP


Government Effectiveness and Urbanization
Congo, Dem. Rep.
Burundi
Liberia
Niger
Malawi Mozambique
Sierra Leone
Central African RepublicAfghanistan
UgandaTanzania
Rwanda
Togo
Nepal
Gambia, The
Zimbabwe
Mali
Haiti
Bangladesh
BeninKenya
Cambodia
TajikistanKyrgyz Republic
Lesotho
Pakistan
Senegal
MauritaniaCameroon
Lao PDRCote d'Ivoire
Vietnam
Zambia
Yemen, Rep.
Ghana
Papua New Guinea
India
Nicaragua
Sudan
Moldova BoliviaHonduras
Philippines
Mongolia
Sri Lanka
Iraq
Egypt, Arab Rep.Morocco
Paraguay
GuatemalaSyrian Arab Republic
Indonesia
Congo, Rep.
Ukraine
GuyanaArmeniaEl Salvador
Tonga
SwazilandFiji
Albania
Ecuador
Belize
TunisiaJordan
China
Algeria
ThailandNamibiaJamaica
Dominican Republic
Serbia
Peru
ColombiaBulgaria
Maldives
South AfricaBotswana
Mauritius
Panama
Romania
Costa Rica
Malaysia
Gabon
KazakhstanArgentina
MexicoTurkey
Russian Federation
Latvia
Brazil
Lithuania UruguayPoland
Chile
HungaryCroatia
Venezuela, RB
Estonia
Barbados
Trinidad and Tobago
Slovak Republic
Saudi Arabia
Bahrain
Czech RepublicMaltaKorea, Rep.
PortugalSlovenia
Greece
Israel
Cyprus
SpainBrunei Darussalam
Hong Kong SAR, ChinaNew Zealand
Italy
United KingdomFranceIceland
United Arab Emirates
Germany
Singapore
Belgium
Japan
Finland
Austria
Kuwait
Ireland
Canada
United States
Netherlands
Sweden
Australia
Macao SAR, China
Denmark
Switzerland
Qatar
NorwayLuxembourg
Libya
Iran, Islamic Rep.
Cuba
Myanmar
-2-1
01
2
Go
vern
men
t E
ffectiven
ess
0 .2 .4 .6 .8 1Urbanization Share

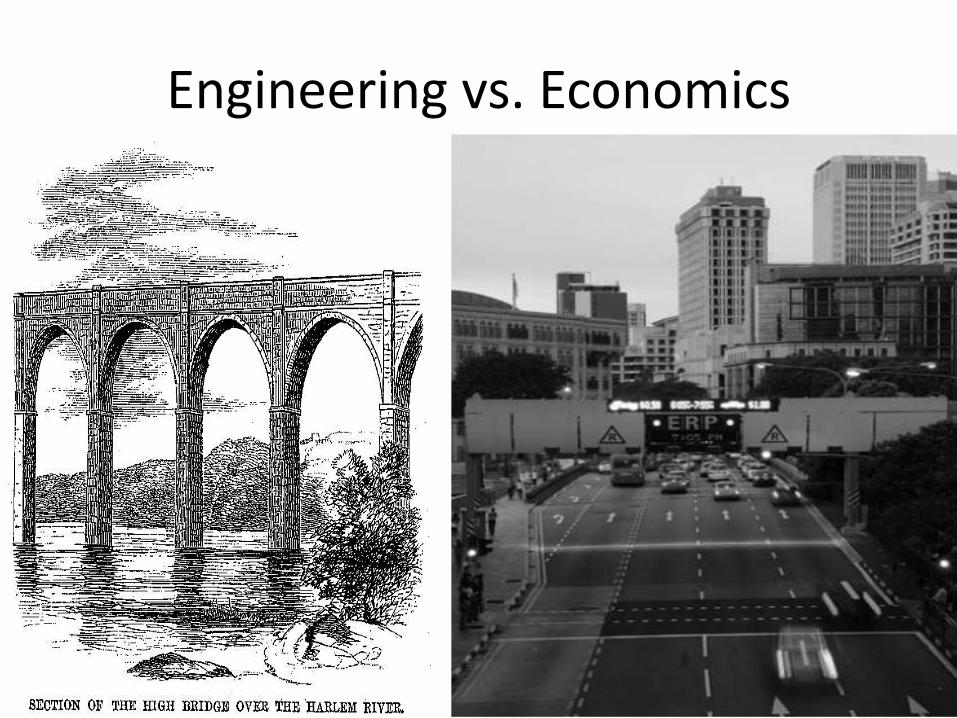
Engineering vs. Economics

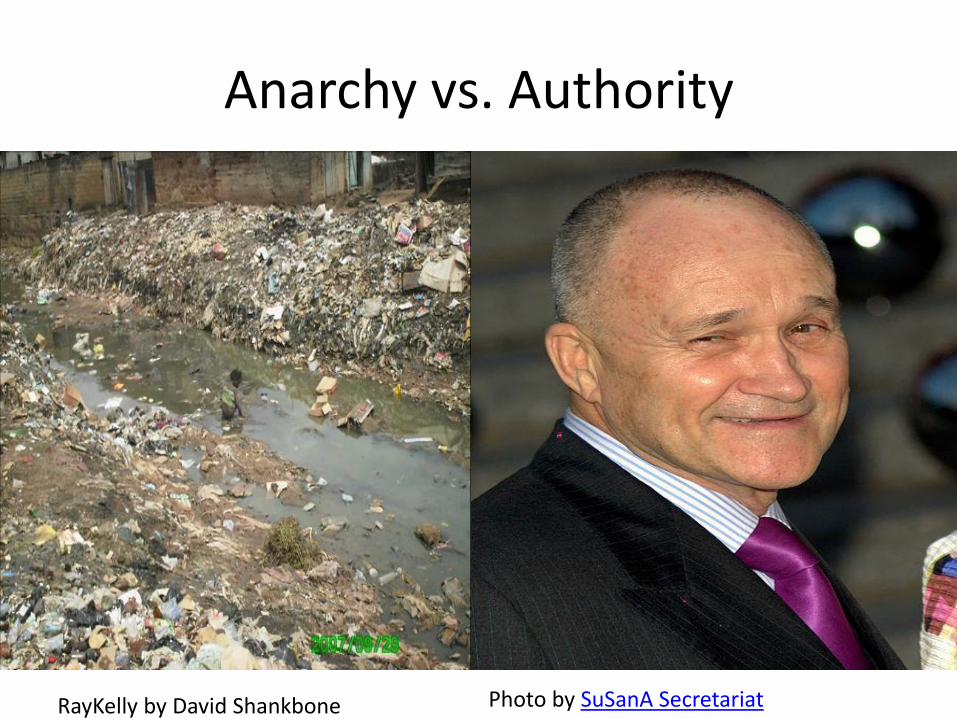
Anarchy vs. Authority
Photo by SuSanA Secretariat RayKelly by David Shankbone

The Brazil Model: The Dentist and the Supermarket
Supermarket by Wonderlane

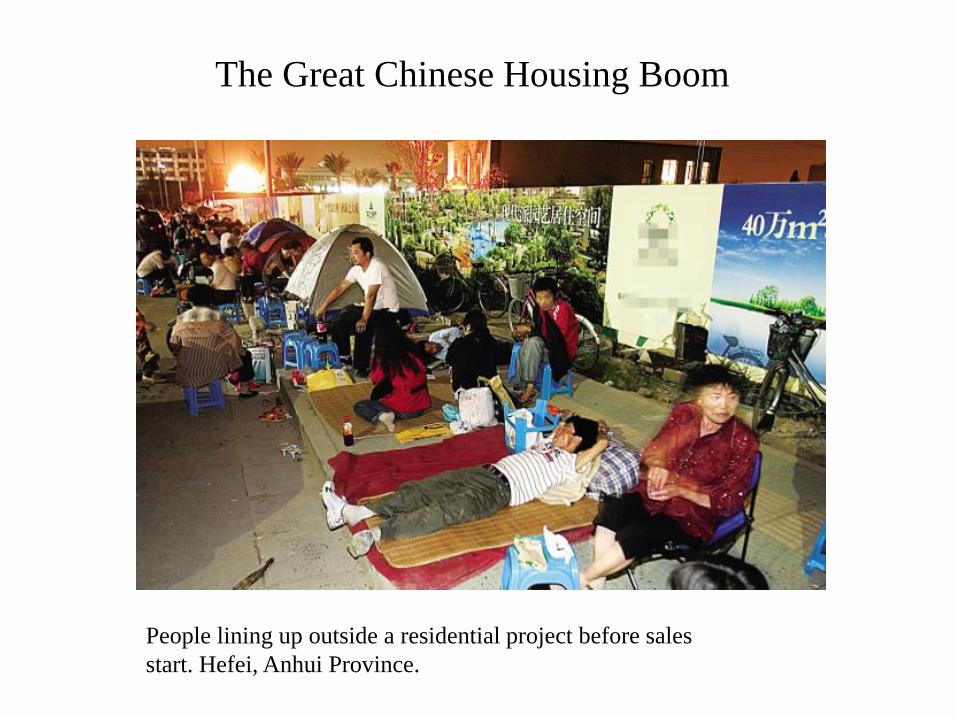
The Great Chinese Housing Boom
People lining up outside a residential project before sales
start. Hefei, Anhui Province.

China’s Great Boom:
Prices are way higher than physical costs of construction
Beijing
Changchun
ChangshaChengdu
Chongqing
Guangzhou
GuiyangHaikou
Hangzhou
Hefei
Hohhot
JinanKunming
Lanzhou
Nanchang
Nanjing
Nanning
Shanghai
Shenyang
ShijiazhuangTianjinUrumqi
Wuhan
XiAn
XiningYinchuan
Zhengzhou
24
68
10
Pri
ce/C
ost
of C
onst
ruct
ion
5000 10000 15000 20000Price (RMB/m2)
Image by QuarterCircleS