Uranium migration history in the igneous and metamorphic rocks of
12
IOSR Journal of Applied Geology and Geophysics (IOSR-JAGG) e-ISSN: 2321–0990, p-ISSN: 2321–0982.Volume 1, Issue 5 (Nov. – Dec. 2013), PP 09-20 www.iosrjournals.org www.iosrjournals.org 9 | Page Uranium migration history in the igneous and metamorphic rocks of Solaf-Umm Takha area, based on multi-variate statistical analysis and favorability indices, central south Sinai, Egypt. Tamer E. Attia 1&2 and El-Arabi H. Shendi 3 1 Geology Department, Faculty of science, Port Said University, Port Said, Egypt 2 Earth Science Department, Faculty of Science, Benghazi University, Benghazi, Libya 3 Geology Department, Faculty of science, Suez Canal University, Ismailia, Egypt Abstract: The present study deals with the application of three different analytical techniques on the recorded ground gamma ray spectrometric measurements in order to detect the radioelements content specially Uranium in Solaf-Umm Takha area, south Sinai, Egypt. These techniques include Uranium migration (in and out), Uranium favorability index and multi-variate statistical analysis including first and second principal component and factor scores. The obtained results have indicated that Umm Takha granite and the quartzo – feldspathic gneiss as well as the El-Sheikh granite are Uranium source rocks with low favorability indices. However the application of favorability index technique has proved to be an effective tool in igneous and metamorphic environments to indicate Uranium depletion from source rocks. The integration of original uranium content, uranium migration rate and Uranium favorability index indicated that Uranium migrated from the eastern and southern parts and has been ultimately accumulated in the western and northern parts of the study area. Topographically, uranium has been migrated from the high relief mountainous region to the drainage divide of Solaf-Umm Takha valleys. Therefore, uranium migration history proves its validity in distinction between syngentically-mineralized source rocks and secondary enriched rocks in the investigated area. Keywords : factor scores, favorability indices, Sinai, spectrometry and uranium migration. I. INTRODUCTION The investigation of the aero-radiometric map of southwestern Sinai (Fig.1) [1] has suggested a promising area for further detailed ground gamma ray spectrometric studies. This area, known as Solaf-Umm Takha area, is bounded by longitudes 33˚ 41΄ 14˝ and 33˚ 44΄ 10˝ E and latitudes 28˚36΄ 39˝ and 28˚38΄35˝ N, and is about 17.325 Km 2 in area (Fig.2). The gamma-ray spectrometric method is a powerful tool in geological mapping. It is possible, when using this method, to determine the individual concentrations of the three naturally-occurring radioelements in the ground. The method depends upon the fact that the absolute and relative concentrations of the radioelements (K, U, and Th) vary measurably and significantly with lithology [2]. In this study, three different analytical techniques have been applied on the measured ground gamma ray spectrometric data in an attempt to locate the different distributions of radioelements. These techniques are the uranium migration, the multi-variate statistical analysis and favorability indices. The favorability indices have been applied in order to trace the migration history of uranium in the study area. II. Geological And Structural Outline The first description of Feiran-Solaf metamorphic complex geology was done in the west Sinai gneisses extended as a strip 200 Km long and 8 Km wide and considered the gneisses of Wadi Feiran to be fragments of much older continental crust. Further, he concluded that the granitic masses induced metamorphic
Transcript of Uranium migration history in the igneous and metamorphic rocks of

IOSR Journal of Applied Geology and Geophysics (IOSR-JAGG)
e-ISSN: 2321–0990, p-ISSN: 2321–0982.Volume 1, Issue 5 (Nov. – Dec. 2013), PP 09-20 www.iosrjournals.org
www.iosrjournals.org 9 | Page
Uranium migration history in the igneous and metamorphic rocks
of Solaf-Umm Takha area, based on multi-variate statistical
analysis and favorability indices, central south Sinai, Egypt.
Tamer E. Attia1&2
and El-Arabi H. Shendi3
1Geology Department, Faculty of science, Port Said University, Port Said, Egypt
2Earth Science Department, Faculty of Science, Benghazi University, Benghazi, Libya 3Geology Department, Faculty of science, Suez Canal University, Ismailia, Egypt
Abstract: The present study deals with the application of three different analytical techniques on the recorded
ground gamma ray spectrometric measurements in order to detect the radioelements content specially Uranium
in Solaf-Umm Takha area, south Sinai, Egypt. These techniques include Uranium migration (in and out),
Uranium favorability index and multi-variate statistical analysis including first and second principal component
and factor scores. The obtained results have indicated that Umm Takha granite and the quartzo – feldspathic
gneiss as well as the El-Sheikh granite are Uranium source rocks with low favorability indices. However the application of favorability index technique has proved to be an effective tool in igneous and metamorphic
environments to indicate Uranium depletion from source rocks. The integration of original uranium content,
uranium migration rate and Uranium favorability index indicated that Uranium migrated from the eastern and
southern parts and has been ultimately accumulated in the western and northern parts of the study area.
Topographically, uranium has been migrated from the high relief mountainous region to the drainage divide of
Solaf-Umm Takha valleys. Therefore, uranium migration history proves its validity in distinction between
syngentically-mineralized source rocks and secondary enriched rocks in the investigated area.
Keywords : factor scores, favorability indices, Sinai, spectrometry and uranium migration.
I. INTRODUCTION The investigation of the aero-radiometric map of southwestern Sinai (Fig.1) [1] has suggested a
promising area for further detailed ground gamma ray spectrometric studies. This area, known as Solaf-Umm Takha area, is bounded by longitudes 33˚ 41΄ 14˝ and 33˚ 44΄ 10˝ E and latitudes 28˚36΄ 39˝ and 28˚38΄35˝ N,
and is about 17.325 Km2 in area (Fig.2).
The gamma-ray spectrometric method is a powerful tool in geological mapping. It is possible, when
using this method, to determine the individual concentrations of the three naturally-occurring radioelements in
the ground. The method depends upon the fact that the absolute and relative concentrations of the radioelements
(K, U, and Th) vary measurably and significantly with lithology [2].
In this study, three different analytical techniques have been applied on the measured ground gamma
ray spectrometric data in an attempt to locate the different distributions of radioelements. These techniques are
the uranium migration, the multi-variate statistical analysis and favorability indices. The favorability indices
have been applied in order to trace the migration history of uranium in the study area.
II. Geological And Structural Outline The first description of Feiran-Solaf metamorphic complex geology was done in the west Sinai
gneisses extended as a strip 200 Km long and 8 Km wide and considered the gneisses of Wadi Feiran to be
fragments of much older continental crust. Further, he concluded that the granitic masses induced metamorphic
Uranium migration history in the igneous and metamorphic rocks of Solaf-Umm Takha area, based
www.iosrjournals.org 10 | Page
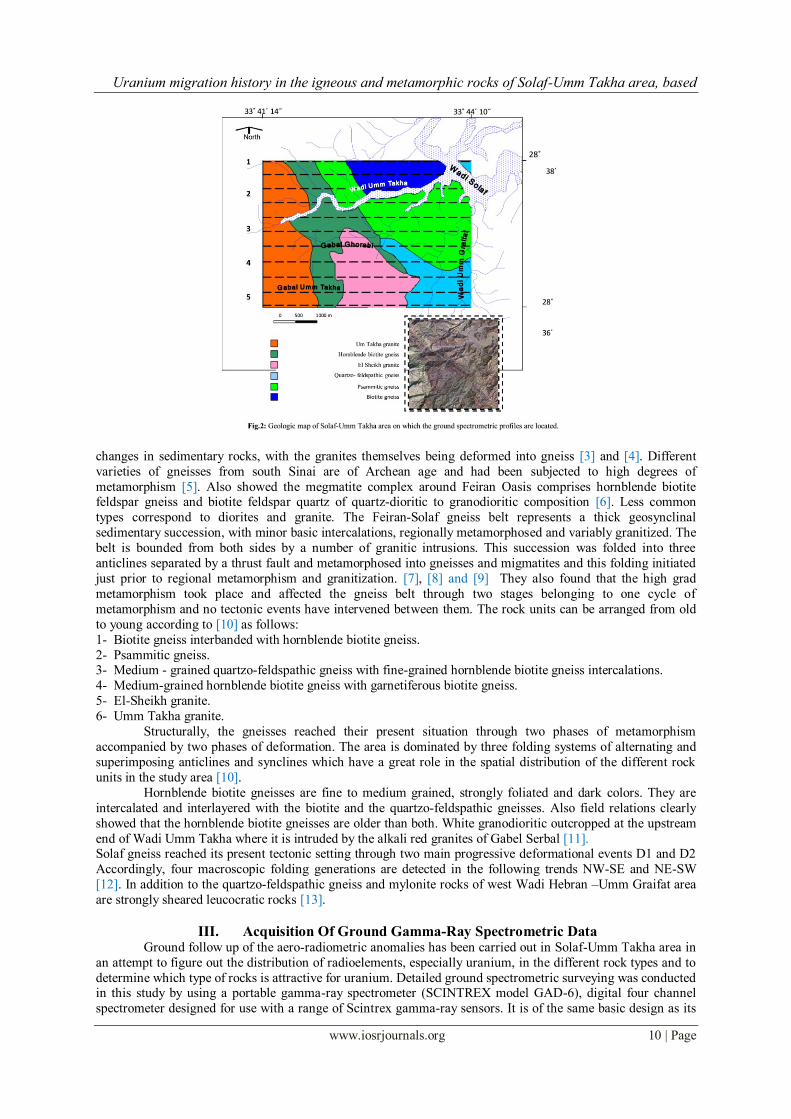
changes in sedimentary rocks, with the granites themselves being deformed into gneiss [3] and [4]. Different
varieties of gneisses from south Sinai are of Archean age and had been subjected to high degrees of
metamorphism [5]. Also showed the megmatite complex around Feiran Oasis comprises hornblende biotite feldspar gneiss and biotite feldspar quartz of quartz-dioritic to granodioritic composition [6]. Less common
types correspond to diorites and granite. The Feiran-Solaf gneiss belt represents a thick geosynclinal
sedimentary succession, with minor basic intercalations, regionally metamorphosed and variably granitized. The
belt is bounded from both sides by a number of granitic intrusions. This succession was folded into three
anticlines separated by a thrust fault and metamorphosed into gneisses and migmatites and this folding initiated
just prior to regional metamorphism and granitization. [7], [8] and [9] They also found that the high grad
metamorphism took place and affected the gneiss belt through two stages belonging to one cycle of
metamorphism and no tectonic events have intervened between them. The rock units can be arranged from old
to young according to [10] as follows:
1- Biotite gneiss interbanded with hornblende biotite gneiss.
2- Psammitic gneiss. 3- Medium - grained quartzo-feldspathic gneiss with fine-grained hornblende biotite gneiss intercalations.
4- Medium-grained hornblende biotite gneiss with garnetiferous biotite gneiss.
5- El-Sheikh granite.
6- Umm Takha granite.
Structurally, the gneisses reached their present situation through two phases of metamorphism
accompanied by two phases of deformation. The area is dominated by three folding systems of alternating and
superimposing anticlines and synclines which have a great role in the spatial distribution of the different rock
units in the study area [10].
Hornblende biotite gneisses are fine to medium grained, strongly foliated and dark colors. They are
intercalated and interlayered with the biotite and the quartzo-feldspathic gneisses. Also field relations clearly
showed that the hornblende biotite gneisses are older than both. White granodioritic outcropped at the upstream
end of Wadi Umm Takha where it is intruded by the alkali red granites of Gabel Serbal [11]. Solaf gneiss reached its present tectonic setting through two main progressive deformational events D1 and D2
Accordingly, four macroscopic folding generations are detected in the following trends NW-SE and NE-SW
[12]. In addition to the quartzo-feldspathic gneiss and mylonite rocks of west Wadi Hebran –Umm Graifat area
are strongly sheared leucocratic rocks [13].
III. Acquisition Of Ground Gamma-Ray Spectrometric Data Ground follow up of the aero-radiometric anomalies has been carried out in Solaf-Umm Takha area in
an attempt to figure out the distribution of radioelements, especially uranium, in the different rock types and to
determine which type of rocks is attractive for uranium. Detailed ground spectrometric surveying was conducted in this study by using a portable gamma-ray spectrometer (SCINTREX model GAD-6), digital four channel
spectrometer designed for use with a range of Scintrex gamma-ray sensors. It is of the same basic design as its
Uranium migration history in the igneous and metamorphic rocks of Solaf-Umm Takha area, based
www.iosrjournals.org 11 | Page
successful predecessor; the GAD-6 which can provide quantitative analysis for K, U and Th content in outcrop,
drill hole, laboratory, mobile ground or airborne survey applications [14]. The energy Peaks of uranium, thorium
measurements are (1.76 MeV from 214Bi) and (2.61 MeV from 208Tl) respectively and potassium was
measured directly from the 1.46 MeV emitted by K40
. Artificial concrete calibration pads of blank, potassium;
uranium and thorium of Canadian style were used to calibrate the spectrometer [15]. The obtained calibration
values (including background and stripping corrections) were later used to correct the field GAD-6
measurements and convert them into radioelement concentrations (U and Th in ppm and K40 in %) [16]. In the study area, the field measurements were recorded above 374 stations, along 11 parallel profiles
striking in the E-W direction (Fig.2), crossing all the different rock unites. The distance separation between
successive profiles was 350 m and between successive stations was 150m. The lowest recorded readings in the
potassium, uranium and thorium channels were considered to be the background values in the study area. These
readings were found as being 106.91, 46.8, and 8.9 cps respectively.
The corrected total count gamma ray measurements were converted into units of radioelements
concentration (Ur), recommended by the [16]. Further, the recorded radiometric measurements in the other three
channels were converted into concentrations of radioelements, K in %, equivalent uranium, (eU) in ppm, and
equivalent thorium, (eTh) in ppm. The results are then represented in contour maps for total counts of uranium,
thorium and potassium.
IV. Results And Discussion The corrected field spectrometric measurements were represented in the form of contour maps showing the spatial distribution features of the apparent and relative surface concentrations of the three radioelements K,
U, Th, in addition to the integral gamma ray response (T.C.) of the study area. These maps will be elucidated in
the following:
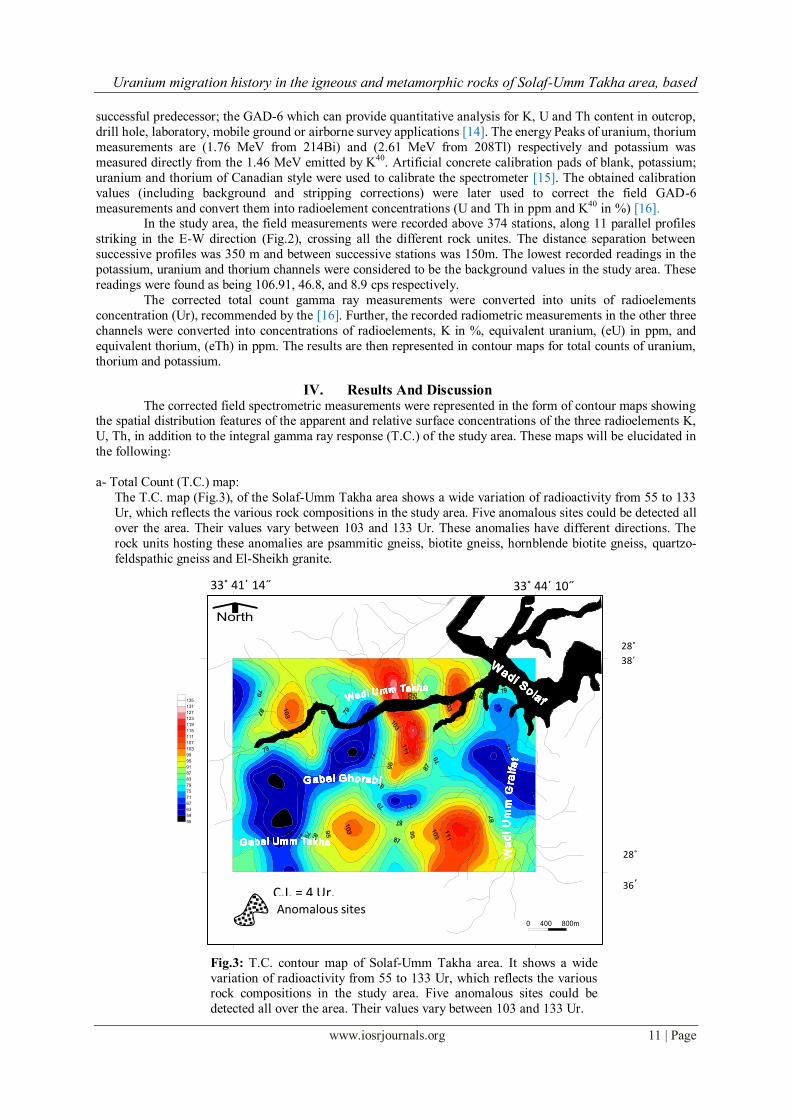
a- Total Count (T.C.) map:
The T.C. map (Fig.3), of the Solaf-Umm Takha area shows a wide variation of radioactivity from 55 to 133
Ur, which reflects the various rock compositions in the study area. Five anomalous sites could be detected all
over the area. Their values vary between 103 and 133 Ur. These anomalies have different directions. The
rock units hosting these anomalies are psammitic gneiss, biotite gneiss, hornblende biotite gneiss, quartzo-
feldspathic gneiss and El-Sheikh granite.
North
0 400 800m
55
59
63
67
71
75
79
83
87
91
95
99
103
107
111
115
119
123
127
131
135
33˚ 41΄ 14˝ 33˚ 44΄ 10˝
28˚
38΄
35
˝
28˚
36΄
39
˝
Anomalous sites C.I. = 4 Ur.
Fig.3: T.C. contour map of Solaf-Umm Takha area. It shows a wide
variation of radioactivity from 55 to 133 Ur, which reflects the various rock compositions in the study area. Five anomalous sites could be
detected all over the area. Their values vary between 103 and 133 Ur.

Uranium migration history in the igneous and metamorphic rocks of Solaf-Umm Takha area, based
www.iosrjournals.org 12 | Page
b- Potassium concentration (K %) map
The contour map of the potassium concentration (Fig.4) is very similar to that of the total count map.
The high potassium anomalies values range from 2.1 to 3.6 %, and occupy nearly the same sites as the T.C.
anomalies except the El-Sheik granite unit.
c- Equivalent uranium (eU) map
The eU map of the study area (Fig.5) also shows five major closures of high uranium readings ranging
in values from 2.8 to 4 ppm. These high readings coincide mostly with the high readings in both of the T.C. and
K% maps. It is also evident that the high uranium values are somewhat evenly distributed among the different
rock types in the study area (Figs 2 and 5). This distribution is mainly attributed to the high mobility of uranium.
This range of anomalous values is pretty much consistent with the average abundance of uranium in
metamorphic basement rocks (3.5 ppm U) and granite (4.5 ppm U) [17].
d- Equivalent Thorium (eTh) map
The eTh contour map of the study area (Fig.6) contains more than ten high anomalies with steep
gradients, occupying nearly 60 % of the study area and ranging in values from 7.5 to 12.5 ppm. Some of these
anomalies coincide with the uranium anomalous sites and others do not, which confirm the immobility behavior
of thorium.
V. Uranium Accumulation And Migration There are two key processes in uranium accumulation; the uranium migration and the uranium dispersion in the
oxidized zone. In the uranium migration, uranium occurs in nature in two oxidation states: U+4 and U+6 whose
ionic radii are 1.05Å and 0.83Å, respectively. In the igneous and metamorphic environment, Uranium is mobile
in the reduced state and tends to accumulate in the late differentiation of igneous melt. The two radioelements
Uranium and Thorium have the same ionic radii and bond character and also form at the same conditions in the
magma chamber. This explains why they tend to occur together in igneous rocks and hydrothermal ore deposits
that form at high temperature. With regard to the second processes: while uranium is a mobile radioelement and migrates under the action of oxygen from the ground water during its evolution and accumulation, thorium is a
relatively stable radioelement in the oxidation zone. As a result, breaking the original (U-Th formed state) is
indicated by the presence of high-Th site, which could be recommended as the original U- high area [17].
Granitic bodies that are greatly enriched in Th and their associated elements are generally the high level post-
orogenic intrusive types.
North
0 400 800m
0.2
0.45
0.7
0.95
1.2
1.45
1.7
1.95
2.2
2.45
2.7
2.95
3.2
3.45
3.7
33˚ 41΄ 14˝ 33˚ 44΄ 10˝
28˚
38΄
35
˝
28˚
36΄
39˝
Anomalous sites C.I. = 0.15 %
Fig.4: K% contour map of Solaf-Umm Takha area is very similar to that
of the total count map. The high Potassium anomalies have values ranging from 2.1 to 3.6 %.

Uranium migration history in the igneous and metamorphic rocks of Solaf-Umm Takha area, based
www.iosrjournals.org 13 | Page
North
0 400 800m
0.6
0.8
1
1.2
1.4
1.6
1.8
2
2.2
2.4
2.6
2.8
3
3.2
3.4
3.6
3.8
4
4.2
Fig.5: eU contour map of Solaf-Umm Takha area. It shows five major
closures of high Uranium readings ranging in values from 2.8 to 4 ppm.
These high readings coincide mostly with the high readings in each T.C. and
K% maps.
33˚ 44΄ 10˝ 33˚ 41΄ 14˝
Anomalous sites
28˚
38΄
35
˝
28˚
36΄
39
˝
C.I. = 0.2 ppm.
Fig.6: eTh contour map of Solaf-Umm Takha area. It contains more than
ten high anomalies with steep gradients, occupying nearly 60 % of the study
area and ranging in values from 7.5 to 12.5 ppm.
North
0 400 800m
2
2.5
3
3.5
4
4.5
5
5.5
6
6.5
7
7.5
8
8.5
9
9.5
10
10.5
11
11.5
12
12.5
28˚
38΄
35
˝
33˚ 41΄ 14˝ 33˚ 44΄ 10˝
28˚
36΄
39
˝
Anomalous sites C.I. = 0.5 ppm.
Uranium migration history in the igneous and metamorphic rocks of Solaf-Umm Takha area, based
www.iosrjournals.org 14 | Page
Most of the enriched granites are not of commercial importance at present but provide a large reserve
of thorium and uranium for the future as some contain up to 240 ppm Th and 120 ppm U [18]. Consequently,
the second process is concluded to be the most fundamental in the distribution of these two radioelements.
The eU/eTh ratio is a very important geochemical parameter in the migration of ranium. This ratio is
highly affected by the oxidation processes that can lead to uranium migration and consequently its loss or gain.
This ratio is an important parameter in determining the oxidizing environment in which uranium was transported
[19]. It is considered approximately constant for each rock type in closed environment (Equilibrium Uranium series ) . Accordingly, if the uranium migrates out or in during the broken environment state, this standard
ratio will be changed for each geologic unit. The analysis of uranium migration is illustrated by the following
mathematical equations [20] and examined in Egypt by [21], [22] and [23].
eTh
eUTheU *0
Where U0 is the original uranium content, eTh is the average of the equivalent thorium content in certain
geological unit in ppm and eU/eTh is the average of regional eU/eTh ratio in different geological units.
0UUU Pm
Where, Um is the amount of uranium migration. UP is the present uranium content.
100*P
m
U
UP
Where, P is the uranium migration rate.
There are two states of uranium migration which are: Um>0 which reflects uranium migration in the geologic
rock unit, and Um<0 which reflects uranium migration out the geologic rock unit.
In the study area, the average values of eU, eTh and K% are computed for the different rock units
(Table.1).According to these values, three geological rock units in the study area have been identified as
uranium-source rocks, which are Umm Takha granite, Quartzo-feldspathic gneiss and El-Sheikh granite. They
have negative amounts of uranium migration (-0.11, -0.05 and -0.01ppm respectively).
Further, this table shows that the Umm Takha granite has the highest uranium outward migration with the
migration rate of about (-5.53%). This high rate of migration may indicate that the Umm Takha granite is the main uranium-source rock in the study area. The other three rock units (i.e. psammitic gneiss, hornblende biotite
gneiss and biotite gneiss) are contaminated by Uranium accumulations. These rocks show positive values of
uranium inward migration (0.07, 0.01 & 0.007ppm respectively). However the psammitic gneiss rocks have the
highest uranium inward migration with the migration rate of about (3.15%). This rate of migration strongly
implies that this rock is the main uranium-received rock in the study area.
Uranium migration model was developed in hard rocks and at the same time the blind predictions are
used to drive the experimental program, as they help to identify data needs and data gaps [24]. This experiment
demonstrated that uranium can migrate over very short timescales, at appreciable concentrations and this is
obviously more difficult with field investigations, although an understanding of secondary uranium phase
formation permits defensible conclusions to be drawn on the effectiveness of host rock retardation (received
rocks).
Accordingly, this conclusion may be satisfied geologically by many authors as mentioned before in the geological and structural settings section which demonstrated that the psammitic gneiss rock as one of the oldest
rock units in the study area. In addition to the structural control which influenced the pathway of leached
uranium from the massive granitic source rocks to its accumulation in the psammitic gneiss received rocks along
the sides of the main stream Wadi of Umm Takha.
b- Uranium favorability index:
Three indices, designated as U1, U2, and U3, based on examination of aerial radiometric data of Alaska
[25], [26] and [27]. They reasoned that favorable areas will have an elevated radioelement content characterized
by high mean eU, eTh, and K values, and high coefficients of variation for these elements and the ratios eU/eTh
and eU/K. Furthermore, if leaching or depletion of uranium in source rocks has actually occurred, then favorable
areas should be characterized by low mean values of eU/eTh and eU/K. U1, U2, and U3 are constructed to give
increasing index values with increasing uranium favorability. U1 is defined as the ratio of all increasing parameters to all decreasing parameters, or
Where M designates mean quadrangle value, and RSD designates the relative standard deviation of the
quadrangle. U2 is defined as a similar ratio,
)/()/(
)/()/()()(1
KeUMeTheUM
KeURSDeTheURSDeURSDMKMeThMeUU

Uranium migration history in the igneous and metamorphic rocks of Solaf-Umm Takha area, based
www.iosrjournals.org 15 | Page
In order to avoid soil moisture and vegetation effects, U3 is defined as the reciprocal of ratio products, or
regarded U2 as the best of the three because it most effectively separates top-ranged quadrangles [25].
Thorium is used as a "surrogate" of original uranium content because of the contrast in mobility of
uranium and thorium under oxidizing conditions. The ration eTh/eU is expected to be high if uranium depletion
has actually occurred. Source units, therefore, will have high values of both parameters. A major criticism of
U1, U2, and U3 is found in the use of quadrangle means of the various parameters. Interpreting such values is
difficult, especially for ratios such as eU/eTh. In particular, interpreting low values of eU/eTh to indicate
uranium depletion from source rocks may be partly true in sedimentary terrains, but fractionation may invalidate
such an interpretation in igneous and metamorphic terrains. Combining all lithology to construct a quadrangle
mean obscures the situation even more [28] and [29].
But, in the study area this is not true, because the source rocks of Uranium (Uranium migrated out)
such as Umm Takha granite, quartzo-feldspathic gneiss and El-Sheikh granite have the lower uranium
favorability indices, while the received rocks of uranium (uranium migrated in) such as psammitic gneiss,
hornblende biotite gneiss and biotite gneiss have the higher uranium favorability indices (Table 1). That means
the results refer to the obvious general observation concluded from figs. (7&8) in this area as a whole, whenever
migration attains a high value (i.e. the rock is depleted from U) the uranium favorability index becomes low and
vice versa. So, interpreting low values of eU/eTh which indicate uranium depletion from source rocks may
validate such an interpretation in igneous and metamorphic terrains.
Table 1: Statistics for Uranium migration, migration rate and Uranium favorability index in different rock units
in the study area.
MeU
MKMeTh
MKMeUMeThMeU
MeUU
)/()/(2
23)()/()/(
1
MeU
MKMeTh
MKMeUMeThMeUU
Uranium migration history in the igneous and metamorphic rocks of Solaf-Umm Takha area, based
www.iosrjournals.org 16 | Page
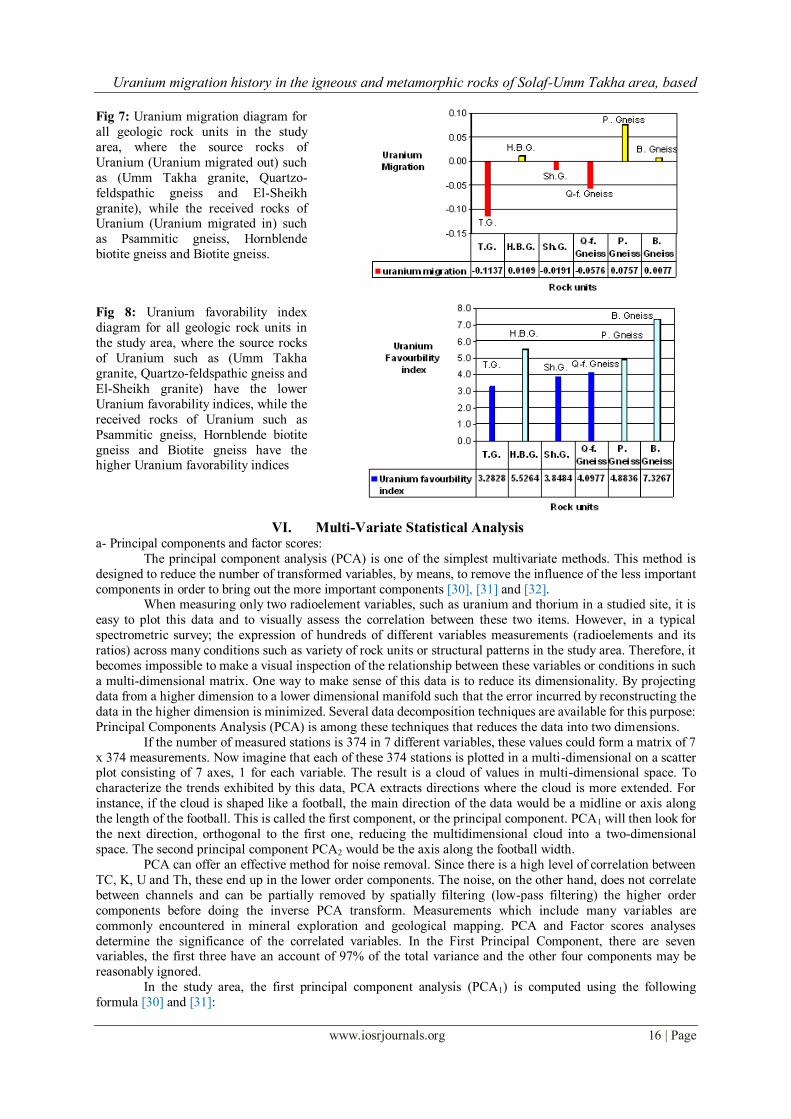
Fig 7: Uranium migration diagram for
all geologic rock units in the study
area, where the source rocks of
Uranium (Uranium migrated out) such
as (Umm Takha granite, Quartzo-
feldspathic gneiss and El-Sheikh
granite), while the received rocks of Uranium (Uranium migrated in) such
as Psammitic gneiss, Hornblende
biotite gneiss and Biotite gneiss.
Fig 8: Uranium favorability index
diagram for all geologic rock units in
the study area, where the source rocks
of Uranium such as (Umm Takha
granite, Quartzo-feldspathic gneiss and
El-Sheikh granite) have the lower
Uranium favorability indices, while the
received rocks of Uranium such as
Psammitic gneiss, Hornblende biotite
gneiss and Biotite gneiss have the higher Uranium favorability indices
VI. Multi-Variate Statistical Analysis a- Principal components and factor scores:
The principal component analysis (PCA) is one of the simplest multivariate methods. This method is
designed to reduce the number of transformed variables, by means, to remove the influence of the less important
components in order to bring out the more important components [30], [31] and [32]. When measuring only two radioelement variables, such as uranium and thorium in a studied site, it is
easy to plot this data and to visually assess the correlation between these two items. However, in a typical
spectrometric survey; the expression of hundreds of different variables measurements (radioelements and its
ratios) across many conditions such as variety of rock units or structural patterns in the study area. Therefore, it
becomes impossible to make a visual inspection of the relationship between these variables or conditions in such
a multi-dimensional matrix. One way to make sense of this data is to reduce its dimensionality. By projecting
data from a higher dimension to a lower dimensional manifold such that the error incurred by reconstructing the
data in the higher dimension is minimized. Several data decomposition techniques are available for this purpose:
Principal Components Analysis (PCA) is among these techniques that reduces the data into two dimensions.
If the number of measured stations is 374 in 7 different variables, these values could form a matrix of 7
x 374 measurements. Now imagine that each of these 374 stations is plotted in a multi-dimensional on a scatter plot consisting of 7 axes, 1 for each variable. The result is a cloud of values in multi-dimensional space. To
characterize the trends exhibited by this data, PCA extracts directions where the cloud is more extended. For
instance, if the cloud is shaped like a football, the main direction of the data would be a midline or axis along
the length of the football. This is called the first component, or the principal component. PCA1 will then look for
the next direction, orthogonal to the first one, reducing the multidimensional cloud into a two-dimensional
space. The second principal component PCA2 would be the axis along the football width.
PCA can offer an effective method for noise removal. Since there is a high level of correlation between
TC, K, U and Th, these end up in the lower order components. The noise, on the other hand, does not correlate
between channels and can be partially removed by spatially filtering (low-pass filtering) the higher order
components before doing the inverse PCA transform. Measurements which include many variables are
commonly encountered in mineral exploration and geological mapping. PCA and Factor scores analyses
determine the significance of the correlated variables. In the First Principal Component, there are seven variables, the first three have an account of 97% of the total variance and the other four components may be
reasonably ignored.
In the study area, the first principal component analysis (PCA1) is computed using the following
formula [30] and [31]:

Uranium migration history in the igneous and metamorphic rocks of Solaf-Umm Takha area, based
www.iosrjournals.org 17 | Page
In this case, there are five positive weights of the variables K, TC., eTh, eTh/K and eU and two negative weights
eU/K and eU/eTh. The computed (PCA1) is presented in the form of a contour map (Fig.9).
This map shows the spatial distribution of the radioelements in the study area. Five intermediate to high positive
zones could be delineated. These zones are accompanied by different rock units which are: biotite gneiss,
psammitic gneiss, quartzo-feldspathic gneiss, Umm Takha granite and El-Sheikh granite.
The Second principal component analysis of the study area (PCA2) is computed using the following formula:
In this type of analysis, all the variables are positive except eU, and the three radioactive ratios have the highest
positive weights. The (PCA2) is the factor which represents the uranium distribution and its extend. Then, it is
possible to get an idea about the concentration and distribution of the radioactive minerals in the study area
between Wadi Umm Takha and Wadi Umm Graifat.
The (PCA2) map (Fig.10) shows high positive zones occupying different rock units, which are: El-Sheikh
granite and Quartzo-feldspathic gneiss and the Umm Takha granite. These zones reflect the increase in uranium
concentrations relative to both thorium and potassium.
b- Factor scores:
The technique of factor scores was first promulgated by [33]. The factor score coefficient matrix shows the coefficients by which items (PCA1 & PCA2) are multiplied to obtain factor scores. The results of this
multiplication can adjust the boundaries between the different rock units on the geologic map.
In the study area the factor scores analysis could clearly define the boundaries between the biotite
gneiss, psammitic gneiss and El-Sheikh granite & Quartzo-feldspathic gneiss, (Fig.11).
)/(13.0)/(08.0)(23.0)/(1.0)(26.0)(26.021.01 eTheUKeUeUKeTheThTCKPCA
)/(34.0)/(43.0)(13.0)/(29.0)(08.0)(03.024.01 eTheUKeUeUKeTheThTCKPCA
Fig.9: First principal component contour map of Solaf-Umm Takha area shows
the spatial distribution of the radioelements in the study area. Five intermediate
to high positive zones could be delineated. These zones are accompanied by
different rock units which are: Biotite gneiss, Psammitic gneiss, Quartzo-
feldspathic gneiss, Umm Takha granite and El-Sheikh granite.
North
0 400 800m
21
23
25
27
29
31
33
35
37
39
41
43
45
47
49
33˚ 44΄ 10˝ 33˚ 41΄ 14˝
Anomalous sites
28˚
38΄
35
˝
28˚
36΄
39
˝
C.I. = 2

Uranium migration history in the igneous and metamorphic rocks of Solaf-Umm Takha area, based
www.iosrjournals.org 18 | Page
VII. Conclusion 1- Three analytical techniques have been applied on the measured ground gamma ray spectrometric data in
Solaf-Umm Takha area, southwestern Sinai, Egypt. These techniques are: the uranium migration (in & out), the
multi-variate analysis (including the principal components) and the factor scores.
2- Different radioelements maps, including T.C., eU, eTh & K%, have been constructed to show the surface
distribution of these radioelements relative to the different rock units. Moreover, the uranium migration analysis
indicates that the Umm Takha granite, which has the highest uranium outward migration rate, is the main
uranium-source rock in the study area. However, the psammitic gneiss which has the highest Uranium inward migration rate is considered as the main uranium-received rock in the study area.
3- The source rocks of uranium such as Umm Takha granite, quartzo-feldspathic gneiss and El-Sheikh granite
have the lower uranium favorability indices, while the received rocks of uranium such as psammitic gneiss,
hornblende biotite gneiss and biotite gneiss have the higher uranium favorability indices. The assumption was
corrected according to favorability index technique on igneous and metamorphic environments where low
values of eU/eTh which indicate Uranium depletion from source rocks may validate such an interpretation in
igneous and metamorphic terrains.
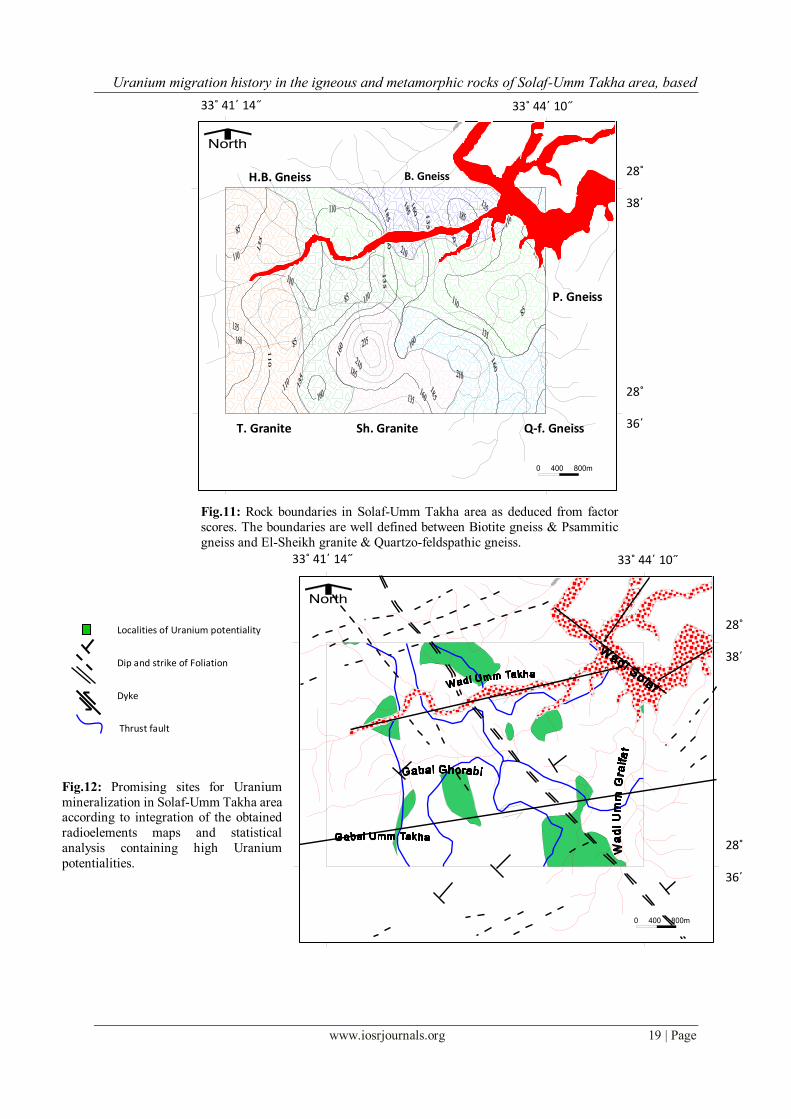
4- Integration of the obtained radioelements distribution maps and statistical analysis could produce a map
containing promising sites for high Uranium potentiality (Fig.12). This map also shows a structural control
relationship between the rock units boundaries estimated from factor scores analysis, Uranium priority
potentialities estimated from principal components analysis and Uranium favorability indices with the major structure, the thrust fault which is the controlling item in fractures framework in the study area.
5- The migration history of Uranium in Solaf-Umm Takha area is identified by the integration of Uranium
migration and Uranium favorability index results that declared the eastern and southern parts of study area are
the start point of Uranium migration to the western and northern parts of the study area and that means from the
high relief mountainous region to the drainage divide of Solaf-Umm Takha Wadis.
6- Exploration for uranium should not be restricted to the source rocks, but is recommended to extend to the
received rocks in which it may host considerable concentrations of uranium.
Fig.10: Second principal component contour map of Solaf-Umm Takha area
shows high positive zones occupying different rock units, which are: El-
Sheikh granite and Quartzo-feldspathic gneiss and the Umm Takha granite.
These zones reflect the increase in Uranium concentrations relative to both
Thorium and Potassium.
North
3.4
3.8
4.2
4.6
5
5.4
5.8
6.2
6.6
7
7.4
7.8
8.2
8.6
9
9.4
0 400 800m
33˚ 44΄ 10˝
28˚
36΄
39
˝
28˚
38΄
35
˝
33˚ 41΄ 14˝
Anomalous sites C.I. = 0.4
Uranium migration history in the igneous and metamorphic rocks of Solaf-Umm Takha area, based
www.iosrjournals.org 19 | Page
Fig.12: Promising sites for Uranium
mineralization in Solaf-Umm Takha area according to integration of the obtained
radioelements maps and statistical
analysis containing high Uranium
potentialities.
Localities of Uranium potentiality
Dip and strike of Foliation
Dyke
Thrust fault
Fault
Rock unit boundary
33˚ 41΄ 14˝
North
0 400 800m
33˚ 44΄ 10˝
28˚
38΄
35
˝
28˚
36΄
39
˝
Fig.11: Rock boundaries in Solaf-Umm Takha area as deduced from factor
scores. The boundaries are well defined between Biotite gneiss & Psammitic
gneiss and El-Sheikh granite & Quartzo-feldspathic gneiss.
North
0 400 800m
33˚ 44΄ 10˝ 33˚ 41΄ 14˝
28˚
38΄
35
˝
28˚
36΄
39
˝
T. Granite
H.B. Gneiss
Q-f. Gneiss
P. Gneiss
B. Gneiss
Sh. Granite
Uranium migration history in the igneous and metamorphic rocks of Solaf-Umm Takha area, based
www.iosrjournals.org 20 | Page
References [1] L.M.S. Magdy, A.A. Ammar, E.M. El Kattan, I.A. El Kassass, The role of Aeroradiometry in modifying geology and identifying
anomalous zones, Serbal-Nukhull area, Sinai Peninsula, Egypt. Nuclear Materials Authority. Nucl. Geophys. Vol. 9. No. 2. 1995,147-
168.
[2] Darnley, K.L. Ford, A regional airborne Gamma-ray surveys review; in Proceedings of Exploration, 87: Third Decennial
International Conference on Geophysical and Geochemical Exploration for Mineral and Groundwater, edited by G.D. Garland,
Ontario, Geol. Surv. of Canada, Special, 3, 1989, 960p.
[3] W.F. Hume, The topography and geology of the Peninsula of Sinai (southeastern portion). Geological Survey of Egypt, Cairo, 1906,
280pp.
[4] W. F. Hume, Geology of Egypt. II. The fundamental Precambrian rocks of Egypt and the Sudan: Geol. Surv. of Egypt, Cairo, Egypt,
1935,Part I, The metamorphic rocks: pp. 1–300; Part II, The later plutonic and minor intrusive rocks, pp. 301–688.
[5] J. Ball, The Geography and Geology of the West Sinai, Egypt. Egyptian Geological Survey, 1916, 219p.
[6] M.K. Akaad, The magmatic gneisses of Wadi Feiran, Sinai, Egypt. Assiut Science and Technology Bulletin, Assiut University, 2,
1959, 211-237pp.
[7] S. El Gaby, A.M. Ahmed,. The Feiran-Solaf gneiss belt SW Sinai, Egypt. I.A., G. Bull. No.3, Vol.4, 1980, 95-105 pp.
[8] A.A. Ahmed, Geology of the Area Around Feiran Oasis, Sinai. Ph.D. Thesis. Assiut Univ., Egypt 1970.
[9] A.A. Ahmed,. Reconsidered view on Feiran–Solaf Gneisses southwest of Sinai, Egypt. Bull. Fac. Sci. Assiut Univ. 10, 1981, 131–
142.
[10] A.M. Hegazi, Structural studies on Feiran Oasis area, Central Sinai, Egypt. M.Sc. Thesis, Suez Canal Univ., Egypt. 1988, 81p.
[11] Y.M, Sultan, Tectonic setting of south Sinai metamorphic belts based on remote sensing, structural analysis and GIS. Ph.D. in
geology Dept. 2011, Faculty of Science, Suez Canal University, Ismailia, Egypt.
[12] A.M. Hegazi, M.K. El-Shafei, Y.M. Sultan, Multiple deformation phases of Solaf Gneiss Belt, South Sinai Egypt. Proceedings of the
7th International Conference on Geology of the Arab World, Cairo (2004), pp. 313–320.
[13] A.M. Mehanna, F.A. Soliman, Geology and Geochemistry of west Wadi Hebran area, southwestern Sinai, Egypt. Proc. 5th Conf.
Geol. Sinai Develop., Saint Catherine, 1998, pp. 113-131.
[14] Kelvin Energy Limited, report on airborne electromagnetic, magnetometer and radiometrics survey. Kettle River Area, British
Colwnbia, November 1978, APPENDIX III, GAD-6 AND GSA-42 SPECIFICATIONS.
[15] P.G. Killeen, J.G. Conaway, New facilities for calibrating gamma-ray spectrometric logging and surface exploration equipment; CIM
Bull., Vol. 71, No. 793, 1978, pp.84-87.
[16] International Atomic Energy Agency, Radiometric reporting method and calibration in Uranium exploration: International Atomic
Energy Agency Technical reports series, 1976, 174p.
[17] T.P. Mernagh, Y. Miezitis, A Review of the Geochemical Processes Controlling the Distribution of Thorium in the Earth’s Crust and
Australia’s Thorium Resources. Geoscience Australia Record 2008/05, 48p.
[18] R.W. Boyle, Geochemical prospecting for thorium and uranium deposits. Elsevier Scientific Publishing Company, Amsterdam, 1982,
498p.
[19] G.B. Naumov, Transportation of uranium in hydrothermal solution as a carbonate, Geochemistry, V (1), 1959, pp. 5-20.
[20] Benzing Uranium Institute, Field Gamma-ray Spectrometric Survey, No.3, 1977, 1:292, China.
[21] A. A. Hassan, B. M. Ghieth, A. F. Khalil and A. A. Nigm, Uranium favourability and its mode of migration in some rocks in the
south eastern desert, Egypt. Egyptian Journal of Geology, V. 47/2, 2003, pp. 1125-1138.
[22] A. A. Hassan, B. M. Ghieth, A. F. Khalil, M. O. Elminawy, A. A. Nigm and R. M. Abdelrehim, A statistical analysis and composite
images study of the airborne gamma-ray spectrometric data, Gabal Monqul area, north eastern deasert, Egypt. Proc. 3rd International
Symposium on Geophysics, Tanta, 2004, pp. 183-195.
[23] A. Abu-Deif, S.O.A. Helmy and I.E.H. Hamdy, Radioelements and Uranium Migration in Granites, El-Missikat Tunnels, Central
Eastern Desert, Egypt. King Abdulaziz University, Faculty of Earth Sciences Geophysics Department, Jeddah, Kingdom of Saudi
Arabia JKAU: Earth Sci., Vol. 18, 2007, pp. 89-115.
[24] W. E. Falck, D. Read, S. Black, D. Thornley, M. Siitari-Kauppi, Uranium Migration in Crystalline Rocks. European Commission,
Joint Research Centre Institute for Energy. address: P.O. Box 2, NL-1755 ZG Petten, 2009. The Netherlands.
[25] D. F. Saunders and M. J. Potts, Manual for the application of NURE 1974-1977 aerial gamma-ray spectrometer data: U.S. Energy
Re-search and Development Administration GJBX- 13(78) Open-File Report, 1978.
[26] D. F. Saunders, Characterization of uraniferous geochemical provinces by aerial gamma-ray spectrometry: Mining Engineering, v.
31, , 1979, pp. 1715-1722.
[27] F. L. Pirkle, R. J. Beckman and H. L. Jr. Fleischhauer, A Multivariate Uranium Favorability Index Using Aerial Radiometric Data.
Journal of Geology, Vol 90, , 1982, pp.109-124.
[28] Texas Instruments Inc., Study of airborne gamma-ray spectrometer data procedures Wind River Basin, Wyoming: U.S. Dept. of
Energy GJBX-40(79) Open-File Report, 1979, v. 1.
[29] Texas Instruments Inc., Interpretation methods test report for NURE aerial radiometric and geochemical data, v. 1-text: U.S. Dept. of
Energy GJBX-137(80) Open-File Report, 1980.
[30] T.W. Anderson, An introduction to multivariate analysis 2nd edition, John Wiley and Sons, 1984, 675 p.
[31] B. Manly, Multivariate statistical methods: A Primer. Published by Chapman and Hall Ltd., London, , 1986, 159 p.
[32] S. Raychaudhuri, , J.M. Stuart and R.B. Altman, Principal components analysis to summarize microarray experiments: application to
sporulation time series. Pacific Symposium on Biocomputing (2000).
[33] C. Spearman, General intelligence objectively determined and measured. American Journal of Psychology 15, , 1904, pp. 201-293.
T.Granite Sh. Granite H.B.Gniess
Q-f.Gniess P.Gniess


![[PPT]Geol 2312 Igneous and Metamorphic Petrologymille066/Teaching/2312_09/PetLec.2.ppt · Web viewGEOL 2312 IGNEOUS AND METAMORPHIC PETROLOGY Lecture 2 Classification of Igneous Rock](https://static.fdocuments.us/doc/165x107/5a9f936d7f8b9a62178ce723/pptgeol-2312-igneous-and-metamorphic-petrology-mille066teaching231209petlec2pptweb.jpg)