UPVLC DEMO SITE PRESENTATION
17
1 UPVLC DEMO SITE Kick off meeting 16th January 2009 UPVLC DEMO SITE PRESENTATION 1 J.M. Corberán C.Montagud A.Kalesis Instituto de Ingeniería Energética Universidad Politécnica de Valencia
Transcript of UPVLC DEMO SITE PRESENTATION

1UPVLC DEMO SITE Kick off meeting 16th January 2009
UPVLC DEMO SITE PRESENTATION
1
J.M. CorberánC.Montagud
A.Kalesis
Instituto de Ingeniería EnergéticaUniversidad Politécnica de Valencia

2UPVLC DEMO SITE Kick off meeting 16th January 2009 2
THE FIFTH FRAMEWORK PROGRAMME
GEOCOOLGeothermal Heat Pumpfor Cooling-and Heatingalong European Coastal Areas
Project No: NNE5 – 2001 – 00847

3UPVLC DEMO SITE Kick off meeting 16th January 2009 3
THE FIFTH FRAMEWORK PROGRAMME
GEOCOOLGeothermal Heat Pumpfor Cooling-and Heatingalong European Coastal Areas
UPV UNIVERSIDAD POLITÉCNICA DE VALENCIA, SpainGROHOL GROENHOLLAND, HollandCIATESA Compañía Industrial de Aplicaciones Térmicas S.A., SpainAUTH Aristotle University of Thessaloniki, GreeceENEA Ente per le Nuove Tecnologie, l’Energia e l’Ambiente, ItalyAEDIE Asociación para la Investigación y la Diagnosis de la Energía, Spain
Duration: 3 years Feb. 2003 - 2006

4UPVLC DEMO SITE Kick off meeting 16th January 2009
Ground Source HE
4

5UPVLC DEMO SITE Kick off meeting 16th January 2009 5
Ground Source HE
backfilling:sand (course and fine)or sand/bentonitealternative use of spacers

6UPVLC DEMO SITE Kick off meeting 16th January 2009 6
Hydr. switch

7UPVLC DEMO SITE Kick off meeting 16th January 2009
GeoCool data acquisition system
7
44 sensors in the loop (PT100, coriolis mass flowmeters and wattmeters) On site automatic meteorological station w. 22 parameters 1 min sampling during 1 year
44 sensors in the loop (PT100, coriolis mass flowmeters and wattmeters) On site automatic meteorological station w. 22 parameters1 min sampling during 1 year

8UPVLC DEMO SITE Kick off meeting 16th January 2009
Dynamic behaviour
8
Cooling Mode

9UPVLC DEMO SITE Kick off meeting 16th January 2009
System performance in heating mode
9
3.463.46
2.002.00
73 %
Experimental results
HSPF
COP – WWSPF – WWCOP – AWSPF - AW

10UPVLC DEMO SITE Kick off meeting 16th January 2009
Heating mode – Return WT
10

11UPVLC DEMO SITE Kick off meeting 16th January 2009
Energy distribution in heating
11

12UPVLC DEMO SITE Kick off meeting 16th January 2009
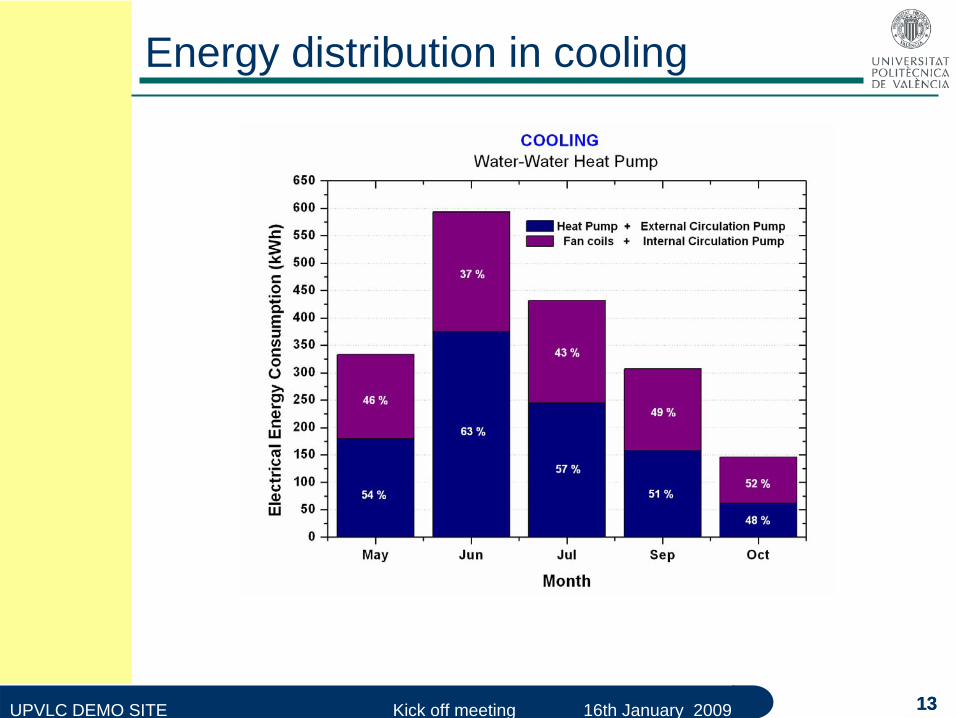
COP and SPF in cooling mode
12
4.364.36
2.722.72
60 %
COP – WWSPF – WWCOP – AWSPF - AW
13UPVLC DEMO SITE Kick off meeting 16th January 2009
Energy distribution in cooling
13
14UPVLC DEMO SITE Kick off meeting 16th January 2009 14
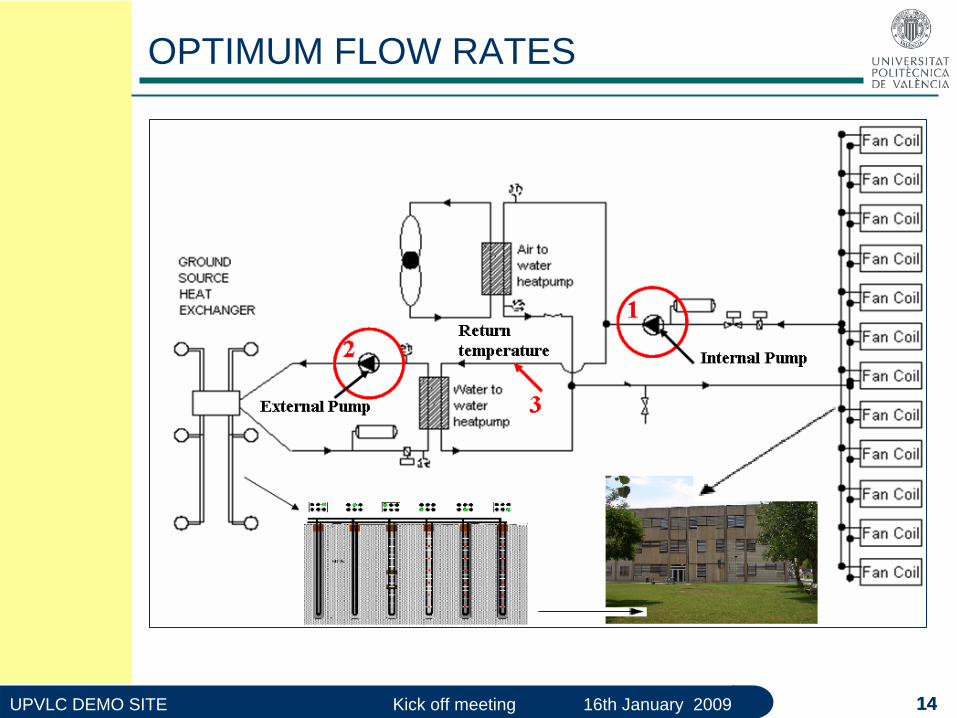
OPTIMUM FLOW RATES

15UPVLC DEMO SITE Kick off meeting 16th January 2009 15
OPTIMUM FLOW RATES
20% 25%
40%
Both pumps at same speed
Pump freq. (Hz) Pump freq. (Hz)
Pump freq. (Hz)
COOLING MODE

16UPVLC DEMO SITE Kick off meeting 16th January 2009
Results
In heating mode, 41% energy savings
In cooling mode 38% energy savings
Capacity adaptation strategies are needed to improve load factor and efficiency of (both) systems.
High impact in electricity consumption of auxiliary elementsImproved control strategies should be implemented.
16

17UPVLC DEMO SITE Kick off meeting 16th January 2009
GROUND(test IN-SITU)Ground thermal conductivity 1.800 W/m·KVolumetric heat capacity 2.4MJ/m3·KGround surface temperature 18.5 °CBOREHOLEConfiguration: 6 : 2 x 3, rectangleBorehole depth 50 mBorehole spacing 3 mBorehole installation SINGLE-UBorehole diameter 0.14 mU-pipe diameter 0.032 mU-pipe thermal conductivity 0.430
W/m·K(Polyethylene)HEAT CARRIER FLUID: WaterHEAT PUMP: IZE70 + R290 (UPV-CIATESA)
17
Ground Source HE main parameters