Upper-mantle low-velocity zone structure beneath the...
7
Geophys. J. Int. (2009) 178, 1021–1027 doi: 10.1111/j.1365-246X.2009.04178.x GJI Tectonics and geodynamics Upper-mantle low-velocity zone structure beneath the Kaapvaal craton from S-wave receiver functions Samantha E. Hansen, 1 Andrew A. Nyblade, 2 Jordi Juli` a, 1 Paul H.G.M. Dirks 3 and Raymond J. Durrheim 3 1 Department of Geosciences, 407 Deike Bldg., Pennsylvania State University, University Park, PA 16802, USA. E-mail: [email protected] 2 Department of Geosciences, 447 Deike Bldg., Pennsylvania State University, University Park, PA 16802, USA 3 School of Geosciences, University of the Witwatersrand, Private Bag X3, Wits 2050, South Africa Accepted 2009 March 10. Received 2009 February 9; in original form 2008 October 3 SUMMARY The southern African Plateau is marked by anomalously high elevations, reaching 1–2 km above sea level, and there is much debate as to whether this topography is compensated by a lower mantle source or by elevated temperatures in the upper mantle. In this study, we use S-wave receiver functions (SRFs) to estimate the lithospheric thickness and sublithospheric mantle velocity structure beneath the Kaapvaal craton, which forms the core of the Plateau. To fit the SRF data, a low-velocity zone (LVZ) is required below a ∼160-km-thick lithospheric lid, but the LVZ is no thicker than ∼90 km. Although the lid thickness obtained is thinner than that reported in previous SRF studies, neither the lid thickness nor the shear velocity decrease (∼4.5%) associated with the LVZ is anomalous compared to other cratonic environ- ments. Therefore, we conclude that elevated temperatures in the sublithospheric upper mantle contribute little support to the high elevations in this region of southern Africa. Key words: Seismicity and tectonics; Cratons; Africa. INTRODUCTION The depth extent of continental lithosphere beneath Archean and Proterozoic shields has been debated for many decades (e.g., MacDonald 1963; Jordan 1975), and much of this debate has re- volved around the upper-mantle structure beneath the Kaapvaal craton in southern Africa (Fig. 1). Unlike many shields, which display average elevations 400–500 m above sea level, the sur- face topography in southern Africa reaches 1–2 km above sea level, with residual bathymetry in the surrounding oceans of more than 500 m (Nyblade & Robinson 1994). There is much contro- versy as to how this area of high topography, termed the ‘African Superswell’ (Nyblade & Robinson 1994), is compensated and whether it originates from either a lower- or upper-mantle source of buoyancy. Lithgow-Bertelloni & Silver (1998) and Gurnis et al. (2000), for example, suggested that dynamic topography generated by a large-scale upwelling originating at the core–mantle boundary supports the high elevations across southern Africa. Other studies have suggested that buoyancy from a thermal anomaly in either the lithosphere (Nyblade & Sleep 2003) or the asthenosphere (Burke et al. 2003; Li & Burke 2006; Burke & Gunnell 2008) might support the superswell. To distinguish between these competing models, many studies have examined the upper-mantle velocity structure beneath parts of southern Africa. Evidence of a thermal anomaly in the uppermost mantle may be manifested either as an anomalously thin lithospheric lid with lower than average lid velocities or as an anomalously large or an anomalously slow low-velocity zone (LVZ). Results from modelling regional P waves, as well as body wave tomogra- phy, show high velocities extending to 300–400 km depth beneath southern Africa, with little evidence for a LVZ beneath the region (Zhao et al. 1999; James et al. 2001; Fouch et al. 2004). Inversion of fundamental mode surface-wave phase delays displays radial anisotropy throughout the upper mantle but no LVZ, indicating a thick lithosphere (Freybourger et al. 2001; Saltzer 2002). Inversion of both two-station fundamental-mode Rayleigh wave phase veloc- ities and multiscale finite-frequency Rayleigh wave phase residuals yield similar results (Larson et al. 2006; Chevrot & Zhao 2007). However, other studies using multimode high-frequency surface wave data (Priestley 1999; Priestley et al. 2006) and Rayleigh wave tomography (Li & Burke 2006) find a high velocity lid beneath much of southern Africa, with a lid thickness between 160–200 km for the Kaapvaal craton, underlain by a ∼150 km thick LVZ associated with a ∼4% shear velocity (V S ) decrease. Joint mod- elling of regional SH waves and mineral physics data also suggests a pronounced LVZ beneath southern Africa, with V S reductions of at least 5% beneath a 150-km-thick, high-velocity lithospheric lid (Wang et al. 2008). A 150–200-km-thick lid beneath the Kaapvaal craton is consistent with lithospheric thickness estimates inferred from heat flow measurements and from pressure–temperature esti- mates, based on kimberlite nodule data (Ballard & Pollack 1988; Jones 1988; Rudnick & Nyblade 1999; Artemieva & Mooney 2001; C 2009 The Authors 1021 Journal compilation C 2009 RAS
Transcript of Upper-mantle low-velocity zone structure beneath the...

Geophys. J. Int. (2009) 178, 1021–1027 doi: 10.1111/j.1365-246X.2009.04178.x
GJI
Tec
toni
csan
dge
ody
nam
ics
Upper-mantle low-velocity zone structure beneath the Kaapvaalcraton from S-wave receiver functions
Samantha E. Hansen,1 Andrew A. Nyblade,2 Jordi Julia,1 Paul H.G.M. Dirks3
and Raymond J. Durrheim3
1Department of Geosciences, 407 Deike Bldg., Pennsylvania State University, University Park, PA 16802, USA. E-mail: [email protected] of Geosciences, 447 Deike Bldg., Pennsylvania State University, University Park, PA 16802, USA3School of Geosciences, University of the Witwatersrand, Private Bag X3, Wits 2050, South Africa
Accepted 2009 March 10. Received 2009 February 9; in original form 2008 October 3
S U M M A R YThe southern African Plateau is marked by anomalously high elevations, reaching 1–2 kmabove sea level, and there is much debate as to whether this topography is compensated bya lower mantle source or by elevated temperatures in the upper mantle. In this study, we useS-wave receiver functions (SRFs) to estimate the lithospheric thickness and sublithosphericmantle velocity structure beneath the Kaapvaal craton, which forms the core of the Plateau. Tofit the SRF data, a low-velocity zone (LVZ) is required below a ∼160-km-thick lithosphericlid, but the LVZ is no thicker than ∼90 km. Although the lid thickness obtained is thinnerthan that reported in previous SRF studies, neither the lid thickness nor the shear velocitydecrease (∼4.5%) associated with the LVZ is anomalous compared to other cratonic environ-ments. Therefore, we conclude that elevated temperatures in the sublithospheric upper mantlecontribute little support to the high elevations in this region of southern Africa.
Key words: Seismicity and tectonics; Cratons; Africa.
I N T RO D U C T I O N
The depth extent of continental lithosphere beneath Archean andProterozoic shields has been debated for many decades (e.g.,MacDonald 1963; Jordan 1975), and much of this debate has re-volved around the upper-mantle structure beneath the Kaapvaalcraton in southern Africa (Fig. 1). Unlike many shields, whichdisplay average elevations 400–500 m above sea level, the sur-face topography in southern Africa reaches 1–2 km above sealevel, with residual bathymetry in the surrounding oceans of morethan 500 m (Nyblade & Robinson 1994). There is much contro-versy as to how this area of high topography, termed the ‘AfricanSuperswell’ (Nyblade & Robinson 1994), is compensated andwhether it originates from either a lower- or upper-mantle sourceof buoyancy. Lithgow-Bertelloni & Silver (1998) and Gurnis et al.(2000), for example, suggested that dynamic topography generatedby a large-scale upwelling originating at the core–mantle boundarysupports the high elevations across southern Africa. Other studieshave suggested that buoyancy from a thermal anomaly in either thelithosphere (Nyblade & Sleep 2003) or the asthenosphere (Burkeet al. 2003; Li & Burke 2006; Burke & Gunnell 2008) might supportthe superswell.
To distinguish between these competing models, many studieshave examined the upper-mantle velocity structure beneath parts ofsouthern Africa. Evidence of a thermal anomaly in the uppermostmantle may be manifested either as an anomalously thin lithospheric
lid with lower than average lid velocities or as an anomalouslylarge or an anomalously slow low-velocity zone (LVZ). Resultsfrom modelling regional P waves, as well as body wave tomogra-phy, show high velocities extending to 300–400 km depth beneathsouthern Africa, with little evidence for a LVZ beneath the region(Zhao et al. 1999; James et al. 2001; Fouch et al. 2004). Inversionof fundamental mode surface-wave phase delays displays radialanisotropy throughout the upper mantle but no LVZ, indicating athick lithosphere (Freybourger et al. 2001; Saltzer 2002). Inversionof both two-station fundamental-mode Rayleigh wave phase veloc-ities and multiscale finite-frequency Rayleigh wave phase residualsyield similar results (Larson et al. 2006; Chevrot & Zhao 2007).However, other studies using multimode high-frequency surfacewave data (Priestley 1999; Priestley et al. 2006) and Rayleigh wavetomography (Li & Burke 2006) find a high velocity lid beneathmuch of southern Africa, with a lid thickness between 160–200km for the Kaapvaal craton, underlain by a ∼150 km thick LVZassociated with a ∼4% shear velocity (VS) decrease. Joint mod-elling of regional SH waves and mineral physics data also suggestsa pronounced LVZ beneath southern Africa, with VS reductions ofat least 5% beneath a 150-km-thick, high-velocity lithospheric lid(Wang et al. 2008). A 150–200-km-thick lid beneath the Kaapvaalcraton is consistent with lithospheric thickness estimates inferredfrom heat flow measurements and from pressure–temperature esti-mates, based on kimberlite nodule data (Ballard & Pollack 1988;Jones 1988; Rudnick & Nyblade 1999; Artemieva & Mooney 2001;
C© 2009 The Authors 1021Journal compilation C© 2009 RAS

1022 S. E. Hansen et al.
Figure 1. Stations from the SASE (black triangles) and AfricaArray (greytriangles) networks, along with GSN station BOSA (white triangle), used inthis study. Grey circles show conversion points at 160 km depth from eventsmeeting the SRF criteria. Bold lines outline the boundaries of labelledtectonic terranes.
Deen et al. 2006; Priestley et al. 2006), but these data sets do notprovide constraints on the nature of the LVZ.
In this study, we use the S-wave receiver function (SRF) tech-nique (e.g., Farra & Vinnik 2000; Li et al. 2004; Kumar et al. 2007)to determine the depth to the lithosphere–asthenosphere boundary(LAB) by identifying S-to-P (Sp) conversions from discontinuitiesbeneath seismic stations in the Kaapvaal craton. Unlike P-wavereceiver functions (PRFs), where crustal multiples can mask con-versions from the LAB, boundary conversions on SRFs can be moreclearly identified because they arrive earlier than the direct S phasewhereas all crustal multiples arrive later (e.g. Farra & Vinnik 2000;Li et al. 2004; Kumar et al. 2007). SRFs have been used in severalprevious studies to investigate the lithospheric structure beneathsouthern Africa (Kumar et al. 2007; Wittlinger & Farra 2007), butnew methodological approaches and data selection criteria warranta re-examination of those results. Our SRF analysis focuses on Spconversions within the southern and central Kaapvaal craton to re-assess both the lithospheric thickness and upper-mantle velocitystructure beneath this region. This approach provides new insightinto what role the LVZ, if one exists, plays in supporting the highelevation in this region of the African Superswell. Our results in-dicate a ∼160-km-thick lid beneath the craton, thinner than thatinterpreted in previous SRF studies (Kumar et al. 2007; Wittlinger& Farra 2007). Additionally, we demonstrate that a LVZ is requiredto fit the SRF data, but the VS decrease associated with the LVZas well as the thickness of the lithospheric lid are not anomalouscompared with other cratonic environments.
DATA A N D M E T H O D O L O G Y
Teleseismic waveform data recorded at various Southern AfricaSeismic Experiment (SASE; Carlson et al. 1996), AfricaArray
(http://africaarray.psu.edu) and Global Seismographic Network(GSN) broad-band stations throughout the Kaapvaal craton wereused in this study (Fig. 1). The SASE stations were deployedbetween 1997 April and 1999 July, and most of the AfricaArraystations were installed in early- to mid-2006; so, each of these net-works provides about 1.5–2 yr of data. Significantly more data wererecorded by GSN station BOSA, which has been operating since1993 February. We selected S waves with high signal-to-noise ra-tios recorded at these stations from earthquakes with magnitudeslarger than 5.7, depths less than 240 km and distances between 60◦
and 80◦. It has been shown that this depth and distance criteria iso-lates true Sp phases from potential contamination by other P-wavephases (Wilson et al. 2006). Our event selection differs from thatused in the Kaapvaal SRF study by Wittlinger & Farra (2007), whoincorporated events with epicentral distances up to 110◦.
Waveforms were first rotated from the N–E–Z to the R–T–Z co-ordinate system using the event’s backazimuth and were visuallyinspected to pick the S-wave onset. The three-component recordswere then cut to focus on the section of the waveform that is 100 sprior to and 12 s after the S arrival. To detect Sp conversions, thedata must be rotated around the incidence angle into the SH–SV–Pcoordinate system (Li et al. 2004). This second rotation is criticalbecause if an incorrect incidence angle is used, noise can be signif-icantly enhanced, and converted phases may become undetectable.The optimal incidence angle was determined using the approachof Sodoudi (2005), as described by Hansen et al. (2007). UsingLigorria & Ammon’s (1999) iterative time domain method, SRFsare generated by deconvolving the SV component from the cor-responding P component. To make the SRFs directly comparablewith PRFs, both the time axes and the amplitudes of the SRFs werereversed (e.g. Farra & Vinnik 2000; Li et al. 2004; Kumar et al.2007). The frequency content of the receiver function is controlledby the Gaussian width factor, a (Ligorria & Ammon 1999). Severalvalues of a were examined; however, the best and most consistentresults were obtained using an a of 1.0.
Once receiver functions were generated for all events at each sta-tion, the data set was subjected to a number of quality control crite-ria not employed in previous SRF studies (e.g. Kumar et al. 2007;Wittlinger & Farra 2007). Each receiver function was first comparedwith previously determined PRFs at the same station to identify thecrust–mantle boundary (Moho) conversion. Across our study area,the crustal thickness is fairly uniform, ranging from about 36 to41 km (Nguuri et al. 2001; Kgaswane et al. 2006, 2008). OnlySRFs that display a clear Moho conversion at the appropriate timewere used for further analysis. Next, the amplitude of the Mohoconversion was examined. Forward modelling was used to predictthe expected Moho amplitude using published averaged velocitiesfor the crust and upper mantle (Niu & James 2002; Larson et al.2006; Li & Burke 2006; Nair et al. 2006; Wang et al. 2008). If theamplitude of the Moho conversion on the SRF was significantly toolarge or too small (±3σ ), indicating an unrealistic velocity contrastacross the crust–mantle boundary, the SRF was discarded. Addition-ally, the conversion points of each SRF were examined to ensure thesame tectonic terrain is sampled. For this study, we focused on thesouthern and central Kaapvaal craton to avoid potential bias fromstructural complexities associated with the Bushveld Complex inthe northern part of the craton and the mobile belts surroundingthe craton (Fig. 1). Previous studies indicate that the lid structureacross the southern and central Kaapvaal craton is fairly uniform(Fouch et al. 2004; Li & Burke 2006). After high-grading the dataset in this manner, we were left with several tens of records, rep-resenting about 10% of the original data set. The percentage of
C© 2009 The Authors, GJI, 178, 1021–1027
Journal compilation C© 2009 RAS

LVZ beneath the Kaapvaal craton from SRFs 1023
Figure 2. Stacked SRF showing the structure of the central and southernKaapvaal craton. The solid black line shows the mean stack while the lightgrey shaded areas indicate the 2σ bootstrap error bounds. The grey dashedline shows an example of the synthetic SRF fit (from model B in Fig. 3).Major converted phases are labelled. The black arrow indicates the depth ofthe LAB reported by Kumar et al. (2007).
useable, high-quality data used in our SRF analysis is comparableto that typically used in PRF analysis for southern Africa (Kgaswaneet al. 2006, 2008); however, fewer events overall are available forSRFs compared with PRFs, given the more restricted depth anddistance range used.
To improve the signal-to-noise ratio and to convert to depth, in-dividual SRFs were moveout corrected and stacked. In previousstudies, moveout correction was applied using a specified referenceslowness (6.4 s deg–1 in Kumar et al. 2007; 8.4 s deg–1 in Wittlinger& Farra 2007), and conversion to depth was performed using eithera simplified local (Kumar et al. 2007) or global (Wittlinger & Farra2007) velocity model. In our approach, individual, high qualitySRFs were corrected and stacked using the method of Owens et al.(2000; Fig. 2). A variety of models with crustal and upper-mantlevelocities appropriate for southern Africa (Niu & James 2002;Larson et al. 2006; Li & Burke 2006; Nair et al. 2006; Wanget al. 2008) were examined to optimize the stack and constraindiscontinuity depths; however, the discontinuity depths varied byonly ∼5 km depending on the choice of model. The final stack wasproduced using a modified version of the IASP91 model (Kennett& Engdahl 1991), with a faster upper crust of 3.5 km s–1, moreappropriate for southern Africa (e.g. Nguuri et al. 2001; Jameset al. 2003; Kgaswane et al. 2006). 2σ bootstrap errors for the stack
were determined using 200 randomly resampled sets of the data(Efron & Tibshirani 1991).
To further constrain the velocity structure, the SRF stack wasmodelled with synthetic receiver functions generated by the reflec-tivity method (Randall 1994). Using a limited grid search procedure,simple 1-D models were constructed for a range of lithospheric man-tle VS values. The VS of the crust, LVZ, and sublithospheric mantle,as well as the boundary depths of the Moho and LAB, were thenallowed to vary for each lid VS to match the amplitude and timingof conversions on the stacked SRF (Fig. 2). Crustal Poisson’s ratiovalues were taken from Nair et al. (2006), whereas the Poisson’sratio at deeper depths was set to be the same as IASP91 (Kennett& Engdahl 1991). We did not attempt to model the sharpness ofthe discontinuities, but rather focused on determining the averagelayer thicknesses and velocity contrasts needed to fit the observedSp conversions.
R E S U LT S
The stacked SRF displays three Sp conversions with robust signalsabove the 2σ uncertainty level. The shallowest, positive conversionat ∼34 km depth (Fig. 2) is best interpreted as the Sp conversionfrom the Moho, and the amplitude of this conversion requires a∼20% velocity increase across the crust–mantle boundary. Thesecrustal estimates match well the results of previous studies acrossthe central and southern Kaapvaal craton (Nguuri et al. 2001;Niu & James 2002; James et al. 2003; Kgaswane et al. 2006,2008; Nair et al. 2006). The trough at ∼160 km depth marksthe only substantial negative conversion on the stack (Fig. 2)and is best modelled as the LAB. To fit the amplitude of thistrough, a velocity decrease of ∼4.5% is required. An additional,positive Sp conversion at ∼225 km depth is also observed, cor-responding to a velocity increase of ∼3.5% (Fig. 2). This con-version may correspond to the Lehmann discontinuity (Lehmann1961) and is comparable to the ‘220 discontinuity’ included in theglobal Preliminary Reference Earth Model (PREM; Dziewonski &Anderson 1981). Modelling of the 2σ bootstrap confidence limitswas used to constrain the range of velocities and depths that fitthe stacked SRF. On average, boundary depths are resolved towithin about ±9 km, and the velocities are resolved to within±0.11 km s−1 (Fig. 2).
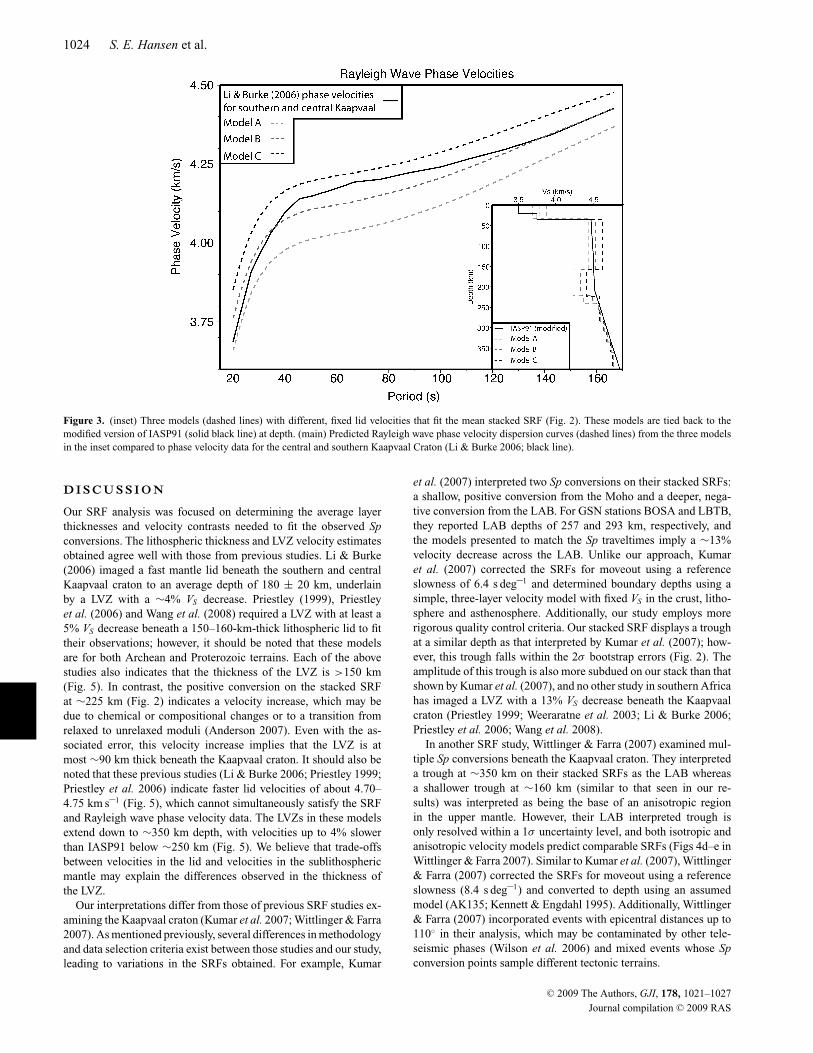
Although receiver functions constrain velocity contrasts acrossdiscontinuities and vertical traveltimes, they do not uniquely con-strain the subsurface velocity structure (Ammon et al. 1990). There-fore, to further test our SRF models, we compared the dispersioncurves predicted by the models to observed dispersion measure-ments. Fig. 3 (inset) shows three different models, with fixed lidvelocities ranging from 4.43 to 4.63 km s–1, which fit the meanstacked SRF. These models are constrained down to ∼225 km; ve-locities at deeper depths were set to match the modified IASP91model used to convert the SRF to depth (Kennett & Engdahl 1991).Forward modelling was used to predict the Rayleigh wave phasevelocities from each model, and these values were compared withdispersion data for the southern and central Kaapvaal craton fromLi & Burke (2006). The predicted dispersion curves from thesemodels bracket the dispersion data (Fig. 3), indicating that our SRFmodels are consistent with surface wave observations. If the modelsare allowed to vary within the SRF 2σ bootstrap error estimates, aneven closer match to the dispersion data can be obtained (Fig. 4).SRF models with lid velocities faster than ∼4.6 km s–1 do not fitthe phase velocity data.
C© 2009 The Authors, GJI, 178, 1021–1027
Journal compilation C© 2009 RAS
1024 S. E. Hansen et al.
Figure 3. (inset) Three models (dashed lines) with different, fixed lid velocities that fit the mean stacked SRF (Fig. 2). These models are tied back to themodified version of IASP91 (solid black line) at depth. (main) Predicted Rayleigh wave phase velocity dispersion curves (dashed lines) from the three modelsin the inset compared to phase velocity data for the central and southern Kaapvaal Craton (Li & Burke 2006; black line).
D I S C U S S I O N
Our SRF analysis was focused on determining the average layerthicknesses and velocity contrasts needed to fit the observed Spconversions. The lithospheric thickness and LVZ velocity estimatesobtained agree well with those from previous studies. Li & Burke(2006) imaged a fast mantle lid beneath the southern and centralKaapvaal craton to an average depth of 180 ± 20 km, underlainby a LVZ with a ∼4% VS decrease. Priestley (1999), Priestleyet al. (2006) and Wang et al. (2008) required a LVZ with at least a5% VS decrease beneath a 150–160-km-thick lithospheric lid to fittheir observations; however, it should be noted that these modelsare for both Archean and Proterozoic terrains. Each of the abovestudies also indicates that the thickness of the LVZ is >150 km(Fig. 5). In contrast, the positive conversion on the stacked SRFat ∼225 km (Fig. 2) indicates a velocity increase, which may bedue to chemical or compositional changes or to a transition fromrelaxed to unrelaxed moduli (Anderson 2007). Even with the as-sociated error, this velocity increase implies that the LVZ is atmost ∼90 km thick beneath the Kaapvaal craton. It should also benoted that these previous studies (Li & Burke 2006; Priestley 1999;Priestley et al. 2006) indicate faster lid velocities of about 4.70–4.75 km s–1 (Fig. 5), which cannot simultaneously satisfy the SRFand Rayleigh wave phase velocity data. The LVZs in these modelsextend down to ∼350 km depth, with velocities up to 4% slowerthan IASP91 below ∼250 km (Fig. 5). We believe that trade-offsbetween velocities in the lid and velocities in the sublithosphericmantle may explain the differences observed in the thickness ofthe LVZ.
Our interpretations differ from those of previous SRF studies ex-amining the Kaapvaal craton (Kumar et al. 2007; Wittlinger & Farra2007). As mentioned previously, several differences in methodologyand data selection criteria exist between those studies and our study,leading to variations in the SRFs obtained. For example, Kumar
et al. (2007) interpreted two Sp conversions on their stacked SRFs:a shallow, positive conversion from the Moho and a deeper, nega-tive conversion from the LAB. For GSN stations BOSA and LBTB,they reported LAB depths of 257 and 293 km, respectively, andthe models presented to match the Sp traveltimes imply a ∼13%velocity decrease across the LAB. Unlike our approach, Kumaret al. (2007) corrected the SRFs for moveout using a referenceslowness of 6.4 s deg–1 and determined boundary depths using asimple, three-layer velocity model with fixed VS in the crust, litho-sphere and asthenosphere. Additionally, our study employs morerigorous quality control criteria. Our stacked SRF displays a troughat a similar depth as that interpreted by Kumar et al. (2007); how-ever, this trough falls within the 2σ bootstrap errors (Fig. 2). Theamplitude of this trough is also more subdued on our stack than thatshown by Kumar et al. (2007), and no other study in southern Africahas imaged a LVZ with a 13% VS decrease beneath the Kaapvaalcraton (Priestley 1999; Weeraratne et al. 2003; Li & Burke 2006;Priestley et al. 2006; Wang et al. 2008).
In another SRF study, Wittlinger & Farra (2007) examined mul-tiple Sp conversions beneath the Kaapvaal craton. They interpreteda trough at ∼350 km on their stacked SRFs as the LAB whereasa shallower trough at ∼160 km (similar to that seen in our re-sults) was interpreted as being the base of an anisotropic regionin the upper mantle. However, their LAB interpreted trough isonly resolved within a 1σ uncertainty level, and both isotropic andanisotropic velocity models predict comparable SRFs (Figs 4d–e inWittlinger & Farra 2007). Similar to Kumar et al. (2007), Wittlinger& Farra (2007) corrected the SRFs for moveout using a referenceslowness (8.4 s deg–1) and converted to depth using an assumedmodel (AK135; Kennett & Engdahl 1995). Additionally, Wittlinger& Farra (2007) incorporated events with epicentral distances up to110◦ in their analysis, which may be contaminated by other tele-seismic phases (Wilson et al. 2006) and mixed events whose Spconversion points sample different tectonic terrains.
C© 2009 The Authors, GJI, 178, 1021–1027
Journal compilation C© 2009 RAS

LVZ beneath the Kaapvaal craton from SRFs 1025
Figure 4. (a) Model providing the closest fit to both the stacked SRF and dispersion data, tied back to the modified IASP91 model at depth. (b) The solidblack line shows the mean stacked SRF from Fig. 2. The grey dashed line shows the fit from the model in (a). Although this model does not fit the mean stack,it is still within the 2σ bootstrap error bounds. (c) Predicted Rayleigh wave phase-velocity dispersion curve (grey dashed line) from the model in (a). A closematch to the phase velocity data for the central and southern Kaapvaal craton (Li & Burke 2006; black line) is obtained.
The average lid thickness and VS reduction in the LVZ beneaththe Kaapvaal craton, inferred from both the SRF analysis and fromprevious studies (e.g. Priestley 1999; Li & Burke 2006; Priest-ley et al. 2006; Wang et al. 2008), are ∼160 km and ∼4.5%, re-spectively, which are comparable to other cratonic environments.Kustowski et al. (2008a,b) investigated the upper-mantle struc-ture beneath the Eurasian and other cratons using a tomographicmodel developed from surface-wave phase velocities, body wavetraveltimes, and long-period waveforms. They found fast-velocityanomalies at 150 km depth beneath the East European Platform,Siberia, and Tibet, but that these fast velocities nearly vanish by
250 km. A similar, strong velocity decrease between 150 and250 km is also observed beneath other cratons in North America,South America, and Australia, and Kustowski et al. (2008a,b) sug-gest that this dramatic velocity decrease likely represents the baseof stable continental lithosphere.
Weeraratne et al. (2003) compared the velocity structure be-neath various Archean cratons using global data sets of funda-mental mode Rayleigh wave phase velocities. Eight cratons wereexamined, including the Kaapvaal, Tanzanian, Canadian, Siberian,Indian, SinoKorean, Yilgarn, and Amazonian cratons. In all cases,LVZs were observed at depths ranging from 150–250 km. With
C© 2009 The Authors, GJI, 178, 1021–1027
Journal compilation C© 2009 RAS

1026 S. E. Hansen et al.
Figure 5. Comparison of the range of models fitting the stacked SRF anddispersion data (thin dashed black line with shaded grey limits) with shearvelocity models for the Kaapvaal craton from Priestley (1999; bold dashedblack line), Li & Burke (2006; solid grey line), and Weeraratne et al. (2003;dashed grey line), all of which display a LVZ in the upper mantle.
the exception of the Tanzanian craton, where the VS reductionassociated with the LVZ was ∼10%, the LVZ beneath all othercratons was found to be associated with a VS reduction of ≤∼6%(Fig. 5; Weeraratne et al. 2003). Grand & Helmberger (1984) exam-ined the velocity structure beneath the Canadian Shield and inferreda ∼150-km-thick, high-velocity lithospheric lid overlying a LVZ,associated with a ∼4% VS decrease. Similar observations have alsobeen made beneath western Australia (Simons et al. 1999) and theBaltic Shield (Olsson et al. 2007).
C O N C LU S I O N S
Given that the LVZ beneath the Kaapvaal craton is not anoma-lously slow and that the lithospheric lid of the craton is notanomalously thin, we conclude that elevated temperatures in thesublithospheric upper mantle do not contribute substantially to thesupport of high surface elevations in this region of the African
Superswell. Cratons elsewhere are characterized by similar lid thick-nesses and are underlain by similar LVZs, but they do not displayunusually high surface topography like that observed in southernAfrica. Therefore, other compensation mechanisms for this portionof the Superswell are likely. For example, excess heat in the litho-sphere, resulting from multiple plume events, could have generateduplift in southern Africa without leaving a detectable seismic signa-ture. By combining the effects of ponded plume head material at thebase of the lithosphere, with additional buoyancy from plume tailslingering beneath the lithosphere for 25–30 Myr, it is possible toaccount for the present-day elevation of southern Africa (Nyblade &Sleep 2003). Alternatively, a large-scale upwelling originating at thecore–mantle boundary may compensate the Superswell topography.Lower-mantle density perturbations are necessary to reproduce thepattern and amplitude of dynamic topography in southern Africa(Lithgow-Bertelloni & Silver 1998; Simmons et al. 2007), and alarge upwelling is consistent with mantle flow models and seismicanisotropy studies (Gurnis et al. 2000; Panning & Romanowicz2004).
A C K N OW L E D G M E N T S
We thank Randy Keller, Mark Muller and an anonymous reviewerfor their thorough critiques of this manuscript. Support for thiswork has been provided by the National Science Foundation, grant0530062. Figures were prepared using GMT (Wessel & Smith1998).
R E F E R E N C E S
Ammon, C., Randall, G. & Zandt, G., 1990. On the nonuniqueness ofreceiver function inversions, J. Geophys. Res., 95, 15303–15318.
Anderson, D.L., 2007. The New Theory of the Earth, Cambridge UniversityPress, Cambridge, UK.
Artemieva, I.M. & Mooney, W.D., 2001. Thermal thickness and evolutionof Precambrian lithosphere: a global study, J. Geophys. Res., 106, 16387–16414.
Ballard, S. & Pollack, H.N., 1988. Modern and ancient geotherms beneathsouthern Africa, Earth Planet. Sci. Lett., 88, 132–142.
Burke, K. & Gunnell, Y., 2008. The African erosion surface: acontinental-scale synthesis of geomorphology, tectonics, and environ-mental change over the past 180 Million years, Geol. Soc. Am. Mem.,201, doi:10.1130/2008.1201.
Burke, K., MacGregor, D. & Cameron, N., 2003. Africa’s petroleum systems:four tectonic “aces” in the past 600 million years, in Petroleum Geology ofAfrica: New Themes and Developing Technologies,Vol. 207, pp. 21–60,eds Arthur, T., MacGregor, D. & Cameron, N., Geol. Soc. Spec. Publ.
Carlson, R.W., Grove, T.L., de Wit, M.J. & Gurney, J.J., 1996. Program tostudy the crust and mantle of the Archean craton in southern Africa, EOS,Trans. Am. Geophys. Un., 77, 273–277.
Chevrot, S. & Zhao, L., 2007. Multiscale finite-frequency Rayleighwave tomography of the Kaapvaal craton, Geophys. J. Int., 169, 201–215.
Deen, T., Griffin, W., Begg, G., O’Reilly, S., Natapov, L. & Hronsky, J., 2006.Thermal and compositional structure of the subcontinental lithosphericmantle: derivation from shear wave seismic tomography, Geochem. Geo-phys. Geosyst., 7, doi:10.1029/2005GC001120.
Dziewonski, A. & Anderson, D., 1981. Preliminary reference earth model,Phys. Earth Plant. Inter., 25, 297–356.
Efron, B. & Tibshirani, R., 1991. Statistical data analysis in the computerage, Science, 253, 390–395.
Farra, V. & Vinnik, L., 2000. Upper-mantle stratification by P- and S-receiverfunctions, Geophys. J. Int., 141, 699–712.
C© 2009 The Authors, GJI, 178, 1021–1027
Journal compilation C© 2009 RAS

LVZ beneath the Kaapvaal craton from SRFs 1027
Fouch, M., James, D., VanDecar, J., Van Der Lee, S. & the Kaapvaal Seis-mic Group, 2004. Mantle seismic structure beneath the Kaapvaal andZimbabwe cratons, S. African J. Geol., 107, 33–44.
Freybourger, M., Gaherty, J., Jordan, T. & the Kaapvaal Seismic Group,2001. Structure of the Kaapvaal craton from surface waves, Geophys.Res. Lett., 28, 2489–2492.
Grand, S.P. & Helmberger, D.V., 1984. Upper mantle shear structure ofNorth America, Geophys. J. R. Astr. Soc., 76, 399–438.
Gurnis, M., Mitrovica, J., Ritsema, J. & van Heijst, H.-J., 2000. Constrainingmantle density structure using geological evidence of surface uplift rates;the case of the African Superplume, Geochem. Geophys. Geosyst., 1,doi:10.1029/1999GC000035.
Hansen, S., Rodgers, A., Schwartz, S. & Al-Amri, A., 2007. Imaging rup-tured lithosphere beneath the Red Sea and Arabian Peninsula, EarthPlanet. Sci. Lett., 259, 256–265.
James, D., Fouch, M., VanDecar, J., Van Der Lee, S. & the Kaapvaal SeismicGroup, 2001. Tectospheric structure beneath southern Africa, Geophys.Res. Lett., 28, 2485–2488.
James, D., Niu, F. & Rokosky, J., 2003. Crustal structure of the KaapvaalCraton and its significance for early crustal evolution, Lithos, 71, 413–429.
Jones, M., 1988. Heat flow in the Witwatersrand Basin and environs andits significance for the South African shield geotherm and lithospherethickness, J. Geophys. Res., 93, 43243–43260.
Jordan, T., 1975. The continental tectosphere, Rev. Geophys., 13, 1–12.Kennett, B. & Engdahl, E., 1991. Traveltimes for global earthquake location
and phase identification, Geophys. J. Int., 105, 429–465.Kennett, B. & Engdahl, E., 1995. Constraints on seismic velocities in the
Earth from traveltimes, Geophys. J. Int., 122, 108–124.Kgaswane, E., Nyblade, A., Julia, J. & Dirks, P., 2006. Upper mantle structure
of Southern Africa from joint inversion of receiver functions and surfacewave dispersion data, EOS, Trans. Am. Geophys. Un. (abstracts), 87,S41E-07.
Kgaswane, E., Nyblade, A., Dirks, P., Pasyanos, M., Julia, J. & Durrheim,R., 2008. Crustal Structure of Southern Africa, EOS, Trans. Am. Geophys.Un. (abstracts), 89, S23A–1866.
Kumar, P., Yuan, X., Ravi Kumar, M., Kind, R., Li, X. & Chadha, R., 2007.The rapid drift of the Indian tectonic plate, Nature, 449, 894–897.
Kustowski, B., Ekstrom, G. & Dziewonski, A.M., 2008a. The shear-wavevelocity structure in the upper mantle beneath Eurasia, Geophys. J. Int.,174, 978–992.
Kustowski, B., Ekstrom, G. & Dziewonski, A.M., 2008b. Anisotropic shear-wave velocity structure of the Earth’s mantle: a global model, J. Geophys.Res., 113, doi:10.1029/2007JB005169.
Larson, A., Snoke, J. & James, D., 2006. S-wave velocity structure, mantlexenoliths, and the upper mantle beneath the Kaapvaal Craton, Geophys.J. Int., 167, 171–186.
Lehmann, I., 1961. S and the structure of the upper mantle, Geophys. J. R.Astr. Soc., 4, 124–138.
Li, A. & Burke, K., 2006. Upper mantle structure of southernAfrica from Rayleigh wave tomography, J. Geophys. Res., 111,doi:10.1029/2006JB004321.
Li, X., Kind, R., Yuan, X., Wolbern, I. & Hanka, W., 2004. Rejuvenation ofthe lithosphere by the Hawaiian plume, Nature, 427, 827–829.
Ligorria, J. & Ammon, C., 1999. Poisson’s ratio variations of the crustbeneath North America, Seism. Res. Lett., 70, 274.
Lithgow-Bertelloni, C. & Silver, P., 1998. Dynamic topography, plate drivingforces and the African superswell, Nature, 395, 269–272.
MacDonald, G., 1963. The deep structure of continents, Rev. Geophys., 1,587–665.
Nair, S., Gao, S., Liu, K. & Silver, P., 2006. Southern African crustalevolution and composition: constraints from receiver function studies,J. Geophys. Res., 111, doi:10.1029/2005JB003802.
Nguuri, T. et al., 2001. Crustal structure beneath southern Africa and its im-plications for the formation and evolution of the Kaapvaal and Zimbabwecratons, Geophys. Res. Lett., 28, 2501–2504.
Niu, F. & James, D., 2002. Fine structure of the lowermost crust beneath theKaapvaal craton and its implications for crustal formation and evolution,Earth Planet. Sci. Lett., 200, 121–130.
Nyblade, A. & Robinson, S., 1994. The African superswell, Geophys. Res.Lett., 21, 765–768.
Nyblade, A. & Sleep, N., 2003. Long lasting epeirogenic uplift from man-tle plumes and the origin of the Southern African Plateau, Geochem.Geophys. Geosyst., 4, doi:10.1029/2003GC000573.
Olsson, S., Roberts, R.G. & Boovarsson, R., 2007. Analysis of waves con-verted from S to P in the upper mantle beneath the Baltic Shield, EarthPlanet. Sci. Lett., 257, 37–46.
Owens, T., Nyblade, A., Gurrola, H. & Langston, C., 2000. Mantle transitionzone structure beneath Tanzania, East Africa, Geophys. Res. Lett., 27,827–830.
Panning, M. & Romanowicz, B., 2004. Inferences on flow at the base ofEarth’s mantle based on seismic anisotropy, Science, 303, 351–353.
Priestley, K., 1999. Velocity structure of the continental upper mantle: evi-dence from southern Africa, Lithos, 48, 45–56.
Priestley, K., McKenzie, D. & Debayle, E., 2006. The state of the uppermantle beneath southern Africa, Tectonophys., 416, 101–112.
Randall, G., 1994. Efficient calculation of complete differential seismo-grams for laterally homogeneous earth models, Geophys. J. Int., 118, 245–254.
Rudnick, R. & Nyblade, A., 1999. The thickness and heat production ofArchean lithosphere: constraints from xenolith thermobarometry and sur-face heat flow, in Mantle Petrology: Field Observations and High PressureExperimentation: A Tribute to Francis R. (Joe) Boyd,Vol. 6, pp. 3–12, edsFei, Y., Bertka, C. & Mysen, B., Geochem. Soc. Spec. Publ.
Saltzer, R., 2002. Upper mantle structure of the Kaapvaal craton fromsurface wave analysis – a second look, Geophys. Res. Lett., 29,doi:10.1029/2001GL013702.
Simmons, N.A., Forte, A.M. & Grand, S.P., 2007. Thermochemical struc-ture and dynamics of the Africa superplume, Geophys. Res. Lett., 34,doi:10.1029/2006GL028009.
Simons, F., Zielhuis, A. & Hilst, R., 1999. The deep structure of theAustralian continent from surface wave tomography, Lithos, 48, 17–43.
Sodoudi, F., 2005. Lithospheric structure of the Aegean obtained from Pand S receiver functions, PhD thesis. Freie Universitat, Berlin, Germany.
Wang, Y., Wen, L. & Weidner, D., 2008. Upper mantle SH- and P-velocitystructures and compositional models beneath southern Africa, EarthPlanet. Sci. Lett., 267, 596–608.
Weeraratne, D., Forsyth, D., Fischer, K. & Nyblade, A., 2003. Evidence foran upper mantle plume beneath the Tanzanian craton from Rayleigh wavetomography, J. Geophys. Res., 108, doi:10.1029/2002JB002273.
Wessel, P. & Smith, W., 1998. New, improved version of the Generic Map-ping Tools released, EOS, Trans. Am. Geophys. Un., 79, 579.
Wilson, D., Angus, D., Ni, J. & Grand, S., 2006. Constraints on the interpre-tation of S-to-P receiver functions, Geophys. J. Int., 165, 969–980.
Wittlinger, G. & Farra, V., 2007. Converted waves reveal a thick and layeredtectosphere beneath the Kalahari super-craton, Earth Planet. Sci. Lett.,254, 404–415.
Zhao, M., Langston, C., Nyblade, A. & Owens, T., 1999. Upper mantle ve-locity structure beneath southern Africa from modeling regional seismicdata, J. Geophys. Res., 104, 4783–4794.
C© 2009 The Authors, GJI, 178, 1021–1027
Journal compilation C© 2009 RAS