
Upgrading the Korean Economy and Industry · Upgrading the Korean Economy and Industry: ... LG...
54
Korea Development Institute Upgrading the Korean Economy and Industry: Challenges and Prospect in the Post-industrial, Creative Economy Age Nov. 3, 2015 Korea Development Institute Cheonsik Woo Senior Fellow, [email protected] This material borrows heavily from “the Korean Economy and Industry: Structural Changes and Challenges”, presentation made at International Seminar on Economic Management and Country Risks, held in Dec. 2012, Taipei, Taiwan.
Transcript of Upgrading the Korean Economy and Industry · Upgrading the Korean Economy and Industry: ... LG...

Korea Development Institute
Upgrading the Korean Economy and Industry: Challenges and Prospect
in the Post-industrial, Creative Economy Age
Nov. 3, 2015
Korea Development Institute
Cheonsik Woo Senior Fellow, [email protected]
This material borrows heavily from “the Korean Economy and Industry: Structural Changes and Challenges”, presentation made at International Seminar on Economic Management and Country Risks, held in Dec. 2012, Taipei, Taiwan.

Contents I. The Korean Economy Today
II. Structural Changes and Challenges
- Overall Picture
III. Manufacturing Sector
IV. Services Sector
V. Prospects and Policy Agendas
[Annex] Venture Business and Creative Ecoomy @Korea

I. The Korean Economy Today

Marked recovery from the 1997 financial crisis and sustained progress Quick recovery and resilience amid the global financial turmoil in the late 2000s
Steady growth; the per capital GDP converging toward a global frontier
>> Sanguine and Robust
1. Based on 2009 purchasing power parity exchange rates. Source: OECD Economic Outlook database.
4

< Korea Now in the Global Context >
Index Ranking
GDP PPP GDP(’13) 13th
GDP per capita (’13) 30th
Trade Exports of goods (’13) – USD 617 bil 5th
Imports of goods and services (’13) – USD 718 bil 7th
Industry Sales of DRAM (’14) 1st
Production of automobiles (’13) 5th
Firms Fortune 500(‘14) 1) 7th
R&D Total expenditure (’11) 6/61
R&D intensity (percentage of GDP) (’11) 2/61
IT Infra ICT Devolopment Index(’14) 2/166
Positioned at upper tier in several core economic dimensions :
Global top 10 or better
1) 17 Korean companies listed: Samsung Electronics (13), SK Holdings (64), Hyundai Motor (100), POSCO (177), LG Electronics (194), Hyundai Heavy Industries (209), Korea Electric Power(212), Kia Motors (246), GS Caltex (260), Hanwha(331), Korea Gas(340), Hyundai Mobis(388), S-Oil (427), Samsung Life Insurance(458), Samsung C&T(460), Lotte Shopping(464), LG Display(482)

Quantitative Growth of Korean Economy
* ( ): World Ranking Source: IMF
Nominal GDP GDP per capita Merchandise Exports

Korean Share of World GDP and World Exports
Source : IMF, World Bank
Korean share of World Exports
Korean share of World GDP
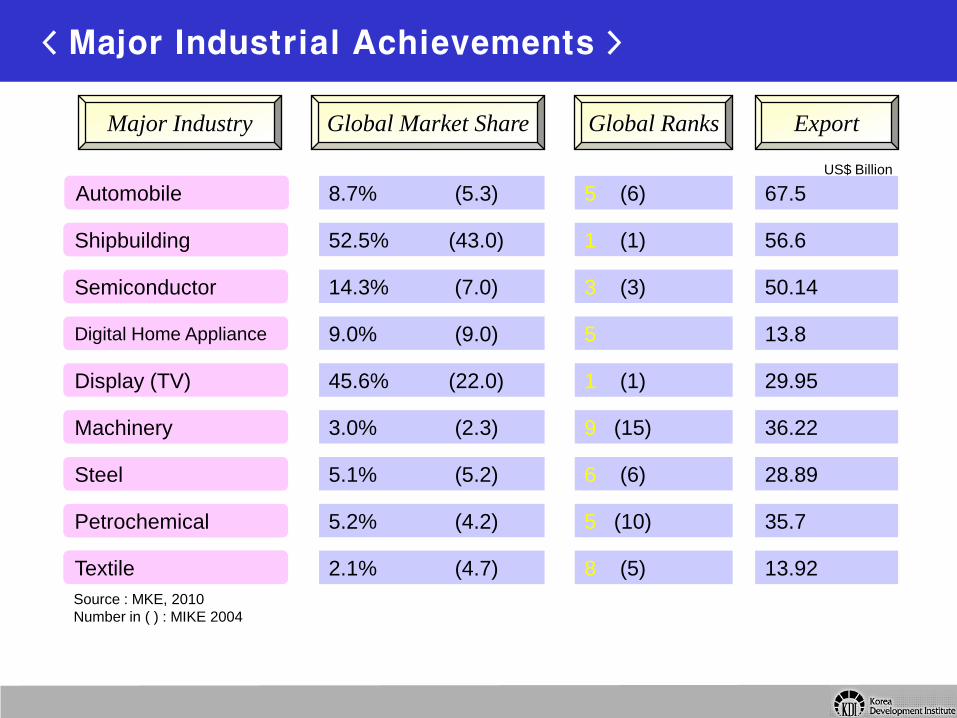
Major Industry Global Market Share
Automobile
Shipbuilding
Semiconductor
Digital Home Appliance
Display (TV)
Machinery
Steel
Petrochemical
Textile
8.7% (5.3)
Global Ranks Export
52.5% (43.0)
14.3% (7.0)
9.0% (9.0)
45.6% (22.0)
3.0% (2.3)
5.1% (5.2)
5.2% (4.2)
2.1% (4.7)
5 (6)
1 (1)
3 (3)
5
1 (1)
9 (15)
6 (6)
5 (10)
8 (5)
67.5
56.6
50.14
13.8
29.95
36.22
28.89
35.7
13.92
US$ Billion
Source : MKE, 2010 Number in ( ) : MIKE 2004
< Major Industrial Achievements >

World Market Share of Korea’s 10 Mainstay Industries
Market Share(‘00~’05)
Market Share(‘09~’11)
Motor Oil refining Machinery Shipbuilding Display Manufacturing
Petro-chemicals
Communication equipment
Source : Woori Finance Research Institute, Korea
Steel
Semiconductor
Fabricated metal

2007 1980 1962 1970 1996 1953
Per Capita GDP (US$)
1990 1945 1998
Big Push Liberation
(1945)
Korean War
(1950~53)
OECD
(1996)
F. Crisis
(1997)
2014
< Transformation of the Korean Economy >
W. F. Crisis
(2007)
6 Five-Year Economic
Development Plans
13,133
8,100
1,051(‘77) 108(‘65) 90 66
23,102
27,963

Advent of Creative Economy

1960 1970 1980 1990 2000 year
Imitating foreign technologies
Indigenizing industrial technologies
Developing advanced technologies
Promoting creative research
Stages
of Development
• KIST(1966)
• MOST(1967)
• GRIs in 1970s
• NRDP(1982~)
• PRIs in 1980s
• Diversification of NRDP
• HAN (1992)
• Commercialization
• Basic research
• Generic technologies
R&D continues to rise fast
4.2 % of GDP (join global leaders)
private-sector dominated (~80%)
more into science-oriented, creative
>> From Imitation => Innovation => Creation
12

Stagnant and unstable economy Losing growth momentum (2-3% yr)
Weakening industrial competitiveness
Widening disparity & Job insecurity
Rapid aging (+ Low fertility)
Internal Strain 세계적 환경변화
Globalization
S&T revolution (IT, NT, BT etc)
BRICs, other Industrializing Nations
( + DDA, FTA)
External Pressure
Fundamental changes under way
- Industrial structure and leading players
- Market and policy environments
* innovation oriented, more market-driven
- Firm behavior/strategy and exterior interaction - Polarization across/ within industries and firms
* mature industrialized -> K-, Creativity –based
Still undergoing “deep & fast” structural changes/ adjustment, strained in the face of a set of overarching challenges
>> But strained heavily - as perceived so inside
13

Ten-years of serious pubic attention and debate in Korea,
since the 1997-98 financial crisis
– Awakened to the limitations of the “old Korean development model”
and industrial/national competitiveness
Comprehensive reforms and a set of new policy initiatives
to enhance competitiveness and move toward a KBE
– Macro Reforms: Financial, Corporate, Labor, Public Sectors
– Micro Sectors: Education, R&D and Innovation, Trade-FDI, Welfare
– The outcome? Views split widely, esp. inside Korea, e.g.
• “stagnant or even retrogressive (Lost decade” polemics)” vs.
• “some progress, but not enough” vs.
• “substantial progress to the point of societal transformation”.
Toward late 2000s, a sign of structural stagnation, with many
leading firms struggling, while a new generation of creative
firms yet to take hold.
– What is the prospect of Korea’s future? What needs to be done?
14
>> Competitiveness Concern in Korea - Context

Growth performance: - more precarious since the 1997 crisis - third business cycles under way now
Long-term potential growth rate: - forecast to fall esp. due to falling labor input (aging problem)
Growth Rate (1961-2011) & Potential Growth (2012-2060) Growth Components (1981-2010)
2. Short-term and potential growth
<Sagging and unstable economy> <Losing growth momentum>
>> Overarching Concern (i)
15 Source: KDI (2012), The Korean Economy: its medium-long term challenges and the direction of fiscal policy
3.1
(%)
1981∼1990 1991∼2000
1.7
7.8
1.2
6.3
0.05
4.57
2001∼2007
Human Capital
TFP
Labor
Capital 3.6
3.2
1.64 0.8
0.9 0.28
1.7
1.0
2.6
2008∼2010
0.25
1.2
0.66
0.75
2.86 GDP per capita

Mounting concern over greater income disparity
Gini-Coefficients (1992~2010)
* Income gap increased among urban wage earners (2/3 of total workforce) +
* among the whole workforce including self-employers and unpaid workers (1/3) => New “Working Poor” groups: SMEs labor, self-employers, and temps
4. Income Disparity < Rising Income Disparity and Poverty>
0.25
0.26
0.27
0.28
0.29
0.30
0.31
0.32
0.33
1992 1994 1996 1998 2000 2002 2004 2006 2008 2010 * share of households with 50% of median income
(%)
Japan UK Sweden Korea
L a t e 2 0 0 0 s
11.1 OECD
15.7
11.0 8.4
15.2
Poverty Rate (after taxes & transfers)
>> Overarching Concern (ii)
16

Manifested since the 90s (esp. since around the mid-1990s) Phase shift from the old Korean model of “equitable, high growth” to “inequitable, low growth” Korea shows steep increase in gini coefficient and slight deterioration in income growth (see below graph)
>> To sum-up: Increasing Disparity amid Lower Growth
17
* The arrows in the graph represent the change of [Avg. annual growth in real household income] from “mid 1980s – mid 1990s”
to “mid 1990s - mid 2000s”

II. Structural Changes and Challenges
– Overall Picture
5. Industrial Restructuring and Declining Competitiveness (1/2)
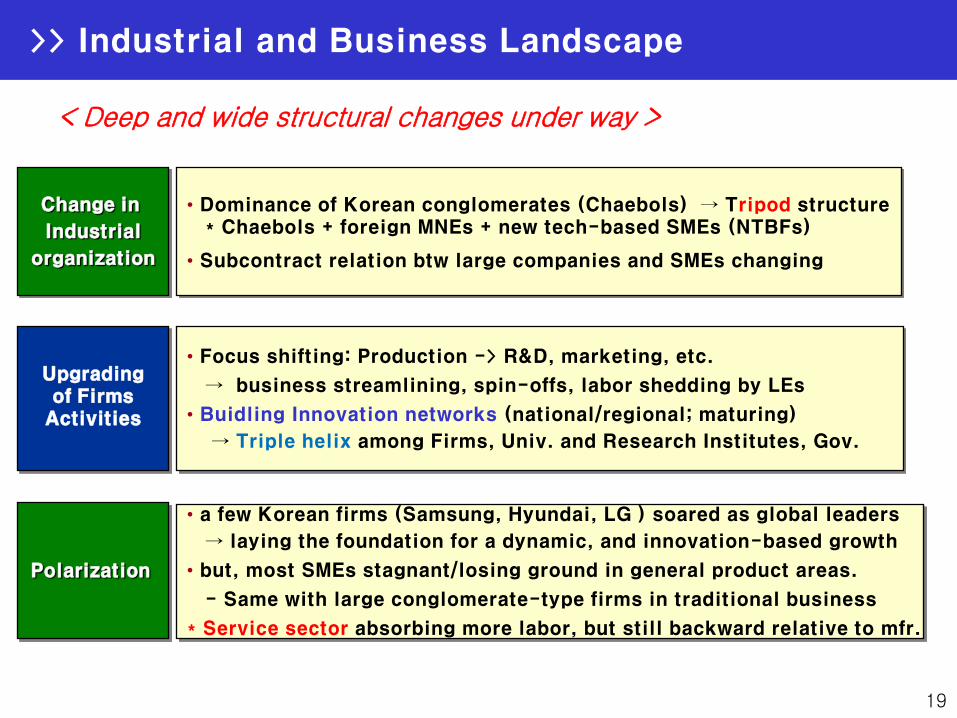
Polarization
• a few Korean firms (Samsung, Hyundai, LG ) soared as global leaders
→ laying the foundation for a dynamic, and innovation-based growth
• but, most SMEs stagnant/losing ground in general product areas.
- Same with large conglomerate-type firms in traditional business
* Service sector absorbing more labor, but still backward relative to mfr.
Change in
Industrial
organization
• Dominance of Korean conglomerates (Chaebols) → Tripod structure * Chaebols + foreign MNEs + new tech-based SMEs (NTBFs)
• Subcontract relation btw large companies and SMEs changing
Upgrading of Firms
Activities
• Focus shifting: Production -> R&D, marketing, etc.
→ business streamlining, spin-offs, labor shedding by LEs
• Buidling Innovation networks (national/regional; maturing)
→ Triple helix among Firms, Univ. and Research Institutes, Gov.
< Deep and wide structural changes under way >
>> Industrial and Business Landscape
19

Drastic changes in economic environment (esp. since the crisis)
=> Rapid progress of Polarization (Divide)
• EducationㆍHRD Investment IT-readiness
• Wage gap increase
• Working-Poor enlarged (SMEs, Temp, Self-employers)
• Manpower
• R&D Capabilites
• Manufactures vs Services
• IT vs Non-IT
• LE vs SMEs
Developed steadily during 90s + amplified during the recent recession Self-sustaining forces in effect now (arguably)
Industries ㆍ Firms
Jobs ㆍ Income
Innovative Capacity
Circular Structure of Polarization
1. Structure
II. Polarization: the New Overarching Challenge >> Threat of a Vicious Circle - Polarization
20

Manufacturing
Services
0
3
6
9
12
15
2001 2002 2003
1/4
2/4 3/4 4/4 2004
1/4
Light Mfr
HCI
-10
-5
0
5
10
15
20
2001 2002 2003 2/4 3/4 4/4 2004
SMEs (< 300)
LE (> 300)
-2
0
2
4
6
8
10
90 92 94 96 98 2000 2002
Growth Gap: Sectors Growth Gap: Industries Earnings by firm size (KOSPI)
-200
0
200
400
600
800
1 2 3 4 5 6 7 8 9 10
(1,000)
Permanent
Contractual
0
5
10
15
20
25
2000 2001 2002 2003
(0.1M KRW)
Wage Gap New Jobs (’93~2002)
Low-Paying High-Paying
0.24
0.25
0.26
0.27
0.28
0.29
0.30
92 95 98 2001 2004
1/4
Gini (Wages)
[Cutting Dimensions of Polarization]
21

1. 개 괄: 양극화의 3대 요인
Global Trends + Industrial Structure + Policy Factors
Forces of Global Mega Trends
Backward Industrialㆍ Employment Structure
Policy Responses (Improper/ Inadequate)
• Globalization
• Rise of China
• ICT etc.
• Weak SMEs (esp. Parts, Materials)
• Over-extended Self-Employers Sector
• Backlogged Reform Unleashed
disruptively after the Crisis
• Imprudent Promotion of Startups / Domestic Demand
• Inadequate Social Safety Net
>> Sources/Causes of Polarization
22

23
Leading vs. Traditional : Mfr Services
Leading vs. traditional at all industries
Pronounced in high-growth, dynamic
industries -> extended into all industries
including traditional services
Hollowing-out of mid-performers
Mfr: HICs including IT vs. Light Mfr
Services: Business-related vs. Traditional
Manufacturing vs. Services since 1990
Productivity gap of services increased
Secto
rs
Ind
ustrie
s
Firm
s
Productivity: Mfr/Services
Productivity Gap
Earnings/Interest Payment Ratio
59
102
143
1990 1997 2003
4.0 3.6 3.2
[Business-related/ Tradt’l Services]
’95 ’98 ’02
5.2
2.6 1.8
[IT/Light mfr]
’95 ’98 ’02
17.0
58.0
27.0
32.5
46.5
22.5
< 0 0 ~ 3 > 3
2003
1998
>> Phases of Progression
>> Stages of Polarization: Industrial & Business Dimensions
23

“Job quality & income disparity” problems largely reflect
Korea’s undeveloped service sector
Employment Real GDP
Korea
Japan
US
Germany
40
50
60
70
80
80 86 92 98 01
(%)
Source: OECD, STAN D/B
Share of the Service Sector
28
Service sector has expanded steadily in employment while Real GDP has remained stagnant at 50~52% Low-productivity of services
>> Manufacturing vs. Services : De-industrialization
24

25
Widening gap against the manufacturing sector and abroad
Services absorbed labor released from mfr. since early 1990s,
while productivity gap against mfr. increased rapidly*
(1M KRW/day)
Marked productivity increase in the Korean mfr after the financial crisis
* 4% (’85-’97) 11.7% (’99 ~) * led by flagship companies in electronics, auto.
Employment Share Labor Productivity
0
10
20
30
40
50
60
70
80
1984 1987 1990 1993 1996 1999 2002 2005 2008
Services
Manufacturing
Agriculture
0
20
40
60
80
100
120
140
160
180
1984 1987 1990 1993 1996 1999 2002 2005 2008
Agriculture
Manufacturing
Services
>> Productivity of the Services Sector in Korea
25

Trends in the Service Sector Productivity(1991-2009)

II. Manufacturing Sector in Korea

0
5
10
15
20
25
30
1991 1994 1997 2000 2003 2006 2009
T&C Chemicals Machinery Auto E&E
0
5
10
15
20
25
1980 1985 1990 1995 2000 2005 2009
T&C Chemicals Machinery Auto E&E
E&E (Electronics and electricals) : high growth trend both in VA and export
Auto: steady gain especially in exports
Machinery: stable/stagnant (mild recovery from the 1997 crisis)
T&C (textiles and clothing): Sharp trend decline; very pronounced in exports
Chemicals: stable (gaining in exports)
>> Sectoral Performance
Robust growth; but notable structural changes/upgrading
Value-added Shares by Sectors Exports Shares by Sectors
28

12
8.3 7.6 8 8.4 8.3 8.2
3.29 2.04 2.64 2.43 2.18 2.4
2.58
0
4
8
12
1994 1995 1996 1997 1998 1999 2000
New Trends after the Financial Crisis Technological Capabilities
1993 1997 2000
The Venture-Authorized 2042* 11392**
Firms with R&D Labs 1114 2278 6307
Tech. Develpoment 7.7 8.0 12.0
Exports Share (%) - 31* 42.9**
Debt Ratio (%) 255.23 305.48 192.56
Capital-Assets Ratio (%) 28.15 24.66 34.18
* 1998, ** 2001
Industrial composition: Continuous structural upgrading over time
Trend changes set in after the financial crisis
* Light manufactures HCIs, * Low-tech High-tech etc. * technological/innovative capabilities built up steadily esp. since 90s
* Venture boom and surging –up of start-ups
* Forging up of NTBFs (substantial in number) * Stepped R&D efforts in general * More into export market (export propensity up) * Financially more sober (lower debt ratio)
Point to potentials of the Korean SMEs (hitherto suppressed dynamism)
# firms investing in tech. (%)
R&D spending/sales (%)
2) Trend Change after the Financial Crisis – Qualitative Dimensions
>> Notable Structural Upgrading…
29

For all positive changes, most Korean SMEs remain inapt and vulnerable
* ‘Passive’ or ‘Reactive’ in overall business orientation and capabilities
- unable to proactively respond to rapid structural changes under way
- accustomed to surval under government protection/support
* especially weak in technological (R&D) capabilities
- SMEs with technological innovation capabilities: about 20%
(higher than in the past way, but still below advanced countries (30~40%)
* also weak in other upstream & downstream activities
- design, marketing (esp. international), brand-exploitation etc.
* professional business services market under-developed
4) Overall Competitiveness Position of the Korean SMEs
>> But still struggling – SMEs Issue
30

31
Productivity Gap against Large Firms
Actually productivity gaps increased across industries and across all size groups
- though most pronounced in the Korea’s leading industries: electronics
* labor productivity: SME’s gap against large firms enlarged steadily
* TFP: SMEs once outperformed large firms → reversed during ’90~’97 → gap widening - TFP growth during 1998~1991: SMEs 8.87 vs. LEs = 15.21
Productivity Gaps (1)
0
20
40
60
80
100
120
140
160
180
200
1984 1990 1995 2002
1-9 10-19 20-99 100-299 >300
0
2
4
6
8
10
12
14
16
18
20
1985-1989 1989-1997 1998-2002
(%)
1-9 10-19 20-99 100-299 > 300
◆ Labor Productivity ◆ Total Factor Productivity
Size groups are in number of employees
As a result, gaps against big leading firms widened
Source: KDI 2003
31

32
R&D share of LEs (%)
240
SMEs as against LEs (’03, %)
Wage
Welfare Expenditure
Industrial Casualties
Training expenses in payroll
66
56
28
Gaps against large firms in R&D and human resources substantial/ widening
wages and working conditions are inferior -> chronic labor shortage - esp. 1/3 of SMEs face shortage of technicians and engineers despite abundant supply of technical HS, jr. college, and university graduates (most acute in traditional industries, and small firms with employees under 50
labor turnover ratio: 2~3 time higher than LEs
Source and Outcome of Gaps
Human Resources
Prime R&D resources rests with big companies, esp. top 5 star companies (Samsung, LG, Hyudai Motors, etc.); about 40%
Within SMEs, gap is widening btw NTBFs and traditional SMEs
R&D Resources
0
10
20
30
40
50
60
70
1999 2000 2001 2002 2003 2004 2005 2006 2007 2008
top5
top20
top10
>> SMEs Productivity Gap : Sources
32

Polarization within & across businesses/industries etc. 1) between SMEs and Large Companies, 2) Among SMEs (and among Large Companies as well)
* determining factors: individual competence for proactive response - firm size per se matters less * NTBFs prosper alongside leading big companies & foreign MNEs; others in struggle
3. Challenges and Policy Agendas
LE AVG
SME AVG
Time
Performance
(Productivity,
Profitability)
Traditional Pattern
LE AVG
SME AVG
Emerging & Amplifying Pattern
Frontier LE
Marginal LE
Frontier SME
Marginal SME
Time
Performance
(Productivity,
Profitability)
>> Polarization within the Manufacturing Sector : All-out
33

Export share & Income-generating effect Income generating effect of exports(GDP/export)
Week SME competitiveness taxes Korea more and more Polarization btw Exports & Domestic Demand
* Import-dependency keeps rising (equipment machine:94 (’98) 137 (’03))
* Spillover of exports falling since mid 90s (esp. in IT sector)
- employment creating effect : 25.8 (’95) 15.7 (’00)
Export Share (%)
IGE
Auto
Machinery
Semi-
Conductor
Chemicals
IT
Equipment
0.3
0.4
0.5
0.6
0.7
0.8
0 5 10 15
1990
1995
2000
※ Income-generating effect of advanced nations: Japan 0.89 (’00), US 0.91(’90)
0.50
0.55
0.60
0.65
0.70
0.75
1980 1985 1987 1990 1995 2000 2005 2007 2009
0.63
0.56
0.64
0.61
0.53
0.60
>> Parts, Materials, and Machinery – Most Critical
34

IV. Services Sector in Korea

36
Since 1990, employment gain in services occurred mostly in low-productivity traditional services sector
Employment in high-productivity sectors stagnant/reduced Negative correlation btw productivity increase & employment gain
Productivity & Employment Changes in Korea’s Services (‘92~’02)
Labor Productivity (10T KRW/hr)
Em
plo
yees (
10T p
ers
ons
Wholesale Retail
Hotelsㆍ Restaurants
TransportationㆍStorageㆍ Telecom.
FinanceㆍInsurance
Real EstateㆍBusiness
Eduㆍ R&D
Medicalㆍ Health
Others
0
50
100
150
200
250
300
350
400
450
1000 2000 3000 4000 5000 6000
92
97 2002
TST
Others
Health
Edu
Real Estate ㆍBusiness
FinanceㆍIns Sales
0
2
4
6
8
10
-6 -4 -2 0 2 4 6 8
Productivity Growth (%)
Em
p’t G
row
th
Res-Hotels
Services Average
<< Backward Traditional Services (1/2) >
36

0
50
100
150
200
250
300
0 2000 4000 6000 8000 10000 12000
Wholesale/Retail
Restaurants/ Hotels
Etc
Transport /Storage/Telecom
Health/ Welfare
Finance/ Insurance
Real Estate/ Business
education
Productivity & Employment Changes in Korea’s Services (‘92~’08)
The basic pattern sustains toward 2010
37

3. 산업ㆍ고용 구조의 취약성(2): 과다한 자영업주 비중(1/2) 12
Agr/ Fishery
24.7
19.6
Mfr
10.0 8.4
Const- ruction
5.7 7.1
W/R
28.4 25.8
Fppd/ Hotels
11.1 11.1
Trans/ Telecom
5.2 7.8
R.Estate/ Business
3.8 5.1
Personal/ Social
10.4
14.4
Employment Shares of Self-Employers (%)
down up
1995 2003
Persistent problem of easy entry and excessive presence
Share in the whole workforce: 27~28% since 1990 (600 M in ’03, 27.3%)
* 4th highest in the OECD (US 7.3%, Japan 10.8%, Germany 10.1%, Taiwan 16.0%)
Concentrated in : Wholesale/Retail (25.8%), Agr/Fishery(19.6%),
Personal/Social services (14.4%)
Aging under way: 40-yrs old & more 62%(’95) 72%(’03)
Employment Shares of Self-Employers (%) Across OECD Countries
>> Self-Employers Sector in Korea
38
V. Prospects and Policy Agendas

1. 정 책 방 향 (2/2)
Secure the Maximum Performance of the Fore-runners
+
Pull-out the Potentials of the Others for Self-lifting
Nurture Global Leaders
Cultivate Emerging Markets
Galvanize Stagnant Players
Upgrade/Preserve HRs
Health, Public Adm.
Other Social Services
Vanguard Firms
NTBFs
KIS
SMEs
Traditional Services Education / Training
Social Safety Net
1. 정 책 방 향 (1/2) >> Four Pillars of Strategy
40

41
Not a reduction of realized disparity through traditional welfare (re-distribution or protection) measures But ensuring of maximum economic dynamism with expansionary re-generation of productive resources
Neither a traditional welfare approach or single minded pro-growth
approach will not work because :
Korea is situated in a “low growth – high disparity” trap due to
structural (not cyclical) causes
1. 정 책 방 향 (1/2)
Cross-hauling, co-development strategy for the leading sectors and backward sectors alike
Unleash/encourage leading groups to make global players
=> strengthen “growth locomotive” for now and near future
Re-motivate and re-empower yet-feeble (vulnerable) players
to join leading groups in future
=> foundation for long-term stable growth with social cohesion
>> Basic Perspective & Strategy
41
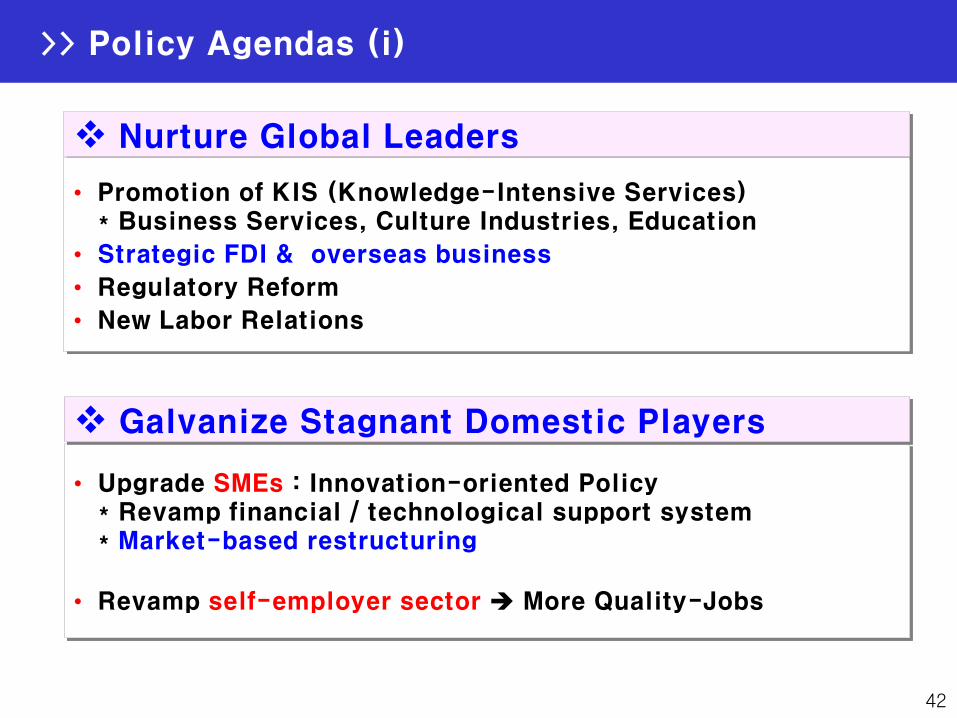
다. 정책과제 Ⅰ: 성장선도 부문의 세계 일류화
Nurture Global Leaders
• Promotion of KIS (Knowledge-Intensive Services) * Business Services, Culture Industries, Education
• Strategic FDI & overseas business
• Regulatory Reform
• New Labor Relations
• Upgrade SMEs : Innovation-oriented Policy * Revamp financial / technological support system * Market-based restructuring
• Revamp self-employer sector More Quality-Jobs
Galvanize Stagnant Domestic Players
>> Policy Agendas (i)
42

Cultivate Emerging Markets in Social Services
2. 정 책 여 건
Upgrade/Preserve HRs
29
Upgrade FET system greater upward labor mobility
ALMP for the unemployed / displaced worker Inter-generational
labor mobility
Harness Social Safety Net Social Cohesion & Greater tolerance
for Competition & Reform
Bring personal home-bound services into markets
(e.g. health-caring of the old, child-caring)
Expand / upgrade social employment, Nurture social enterprises
Enhance public services with enough front-line manpower
>> Policy Agendas (ii)
43

Comprehensive plan to upgrade services
Pursuit of FTAs (Korea-US (2010) => as vs. China, Japan, etc)
Switch to innovation-oriented SMEs policy (& start-up)
Creative Economy Initiative (current government)
Ongoing recession
Facilitate overdue ‘restructuring’
Clear-up inherited structural burdens
Sharpen policy on services
Full awakening to the gravity of the problems
=> Various new policy initiatives set off lately
HR base / Learning Capacity
New trends in services
Favorable market factors
Pension reform, Education reform
Financial resources, etc.
But great adversities as well
>> Policy Environments
44

Productivity Changes in Services by Sectors (1993-2009)
Level relative to yr. 1993 (= 100)
30
Toward late 1990s, a new trend appears to set in.
• The modern business-related sectors started to pick up in productivity,
compared to traditional sectors
• After 2000, the service sector created most high-paying permanent jobs
• Services trade balance started to improve recently
(led by banking. logistics)
0
50
100
150
200
250
300
1993 1997 2001 2005 2009
Finance/
Services total
Real Estate/ Business S
Transport/ Storage/ Telecom
>> Emerging Trend in Korean Service Sector
45

46
Cultural Industries
Leapfrogging performance: CinemaㆍBroadcastingㆍGame etc.
GDP share (’02) 6.6%, Average growth rate (’99~’02) 21.1% (World average 5.2%)
Domestic and foreign demand likely to keep growing fast (40 hrs working, Growing exports to Asian market (success of Korean dramas)
Export growth rate (’03, %): Movies 127, Game 50, Broadcasting 30, Characters 24
IT-related services & professional BS are growing fast
Professional BS : Employment growth 7.7% Labor productivity growth 30% (annual average, ’99~’03)
For now, local firms are feeble and subject to restructuring pressure (excessive market entry after the financial crisis)
But good potential to settle and prosper after transitional period - led by foreign MNEs and a group of small, local innovative firms
Business Services
Social Services
Demand conditions are maturing, and many foreign cases to refer to
With prudent public investment to ferment the market and with appropriate institutional arrangements in place, can develop into a self-sustainable industry
25
[Ref] Promising Services in Korea
46

[Annex] Venture Business and Creative Economy@ Korea

Brief History of High-Tech Startup in Korea
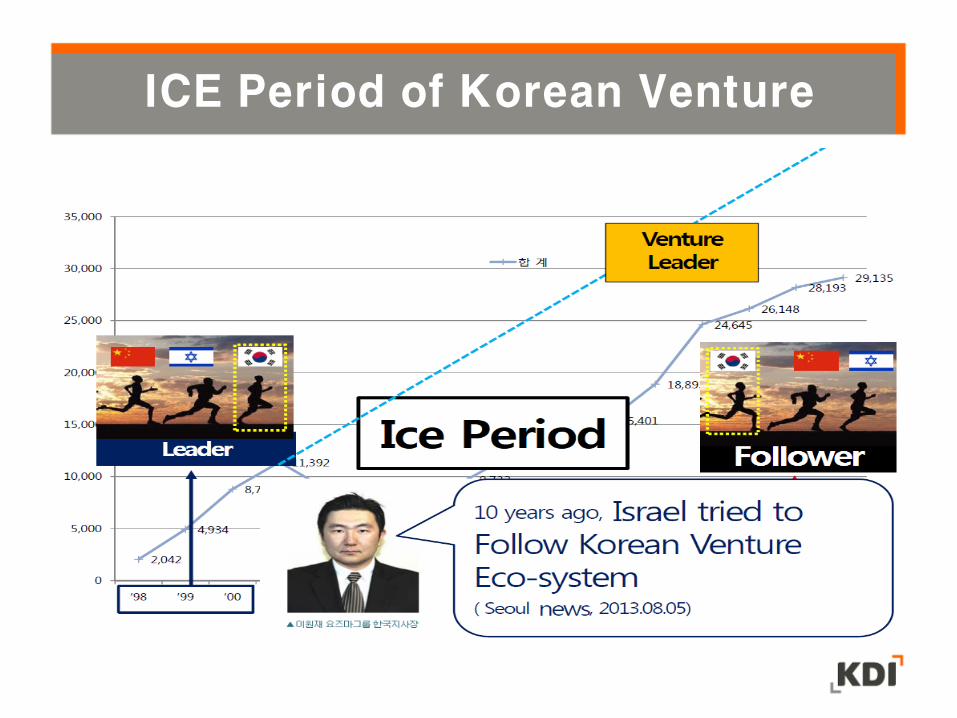
ICE Period of Korean Venture

Venture – 19years Summary


Firm Dynamics in Korea Entry and Exit Ratios(2001~2011)
All industry Entry ratio
All industry Exit ratio
Manufacturing Entry ratio
Manufacturing Exit ratio
Services Entry ratio
Services Exit ratio
Source : Sanghoon Ahan, “Structural Changes and Creative Destruction in the Korean Economy”, Nov. 2013, KDI(PPT presentation) Data Source: Whole country Company Survey, employee standard

Source : Sanghoon Ahan, “Structural Changes and Creative Destruction in the Korean Economy”, Nov. 2013, KDI(PPT presentation) Data Source: Whole country Company Survey
Manufacturing
Firm Dynamics in Korea Entry and Survival by Entry Cohorts(2001~2011)

Venture Ecosystem Type and Feature


