Updates from HDI Corporate · MetricNet - highlight 10 key statistics that all Service Desk...
27
Updates from HDI Corporate October 2015
Transcript of Updates from HDI Corporate · MetricNet - highlight 10 key statistics that all Service Desk...

Updates from HDI Corporate
October 2015

FUSION 15 • November 1st – 5th
• New Orleans, LA
• https://youtu.be/HeWHSrwbztc
• https://youtu.be/5P2fIBsKaJ4
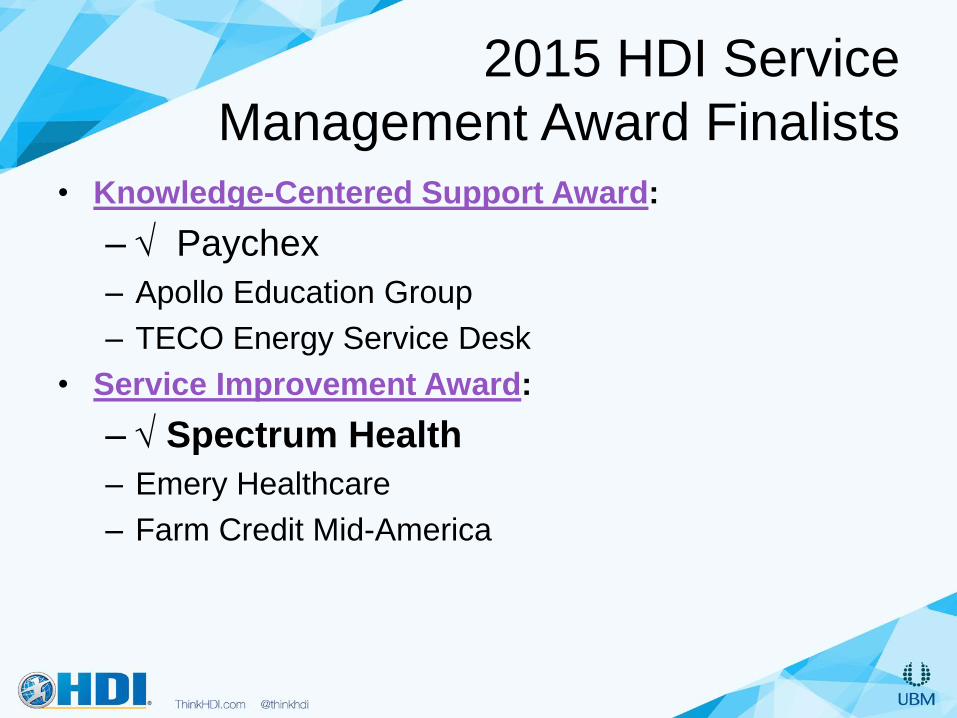
2015 HDI Service
Management Award Finalists
• Knowledge-Centered Support Award:
– Paychex
– Apollo Education Group
– TECO Energy Service Desk
• Service Improvement Award:
– Spectrum Health
– Emery Healthcare
– Farm Credit Mid-America

• September through November:
– Opening Call for Nominations
• November 15, 2015
– Regina LCO - Nominations Close
• November/December:
– Local judging and local award ceremonies take place
• December Local Chapter Meeting:
– Local winners announced
– Name forwarded to Regional Directors
• January:
– Regional judging takes place
• January 31st:
– Regional winners given to HDI Global
• February:
– Regional winners are contacted by HDI Global regarding HDI Annual Conference schedule
and personal interview schedule
• February/March:
– Regional directors make sure travel arrangements and hotel reservations for regional
winners is complete
• April 12 – 15, 2016:
– Regional winners attend HDI Annual Conference 2016 in Orlando
Florida
AoY and DSToY Timeline
September 2015

Upcoming Dates
Book your calendars now:
• November 15 – deadline for AoY and DSToY Awards
• Wednesday December 2 –
AoY / DSToY Awards presentation / holiday fun
• 2016 Speakers lined up – watch for dates!! - January – Sean McKim – ‘Recent Trends and Security Industry Practices’
- Kristin Kurarna Gates - 'Navigating gender in the workplace’
- Colleen Huber – “Overcoming the Confidence Gap”

Survey & Parking Passes
• Please fill out the survey form
• Parking passes for the parkade are located at
the sign in table, please help yourself

11/4/2015
©2013 HDI. All rights reserved.
Why You Need a Metrics Review
About HDI
• HDI is the worldwide professional association and certification body for the technical service and support industry. Facilitating collaboration and networking, HDI hosts acclaimed conferences and events, produces renowned publications and research, and certifies and trains thousands of professionals each year.
• Headquartered in Colorado Springs, CO
• Over 60 local chapters in North America
• Serves a community of over 150,000 worldwide

This Isn’t Easy
Things that are easily measured very rarely get us to what we really want.
— Steve Hultquist, in SupportWorld

• How many of you have conducted a full metrics
review with stakeholders in the last
• Year
• 6 Months
• Quarter
• Month
Quick show of hands…

When was the last time you made any major
changes to either the metrics or the way the are
reported?
• 1 Year or more
• 6 Months – 1 year
• Last quarter
• Last month
Quick show of hands…

Why Think About Changing?
Source: 2013 HDI Support Center Practices & Salary Report

• What job are we doing?
• What are we doing well?
• Where do we need improvement?
• How well are we supporting our
organization?
The Why of Metrics

Flow of Information
Strategic
Tactical
Operational
Based on The Definitive Guide to IT Service Metrics by McWhirter and Gaughan
Focu
sed in
ternally

Pressure
Source: HDI Research – September 2013

If you Shift-Left (drive more difficult technical work to the front line):
• Average Handle Time will go up (at first)
• Speed to Answer will go up (at first)
• First level resolution rate (FLRR) should go up* (that’s the point)
• Mean time to repair/resolve (MTTR) should decrease*
• Customer satisfaction (CSAT) will go up*
*(but maybe not right away)
Metrics Are Related
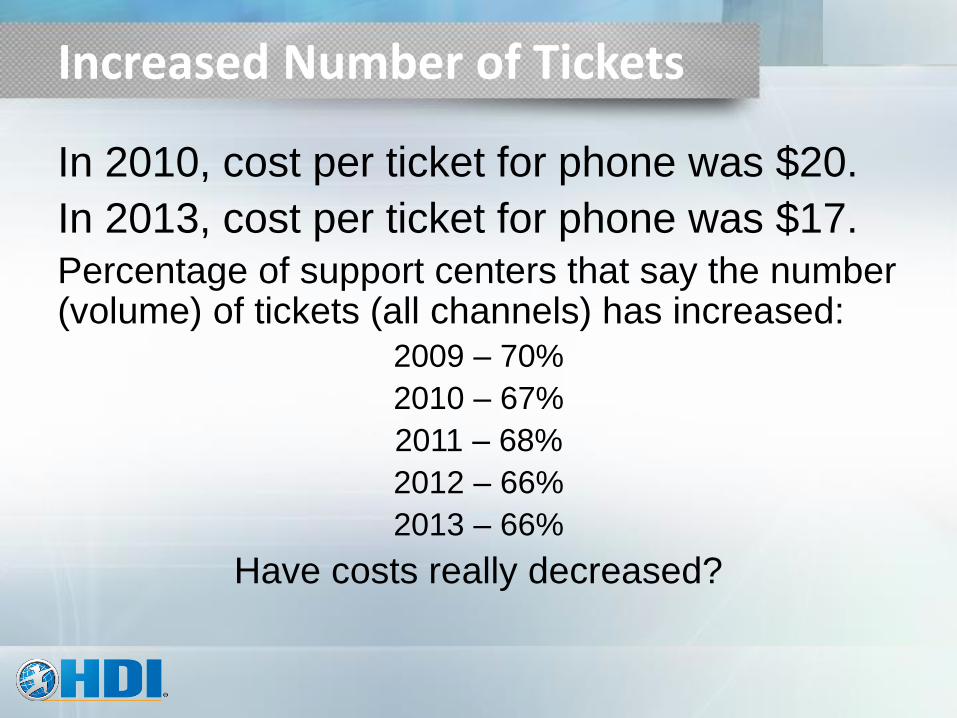
In 2010, cost per ticket for phone was $20.
In 2013, cost per ticket for phone was $17.
Percentage of support centers that say the number (volume) of tickets (all channels) has increased:
2009 – 70%
2010 – 67%
2011 – 68%
2012 – 66%
2013 – 66%
Have costs really decreased?
Increased Number of Tickets

Fully-burdened cost per ticket
(Total costs ÷ Total number of tickets)
Total costs = $1.3M/yr | Total # tickets = 52,000/yr
$1.3M ÷ 52,000
Fully burdened cost per ticket = $25
Total costs = $1.3M/yr | Total # tickets = 76,000/yr
$1.3M ÷ 76,000
Fully burdened cost per ticket = $17
Cost itemization calculator available to HDI members at ThinkHDI.com
How Metrics Affect Each Other

• % vs. targets set in SLA
• Level Zero Solvable
• The difference in MTTR between tickets
resolved at L1 vs. Escalated
• Escalated vs. L1 Solvable
• ∆ for everything
More Qualitative

What if we posted…
Days without any Interrupted User Minutes (IUM)…
IUM = number of affected users × duration of interruption (min.)
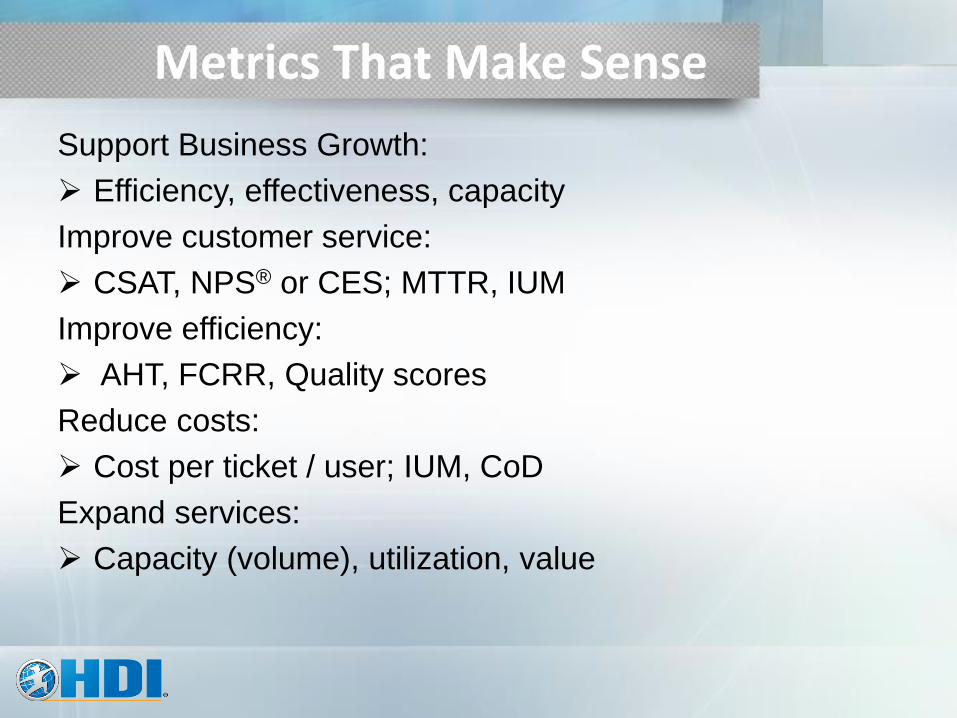
Support Business Growth:
Efficiency, effectiveness, capacity
Improve customer service:
CSAT, NPS® or CES; MTTR, IUM
Improve efficiency:
AHT, FCRR, Quality scores
Reduce costs:
Cost per ticket / user; IUM, CoD
Expand services:
Capacity (volume), utilization, value
Metrics That Make Sense

Change of Focus
Activities Outcomes
Quantitative Qualitative
How many times are we…? How well are we…?
We resolve tickets. We help produce business results.

Perform a Metrics Review
• Understand the desired business outcomes
• Determine which metrics most closely reflect the desired outcomes
• Work with senior management to ascertain the who, when and how of metrics reporting
• Revise and refine
• Schedule periodic reviews
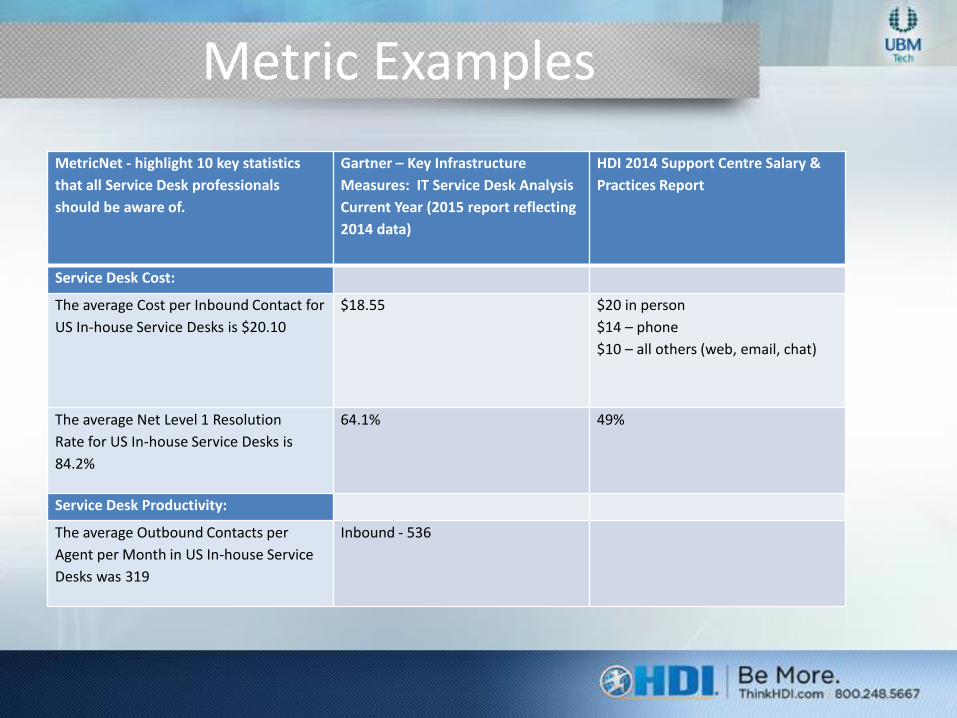
Metric Examples
MetricNet - highlight 10 key statistics
that all Service Desk professionals
should be aware of.
Gartner – Key Infrastructure
Measures: IT Service Desk Analysis
Current Year (2015 report reflecting
2014 data)
HDI 2014 Support Centre Salary &
Practices Report
Service Desk Cost:
The average Cost per Inbound Contact for
US In-house Service Desks is $20.10
$18.55 $20 in person
$14 – phone
$10 – all others (web, email, chat)
The average Net Level 1 Resolution
Rate for US In-house Service Desks is
84.2%
64.1% 49%
Service Desk Productivity:
The average Outbound Contacts per
Agent per Month in US In-house Service
Desks was 319
Inbound - 536

Metric Examples
Service Desk Service Level:
The average Call Abandonment Rate for US In-house Service
Desks is 6.7%
7.8% 5% target
The average % of Calls Answered in 30 Seconds in US In-
house Service Desks is 56.7%
ASA 46 seconds 21 – 30 seconds target
Service Desk Quality:
The median Net First Contact Resolution Rate for US In-house
Service Desks is 70%
64.1% 68.3%
Service Desk Agent:
The average Agent Tenure for US In-house Service Desks is
36.3 months. One Service Desk nearly tripled that number at
118.9 months!
26% - 2 years, 26% - 3 years, 13% - 1 year
The median Annual Agent Training Hours for US In-house
Service Desks is 30
48% - 1-5 days
The average Agent Schedule Adherence for US In-house
Service Desks is 85.8%
Service Desk Contact Handling:
The average Inbound Contact Handle Time (all contacts) for
US In-house Service Desks is 9.75 minutes
8 – 10 minutes – all channels
Science of Metrics
Further reading: Metrics for the
New World of Support


![[Webinar] 3 Key Ways Service Desk Automation Can Support DevOps](https://static.fdocuments.us/doc/165x107/587ada721a28ab542b8b5141/webinar-3-key-ways-service-desk-automation-can-support-devops.jpg)