Types of Maps Mercator Projections Conic Projections Gnomonic Projections Topographic Maps.

Updated Projections of Gas and Electricity
Used in LNG
Prepared for
Australian Energy Market Operator
Lewis Grey Advisory
LG004 | Final Public Report
26 October 2015

Updated Projections of Gas & Electricity used in LNG
Lewis Grey Advisory
i
Project Name
Project no: LG004
Document title: Updated Projections of Gas & Electricity used in LNG
Revision: Final Report
Date: 26 October 2015
Client name: AEMO
Lewis Grey Advisory
ACN 603 435 874
20 Gordon Street
Deepdene VIC 3103
T +61 3 9816 8307
M +61 40908 9555
Document history and status
Revision Date Description Approved
1 29/09/15 First draft R Lewis
2 06/10/15 Revised draft R Lewis
3 26/10/15 Final report R Lewis

Updated Projections of Gas & Electricity used in LNG
Lewis Grey Advisory
ii
Contents
Executive summary .......................................................................................................................................................................... iv
Terms of reference ............................................................................................................................................................................. iv
This report .......................................................................................................................................................................................... iv
Summary of findings ............................................................................................................................................................................ v
Projections .......................................................................................................................................................................................... vi
Summary of changes to the projections ............................................................................................................................................ viii
1. Introduction ......................................................................................................................................................................... 1
1.1 LNG exports from Gladstone ................................................................................................................................................ 1
1.2 The export projects ............................................................................................................................................................... 1
1.3 Information cut-off date ......................................................................................................................................................... 1
2. Scenarios ............................................................................................................................................................................. 2
2.1 Determining factors ............................................................................................................................................................... 2
2.2 Scenario selection................................................................................................................................................................. 2
3. Methodology........................................................................................................................................................................ 3
3.1 Overview ............................................................................................................................................................................... 3
3.1.1 Historical data ....................................................................................................................................................................... 3
3.1.1.1 Exports .................................................................................................................................................................................. 3
3.1.1.2 Gas production ..................................................................................................................................................................... 3
3.1.1.3 Electricity usage .................................................................................................................................................................... 4
3.2 Gas exported ........................................................................................................................................................................ 5
3.3 Energy used in LNG production (liquefaction) ...................................................................................................................... 6
3.3.1 Energy sources ..................................................................................................................................................................... 6
3.3.2 Testing gas usage ................................................................................................................................................................ 6
3.3.3 Liquefaction gas usage ......................................................................................................................................................... 6
3.4 Energy used in gas transmission .......................................................................................................................................... 6
3.5 Energy used in gas storage .................................................................................................................................................. 6
3.6 Energy used in gas supply .................................................................................................................................................... 7
3.6.1 Gas supply ............................................................................................................................................................................ 7
3.6.2 Supply model ........................................................................................................................................................................ 8
3.6.3 Ramp gas.............................................................................................................................................................................. 9
3.6.4 Gas field and processing plant energy usage ..................................................................................................................... 10
3.6.4.1 Operated gas ...................................................................................................................................................................... 10
3.6.4.2 Non-operated gas ............................................................................................................................................................... 12
3.6.5 Total energy usage ............................................................................................................................................................. 12
3.7 Estimates of peak gas and electricity demand ................................................................................................................... 13
3.8 Sensitivity of gas and electricity demand to gas and electricity prices................................................................................ 13
3.9 Potential for demand-side participation by the LNG plants in response to high electricity prices or high electricity demand ............................................................................................................................................................................... 13
3.10 Confidence in the base scenario projections ...................................................................................................................... 13
3.11 Calculating monthly estimates ............................................................................................................................................ 13

Updated Projections of Gas & Electricity used in LNG
Lewis Grey Advisory
iii
4. Projections ........................................................................................................................................................................ 14
4.1 Annual projections .............................................................................................................................................................. 14
4.2 Peak demand projections ................................................................................................................................................... 17
4.3 Monthly projections ............................................................................................................................................................. 19
Appendix A. Abbreviations
Disclaimer
This report has been prepared solely for the Australian Energy Market Operator for the purpose of assessing
gas and electricity use in LNG production. Lewis Grey Advisory bears no liability to any party (other than
specifically provided for in contract) for any representations or information contained in or omissions from the
report or any communications transmitted in the course of the project.

Updated Projections of Gas & Electricity used in LNG
Lewis Grey Advisory
iv
Executive summary
Terms of reference
The Australian Energy Market Operator (AEMO) has engaged Lewis Grey Advisory (LGA) to provide the
following consultancy services:
1. Delivery of an updated report and dataset relating to historical data and forecasts of gas and electricity consumption (annual and maximum/peak daily) related to LNG export for the next 25 years (2014-15 to 2040-41) under various scenarios and conditions.
2. Delivery of an update to the report and to be delivered by 30 September 2015.
3. Provide updates to the forecast triggered by major events as requested by AEMO.
These deliverables should be developed using the Consultant’s analysis and market intelligence as well as direct consultation with industry stakeholders. It is imperative that clear reasoning is provided where the Consultant’s forecasts differ from information provided by stakeholders. The deliverables must be suitable for publishing on the AEMO website. The forecasts themselves will be used as inputs into the NEFR and NGFR. More specifically, this project involves:
Industry (LNG) stakeholder consultation (for report and mid-year update):
a. Review of templates/questionnaires for industry stakeholders
b. Assessing stakeholder responses to questionnaires (if available) and working with AEMO on any required follow-up with industry stakeholders.
Internal AEMO stakeholder consultation through the engagement.
a. Working with key AEMO stakeholders to answer questions on the deliverables and making appropriate revisions to draft deliverables based on AEMO feedback.
b. A transfer of knowledge to members of AEMO's Energy Forecasting team and other teams as appropriate regarding the LNG sector consumption modelling.
Development of a report and mid-year update, suitable for publishing on the AEMO website, detailing forecasts of LNG production (in million tonnes per annum (Mtpa)) from eastern and south-eastern Australia as well as the gas and electricity consumption associated with this production. Key aspects to be addressed as part of this document are described in Section 2.2.
Provision of an Excel database(s) proving data underpinning any chart, figure and/or forecasts presented in the report and the mid-year update.
Provide updates to the forecasts triggered by major events as requested by AEMO on an ad-hoc basis
This report
This report fulfils the September update requirement of item 2) outlined in the Terms of Reference (the first draft
was delivered on 29th September). The public version of the initial report was published by AEMO on its website
in June 2015. Items 1) and 3) have been complied with separately.
As in the initial report the required forecasts of LNG production and the gas and electricity usage associated
with this production have not been derived from information provided by stakeholder questionnaires, as
anticipated in the terms of reference, but are the result of modelling undertaken by LGA based largely on
information in the public domain, much of it provided by the stakeholders on their websites. Use of confidential
material provided by stakeholders is limited to details of production facility capacities and this material and the
results derived from it have been redacted from this report.
Updated Projections of Gas & Electricity used in LNG
Lewis Grey Advisory
v
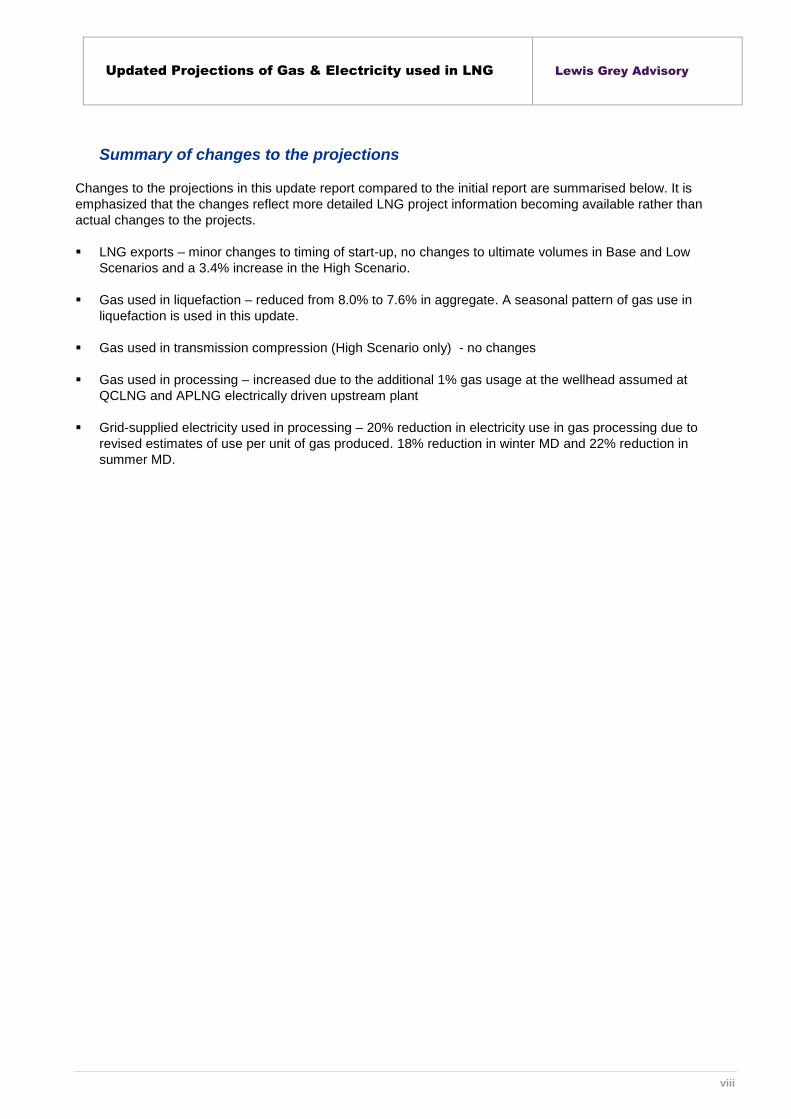
This report documents only the changes made since the initial report, with which it is assumed the reader is
familiar. The changes are generally minor except in relation to grid-supplied electricity usage and reflect more
detailed LNG project information becoming available rather than actual changes to the projects. The High
Scenario also reflects variations to levels of production by the first six LNG trains and the timing of the 7th train.
Summary of findings
Queensland Curtis LNG (QCLNG) commenced exports from its first LNG train on Curtis Island, near Gladstone,
in January 2015. This train was declared “commercial” (delivering LNG cargoes according to contract) and
QCLNG’s second train became operational in July. Gladstone LNG (GLNG) started LNG production in late-
September 2015 and Australia Pacific LNG (APLNG) is scheduled to follow in the final quarter of 2015. Both of
these projects’ second trains are expected to start up in the first half of 2016.
The six LNG trains are each capable of delivering about 3.9 to 4.5 million tonnes of LNG per year when
operating at their nameplate capacities. A fourth major project, that of Arrow Energy, was cancelled as a stand-
alone project earlier this year and Arrow has yet to indicate how it will try to monetise the value of its gas
reserves. Using the gas in a third train at one of the existing projects or another, smaller, project is a widely
canvased option. Arrow’s 50% owner, Shell, is in the process of taking over BG Group, the majority owner of
QCLNG.
The purpose of this study is to provide AEMO with consistent estimates of the gas supply required for export,
including gas used in the supply chain, and grid-supplied electricity usage in the supply chain. The relevant
estimates are used in the preparation of AEMO’s National Electricity Forecast Report (NEFR) and National Gas
Forecast Report (NGFR), ensuring consistency in regard to LNG assumptions in these two reports.
The key elements of the study are:
1. Three scenarios concerning the overall levels of exports.
2. A methodology for estimating electricity and gas used in the LNG supply chain
3. Projections of electricity and gas used in LNG export based on applying the methodology to the scenarios.
Since the data for the initial report was finalised, in early March 2015, the LNG project operators have not
notified external stakeholders of any changes to the projects other than short delays to the start of LNG
production by GLNG and APLNG. Consequently the Base Scenario is as in the initial report but incorporating
these delays.
Likewise LGAs’ methodology for estimating electricity and gas used in the LNG supply chain remains essentially
the same but with updated parameter estimates. However further information about the projects upstream
energy use has been obtained through AEMO’s discussions with LNG project representatives and an APLNG
report released through its regulatory approval process1, referred to as Reference 1 in the remainder of the
report.
These factors contribute to a small increase in LGAs’ estimates of gas used in gas liquefaction and gas
production and a material decrease in LGA’s estimates of grid-supplied electricity used in gas production.
1 Upstream Basis of Design, APLNG Upstream Project. Attachment 2 to APLNG application to construct Talinga-Condabri Interconnect Pipeline.
Available at www.dilgp.qld.gov.au

Updated Projections of Gas & Electricity used in LNG
Lewis Grey Advisory
vi
Projections
Updated total LNG export projections are presented in Figure E 1, together with the equivalent projections from
the initial 2015 report (dashed lines). The Base and Low scenarios are unchanged in the long run while the High
scenario is 3.4% higher as production at the six existing trains is now set at 110% of the Base scenario instead
of plant capacity. Export levels range from 20 Mtpa in the Low scenario to over 30 Mtpa in the High scenario.
However each scenario takes slightly longer to ramp up owing to later start up at GLNG and APNG than
assumed in the initial report and the assumed delay to the 7th train.
Figure E 1 Total LNG export projections
Figure E 2 and Figure E 3 show the total gas usage and total grid electricity usage respectively. The energy
usage figures include estimates of energy usage in third party gas production.
For gas usage, the Base and Low scenario updated projections are approximately 7% higher than the initial
2015 projections due to the additional gas usage assumed at QCLNG and APLNG electrically driven upstream
plant (refer to section 3.6.4), slightly offset by lower usage in liquefaction. The High scenario is 10% higher after
2026 owing to the additional 3.4% of LNG production. In energy terms the increases in gas usage range from 7
PJ per year in the Low Scenario to 15 PJ per year in the High Scenario.
The updated electricity usage projections are each approximately 20% lower than the equivalent initial 2015
projections, mainly due to the revised estimates of the electricity requirements for gas compression (refer to
section 3.6.4). In energy terms the reductions in electricity usage range from 1,600 GWh per year in the Low
Scenario to 2,200 GWh per year in the High Scenario. The potential for material revisions to these estimates
was foreshadowed in the initial report.
0
10
20
30
40
Mtpa
High Update
Base Update
Low Update
High 2015
Base 2015
Low 2015

Updated Projections of Gas & Electricity used in LNG
Lewis Grey Advisory
vii
Figure E 2 Total gas used in liquefaction and production
Figure E 3 Total grid electricity usage
0
50
100
150
200
PJ
High Update
Base Update
Low Update
High 2015
Base 2015
Low 2015
0
3000
6000
9000
12000
15000
GWh
High Update
Base Update
Low Update
High 2015
Base 2015
Low 2015
Updated Projections of Gas & Electricity used in LNG
Lewis Grey Advisory
viii
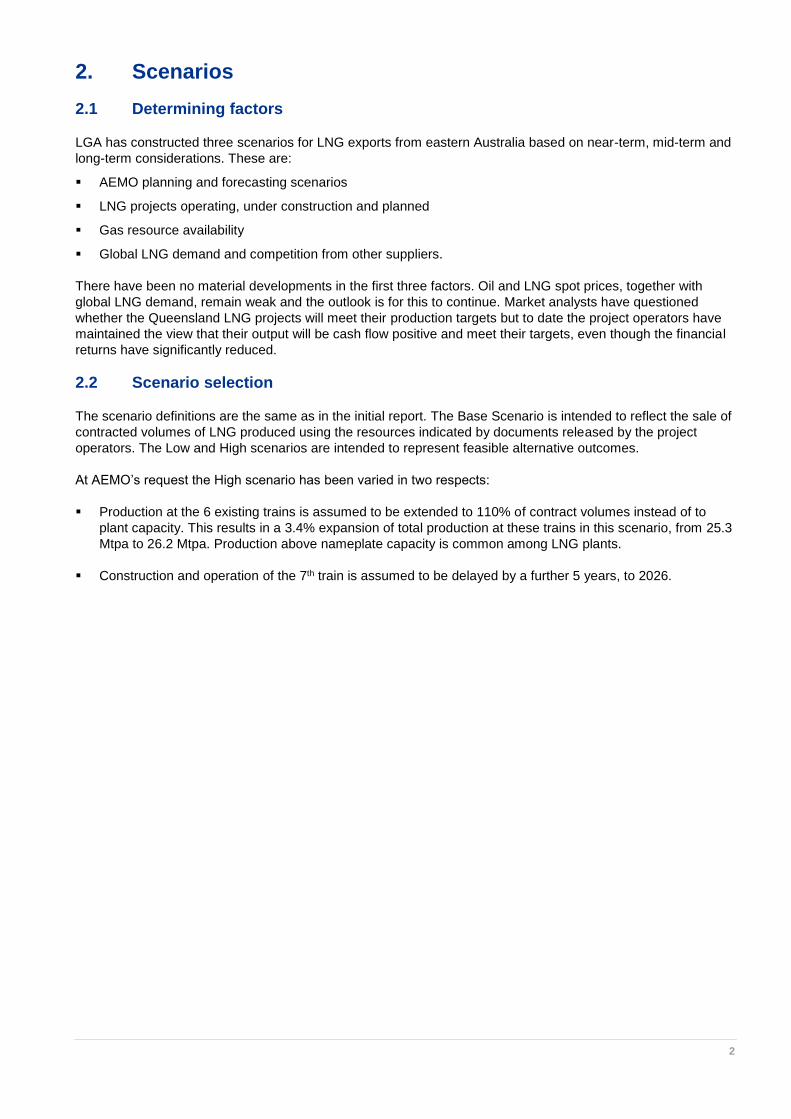
Summary of changes to the projections
Changes to the projections in this update report compared to the initial report are summarised below. It is
emphasized that the changes reflect more detailed LNG project information becoming available rather than
actual changes to the projects.
LNG exports – minor changes to timing of start-up, no changes to ultimate volumes in Base and Low
Scenarios and a 3.4% increase in the High Scenario.
Gas used in liquefaction – reduced from 8.0% to 7.6% in aggregate. A seasonal pattern of gas use in
liquefaction is used in this update.
Gas used in transmission compression (High Scenario only) - no changes
Gas used in processing – increased due to the additional 1% gas usage at the wellhead assumed at
QCLNG and APLNG electrically driven upstream plant
Grid-supplied electricity used in processing – 20% reduction in electricity use in gas processing due to
revised estimates of use per unit of gas produced. 18% reduction in winter MD and 22% reduction in
summer MD.

Updated Projections of Gas & Electricity used in LNG
Lewis Grey Advisory
Updated Projections of Gas & Electricity used in LNG
1
1. Introduction
1.1 LNG exports from Gladstone
This section does not require updating.
1.2 The export projects
Since the initial report was prepared QCLNG’s first LNG train was declared “commercial” (delivering LNG
cargoes according to contract) in May and QCLNG’s second train became operational in July. First LNG from
the first trains of the two other export projects, GLNG and APLNG, has been re-scheduled to late in the
September quarter and in the December quarter respectively. There have been no further announcements
regarding development of the Arrow Energy’s gas reserves.
1.3 Information cut-off date
The modelling documented in this report incorporates information available as at 26th September 2015. Since
that date the following potentially material information has become known:
GLNG exported its first LNG cargo on Friday 16th October
2
2. Scenarios
2.1 Determining factors
LGA has constructed three scenarios for LNG exports from eastern Australia based on near-term, mid-term and
long-term considerations. These are:
AEMO planning and forecasting scenarios
LNG projects operating, under construction and planned
Gas resource availability
Global LNG demand and competition from other suppliers.
There have been no material developments in the first three factors. Oil and LNG spot prices, together with
global LNG demand, remain weak and the outlook is for this to continue. Market analysts have questioned
whether the Queensland LNG projects will meet their production targets but to date the project operators have
maintained the view that their output will be cash flow positive and meet their targets, even though the financial
returns have significantly reduced.
2.2 Scenario selection
The scenario definitions are the same as in the initial report. The Base Scenario is intended to reflect the sale of
contracted volumes of LNG produced using the resources indicated by documents released by the project
operators. The Low and High scenarios are intended to represent feasible alternative outcomes.
At AEMO’s request the High scenario has been varied in two respects:
Production at the 6 existing trains is assumed to be extended to 110% of contract volumes instead of to
plant capacity. This results in a 3.4% expansion of total production at these trains in this scenario, from 25.3
Mtpa to 26.2 Mtpa. Production above nameplate capacity is common among LNG plants.
Construction and operation of the 7th train is assumed to be delayed by a further 5 years, to 2026.

3
3. Methodology
3.1 Overview
The methodology used to produce the updated projections is as described in the initial report.
3.1.1 Historical data
3.1.1.1 Exports
QCLNG shipped the first LNG from Gladstone in the Methane Rita Andrea on the 5th January 2015, having
commenced liquefaction in late December 2014. According to Energy Quest2, the departure of the Maran Gas
Sparta on 27th July marked the 31st cargo and 2 MT of exports. Based on recent gas production rates LGA
estimates that QCLNG is currently running at an annualised production rate of 7MT, equivalent to 87% of
contracts and 82% of nameplate capacity. This level of production is consistent with the Base Scenario in the
Initial Projections, which predicted 7.2 MT in financial 2015/16. Figure 3-1 compares the initial projection with
estimated actuals derived from the above and reflects that QCLNG has met its LNG production targets to date.
Figure 3-1 Initial projection vs estimated actual gas used for LNG (TJ/d)
Source: LGA estimates
3.1.1.2 Gas production
Reported production of CSG by the three projects since October 2014 is shown in Figure 3-2.This clearly shows
QCLNG production ramping up from 400 TJ/d to 1200 TJ/d consistent with steady growth of LNG production,
with a number of major shutdowns. APLNG’s production has also ramped up to 600 TJ/d prior to
commencement of its first LNG train but the same is not true of GLNG. LGA understands that this is due to
GLNG’s Bulletin Board reports being restricted to gas delivered to Wallumbilla rather than the absence of any
ramp gas production. In April 2015 Santos reported that it was injecting gas into the Roma storage at a rate of
100TJ/day3.
2 QCLNG reaches 2 million tonnes of Australian east coast LNG exports, Energy Quest, 28 July 20015
3 Cooper and GLNG Investor Visit (20-23 April 2015)
0
100
200
300
400
500
600
700
800
900
1,000
Q4 2014 Q1 2015 Q2 2015 Q3 2015
TJ/d
Initial projection Estimated Actual

4
Figure 3-2 Daily CSG production
Source: AEMO Gas Bulletin Board
Unfortunately, precise estimates of gas used in LNG production cannot be derived from the QCLNG’s CSG
production figures, owing to the unknown quantities supplied to the domestic market and the unknown
quantities of third party gas used by QCLNG for LNG production. Accurate estimates of gas used in LNG
production could be derived from LNG transmission pipeline gas flows; LGA understands that these will be
available after a second LNG project has started production.
Use of the production data to estimate ramp gas production is described in section 3.6.3 and combined use of
the production data and information regarding electricity usage by the gas processing plants is discussed in
section 3.6.4.
3.1.1.3 Electricity usage
Aggregate electricity usage by the LNG projects to date is presented in Figure 3-3 alongside gas produced at
plants with electrically driven compressors. Electricity use has grown to 7000 MWh/day (an average of 290
MW). The chart also shows a clear correlation of electricity use with gas production, though with periods during
which gas production is relatively lower. Use of this data to derive estimates of electricity usage per unit of gas
produced is described in section 3.6.4.
0
200
400
600
800
1000
1200
1400TJ
QCLNG APLNG GLNG

5
Figure 3-3 Aggregate daily electricity usage vs aggregate electricity powered gas production
Source: AEMO and Gas Bulletin Board, LGA analysis
3.2 Gas exported
The assumed plateau export levels in each scenario are unchanged from the initial report.
Start-up and ramp timing assumptions are presented in Table 3-1.
The Base Scenario is LGA’s interpretation of most recent timing statements by projects:
o QCLNG4: Train 1 (T1) started in December 2014 and reached commercial production in Quarter 2
(Q2) 2015; T2 started up July 2015 and is expected to reach full production by CY 2016
o GLNG5: T1 start up end of Q3 CY 2015, ramp-up over 3-6 months; T2 ready by the end of H2 CY
2015; ramp up over 2-3 years
o APLNG6: T1 start up Q4 CY 2015; sustained production Q2 2016; T2 six months later start up and
sustained production
High Scenario: For all projects acceleration of start-up of either train seems unlikely. Some acceleration of
T2 ramp up is assumed. For the High Scenario “Plateau” means the contract level with the increase to
110% of contracts occurring in 2020.
Low Scenario: First LNG and plateau are delayed relative to Base Scenario for all elements except QCLNG
T1. This would be consistent with minor technical problems prior to or during start-up.
4 BG Group 2014 4th quarter & full year results presentation and transcript (3rd Feb 2015)
5 Cooper and GLNG Investor Visit (20-23 April 2015)
6 ORG Macquarie Conference Presentation May 5 2015
0
200
400
600
800
1000
1200
1400
0
1000
2000
3000
4000
5000
6000
7000
8000
Gas
TJ
Elec
tric
ity
MW
h
Electricity Used Gas Produced

6
Table 3-1 Start-up and ramp-up timing
QCLNG GLNG APLNG
T1 T2 T1 T2 T1 T2
Actual
Start
Actual
Plat
Actual
Start
Plat Start Plat Start Plat Start Plat Start Plat
High Q4 14 Q2 15 Q3 15 Q2 16 Q4 15 Q2 16 Q2 16 Q4 17 Q4 15 Q2 16 Q2 16 Q3 16
Base Q4 14 Q2 15 Q3 15 Q3 16 Q4 15 Q2 16 Q2 16 Q3 18 Q4 15 Q2 16 Q2 16 Q4 16
Low Q4 14 Q2 15 Q3 15 Q4 16 Q4 15 Q3 16 Q4 16 Q3 19 Q1 16 Q4 16 Q3 16 Q2 17
Notes: T1 = Train 1 first gas exported; T2 = Train 2 first gas exported; Plat = Plateau production reached for each train; Q1 =
first quarter of the calendar year etc.
3.3 Energy used in LNG production (liquefaction)
3.3.1 Energy sources
There are no updates for this section.
3.3.2 Testing gas usage
The assumed figure of 10TJ/d is confirmed by Reference 1.
3.3.3 Liquefaction gas usage
Reference 1 states an LNG plant efficiency target of 92.6%, indicating slightly higher efficiency than the 92%
efficiency figure used in the initial report. Since all three plants use the same technology, this figure is used for
all plants in this update, resulting in a decline in the estimates of gas used in LNG production.
Reference 1 also notes that the efficiency has considerable seasonal variation, ranging from 90% in winter to
94.6% in summer. This has been incorporated in the projections, which are calculated on a quarterly basis, by
using the summer efficiency in Q1, the winter efficiency in Q3 and the average efficiency in Q2 and Q4. This
results in seasonal variations in gas and electricity usage and different maximum demands in summer and
winter.
3.4 Energy used in gas transmission
LGA’s assumptions regarding energy used in transmission are as in the initial report.
3.5 Energy used in gas storage
For the same reasons as in the initial report, energy used in underground gas storage is omitted from the
energy usage estimates.

7
3.6 Energy used in gas supply
3.6.1 Gas supply
CSG resources required to support an 8 Mtpa project for 20 years, including gas used in production and ramp
up/down gas, are estimated to be approximately 12,000 PJ7. The principal source of these resources for each
project will be their equity reserves in Queensland CSG, for which updated values are presented in Table 3-2.
Total reserves have grown by 2% compared to the values at 30th June 2014 used in the initial report. Most of
this growth was reported by Arrow Energy.
GLNG and QCLNG also rely upon third party gas supplied under long term contracts. Updated estimates of gas
volumes are reported in Table 3-3. Since the initial report was compiled GLNG has entered a new supply
agreement with Senex Energy, as discussed below.
Table 3-2 LNG project equity and operated Queensland CSG reserves as at 31 December 2014 (PJ)
Equity Operated
QCLNG 10,469 12,262
GLNG 5,865 6,747
APLNG 14,217 11,808
Arrow Energy 8,851 10,447
Others 3,458 1,598
Total 42,860 42,860
Source: Queensland Department of Natural Resources and Mines
Table 3-3 LNG project contracts with third party suppliers
Seller Operator Buyer Source Delivery
Point
Term
(years)
Total
Volume
(PJ)
Annual
Volume
(PJ)
APLNG QCLNG QCLNG Surat CSG Field 20 640 95 falling to
25 after
2016
Santos Santos GLNG Cooper
primarily
Wallumbilla?
15 750 50
AGL QCLNG QCLNG Surat CSG Field 3 75 25
Origin Unknown GLNG OE Portfolio Wallumbilla 10 365 36.5
Origin Unknown QCLNG OE Portfolio Wallumbilla 2 30 15
Origin Unknown GLNG OE Portfolio Wallumbilla
5
100 Firm
94 Sellers
option 20-39
Stanwell Unknown GLNG? Wallumbilla? Wallumbilla? 1.75 53 30
7 Approximately 9,500 PJ for 20 years production plus 2,500 PJ for ramp up/down. Ramp down is the minimum reserves required to support
production of 475 PJ in the 20th year.

8
Seller Operator Buyer Source Delivery
Point
Term
(years)
Total
Volume
(PJ)
Annual
Volume
(PJ)
AGL QCLNG? GLNG Surat CSG Wallumbilla? 7 32 4.6
Meridian
JV
Westside GLNG Bowen CSG GLNG
Pipeline
20 445 24
Sources: Company media statements. A question mark indicates that the relevant information has not been published and that the value in
the table is the best estimate.
Complementary to the first contract, it has been assumed that APLNG will take 70 PJ of its equity share in the
QCLNG operated fields, at the time it reaches plateau LNG production levels in 2016. There are also
arrangements between GLNG and APLNG for GLNG to take approximately 12 PJ pa of equity gas at
Combabula and APLNG to take 35 PJ pa of its equity gas at Fairview.
On 24th September 2015, Senex Energy announced a gas sales agreement with GLNG to be underpinned by
development of the Western Surat Gas Project, located to the north of GLNG’s Roma gas field. The agreement
envisages 50 TJ/d gas sales over a 20 year period. Some gas sales may commence ahead of FID, which is
scheduled for 2017, but full sales would be reached sometime after 2017. The project may share GLNG’s Roma
pipeline and processing facilities and if so could be regarded as an expansion of the Roma project for the
purposes of these projections.
3.6.2 Supply model
The supply model has not been changed for this update but is reproduced in this section because of the
changes to the outcomes reported in this section of the initial report.
For each LNG project, the contracts are separated into “operated” (contracts 1 and 3 above) and “non-operated”
(all other contracts). The non-operated contracts are assumed to be used to their maximum subject to the LNG
plant’s gas requirements, as it is reasonable to assume the contracts all have high take-or-pay provisions. The
operated gas requirement is then the LNG plant requirement, less the relevant non-operated contract volume,
plus supply obligations to other projects. It is also assumed that contracts are not recontracted on termination
but are replaced by additional equity gas.
Figure 3-4 illustrates the application of this approach to GLNG in the Base Scenario. The seasonal variations in
liquefaction use (refer to section 3.6.4) are assumed to be taken up by the gas fields operated by GLNG.

9
Figure 3-4 GLNG Base Scenario gas allocation to operated and non-operated – average daily supply
3.6.3 Ramp gas
As GLNG and APLNG are scheduled to start LNG production in the coming quarter, ramp gas production will
most likely cease during the quarter. Estimates of ramp gas produced to date are shown in Figure 3-5. The
QCLNG and APLNG estimates are broadly similar, rising to levels of approximately 250 TJ/day over 9 month
periods. As noted in section 3.1.1.1, GLNG reports only production that is directed to the domestic market at
Wallumbilla. Figure 3-5 indicates that GLNG did not make any ramp gas available to the domestic market.
Figure 3-5 Ramp gas produced to date
0
200
400
600
800
1,000
1,200
1,400
TJ/d Operated
Non-operated
0.0
50.0
100.0
150.0
200.0
250.0
300.0
Jan
-14
Feb
-14
Mar
-14
Ap
r-1
4
May
-14
Jun
-14
Jul-
14
Au
g-1
4
Sep
-14
Oct
-14
No
v-1
4
Dec
-14
Jan
-15
Feb
-15
Mar
-15
Ap
r-1
5
May
-15
Jun
-15
Jul-
15
Au
g-1
5
TJ/d
QCLNG GLNG APLNG

10
3.6.4 Gas field and processing plant energy usage
3.6.4.1 Operated gas
The primary energy requirements are for field and plant gas compression, with lower requirements for auxiliaries
including water pumping and desalination. Following discussions with LNG project representatives in
conjunction with AEMO, LGA has a clearer understanding of how these functions will be powered:
All three projects are using electric drive compressors at their gas processing plants for most of their new
developments. APLNG plans to use gas engines at some of its smaller, as yet to be constructed,
processing plants (Reference 1).
For new wells GLNG is using electric compression at the well head whereas QCLNG and APLNG are using
gas engines.
All electricity for the above will ultimately be sourced from the Queensland electricity grid. Use of temporary
gas turbines is described in the initial report.
All existing gas powered plant will remain gas powered.
The proportions of electricity and gas powered compression at processing plants in the initial phase of LNG
production (circa 2018) has been estimated assuming that domestic loads are met from existing gas powered
plants, because these are already connected to domestic pipelines (Table 3-4). For QCLNG and GLNG, over
time, as the initial well productivity declines and new wells and processing plants are constructed, which will be
mainly electricity driven, the electricity powered proportion will increase. For APLNG however, because some
new plants will be gas driven, the electricity powered proportion may decline.
Table 3-4 Initial proportions of gas and electricity powered compression at processing plants
QCLNG GLNG APLNG
Gas Powered 12% 11% 2%
Electricity Powered 88% 89% 98%
Source: LGA estimates, assuming domestic markets are supplied from gas powered plant.
Aggregate energy usage for compression and auxiliaries (gas and electric driven) has been estimated using a
combination of:
For gas driven plant, historical CSG plant usage figures published by the Queensland Department of
Natural Resources and Mines;
For electric plant, correlations between CSG plant usage and electricity consumption figures provided to
LGA by AEMO.
For gas-driven plant the values in Sources: AEMO, Gas Bulletin Board
Table 3-5 have been re-estimated using the most recent two years data from January 2013 to December 2014.
The values expressed as a % of net gas produced have changed by just 0.1% from those in the initial report.
11
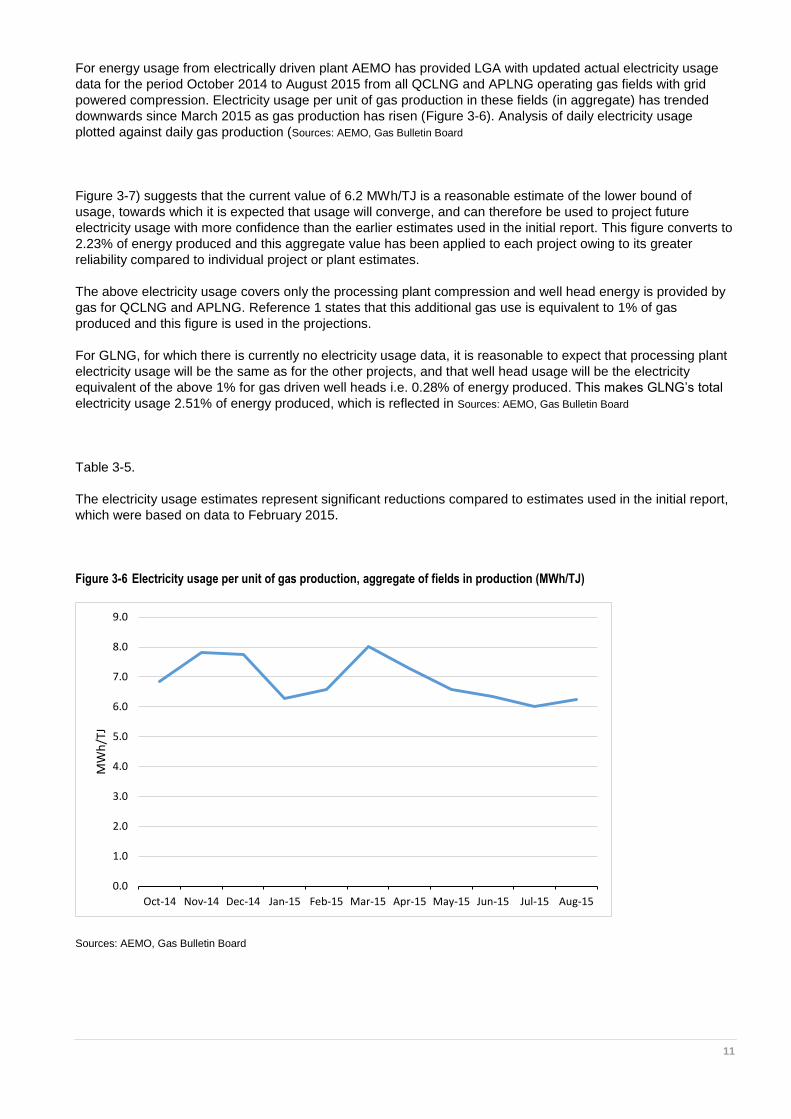
For energy usage from electrically driven plant AEMO has provided LGA with updated actual electricity usage
data for the period October 2014 to August 2015 from all QCLNG and APLNG operating gas fields with grid
powered compression. Electricity usage per unit of gas production in these fields (in aggregate) has trended
downwards since March 2015 as gas production has risen (Figure 3-6). Analysis of daily electricity usage
plotted against daily gas production (Sources: AEMO, Gas Bulletin Board
Figure 3-7) suggests that the current value of 6.2 MWh/TJ is a reasonable estimate of the lower bound of
usage, towards which it is expected that usage will converge, and can therefore be used to project future
electricity usage with more confidence than the earlier estimates used in the initial report. This figure converts to
2.23% of energy produced and this aggregate value has been applied to each project owing to its greater
reliability compared to individual project or plant estimates.
The above electricity usage covers only the processing plant compression and well head energy is provided by
gas for QCLNG and APLNG. Reference 1 states that this additional gas use is equivalent to 1% of gas
produced and this figure is used in the projections.
For GLNG, for which there is currently no electricity usage data, it is reasonable to expect that processing plant
electricity usage will be the same as for the other projects, and that well head usage will be the electricity
equivalent of the above 1% for gas driven well heads i.e. 0.28% of energy produced. This makes GLNG’s total
electricity usage 2.51% of energy produced, which is reflected in Sources: AEMO, Gas Bulletin Board
Table 3-5.
The electricity usage estimates represent significant reductions compared to estimates used in the initial report,
which were based on data to February 2015.
Figure 3-6 Electricity usage per unit of gas production, aggregate of fields in production (MWh/TJ)
Sources: AEMO, Gas Bulletin Board
0.0
1.0
2.0
3.0
4.0
5.0
6.0
7.0
8.0
9.0
Oct-14 Nov-14 Dec-14 Jan-15 Feb-15 Mar-15 Apr-15 May-15 Jun-15 Jul-15 Aug-15
MW
h/T
J

12
Figure 3-7 Aggregate daily electricity usage vs gas production
Sources: AEMO, Gas Bulletin Board
Table 3-5 Energy used in gas production (% of net gas energy produced)
QCLNG GLNG APLNG
Gas driven plant Gas 5.1% 6.4% 6.4%
Electricity driven plant Electricity 2.23% 2.51% 2.23%
Electricity driven plant Gas 1% 0% 1%
Sources: Queensland Department of Natural Resources and Mines; AEMO; Reference 1
3.6.4.2 Non-operated gas
It has been assumed that all non-operated gas is non-grid connected and gas driven, with gas requirements set
at 6.4% of net production, as for GLNG and APLNG above. This has not changed since the initial report.
3.6.5 Total energy usage
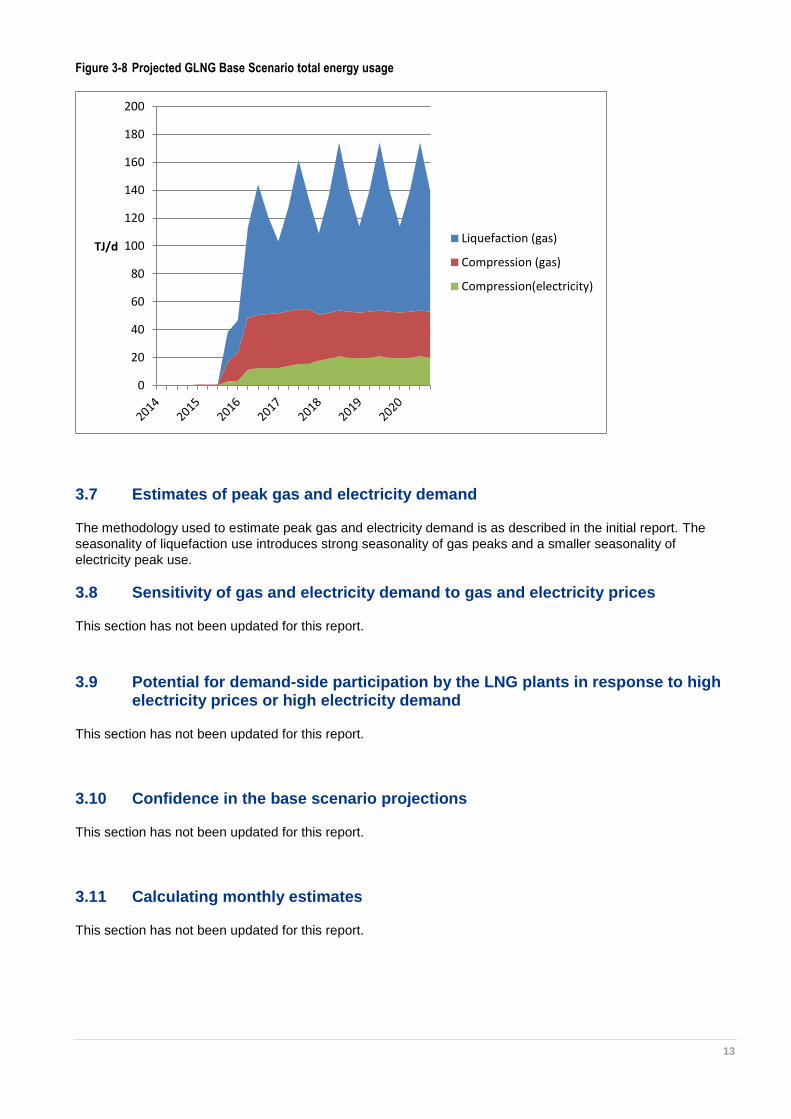
The total Base Scenario energy usage projection for GLNG is shown in Figure 3-8. The total usage falls slightly
at the end of 2019 owing to a switch from gas to electrically driven compression, reflecting the lower energy
requirement of electric compression, though this is largely concealed by the seasonality of liquefaction use.
0.0
1000.0
2000.0
3000.0
4000.0
5000.0
6000.0
7000.0
8000.0
0.0 200.0 400.0 600.0 800.0 1000.0 1200.0
MW
h/d
ay
TJ/day
Actual Lower Bound 6.2 MWh/TJ
13
Figure 3-8 Projected GLNG Base Scenario total energy usage
3.7 Estimates of peak gas and electricity demand
The methodology used to estimate peak gas and electricity demand is as described in the initial report. The
seasonality of liquefaction use introduces strong seasonality of gas peaks and a smaller seasonality of
electricity peak use.
3.8 Sensitivity of gas and electricity demand to gas and electricity prices
This section has not been updated for this report.
3.9 Potential for demand-side participation by the LNG plants in response to high electricity prices or high electricity demand
This section has not been updated for this report.
3.10 Confidence in the base scenario projections
This section has not been updated for this report.
3.11 Calculating monthly estimates
This section has not been updated for this report.
0
20
40
60
80
100
120
140
160
180
200
TJ/dLiquefaction (gas)
Compression (gas)
Compression(electricity)
14
4. Projections
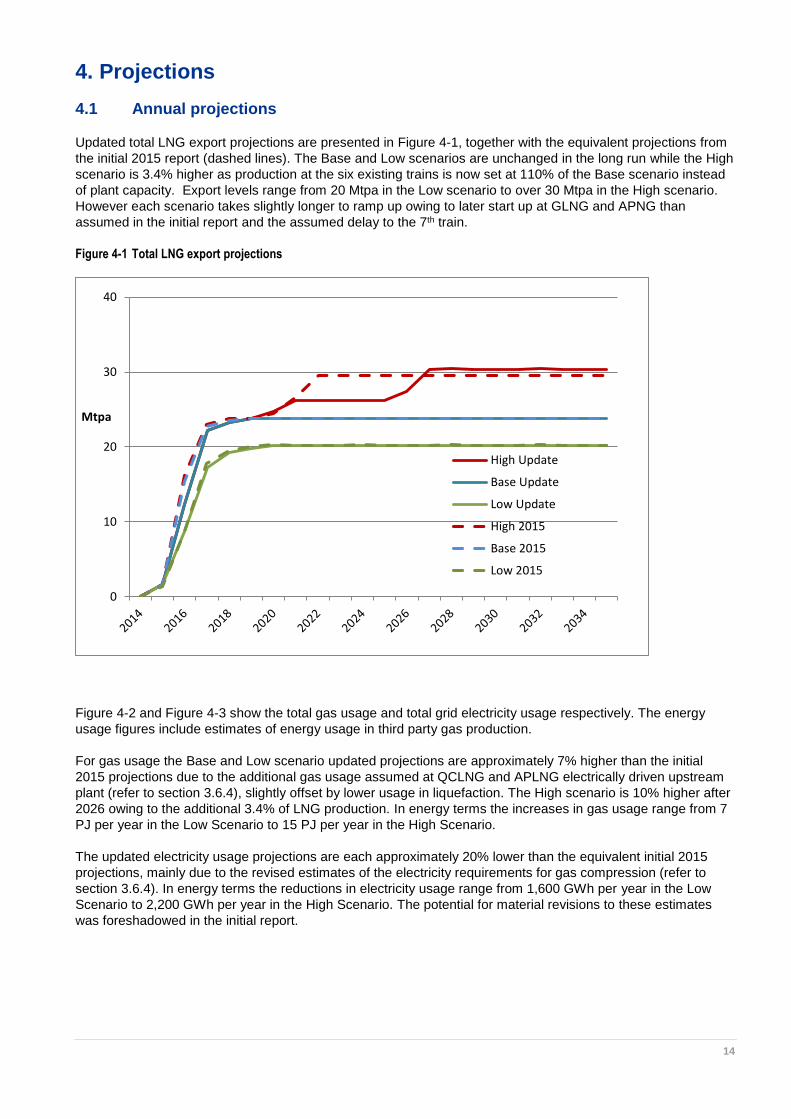
4.1 Annual projections
Updated total LNG export projections are presented in Figure 4-1, together with the equivalent projections from
the initial 2015 report (dashed lines). The Base and Low scenarios are unchanged in the long run while the High
scenario is 3.4% higher as production at the six existing trains is now set at 110% of the Base scenario instead
of plant capacity. Export levels range from 20 Mtpa in the Low scenario to over 30 Mtpa in the High scenario.
However each scenario takes slightly longer to ramp up owing to later start up at GLNG and APNG than
assumed in the initial report and the assumed delay to the 7th train.
Figure 4-1 Total LNG export projections
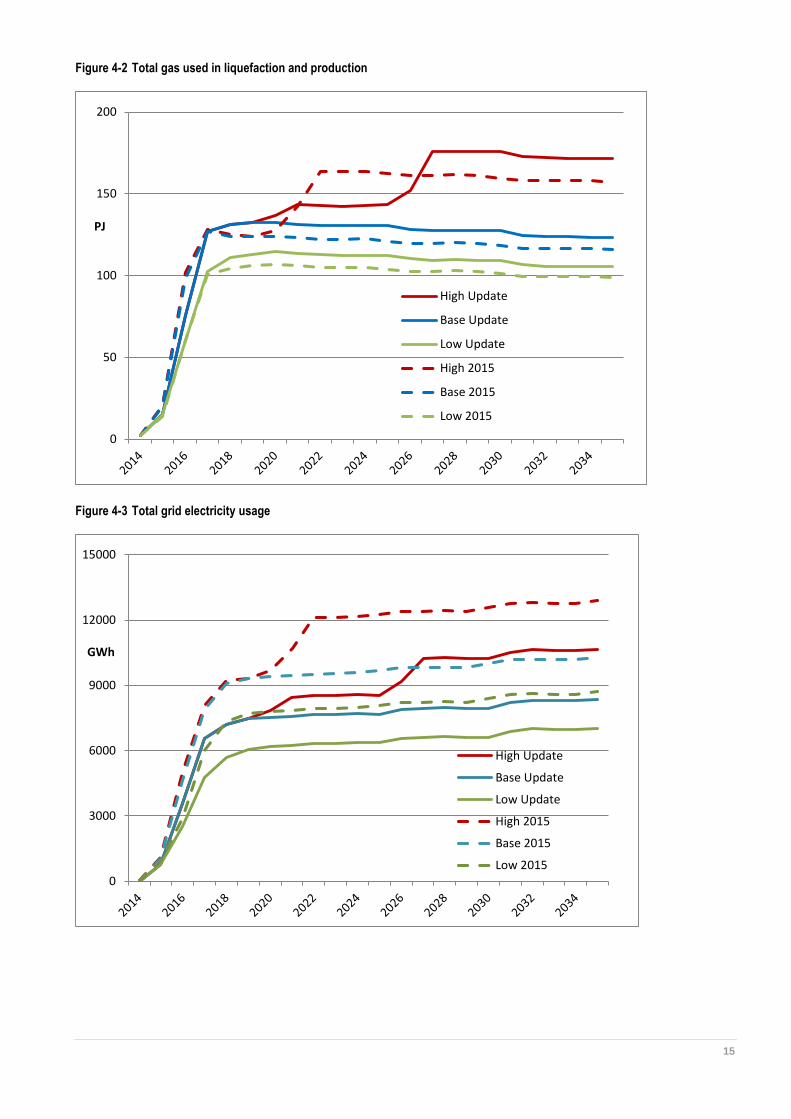
Figure 4-2 and Figure 4-3 show the total gas usage and total grid electricity usage respectively. The energy
usage figures include estimates of energy usage in third party gas production.
For gas usage the Base and Low scenario updated projections are approximately 7% higher than the initial
2015 projections due to the additional gas usage assumed at QCLNG and APLNG electrically driven upstream
plant (refer to section 3.6.4), slightly offset by lower usage in liquefaction. The High scenario is 10% higher after
2026 owing to the additional 3.4% of LNG production. In energy terms the increases in gas usage range from 7
PJ per year in the Low Scenario to 15 PJ per year in the High Scenario.
The updated electricity usage projections are each approximately 20% lower than the equivalent initial 2015
projections, mainly due to the revised estimates of the electricity requirements for gas compression (refer to
section 3.6.4). In energy terms the reductions in electricity usage range from 1,600 GWh per year in the Low
Scenario to 2,200 GWh per year in the High Scenario. The potential for material revisions to these estimates
was foreshadowed in the initial report.
0
10
20
30
40
Mtpa
High Update
Base Update
Low Update
High 2015
Base 2015
Low 2015
15
Figure 4-2 Total gas used in liquefaction and production
Figure 4-3 Total grid electricity usage
0
50
100
150
200
PJ
High Update
Base Update
Low Update
High 2015
Base 2015
Low 2015
0
3000
6000
9000
12000
15000
GWh
High Update
Base Update
Low Update
High 2015
Base 2015
Low 2015

16
Figure 4-4 to Figure 4-6 show each projects’ contribution to the Base Scenario projections, for LNG exports, gas
usage and grid electricity usage respectively. The upstream components of energy usage figures are based on
the upstream gas produced by each project, which is not directly related to its LNG exports owing to production
of equity gas for other projects and use of third party gas. The GLNG project utilises proportionally more gas
and less grid electricity than the other two, owing to its greater reliance on third party gas supply. GLNG’s grid
electricity usage also increases slowly in the longer term, because it is assumed that as third party contracts
end, they are replaced by equity gas which is grid electricity powered.
Figure 4-4 LNG export projections, Base Scenario
Figure 4-5 Gas used in liquefaction and production, Base Scenario
0
5
10
15
20
25
30
MtpaAPLNG
GLNG
QCLNG
0
50
100
150
PJ APLNG
GLNG
QCLNG
17
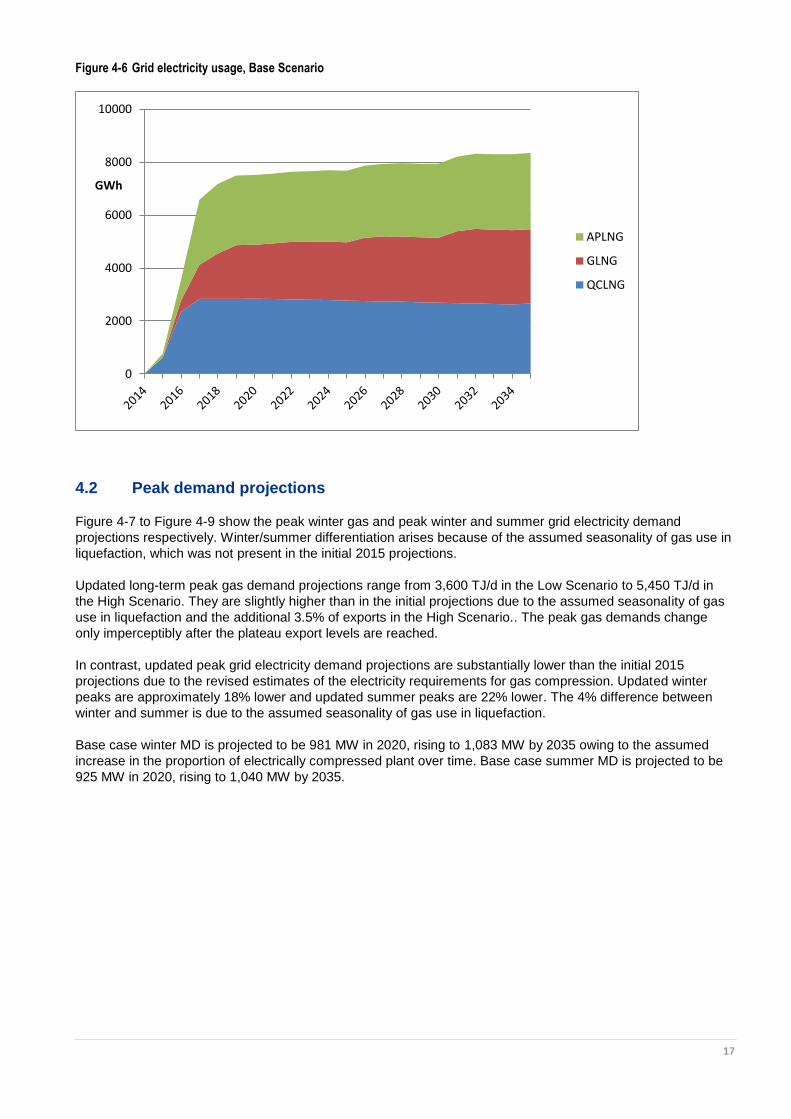
Figure 4-6 Grid electricity usage, Base Scenario
4.2 Peak demand projections
Figure 4-7 to Figure 4-9 show the peak winter gas and peak winter and summer grid electricity demand
projections respectively. Winter/summer differentiation arises because of the assumed seasonality of gas use in
liquefaction, which was not present in the initial 2015 projections.
Updated long-term peak gas demand projections range from 3,600 TJ/d in the Low Scenario to 5,450 TJ/d in
the High Scenario. They are slightly higher than in the initial projections due to the assumed seasonality of gas
use in liquefaction and the additional 3.5% of exports in the High Scenario.. The peak gas demands change
only imperceptibly after the plateau export levels are reached.
In contrast, updated peak grid electricity demand projections are substantially lower than the initial 2015
projections due to the revised estimates of the electricity requirements for gas compression. Updated winter
peaks are approximately 18% lower and updated summer peaks are 22% lower. The 4% difference between
winter and summer is due to the assumed seasonality of gas use in liquefaction.
Base case winter MD is projected to be 981 MW in 2020, rising to 1,083 MW by 2035 owing to the assumed
increase in the proportion of electrically compressed plant over time. Base case summer MD is projected to be
925 MW in 2020, rising to 1,040 MW by 2035.
0
2000
4000
6000
8000
10000
GWh
APLNG
GLNG
QCLNG

18
Figure 4-7 Peak winter gas demand
Figure 4-8 Peak winter grid electricity demand
0
1000
2000
3000
4000
5000
6000
TJ/d
High Update
Base Update
Low Update
High 2015
Base 2015
Low 2015
0
1000
2000
MW
High Update
Base Update
Low Update
High 2015
Base 2015
Low 2015

19
Figure 4-9 Peak summer grid electricity demand
4.3 Monthly projections
Monthly projections of LNG exports, gas usage and grid electricity usage to 2018 are presented in Figure 4-10
to Figure 4-12. High scenarios are not presented because they are the same as Base scenarios over this time
period.
As with the annual projections, the updated LNG export projections are the same as the initial projections apart
from later ramp up. Peaks and troughs in exports are mostly the result of differences in the numbers of days per
month.
For gas usage, the monthly charts reflect the seasonality of liquefaction usage introduced in the updated
projections (most gas is used in liquefaction).
For electricity the seasonality is barely apparent because electricity use is mostly upstream. The differences
between the updated projections and the initial 2015 projections are largely due to the revised estimates of the
electricity requirements for gas compression.
0
1000
2000
MW
High Update
Base Update
Low Update
High 2015
Base 2015
Low 2015

20
Figure 4-10 Total LNG export projections
Figure 4-11 Total gas used in liquefaction and production
0.0
0.5
1.0
1.5
2.0
2.5
MtpaBase Update
Low Update
Base 2015
Low 2015
-2.0
0.0
2.0
4.0
6.0
8.0
10.0
12.0
14.0
16.0
PJ
Base Update
Low Update
Base 2015
Low 2015

21
Figure 4-12 Total grid electricity usage
0.0
100.0
200.0
300.0
400.0
500.0
600.0
700.0
800.0
900.0
GWh
Base Update
Low Update
Base 2015
Low 2015
22
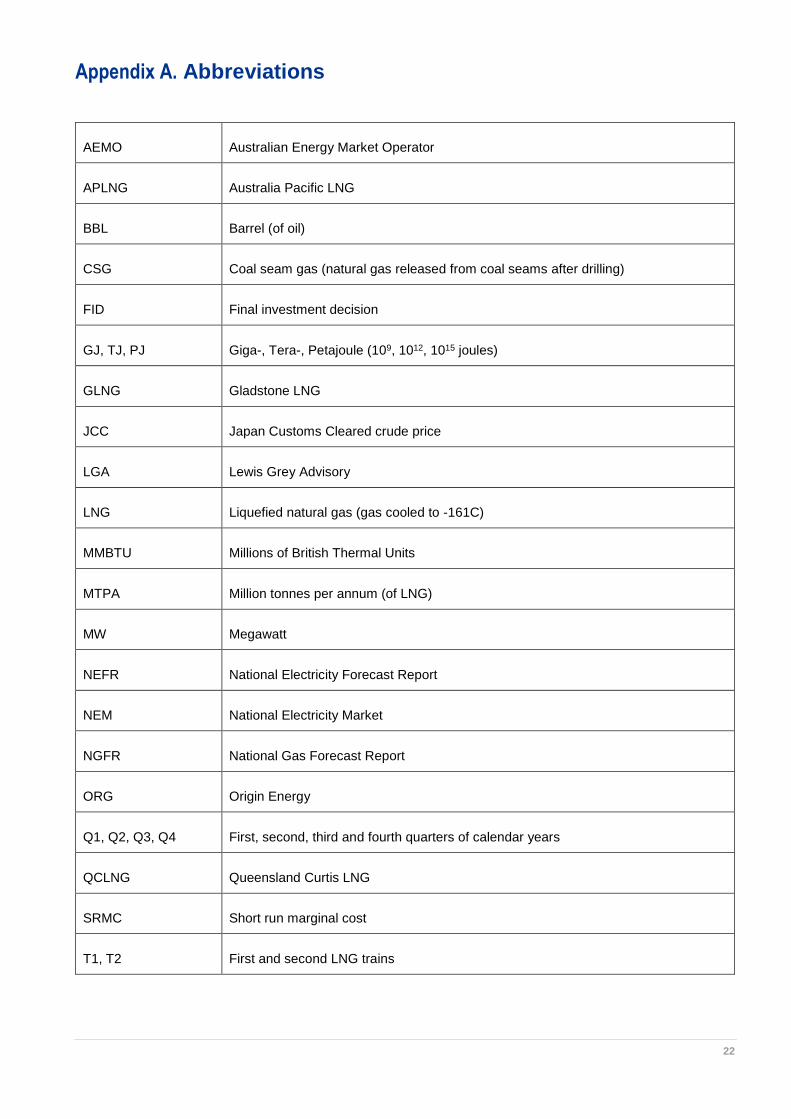
Appendix A. Abbreviations
AEMO Australian Energy Market Operator
APLNG Australia Pacific LNG
BBL Barrel (of oil)
CSG Coal seam gas (natural gas released from coal seams after drilling)
FID Final investment decision
GJ, TJ, PJ Giga-, Tera-, Petajoule (109, 1012, 1015 joules)
GLNG Gladstone LNG
JCC Japan Customs Cleared crude price
LGA Lewis Grey Advisory
LNG Liquefied natural gas (gas cooled to -161C)
MMBTU Millions of British Thermal Units
MTPA Million tonnes per annum (of LNG)
MW Megawatt
NEFR National Electricity Forecast Report
NEM National Electricity Market
NGFR National Gas Forecast Report
ORG Origin Energy
Q1, Q2, Q3, Q4 First, second, third and fourth quarters of calendar years
QCLNG Queensland Curtis LNG
SRMC Short run marginal cost
T1, T2 First and second LNG trains