Update on the Texas State Implementation Plan (SIP) and Federal Air Quality Standards Kasey Savanich...
69
Update on the Texas State Implementation Plan (SIP) and Federal Air Quality Standards Kasey Savanich and Brian Foster Air Quality Division 2015 Environmental Trade Fair
-
Upload
marvin-lyons -
Category
Documents
-
view
219 -
download
3
Transcript of Update on the Texas State Implementation Plan (SIP) and Federal Air Quality Standards Kasey Savanich...
Update on the Texas State Implementation Plan (SIP) and Federal Air Quality Standards
Kasey Savanich and Brian FosterAir Quality Division
2015 Environmental Trade Fair
Air Quality Division • Update on the NAAQS and the SIP for Texas • KS and BF • May 5, 2015 • Page 2
Today’s Topics
• National Ambient Air Quality Standards (NAAQS)
• Design Values• 2015 Revisions to the Ozone NAAQS• Status of Texas Air Quality Planning
Activities
Air Quality Division • Update on the NAAQS and the SIP for Texas • KS and BF • May 5, 2015 • Page 3
National Ambient Air Quality Standards
Blue sky

Air Quality Division • Update on the NAAQS and the SIP for Texas • KS and BF • May 5, 2015 • Page 4
National Ambient Air Quality Standards
• Required by the Federal Clean Air Act • The United States Environmental Protection
Agency (EPA) sets these health-based standards for clean air, called National Ambient Air Quality Standards (NAAQS), for six criteria air pollutants:– Ground-Level Ozone (O3);– Particulate Matter (PM);– Nitrogen Dioxide (NO2);
– Sulfur Dioxide (SO2);– Carbon Monoxide (CO); and– Lead (Pb).
Air Quality Division • Update on the NAAQS and the SIP for Texas • KS and BF • May 5, 2015 • Page 5
National Ambient Air Quality Standards
• The EPA is required to review the NAAQS every five years. For more information on the review process, go to the EPA’s NAAQS review Web page. (http://epa.gov/ttn/naaqs/review.html)
• States with areas failing to meet the NAAQS (nonattainment) are required to develop and submit to the EPA state implementation plan (SIP) revisions.
Air Quality Division • Update on the NAAQS and the SIP for Texas • KS and BF • May 5, 2015 • Page 6
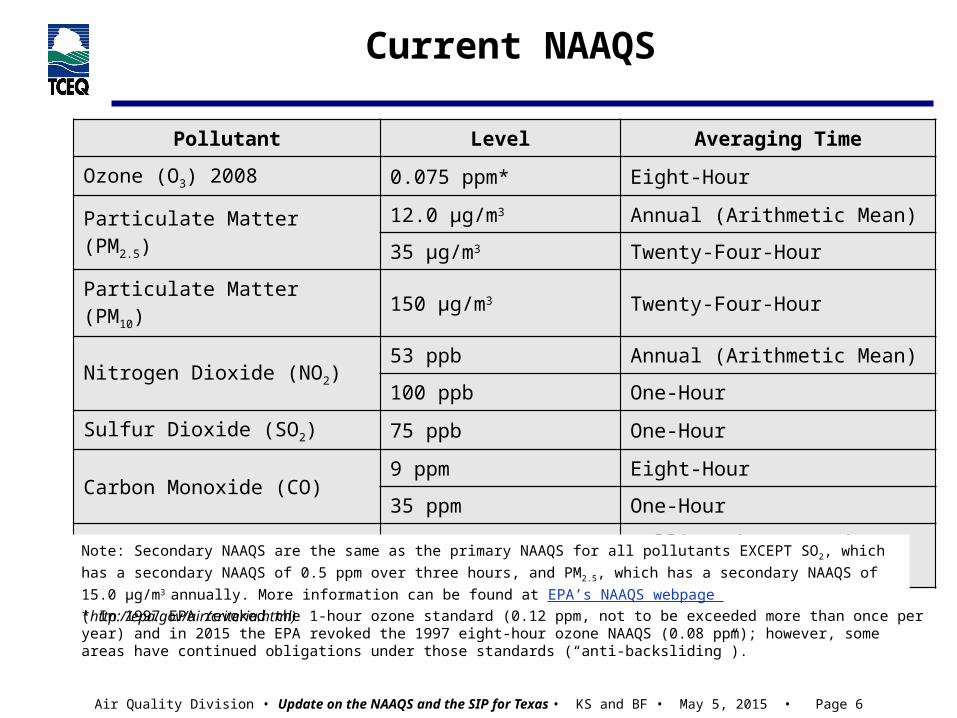
Pollutant Level Averaging Time
Ozone (O3) 2008 0.075 ppm* Eight-Hour
Particulate Matter (PM2.5)12.0 µg/m3 Annual (Arithmetic Mean)
35 µg/m3 Twenty-Four-Hour
Particulate Matter (PM10) 150 µg/m3 Twenty-Four-Hour
Nitrogen Dioxide (NO2)53 ppb Annual (Arithmetic Mean)
100 ppb One-Hour
Sulfur Dioxide (SO2) 75 ppb One-Hour
Carbon Monoxide (CO)9 ppm Eight-Hour
35 ppm One-Hour
Lead (Pb) 0.15 µg/m3 Rolling Three-Month Average
Current NAAQS
Note: Secondary NAAQS are the same as the primary NAAQS for all pollutants EXCEPT SO2, which has a
secondary NAAQS of 0.5 ppm over three hours, and PM2.5, which has a secondary NAAQS of 15.0 µg/m3 annually.
More information can be found at EPA’s NAAQS webpage (http://epa.gov/air/criteria.html)
* In 1997 EPA revoked the 1-hour ozone standard (0.12 ppm, not to be exceeded more than once per year) and in 2015 the EPA revoked the 1997 eight-hour ozone NAAQS (0.08 ppm); however, some areas have continued obligations under those standards (“anti-backsliding”).

Air Quality Division • Update on the NAAQS and the SIP for Texas • KS and BF • May 5, 2015 • Page 7
Criteria Pollutant Proposed Rule Final Rule
Lead (Pb) 2014 TBD
Ozone (O3) December 2014 October 2015
Nitrogen Dioxide (NO2) February 2016 November 2016
Sulfur Dioxide (SO2) February 2017 November 2017
Carbon Monoxide (CO) Summer 2017 Spring 2018
Nitrogen Oxides (NOX) and Sulfur Oxides (SOX) Secondary Standard
May 2017 February 2018
Particulate Matter (PM) TBD TBD
NAAQS Review Schedule

Air Quality Division • Update on the NAAQS and the SIP for Texas • KS and BF • May 5, 2015 • Page 8
Design Values

Air Quality Division • Update on the NAAQS and the SIP for Texas • KS and BF • May 5, 2015 • Page 9
Data Completeness
• Most design value calculations require a data completeness check
• Data completeness checks vary by NAAQS, but in general:– A design value must have at least 75% complete
data for the year– A design value that exceeds the NAAQS but has
incomplete data is still considered valid– Additional tests can be used to validate a design
value with incomplete data• See the Federal Register for an individual
criteria pollutant for more information (http://www.epa.gov/air/criteria.html)
Air Quality Division • Update on the NAAQS and the SIP for Texas • KS and BF • May 5, 2015 • Page 10
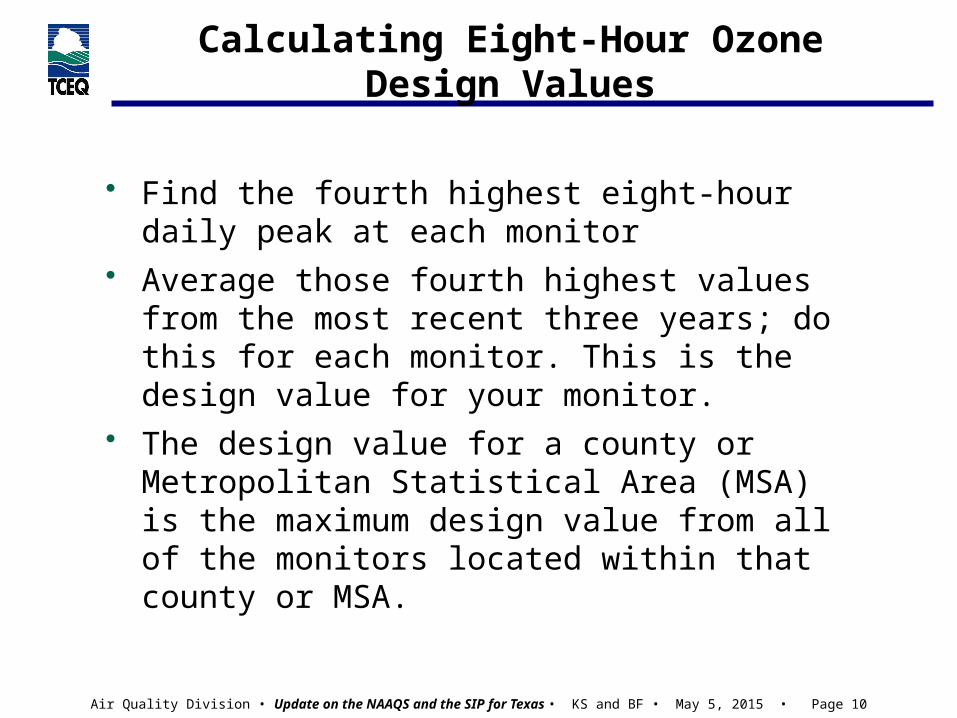
Calculating Eight-Hour Ozone Design Values
• Find the fourth highest eight-hour daily peak at each monitor
• Average those fourth highest values from the most recent three years; do this for each monitor. This is the design value for your monitor.
• The design value for a county or Metropolitan Statistical Area (MSA) is the maximum design value from all of the monitors located within that county or MSA.
Air Quality Division • Update on the NAAQS and the SIP for Texas • KS and BF • May 5, 2015 • Page 11
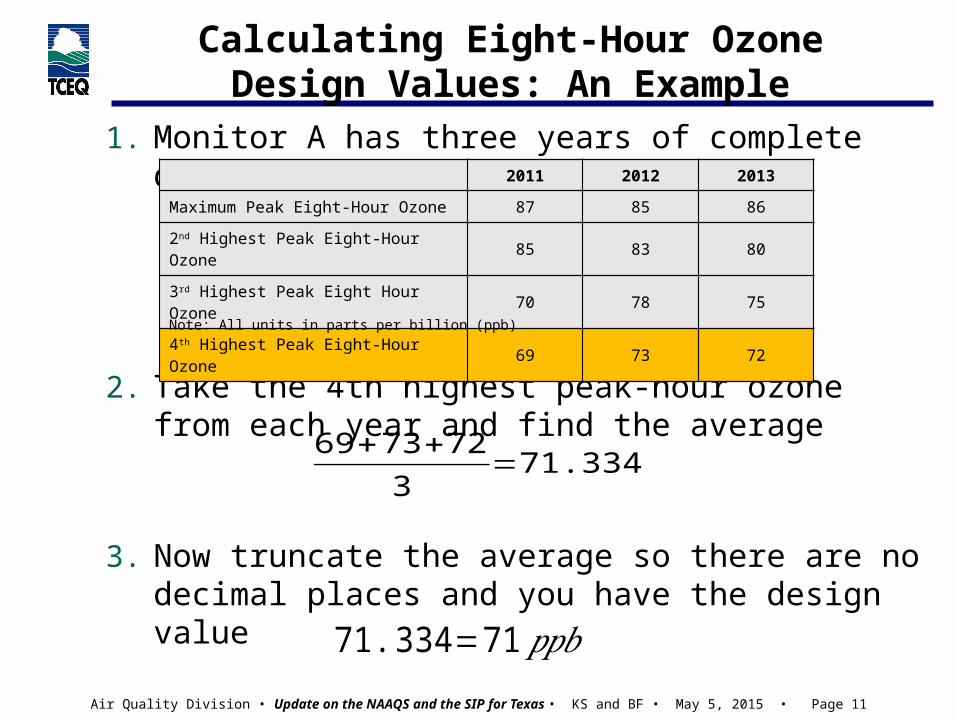
Calculating Eight-Hour Ozone Design Values: An Example
1. Monitor A has three years of complete data4th Highest Peak Eight-Hour Ozone for Monitor A was 95 in 2009, 88 in 2010 and 86 in
2011.
2. Take the 4th highest peak-hour ozone from each year and find the average
3. Now truncate the average so there are no decimal places and you have the design value
2011 2012 2013
Maximum Peak Eight-Hour Ozone 87 85 86
2nd Highest Peak Eight-Hour Ozone 85 83 80
3rd Highest Peak Eight Hour Ozone 70 78 75
4th Highest Peak Eight-Hour Ozone 69 73 72
Note: All units in parts per billion (ppb)
69+73+723
=71.334
71.334=71𝑝𝑝𝑏

2014 Ozone Design Values by County
CSA/CBSA/MSA County2014 8Hr Ozone DV
(ppb)Dallas-Fort Worth Denton 81Dallas-Fort Worth Tarrant 80
Houston-The Woodlands Brazoria 80San Antonio-New Braunfels Bexar 80
Dallas-Fort Worth Collin 78Dallas-Fort Worth Dallas 78Dallas-Fort Worth Johnson 76Dallas-Fort Worth Hood 76
Houston-The Woodlands Montgomery 76Houston-The Woodlands Harris 76
Dallas-Fort Worth Parker 74Dallas-Fort Worth Rockwall 73El Paso-Las Cruces El Paso 72
Houston-The Woodlands Galveston 72Killeen-Temple Bell 72
Dallas-Fort Worth Ellis 71Longview-Marshall Gregg 71Tyler-Jacksonville Smith 71
Beaumont-Port Arthur Jefferson 70Dallas-Fort Worth Kaufman 70Amarillo-Borger Randall 70
Austin-Round Rock Travis 69Dallas-Fort Worth Hunt 69Longview-Marshall Harrison 69
Waco McLennan 69Dallas-Fort Worth Navarro 68
Beaumont-Port Arthur Orange 67Corpus Christi-Kingsville-
Alice Nueces 66
Big Bend (No MSA) Brewster 65Victoria-Port Lavaca Victoria 63
Brownsville-Harlingen-Raymondville
Cameron 58
McAllen-Edinburg Hidalgo 57**The Brewster County and Randall County monitors are part of the Clean Air Status and Trends Network (CASTNET) of monitors and report data directly to the EPA.
*2014 design values as of 4/1/2015.

Air Quality Division • Update on the NAAQS and the SIP for Texas • KS and BF • May 5, 2015 • Page 13
2014* Fine Particulate Matter (PM2.5) Design Values
• Calculating PM2.5 Design Values– Annual: Three-year average of the weighted
annual mean PM2.5 Weighted annual mean is the mean of the 4
quarterly means – 24-Hour: Three-year average of the 98th
percentile 24-hour PM2.5 concentration
• PM2.5 Design Values in Texas– Annual:
All monitors in Texas currently meet the annual PM2.5 NAAQS of 12.0 micrograms per cubic meter (µg/m3).
– 24-Hour: All monitors in Texas currently meet the 24-hour
PM2.5 NAAQS of 35 µg/m3.*2014 design values are calculated as of 4/1/2015, are not certified and are subject to change.
Air Quality Division • Update on the NAAQS and the SIP for Texas • KS and BF • May 5, 2015 • Page 14
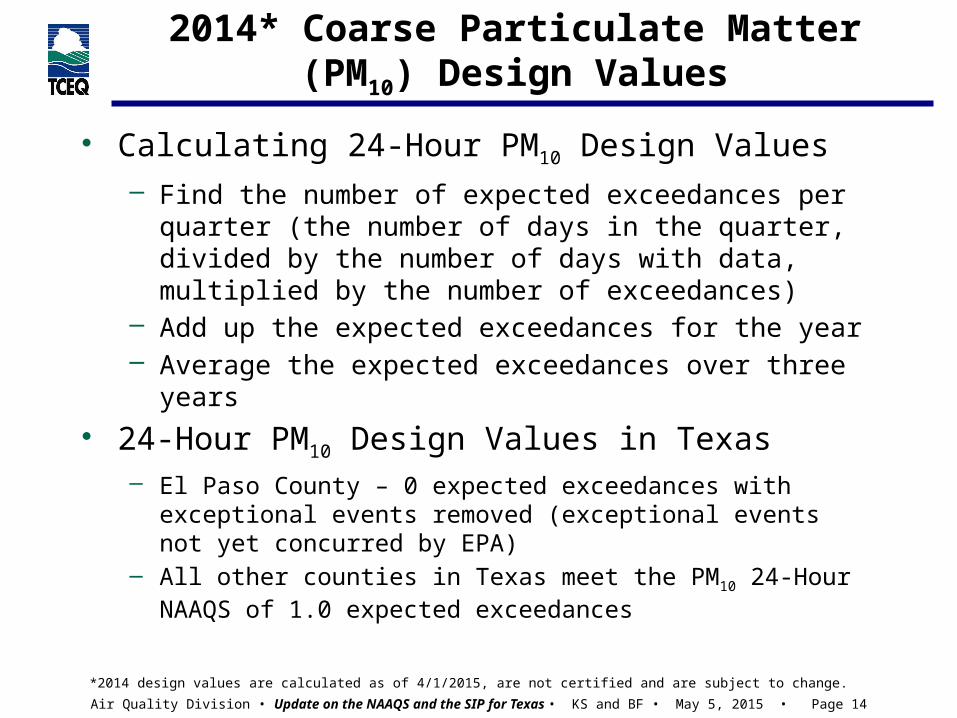
2014* Coarse Particulate Matter (PM10) Design Values
• Calculating 24-Hour PM10 Design Values– Find the number of expected exceedances per
quarter (the number of days in the quarter, divided by the number of days with data, multiplied by the number of exceedances)
– Add up the expected exceedances for the year– Average the expected exceedances over three years
• 24-Hour PM10 Design Values in Texas– El Paso County – 0 expected exceedances with exceptional
events removed (exceptional events not yet concurred by EPA)
– All other counties in Texas meet the PM10 24-Hour NAAQS of 1.0 expected exceedances
*2014 design values are calculated as of 4/1/2015, are not certified and are subject to change.
Air Quality Division • Update on the NAAQS and the SIP for Texas • KS and BF • May 5, 2015 • Page 15
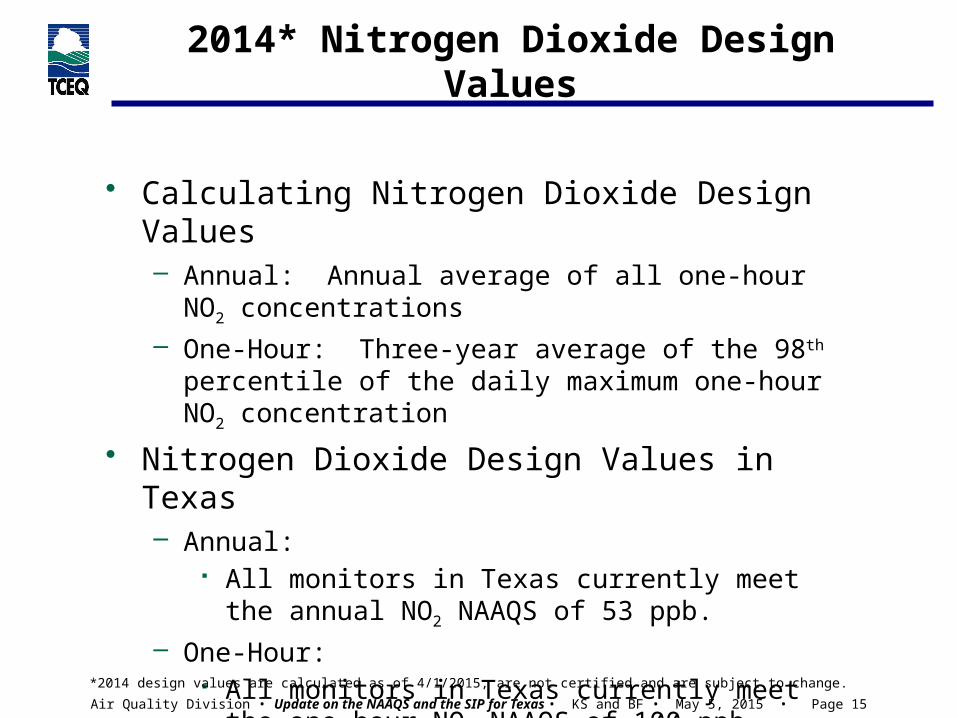
2014* Nitrogen Dioxide Design Values
• Calculating Nitrogen Dioxide Design Values– Annual: Annual average of all one-hour NO2
concentrations– One-Hour: Three-year average of the 98th
percentile of the daily maximum one-hour NO2 concentration
• Nitrogen Dioxide Design Values in Texas– Annual:
All monitors in Texas currently meet the annual NO2 NAAQS of 53 ppb.
– One-Hour: All monitors in Texas currently meet the one-
hour NO2 NAAQS of 100 ppb.*2014 design values are calculated as of 4/1/2015, are not certified and are subject to change.

Air Quality Division • Update on the NAAQS and the SIP for Texas • KS and BF • May 5, 2015 • Page 16
2014* Sulfur Dioxide Design Values
• Calculating Sulfur Dioxide Design Values
– Three-year average of the 99th percentile of the
daily maximum one-hour SO2 concentration
• Sulfur Dioxide Design Values in Texas
– All monitors in Texas currently meet 2010 one-
hour SO2 NAAQS of 75 ppb.
*2014 design values are calculated as of 4/1/2015, are not certified and are subject to change.
Air Quality Division • Update on the NAAQS and the SIP for Texas • KS and BF • May 5, 2015 • Page 17
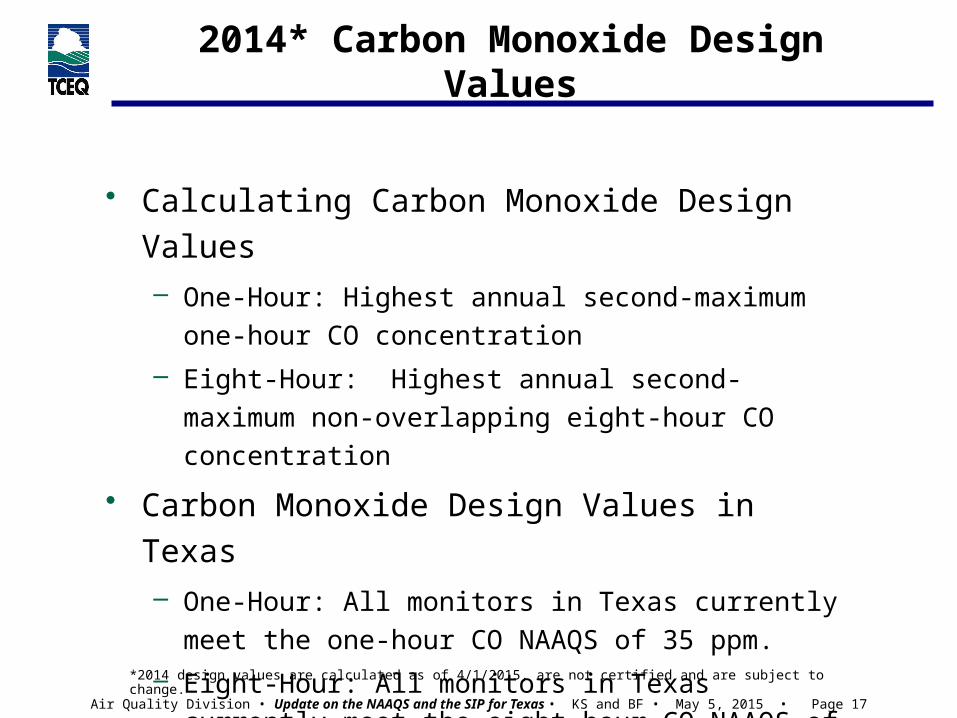
2014* Carbon Monoxide Design Values
• Calculating Carbon Monoxide Design Values– One-Hour: Highest annual second-maximum
one-hour CO concentration
– Eight-Hour: Highest annual second-maximum non-overlapping eight-hour CO concentration
• Carbon Monoxide Design Values in Texas– One-Hour: All monitors in Texas currently meet
the one-hour CO NAAQS of 35 ppm.
– Eight-Hour: All monitors in Texas currently meet the eight-hour CO NAAQS of 9 ppm.
*2014 design values are calculated as of 4/1/2015, are not certified and are subject to change.
Air Quality Division • Update on the NAAQS and the SIP for Texas • KS and BF • May 5, 2015 • Page 18
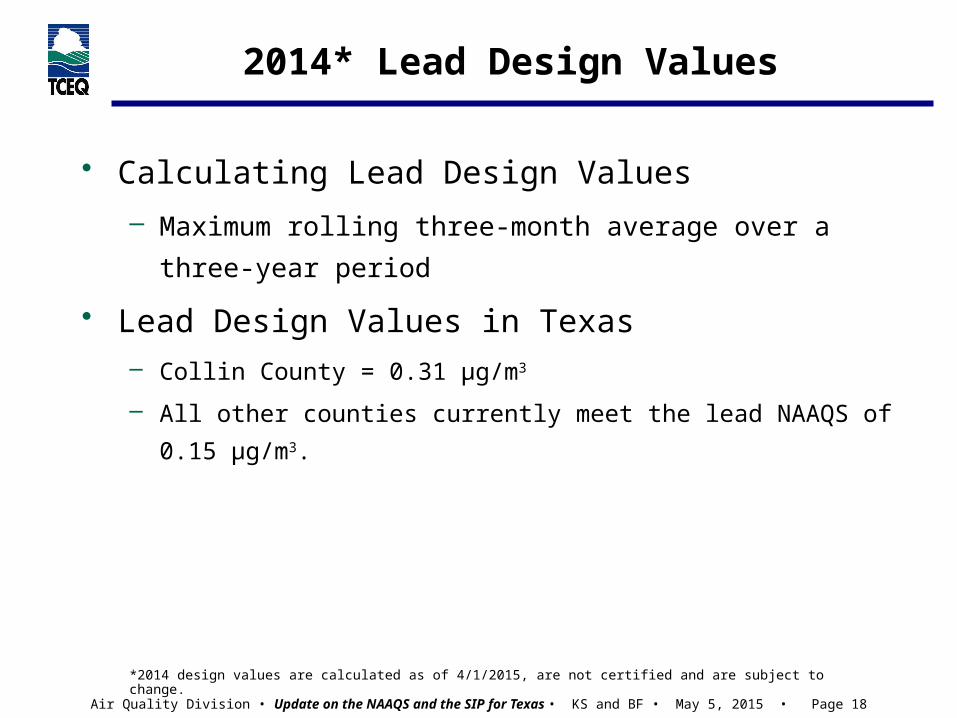
2014* Lead Design Values
• Calculating Lead Design Values
– Maximum rolling three-month average over a three-
year period
• Lead Design Values in Texas– Collin County = 0.31 µg/m3
– All other counties currently meet the lead NAAQS of 0.15
µg/m3.
*2014 design values are calculated as of 4/1/2015, are not certified and are subject to change.
Air Quality Division • Update on the NAAQS and the SIP for Texas • KS and BF • May 5, 2015 • Page 19
2015 Revisions to the Ozone NAAQS
Air Quality Division • Update on the NAAQS and the SIP for Texas • KS and BF • May 5, 2015 • Page 20
Proposed Revisions to the Ozone NAAQS
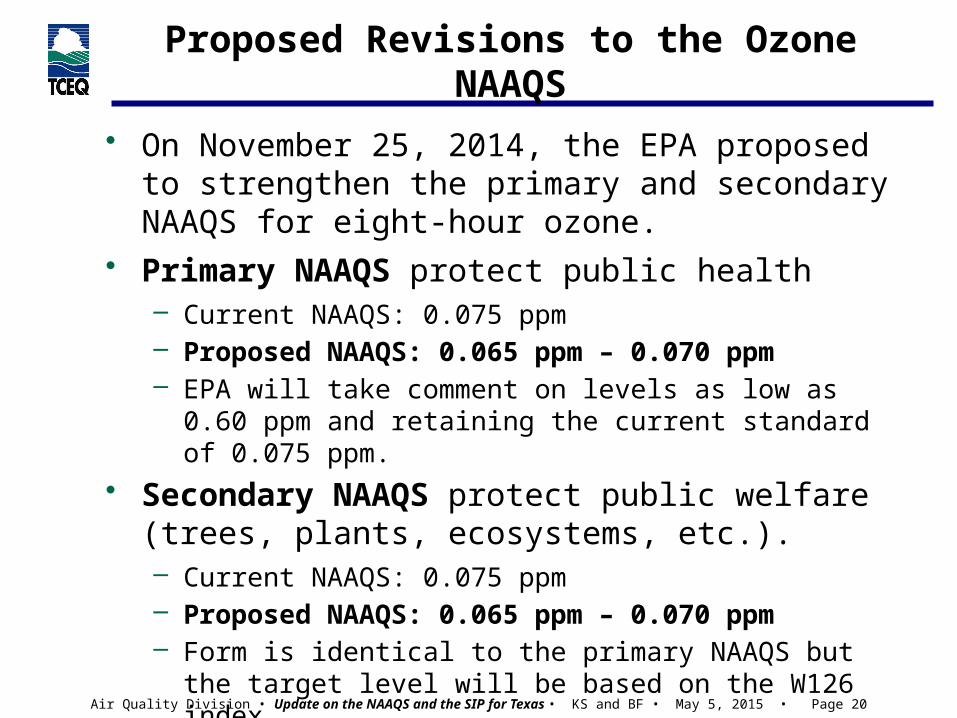
• On November 25, 2014, the EPA proposed to strengthen the primary and secondary NAAQS for eight-hour ozone.
• Primary NAAQS protect public health– Current NAAQS: 0.075 ppm– Proposed NAAQS: 0.065 ppm – 0.070 ppm– EPA will take comment on levels as low as 0.60 ppm
and retaining the current standard of 0.075 ppm.• Secondary NAAQS protect public welfare
(trees, plants, ecosystems, etc.).– Current NAAQS: 0.075 ppm– Proposed NAAQS: 0.065 ppm – 0.070 ppm – Form is identical to the primary NAAQS but the target
level will be based on the W126 index.

Air Quality Division • Update on the NAAQS and the SIP for Texas • KS and BF • May 5, 2015 • Page 21
Proposed Ozone NAAQS Revisions Timeline
• Proposal – November 25, 2014• Final Rule – October 1, 2015• State Nonattainment Area
Recommendations due to the EPA - October 1, 2016
• EPA Response to State Recommendations – June 1, 2017
• EPA Final Nonattainment Area Designations – October 1, 2017
• Implementation Plans – 2020 to 2021• Attainment of NAAQS – 2020 to 2037
Air Quality Division • Update on the NAAQS and the SIP for Texas • KS and BF • May 5, 2015 • Page 22
Comparing Design Values to the NAAQS
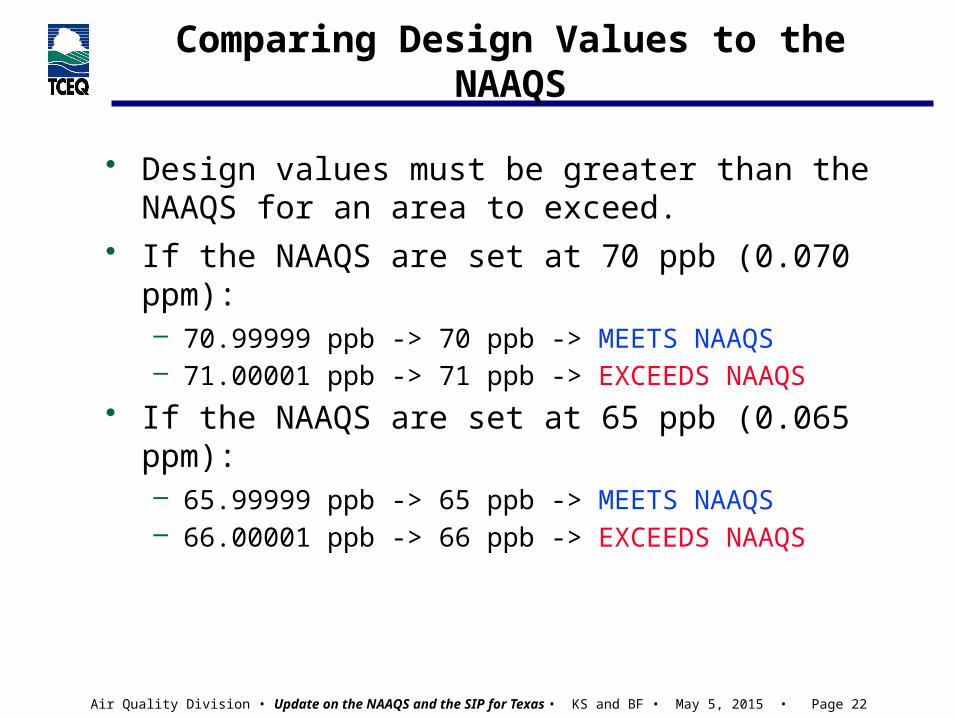
• Design values must be greater than the NAAQS for an area to exceed.
• If the NAAQS are set at 70 ppb (0.070 ppm):– 70.99999 ppb -> 70 ppb -> MEETS NAAQS– 71.00001 ppb -> 71 ppb -> EXCEEDS NAAQS
• If the NAAQS are set at 65 ppb (0.065 ppm):– 65.99999 ppb -> 65 ppb -> MEETS NAAQS– 66.00001 ppb -> 66 ppb -> EXCEEDS NAAQS
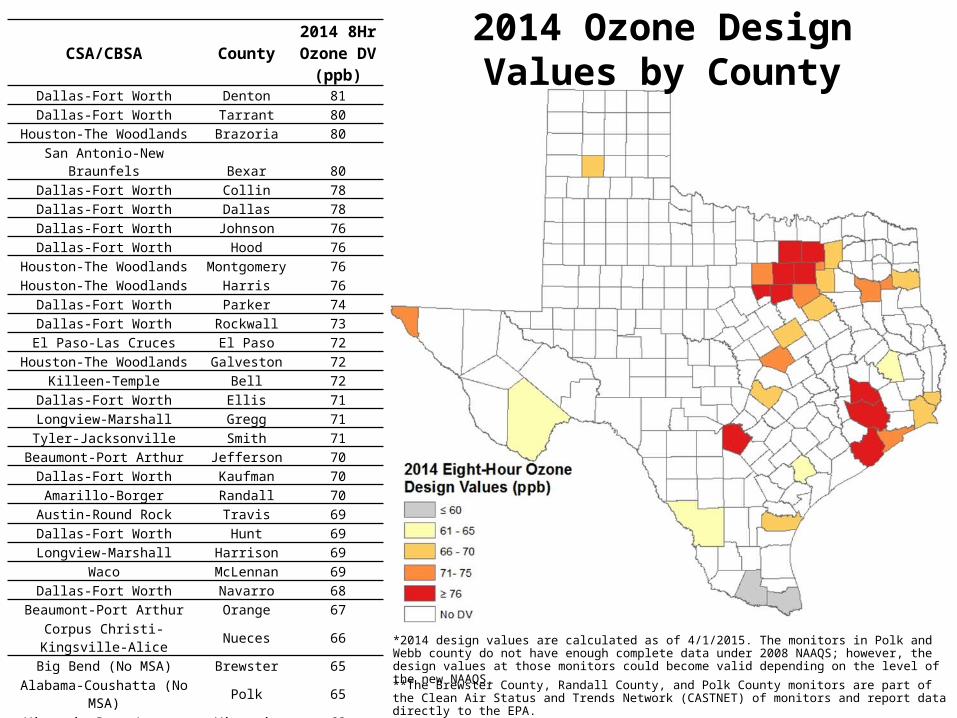
2014 Ozone Design Values by County
CSA/CBSA County2014 8Hr Ozone DV
(ppb)Dallas-Fort Worth Denton 81Dallas-Fort Worth Tarrant 80
Houston-The Woodlands Brazoria 80San Antonio-New Braunfels Bexar 80
Dallas-Fort Worth Collin 78Dallas-Fort Worth Dallas 78Dallas-Fort Worth Johnson 76Dallas-Fort Worth Hood 76
Houston-The Woodlands Montgomery 76Houston-The Woodlands Harris 76
Dallas-Fort Worth Parker 74Dallas-Fort Worth Rockwall 73El Paso-Las Cruces El Paso 72
Houston-The Woodlands Galveston 72Killeen-Temple Bell 72
Dallas-Fort Worth Ellis 71Longview-Marshall Gregg 71Tyler-Jacksonville Smith 71
Beaumont-Port Arthur Jefferson 70Dallas-Fort Worth Kaufman 70Amarillo-Borger Randall 70
Austin-Round Rock Travis 69Dallas-Fort Worth Hunt 69Longview-Marshall Harrison 69
Waco McLennan 69Dallas-Fort Worth Navarro 68
Beaumont-Port Arthur Orange 67Corpus Christi-Kingsville-
Alice Nueces 66
Big Bend (No MSA) Brewster 65Alabama-Coushatta (No
MSA) Polk 65
Victoria-Port Lavaca Victoria 63Laredo Webb 61
Brownsville-Harlingen-Raymondville
Cameron 58
McAllen-Edinburg Hidalgo 57**The Brewster County, Randall County, and Polk County monitors are part of the Clean Air Status and Trends Network (CASTNET) of monitors and report data directly to the EPA.
*2014 design values are calculated as of 4/1/2015. The monitors in Polk and Webb county do not have enough complete data under 2008 NAAQS; however, the design values at those monitors could become valid depending on the level of the new NAAQS.
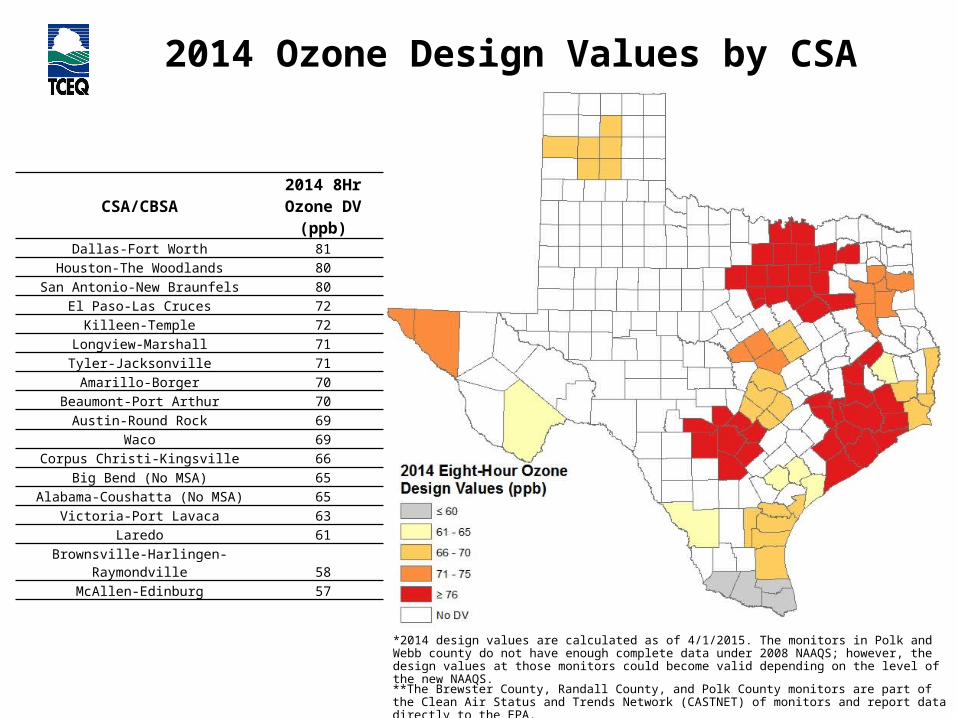
2014 Ozone Design Values by CSA
CSA/CBSA2014 8Hr Ozone DV
(ppb)Dallas-Fort Worth 81
Houston-The Woodlands 80San Antonio-New Braunfels 80
El Paso-Las Cruces 72Killeen-Temple 72
Longview-Marshall 71Tyler-Jacksonville 71Amarillo-Borger 70
Beaumont-Port Arthur 70Austin-Round Rock 69
Waco 69Corpus Christi-Kingsville 66
Big Bend (No MSA) 65Alabama-Coushatta (No MSA) 65
Victoria-Port Lavaca 63Laredo 61
Brownsville-Harlingen-Raymondville 58McAllen-Edinburg 57
**The Brewster County, Randall County, and Polk County monitors are part of the Clean Air Status and Trends Network (CASTNET) of monitors and report data directly to the EPA.
*2014 design values are calculated as of 4/1/2015. The monitors in Polk and Webb county do not have enough complete data under 2008 NAAQS; however, the design values at those monitors could become valid depending on the level of the new NAAQS.
Air Quality Division • Update on the NAAQS and the SIP for Texas • KS and BF • May 5, 2015 • Page 25
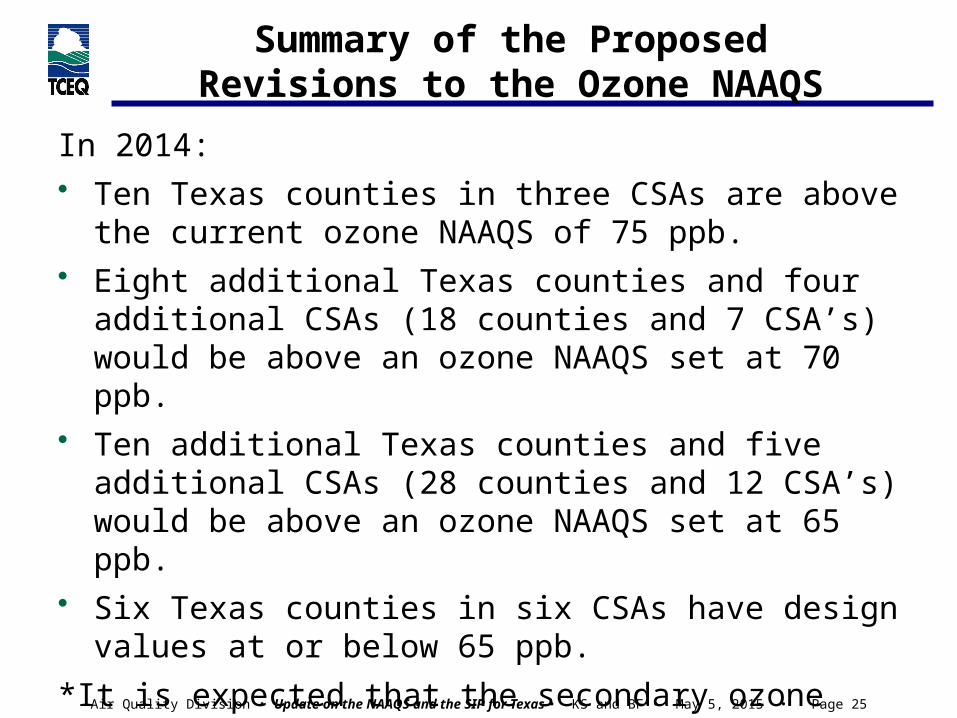
Summary of the Proposed Revisions to the Ozone NAAQS
In 2014:• Ten Texas counties in three CSAs are above the
current ozone NAAQS of 75 ppb.• Eight additional Texas counties and four additional
CSAs (18 counties and 7 CSA’s) would be above an ozone NAAQS set at 70 ppb.
• Ten additional Texas counties and five additional CSAs (28 counties and 12 CSA’s) would be above an ozone NAAQS set at 65 ppb.
• Six Texas counties in six CSAs have design values at or below 65 ppb.
*It is expected that the secondary ozone NAAQS will be in a form identical to the primary ozone NAAQS.
Status of Texas Air Quality
Planning Efforts
Air Quality Division • Update on the NAAQS and the SIP for Texas • KS and BF • May 5, 2015 • Page 27
Status of Texas Air Quality Planning Efforts
• Criteria Pollutants– Ozone – Lead – SO2
– NO2
– PM– CO
• Other Statewide Air Issues– Interstate Transport Rule– Regional Haze


Air Quality Division • Update on the NAAQS and the SIP for Texas • KS and BF • May 5, 2015 • Page 29
Ozone
Air Quality Division • Update on the NAAQS and the SIP for Texas • KS and BF • May 5, 2015 • Page 30
1997 Eight-Hour Ozone Standard
• Standard is 0.08 ppm– Design value greater than or equal to 85 ppb
• Houston-Galveston-Brazoria (HGB) Area– Brazoria, Chambers, Fort Bend, Galveston,
Harris, Liberty, Montgomery, and Waller Counties
• Dallas-Fort Worth (DFW) Area– Collin, Dallas, Denton, Ellis, Johnson, Kaufman,
Parker, Rockwall, and Tarrant Counties

Air Quality Division • Update on the NAAQS and the SIP for Texas • KS and BF • May 5, 2015 • Page 31
• EPA finalized designations May 21, 2012– July 20* established as the attainment date of
each relevant calendar year
• First portion of implementation rules published February 14, 2012
• SIP Requirements Rule finalized February 13, 2015– 1997 Eight-Hour Ozone Standard revoked
• Final guidance for “Ozone Advance” released by EPA April 4, 2012
* The attainment date was changed by the D.C. Circuit Court from December 31 to July 20 resulting from a legal challenge.
2008 Eight-Hour Ozone Standard

Air Quality Division • Update on the NAAQS and the SIP for Texas • KS and BF • May 5, 2015 • Page 32
2008 Eight-Hour Ozone Standard
• Standard is 0.075 ppm– Design values of 75 ppb or less are attainment
• HGB Area– Brazoria, Chambers, Fort Bend, Galveston, Harris,
Liberty, Montgomery, and Waller Counties
• DFW Area– Collin, Dallas, Denton, Ellis, Johnson, Kaufman,
Parker, Rockwall, Tarrant, and Wise Counties
Air Quality Division • Update on the NAAQS and the SIP for Texas • KS and BF • May 5, 2015 • Page 33
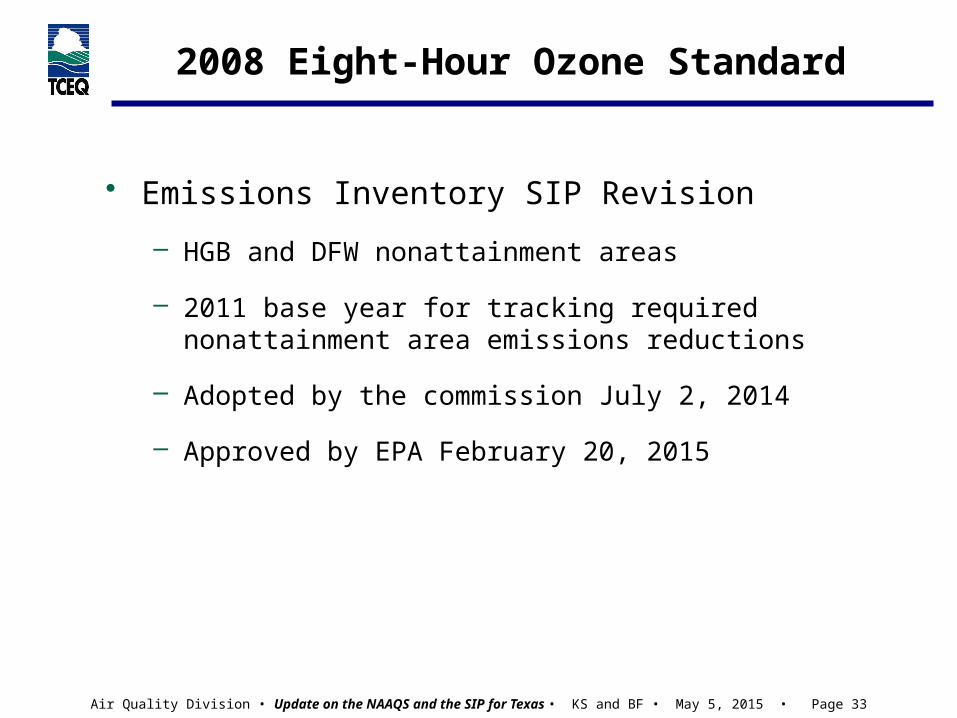
• Emissions Inventory SIP Revision
– HGB and DFW nonattainment areas
– 2011 base year for tracking required nonattainment area emissions reductions
– Adopted by the commission July 2, 2014
– Approved by EPA February 20, 2015
2008 Eight-Hour Ozone Standard
Air Quality Division • Update on the NAAQS and the SIP for Texas • KS and BF • May 5, 2015 • Page 34
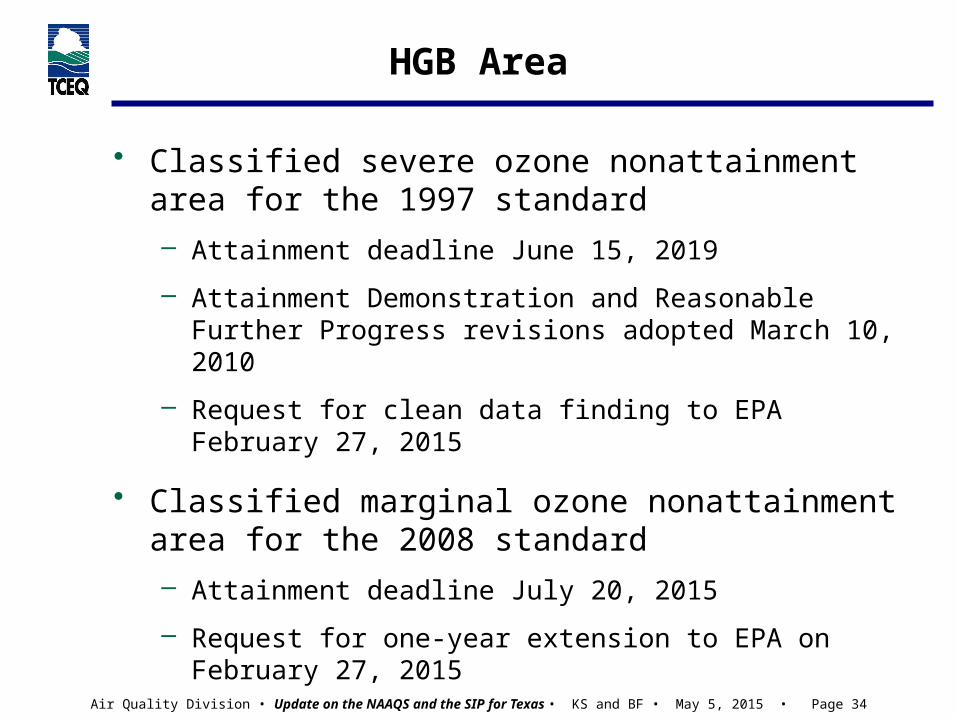
HGB Area
• Classified severe ozone nonattainment area for the 1997 standard– Attainment deadline June 15, 2019
– Attainment Demonstration and Reasonable Further Progress revisions adopted March 10, 2010
– Request for clean data finding to EPA February 27, 2015
• Classified marginal ozone nonattainment area for the 2008 standard– Attainment deadline July 20, 2015
– Request for one-year extension to EPA on February 27, 2015
Air Quality Division • Update on the NAAQS and the SIP for Texas • KS and BF • May 5, 2015 • Page 35
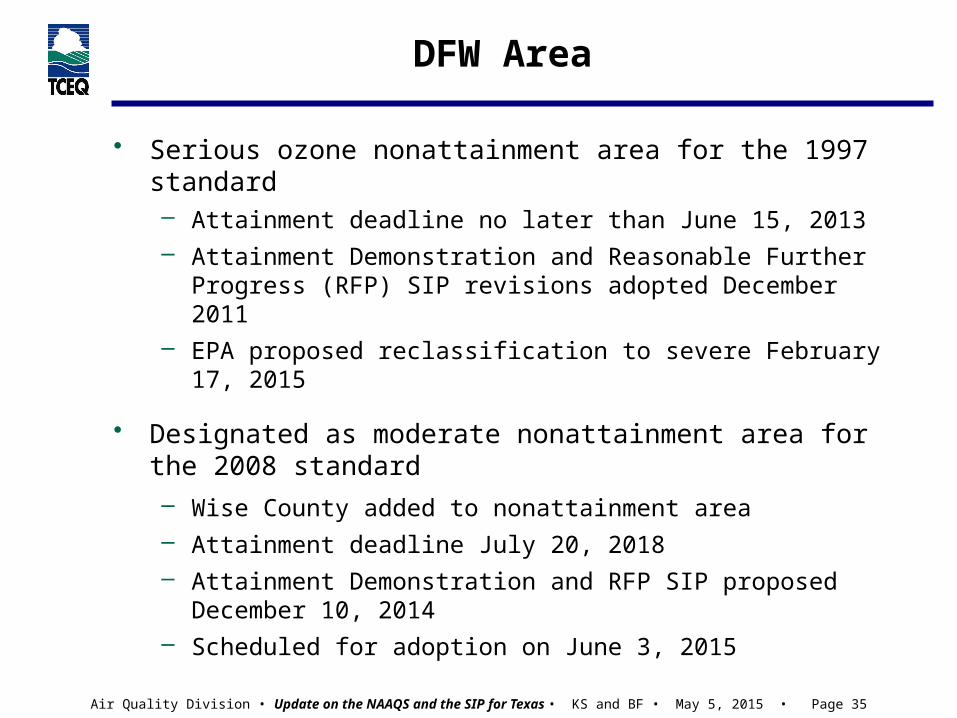
DFW Area
• Serious ozone nonattainment area for the 1997 standard– Attainment deadline no later than June 15, 2013– Attainment Demonstration and Reasonable Further
Progress (RFP) SIP revisions adopted December 2011– EPA proposed reclassification to severe February 17, 2015
• Designated as moderate nonattainment area for the 2008 standard– Wise County added to nonattainment area– Attainment deadline July 20, 2018– Attainment Demonstration and RFP SIP proposed
December 10, 2014– Scheduled for adoption on June 3, 2015
Air Quality Division • Update on the NAAQS and the SIP for Texas • KS and BF • May 5, 2015 • Page 36
DFW Area - Update
• The attainment date was changed by the D.C. Circuit Court from December 31 to July 20 resulting from a legal challenge.
• The TCEQ has already begun to address development of a new attainment demonstration SIP revision to reflect the 2017 attainment year.

Air Quality Division • Update on the NAAQS and the SIP for Texas • KS and BF • May 5, 2015 • Page 37
Redesignation Substitute for Revoked Standards
• EPA’s SIP Requirements Rule provides the redesignation substitute to remove anti-backsliding measures for revoked NAAQS– Includes substance of Federal Clean Air Act
resignation criteria
• Redesignation Substitute elements
– Monitoring data showing attainment of the revoked NAAQS
– Showing that attainment was due to permanent and enforceable emissions reductions
– Demonstration that the area can maintain the standard for 10 years after approval

Air Quality Division • Update on the NAAQS and the SIP for Texas • KS and BF • May 5, 2015 • Page 38
HGB and DFW Redesignation Substitutes
• HGB
– One-Hour Ozone Standard
Scheduled for adoption July 1, 2015
– 1997 Eight-Hour Ozone Standard
Scheduled for proposal September 2015 and adoption April 2016
• DFW– One-Hour and Eight-Hour Ozone Standards
Scheduled for proposal September 2015 and adoption April 2016
Air Quality Division • Update on the NAAQS and the SIP for Texas • KS and BF • May 5, 2015 • Page 39
Beaumont-Port Arthur (BPA) Area
• Attainment (maintenance) for the 1997 ozone standard
• Redesignation request and maintenance plan approved by the EPA on November 19, 2010
• SIP revision to update Motor Vehicle Emissions Budget (MVEB) adopted November 14, 2012– Applies to 2021 maintenance budgets
– MVEB SIP approved by EPA on March 6, 2013
• Designated attainment/unclassifiable for the 2008 ozone standard
Air Quality Division • Update on the NAAQS and the SIP for Texas • KS and BF • May 5, 2015 • Page 40
El Paso Area
• Attainment (maintenance) for the 1997 ozone standard
• Maintenance SIP revision approved by EPA in 2009 for ozone
• Designated attainment/unclassifiable for the 2008 ozone standard

Air Quality Division • Update on the NAAQS and the SIP for Texas • KS and BF • May 5, 2015 • Page 41
Victoria Area
• Attainment (maintenance) for the 1997 ozone standard
• Maintenance SIP revision for the 1997 ozone standard submitted to EPA March 2007
• Contingency plan SIP revision approved by EPA effective October 7, 2013
• Designated attainment/unclassifiable for the 2008 ozone standard
Air Quality Division • Update on the NAAQS and the SIP for Texas • KS and BF • May 5, 2015 • Page 42
Additional Areas
• Austin, Corpus Christi, Northeast Texas, and San Antonio all designated attainment/unclassifiable for the 2008 ozone standard
• Previously developed voluntary emission reduction programs (ozone flex, early action compacts) to maintain attainment status

Air Quality Division • Update on the NAAQS and the SIP for Texas • KS and BF • May 5, 2015 • Page 43
Additional Areas
• Lower Rio Grande Valley
• Brewster County (Big Bend)
• McLennan County (Waco)
• Hood County
• All designated attainment/unclassifiable for the 2008 ozone standard
Air Quality Division • Update on the NAAQS and the SIP for Texas • KS and BF • May 5, 2015 • Page 44
Ozone Advance
• Encourages expeditious emission reductions in ozone attainment areas to help areas continue to meet the NAAQS
• Areas in Texas currently pursuing Ozone Advance include:– Austin, Corpus Christi, Hood County, San
Antonio, Tyler-Longview, and Waco
Air Quality Division • Update on the NAAQS and the SIP for Texas • KS and BF • May 5, 2015 • Page 45
Lead

Air Quality Division • Update on the NAAQS and the SIP for Texas • KS and BF • May 5, 2015 • Page 46
Lead
• Portion of Collin County nonattainment for the 2008 lead NAAQS
• Attainment Demonstration SIP revision adopted by TCEQ on August 8, 2012
• Frisco battery recycling operations permanently shut down November 30, 2012
• EPA’s deadline for attainment December 31, 2015
• Infrastructure and interstate transport SIP revisions for the 2008 lead NAAQS adopted by TCEQ in 2011
Air Quality Division • Update on the NAAQS and the SIP for Texas • KS and BF • May 5, 2015 • Page 47
SulfurDioxide
Air Quality Division • Update on the NAAQS and the SIP for Texas • KS and BF • May 5, 2015 • Page 48
2010 SO2 NAAQS
• States notified of EPA’s final designations February 7, 2013– Designations based on current monitoring network only
– All areas of Texas are attaining the standard based on current regulatory monitoring network
• Infrastructure and transport SIP revisions for the 2010 SO2 NAAQS adopted April 23, 2013
Air Quality Division • Update on the NAAQS and the SIP for Texas • KS and BF • May 5, 2015 • Page 49
2010 SO2 NAAQS
• Designations– First round of nonattainment designations made
July 5, 2013 Based on monitoring violations (none in Texas)
– Data Requirements Rule proposed April 17, 2014 Data to be used for future designations New monitors needed to expand SO2 network
– Consent decree of March 3, 2015 sets designation deadlines in 2016, 2017, and 2020
EPA has identified 12 sources for designation by July 2, 2016
Other areas designated based on final Data Requirements Rule
Air Quality Division • Update on the NAAQS and the SIP for Texas • KS and BF • May 5, 2015 • Page 50
2010 SO2 NAAQS
• SIP revisions
– Infrastructure Transport SIP submitted to the EPA May 2013
– Partially disapproved by EPA November 24, 2014
– Attainment Demonstration SIP revisions due for modeled areas in 2019, for monitored areas in 2022

Air Quality Division • Update on the NAAQS and the SIP for Texas • KS and BF • May 5, 2015 • Page 51
Particulate Matter
Air Quality Division • Update on the NAAQS and the SIP for Texas • KS and BF • May 5, 2015 • Page 52
PM10 and PM2.5
• City of El Paso moderate nonattainment for PM10
• SIP revision adopted January 25, 2012
– Incorporates revised Memorandum of Agreement and Chapter 111 rule change for PM10
• All other areas in Texas classified as attainment/unclassifiable for PM2.5

Air Quality Division • Update on the NAAQS and the SIP for Texas • KS and BF • May 5, 2015 • Page 53
2012 PM2.5 Standard
• 2012 Annual PM2.5 standard finalized December 14, 2012
– Final designations issued December 18, 2014
– All areas of Texas designated unclassifiable/attainment
• Infrastructure and transport SIP due to the EPA December 14, 2015
Air Quality Division • Update on the NAAQS and the SIP for Texas • KS and BF • May 5, 2015 • Page 54
2012 PM2.5 Standard
• Near-road monitoring network requirements– Monitors currently being deployed in HGB and DFW
Fort Worth California Parkway North
Houston North Loop
– Monitors in Austin and San Antonio by January 1, 2017

Air Quality Division • Update on the NAAQS and the SIP for Texas • KS and BF • May 5, 2015 • Page 55
Nitrogen Dioxide
Air Quality Division • Update on the NAAQS and the SIP for Texas • KS and BF • May 5, 2015 • Page 56
2010 NO2 NAAQS
• Final rule published February 2010
• Near-road monitoring network requirements
– Monitors deployed in HGB and San Antonio areas (1 in each) in January 2014
– Monitors deployed in DFW and Austin areas (1 in each) in April 2014
– Second monitors in DFW and HGB expected by Spring 2015
– Monitors in El Paso and the Rio Grande Valley areas expected by January 1, 2017

Air Quality Division • Update on the NAAQS and the SIP for Texas • KS and BF • May 5, 2015 • Page 57
2010 NO2 NAAQS
• Initial designations published February 2012
• All areas of the U.S. unclassifiable/attainment
• EPA to redesignate areas when three years of data collected from new monitors (likely 2017 or 2018 )
• Infrastructure and Transport SIP adopted in November 2012
Air Quality Division • Update on the NAAQS and the SIP for Texas • KS and BF • May 5, 2015 • Page 58
CarbonMonoxide
Air Quality Division • Update on the NAAQS and the SIP for Texas • KS and BF • May 5, 2015 • Page 59
CO NAAQS
• Final rule to retain the CO NAAQS published August 15, 2011
• Requires one CO monitor to be collocated with one required near-road NO2 monitor in Core Based Statistical Areas with populations of 1 million or more
• All areas in Texas attainment
Air Quality Division • Update on the NAAQS and the SIP for Texas • KS and BF • May 5, 2015 • Page 60
CO NAAQS
• El Paso CO Maintenance Plan SIP revision adopted January 2008
• El Paso redesignated to attainment effective October 2008
• Second 10-year maintenance plan due to the EPA October 2016
Air Quality Division • Update on the NAAQS and the SIP for Texas • KS and BF • May 5, 2015 • Page 61
Interstate Transport
Air Quality Division • Update on the NAAQS and the SIP for Texas • KS and BF • May 5, 2015 • Page 62
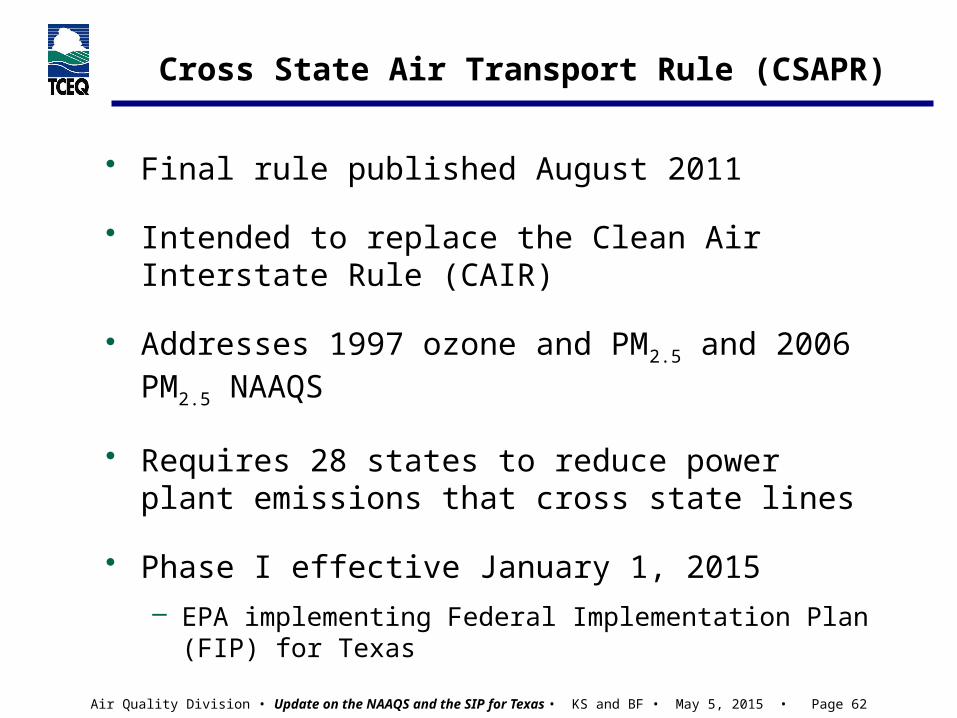
Cross State Air Transport Rule (CSAPR)
• Final rule published August 2011
• Intended to replace the Clean Air Interstate Rule (CAIR)
• Addresses 1997 ozone and PM2.5 and 2006 PM2.5 NAAQS
• Requires 28 states to reduce power plant emissions that cross state lines
• Phase I effective January 1, 2015– EPA implementing Federal Implementation Plan
(FIP) for Texas
Air Quality Division • Update on the NAAQS and the SIP for Texas • KS and BF • May 5, 2015 • Page 63
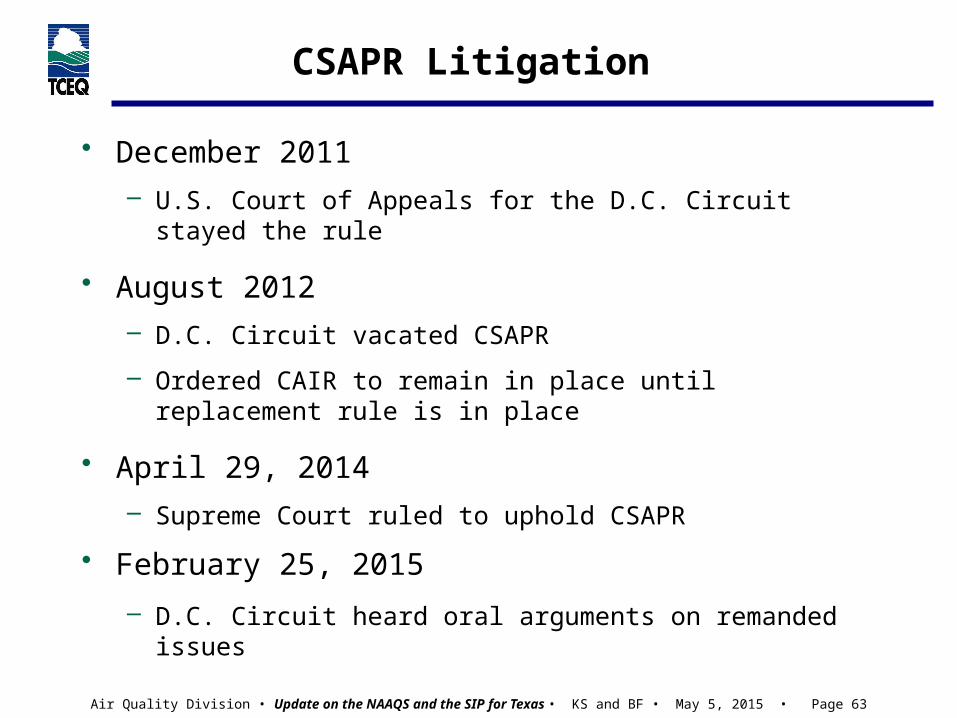
• December 2011 – U.S. Court of Appeals for the D.C. Circuit stayed the
rule
• August 2012 – D.C. Circuit vacated CSAPR
– Ordered CAIR to remain in place until replacement rule is in place
• April 29, 2014– Supreme Court ruled to uphold CSAPR
• February 25, 2015
– D.C. Circuit heard oral arguments on remanded issues
CSAPR Litigation
Air Quality Division • Update on the NAAQS and the SIP for Texas • KS and BF • May 5, 2015 • Page 64
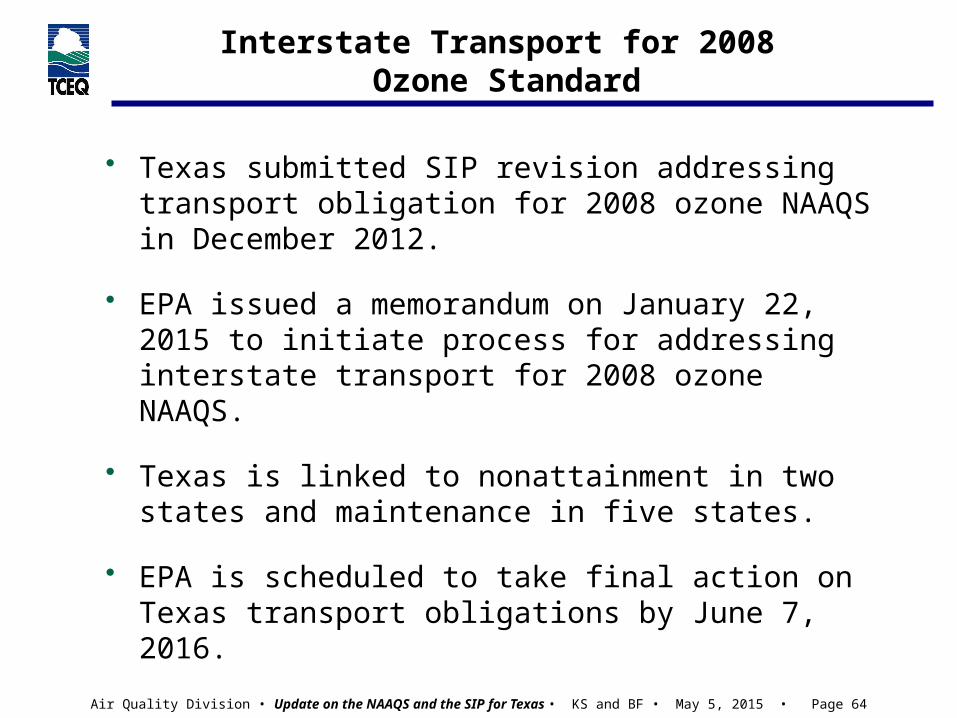
Interstate Transport for 2008 Ozone Standard
• Texas submitted SIP revision addressing transport obligation for 2008 ozone NAAQS in December 2012.
• EPA issued a memorandum on January 22, 2015 to initiate process for addressing interstate transport for 2008 ozone NAAQS.
• Texas is linked to nonattainment in two states and maintenance in five states.
• EPA is scheduled to take final action on Texas transport obligations by June 7, 2016.
Air Quality Division • Update on the NAAQS and the SIP for Texas • KS and BF • May 5, 2015 • Page 65
Regional Haze
Big Bend National Park
Guadalupe Mountains National Park
NPS Photos

Air Quality Division • Update on the NAAQS and the SIP for Texas • KS and BF • May 5, 2015 • Page 66
Regional Haze
• Rule requires states to improve visibility in 156 national parks and wilderness areas and not impact parks outside of the state– Texas: Big Bend National Park and Guadalupe
Mountains National Park – Oklahoma: Wichita Mountains Wilderness
• Regional Haze SIP revision submitted to EPA in March 2009
• Five-year Regional Haze Progress Report submitted to EPA on March 20, 2014
• Next Regional Haze SIP is scheduled for 2018
Air Quality Division • Update on the NAAQS and the SIP for Texas • KS and BF • May 5, 2015 • Page 67
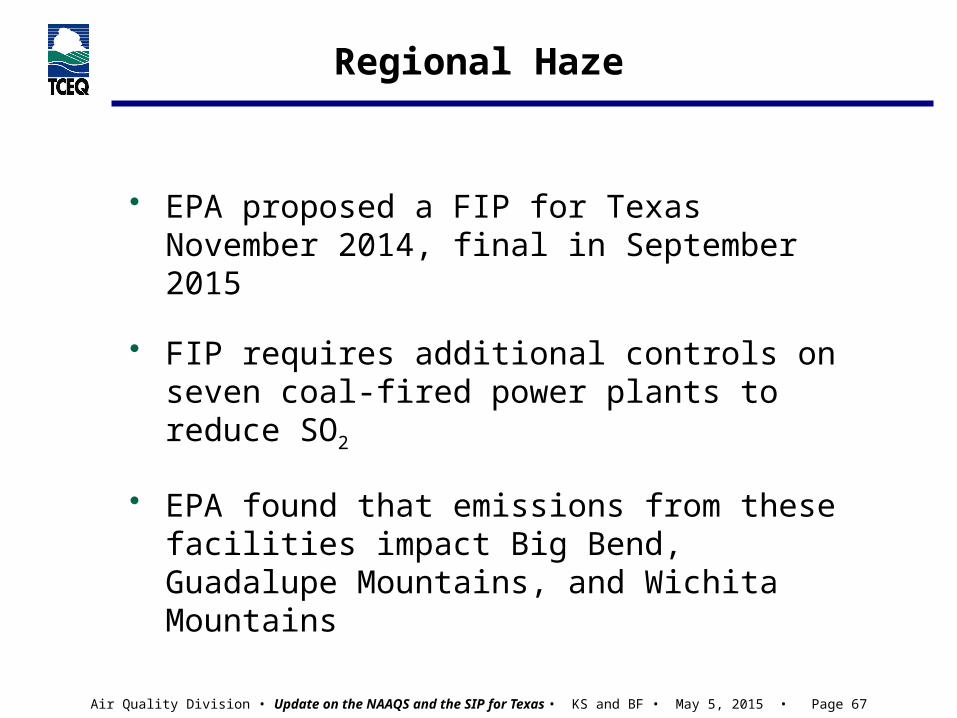
Regional Haze
• EPA proposed a FIP for Texas November 2014, final in September 2015
• FIP requires additional controls on seven coal-fired power plants to reduce SO2
• EPA found that emissions from these facilities impact Big Bend, Guadalupe Mountains, and Wichita Mountains
Air Quality Division • Update on the NAAQS and the SIP for Texas • KS and BF • May 5, 2015 • Page 68
Contact Information
• Kasey Savanich– Data Analysis Team
– 512-239-1145
• Brian Foster– SIP Team
– 512-239-1930
• To join the SIP/Air Quality update e-mail list go to: www.tceq.texas.gov/airquality/sip/sipcontact.html

Questions?