Update on Life Cycle Costing (LCC) project
29
Update on Life Cycle Costing (LCC) project Ugo Pretato – Elia Rillo Studio Fieschi & soci S.r.l. GPP Advisory Group meeting Amsterdam, 20 April 2016
Transcript of Update on Life Cycle Costing (LCC) project

Update on Life Cycle Costing (LCC) project
Ugo Pretato – Elia Rillo
Studio Fieschi & soci S.r.l.
GPP Advisory Group meeting
Amsterdam, 20 April 2016

• Introduction
• Project timeline
• Methodology
Direct costs
Externalities
• Results from the pilot phase
• Tool structure and features
• User’s Guide
• Changes to be implemented in the tool
• Next steps
2
Summary

3
Introduction
Project goal
Develop an electronic tool that will help the user to calculate the life cycle costs for goods where a substantial part of the overall costs comes from electricity use.
The tool may be used as part of a tendering process, as a contribution to developing a business case, or to analyse the current situation in view of a potential need of further purchases.
The tool is focused on five product categories:
• Office IT equipment
• Office & street lighting
• White goods
• Vending machines
• Electrical medical equipment
Project team:
• Studio Fieschi & soci
• Scuola Superiore Sant’Anna di Pisa (SSSUP)

gen-15 feb-15 mar-15 apr-15 mag-15 giu-15 lug-15 ago-15 set-15 ott-15 nov-15 dic-15 gen-16 feb-16 mar-16 apr-16 mag-16 giu-16
A Preliminary analysis
B Tool design
CBackground database
development
DPublic Authorities
needs identification
2
3
4
- K
ick-
off
me
eti
ng
- M
inu
tes
of
the
kic
k-o
ff
Too
l an
d u
ser’
s gu
ide
con
cep
ts
Inte
rim
re
po
rt
Firs
t ve
rsio
n o
f th
e t
oo
l
and
use
r’s
guid
e
Re
sult
s fr
om
th
e p
ilo
t
ph
ase
Seco
nd
ve
rsio
n o
f th
e t
oo
l
and
use
r’s
guid
e
Fin
al t
ran
slat
ed
ve
rsio
n o
f
the
to
ol
Fin
al r
ep
ort
First Tool refinement
Tool completion
Tasks Sub-tasks
MONTHS after signature of contract
1Analysis and
development
Second Tool refinement
Fin
al v
ers
ion
of
the
to
ol,
use
r's
guid
e a
nd
add
itio
nal
do
cum
en
tati
on
DELIVERABLES =>
D1.
1
D1.
2
D1.
4
D1.
5
D2.
1
D2.
2
D3.
1
D4.
1
D4.
2
D1.
3
Completed task
Active/future task
End of testing phase
Internal review
Delivery of second version to GPP Advisory Group
GPP Advisory Group meeting
Start translation
End translation
4
Project timeline
WE ARE HERE

5
Methodology
LCC
Acquisition Maintenance End-of-Life
0 Pre-acquisition costs - Selling price
Post-acquisition costs
Environmental Externalities External costs
Direct Costs
Indirect Costs
Life-Cycle Costing is a methodology where costs of a given asset are considered throughout its life-cycle (2014/24/EU - Art. 67)
Use
Costs imputed to environmental externalities linked to the product, service or works during its life-cycle, provided their monetary value can be determined and verified. (2014/24/EU - Art. 68)

Direct costs are costs paid by the Public Administration along the life cycle of a product: - Purchasing cost - Distribution costs - Installation costs - Costs of functioning during the use phase (e.g. energy, water, consumables,
etc.) - Repair and maintenance costs - Disposal, recycling costs
6
Direct costs
The LCC approach identifies all future costs and reduces them to their present value by the use of discounting techniques. Steps in the calculation of LCC:
• Identifying and calculating the cost items • Discounting all costs to the baseline period • Summing up discounted costs to establish the present value

7
Externalities During the development of the tool, the following externalities have been assessed: • Climate Change • Human Health • Ecosystems • Resources Availability
It was evaluated and agreed with the Commission that the available methods for the evaluation and monetization of externalities for Human Health, Ecosystems and Resources Availability are currently not robust enough to meet the requirements of Art. 68 of Directive 2014/24/EU. Therefore, the tool performs calculations only for the impact category Climate Change and only related to the use phase of products. Since more robust methods could become available in future, the tool is structured to allow an easy upgrade including calculations for the other impact categories.
CALCULATION PROCEDURE The equation exemplifies the calculation procedure for externalities, referred to the impact category Climate Change, for 1 kWh of electricity (EU 27 mix).
1 𝑘𝑊ℎ ∗ 0.569𝑘𝑔𝐶𝑂2 𝑒𝑞
𝑘𝑊ℎ∗ 0.04
€
𝑘𝑔𝐶𝑂2 𝑒𝑞 = 0.023 €
EXTERNALITY
IMPACT FACTOR
FOR 1 kWh OF
ELECTRICITY
(EU 27
PRODUCTION MIX)
MONETIZATION
FACTOR
(DIRECTIVE
2009/33/EC
MONETARY
VALUE FOR 1
kWh OF
ELECTRICITY
(EU 27)
Climate
change 0.569 0.04 0.023 €

Purpose of the testing phase was to collect feedback on the LCC tool usability by a sample of public administrations involved in procurement activities, which represent the main target of the LCC tool project.
8
Results from the pilot phase (1/2)
The tool test obtained an overall positive feedback. All participants were able to use the tool in various exercises and to explore the whole range of capabilities.
Only few and minor errors were reported. All of them were investigated and resolved.
The participants expressed interest for instruments such as the LCC tool as support for decision-making, especially regarding the assessment of direct costs. Two participants declared doubts regarding the use of externalities in Public Procurement procedures.

MAIN COMMENTS
• All participants were able to use the tool
• All participants found the tool friendly and easy to use
• A few difficulties interacting with the tool were reported, in most cases related to non-fully compatible versions of MS-Office
• Two participants suggested to skip externalities evaluation since it may generate uncertainty in the tender awarding process
• One participant suggested to include more explanations on how to use the tool for tender evaluation
• One participant pointed out that using such tool for centralized acquisition may result in an excessive workload for the PA. In addition, it would increase the risk of errors
9
Results from the pilot phase (2/2)

10
Tool: structure & features
LCC CALCULATION TOOL Calculation tool developed to meet the requirements of EU Directive 24/2014 regarding the implementation of life cycle perspective in public procurement. The tool has been developed with Ms-Office 2013, for MS-Windows based computers. The tool has been tested also on Office 2010.

•
•
•
•
• MAIN
Product category Reference product Available actions
• IT_PC Office IT equipment ComputerInsert, edit or delete
products. 30
• IT_DS Office IT equipment Computer DisplayInsert, edit or delete
products. 31
• IT_IE Office IT equipment Imaging equipmentInsert, edit or delete
products. 32
• LT_GL Office & street l ighting Generic luminaireInsert, edit or delete
products. 33
Select the general settings (e.g. tool language, currency, exchange rate).
Sheet name
INSTRUCTIONSUse coloured buttons to access the forms to fill in data
Use grey buttons to browse the tool
The table below includes a complete list of the available sheets.
Detailed instructions are included in the User's Guide
Content
GO TO MAIN
GO TO REFERENCES
11
WELCOME (section)
WELCOME PAGE This page includes: • General instructions (1)
• The complete list of sheets
available in the tool (2)
To browse the tool, the user shall use the provided navigation buttons (3)
Developed by:
v.0.8 30/03/2016
Introduction
"Life Cycle Costing (LCC) calculation Tool"
Warning
This is an electronic tool designed to perform life cycle costing (LCC) for a specific range of products commonly featured in public tenders.
The tool, distributed by the European Commission, derives from provisions made in the new Directive 2014/24/EU, which significantly innovate the tender evaluation
and award process through placing considerable importance on LCC.
Please note: this Tool has been developed and tested with Excel 2013 and 2010. In order to use it, macros have to be activated. To enable macros, go to File =>
Options => Trust center => Trust Center Settings => Macro settings and select "Disable all Macros with notification". In the yellow banner, select "Enable content" to
activate the macros.
1
2
3

12
MAIN (section)
MAIN CONTROL PANEL With the control panel, the user has access to the general settings: • Language
• Currency
• Product category and product
• User details
• Comments
Tool language English
Currency [EUR] euro
Exchange rate 1 EUR = 1 EUR
Exchange rate reference date 31/08/2015
Product category White goods
Product Washing machine
User name John
User information (e.g. office/branch) Doe
Comments
MAIN CONTROL PANEL

13
PRODUCT SHEETS (section)
PRODUCT SHEET The tool includes 22 sheets to assess the various products included in the tool scope. All data are saved in the reference sheet where the user may edit and/or delete them. Each sheet can store data for up to ten products.
255 255 255
GENERAL DATA
N° UNIT VALUE [EU] European Union 0
1 % 2,50%
2 % 10,00% 10,00%
3 EUR/kWh 0,15
4 - EU 1 2 3 4 100
5 Years 10 Supplier_1 Supplier_1 Supplier_2 Supplier_3
Prod_1 Prod_2 Prod_3 Prod_4
PRODUCT SPECIFIC DATA
N° LIFE CYCLE PHASE INPUT NAMESupplier_1 -
Prod_1
Supplier_1 -
Prod_2
Supplier_2 -
Prod_3
Supplier_3 -
Prod_40
1 Purchasing cost 500 600 400
2 Delivery expenses 0 20 0
3 Installation cost 0 0 0
4 Number of cycles per year 150
5 Annual electricity consumption 350 357
6 Electricity consumption per cycle 1,8
7 Cycle duration 120
8 Power consumption in left on-mode 15
9 Power consumption in off-mode 5
10 Annual thermal energy consumption 750 500 800
11 Thermal energy consumption per cycle
12 Thermal energy source Light fuel oil Wood pellets Natural gas
13 Energy price for thermal energy production 0,04 0,04 0,04
14 Annual water consumption 3000 2800 3000
15 Water consumption per cycle
16 Water price 2 2 2
17 Annual detergent consumption 70 70 70
18 Detergent consumption per cycle
19 Cost of detergent 2 2 2
20 Annual softener consumption 15 15 15
21 Softener consumption per cycle
22 Cost of softener 2 2 2
23 Annual rising agent consumption 10 10 10
24 Rinsing agent consumption per cycle
25 Cost of rinsing agent 2 2 2
26 Warranty 2 2 2
27 Maintenance/service contract costs 40 50 60
28 Estimated maintenance costs
29 Expected product lifetime 10 8 8
30 Cost of disposal 10 10 10
31 Rated capacity 5 6 5
32 Rated capacity
EUR
kg
%
kg/h
EUR/kg
Liters/cycle
EUR/m3
kg/year
kg/cycle
EUR/kg
kg/year
kg/cycle
EUR/kg
kg/year
kg/cycle
EUR/MJ
Liters/year
kWh/cycle
min/cycle
W
Cycles/year
Use & end-of-life
Country
kWh/year
Purchase
EUR
EUR
EUR
W
MJ/year
MJ/cycle
Years
EUR/year
Years
-
UNIT
Electricity price
White goods
Washing machine
Product category
INPUT NAME
Product
Economic period considered
Discount rate
Amortization coefficient

14
PRODUCT SHEETS: user form
GENERAL DATA Data are filled using a form, designed to guide the user through the entire process. The first set of information is related to general data, i.e. valid for all products modeled in the selected sheet (1). The voice ‘Country’ will allow the regionalization of externalities in future versions (2). In the current version European Union is set by default.
255 255 255
GENERAL DATA
N° UNIT VALUE [EU] European Union 0
1 % 2,50%
2 % 10,00% 10,00%
3 EUR/kWh 0,15
4 - EU 1 2 3 4 100
5 Years 10 Supplier_1 Supplier_1 Supplier_2 Supplier_3
Prod_1 Prod_2 Prod_3 Prod_4
PRODUCT SPECIFIC DATA
N° LIFE CYCLE PHASE INPUT NAMESupplier_1 -
Prod_1
Supplier_1 -
Prod_2
Supplier_2 -
Prod_3
Supplier_3 -
Prod_40
1 Purchasing cost 500 600 400
2 Delivery expenses 0 20 0
3 Installation cost 0 0 0
4 Number of cycles per year 150
5 Annual electricity consumption 350 357
6 Electricity consumption per cycle 1,8
7 Cycle duration 120
8 Power consumption in left on-mode 15
9 Power consumption in off-mode 5
10 Annual thermal energy consumption 750 500 800
11 Thermal energy consumption per cycle
12 Thermal energy source Light fuel oil Wood pellets Natural gas
13 Energy price for thermal energy production 0,04 0,04 0,04
14 Annual water consumption 3000 2800 3000
15 Water consumption per cycle
16 Water price 2 2 2
17 Annual detergent consumption 70 70 70
18 Detergent consumption per cycle
19 Cost of detergent 2 2 2
20 Annual softener consumption 15 15 15
21 Softener consumption per cycle
22 Cost of softener 2 2 2
23 Annual rising agent consumption 10 10 10
24 Rinsing agent consumption per cycle
25 Cost of rinsing agent 2 2 2
26 Warranty 2 2 2
27 Maintenance/service contract costs 40 50 60
28 Estimated maintenance costs
29 Expected product lifetime 10 8 8
30 Cost of disposal 10 10 10
31 Rated capacity 5 6 5
32 Rated capacity
EUR
kg
%
kg/h
EUR/kg
Liters/cycle
EUR/m3
kg/year
kg/cycle
EUR/kg
kg/year
kg/cycle
EUR/kg
kg/year
kg/cycle
EUR/MJ
Liters/year
kWh/cycle
min/cycle
W
Cycles/year
Use & end-of-life
Country
kWh/year
Purchase
EUR
EUR
EUR
W
MJ/year
MJ/cycle
Years
EUR/year
Years
-
UNIT
Electricity price
White goods
Washing machine
Product category
INPUT NAME
Product
Economic period considered
Discount rate
Amortization coefficient
15
PRODUCT SHEETS: user form
255 255 255
GENERAL DATA
N° UNIT VALUE [EU] European Union 0
1 % 2,50%
2 % 10,00% 10,00%
3 EUR/kWh 0,15
4 - EU 1 2 3 4 100
5 Years 10 Supplier_1 Supplier_1 Supplier_2 Supplier_3
Prod_1 Prod_2 Prod_3 Prod_4
PRODUCT SPECIFIC DATA
N° LIFE CYCLE PHASE INPUT NAMESupplier_1 -
Prod_1
Supplier_1 -
Prod_2
Supplier_2 -
Prod_3
Supplier_3 -
Prod_40
1 Purchasing cost 500 600 400
2 Delivery expenses 0 20 0
3 Installation cost 0 0 0
4 Number of cycles per year 150
5 Annual electricity consumption 350 357
6 Electricity consumption per cycle 1,8
7 Cycle duration 120
8 Power consumption in left on-mode 15
9 Power consumption in off-mode 5
10 Annual thermal energy consumption 750 500 800
11 Thermal energy consumption per cycle
12 Thermal energy source Light fuel oil Wood pellets Natural gas
13 Energy price for thermal energy production 0,04 0,04 0,04
14 Annual water consumption 3000 2800 3000
15 Water consumption per cycle
16 Water price 2 2 2
17 Annual detergent consumption 70 70 70
18 Detergent consumption per cycle
19 Cost of detergent 2 2 2
20 Annual softener consumption 15 15 15
21 Softener consumption per cycle
22 Cost of softener 2 2 2
23 Annual rising agent consumption 10 10 10
24 Rinsing agent consumption per cycle
25 Cost of rinsing agent 2 2 2
26 Warranty 2 2 2
27 Maintenance/service contract costs 40 50 60
28 Estimated maintenance costs
29 Expected product lifetime 10 8 8
30 Cost of disposal 10 10 10
31 Rated capacity 5 6 5
32 Rated capacity
EUR
kg
%
kg/h
EUR/kg
Liters/cycle
EUR/m3
kg/year
kg/cycle
EUR/kg
kg/year
kg/cycle
EUR/kg
kg/year
kg/cycle
EUR/MJ
Liters/year
kWh/cycle
min/cycle
W
Cycles/year
Use & end-of-life
Country
kWh/year
Purchase
EUR
EUR
EUR
W
MJ/year
MJ/cycle
Years
EUR/year
Years
-
UNIT
Electricity price
White goods
Washing machine
Product category
INPUT NAME
Product
Economic period considered
Discount rate
Amortization coefficient
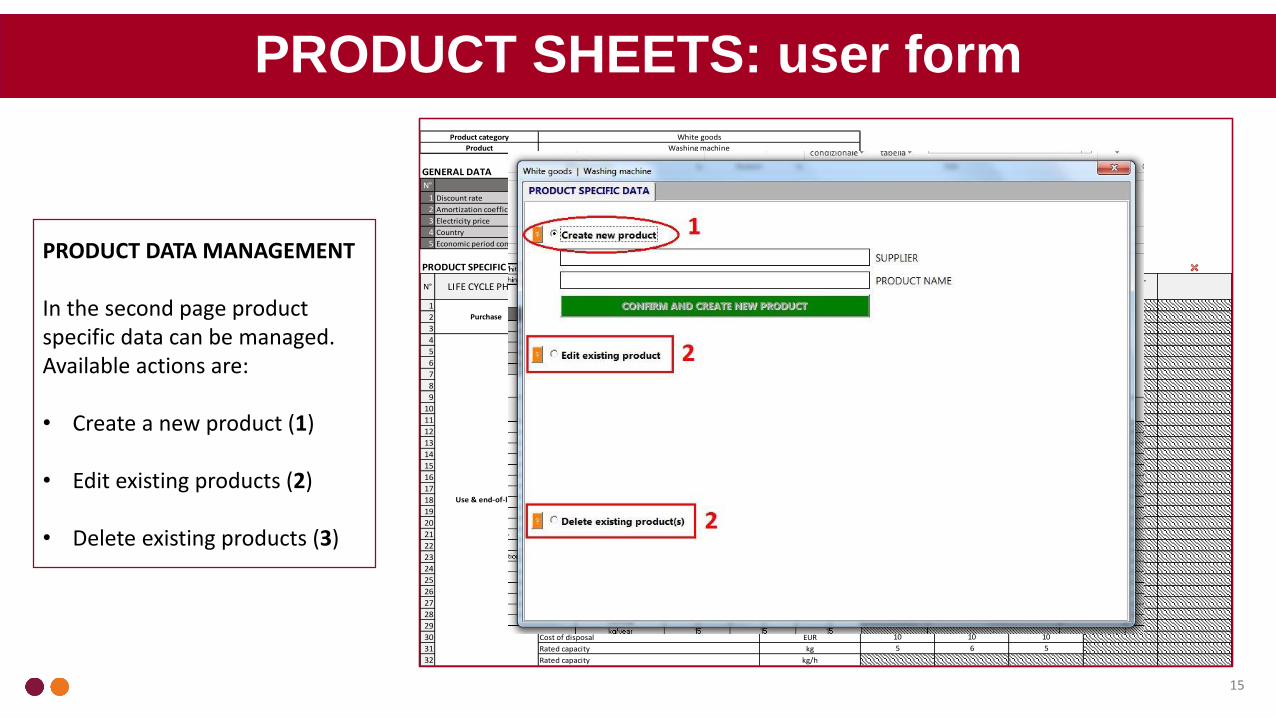
PRODUCT DATA MANAGEMENT In the second page product specific data can be managed. Available actions are: • Create a new product (1) • Edit existing products (2)
• Delete existing products (3)

16
PRODUCT SHEETS: user form
255 255 255
GENERAL DATA
N° UNIT VALUE [EU] European Union 0
1 % 2,50%
2 % 10,00% 10,00%
3 EUR/kWh 0,15
4 - EU 1 2 3 4 100
5 Years 10 Supplier_1 Supplier_1 Supplier_2 Supplier_3
Prod_1 Prod_2 Prod_3 Prod_4
PRODUCT SPECIFIC DATA
N° LIFE CYCLE PHASE INPUT NAMESupplier_1 -
Prod_1
Supplier_1 -
Prod_2
Supplier_2 -
Prod_3
Supplier_3 -
Prod_40
1 Purchasing cost 500 600 400
2 Delivery expenses 0 20 0
3 Installation cost 0 0 0
4 Number of cycles per year 150
5 Annual electricity consumption 350 357
6 Electricity consumption per cycle 1,8
7 Cycle duration 120
8 Power consumption in left on-mode 15
9 Power consumption in off-mode 5
10 Annual thermal energy consumption 750 500 800
11 Thermal energy consumption per cycle
12 Thermal energy source Light fuel oil Wood pellets Natural gas
13 Energy price for thermal energy production 0,04 0,04 0,04
14 Annual water consumption 3000 2800 3000
15 Water consumption per cycle
16 Water price 2 2 2
17 Annual detergent consumption 70 70 70
18 Detergent consumption per cycle
19 Cost of detergent 2 2 2
20 Annual softener consumption 15 15 15
21 Softener consumption per cycle
22 Cost of softener 2 2 2
23 Annual rising agent consumption 10 10 10
24 Rinsing agent consumption per cycle
25 Cost of rinsing agent 2 2 2
26 Warranty 2 2 2
27 Maintenance/service contract costs 40 50 60
28 Estimated maintenance costs
29 Expected product lifetime 10 8 8
30 Cost of disposal 10 10 10
31 Rated capacity 5 6 5
32 Rated capacity
EUR
kg
%
kg/h
EUR/kg
Liters/cycle
EUR/m3
kg/year
kg/cycle
EUR/kg
kg/year
kg/cycle
EUR/kg
kg/year
kg/cycle
EUR/MJ
Liters/year
kWh/cycle
min/cycle
W
Cycles/year
Use & end-of-life
Country
kWh/year
Purchase
EUR
EUR
EUR
W
MJ/year
MJ/cycle
Years
EUR/year
Years
-
UNIT
Electricity price
White goods
Washing machine
Product category
INPUT NAME
Product
Economic period considered
Discount rate
Amortization coefficient
PRODUCT SPECIFIC INPUTS All product specific inputs are organized following a life cycle perspective, therefore a distinction between life stages is established. The fist inputs are related to the purchase phase.

17
PRODUCT SHEETS: user form
255 255 255
GENERAL DATA
N° UNIT VALUE [EU] European Union 0
1 % 2,50%
2 % 10,00% 10,00%
3 EUR/kWh 0,15
4 - EU 1 2 3 4 100
5 Years 10 Supplier_1 Supplier_1 Supplier_2 Supplier_3
Prod_1 Prod_2 Prod_3 Prod_4
PRODUCT SPECIFIC DATA
N° LIFE CYCLE PHASE INPUT NAMESupplier_1 -
Prod_1
Supplier_1 -
Prod_2
Supplier_2 -
Prod_3
Supplier_3 -
Prod_40
1 Purchasing cost 500 600 400
2 Delivery expenses 0 20 0
3 Installation cost 0 0 0
4 Number of cycles per year 150
5 Annual electricity consumption 350 357
6 Electricity consumption per cycle 1,8
7 Cycle duration 120
8 Power consumption in left on-mode 15
9 Power consumption in off-mode 5
10 Annual thermal energy consumption 750 500 800
11 Thermal energy consumption per cycle
12 Thermal energy source Light fuel oil Wood pellets Natural gas
13 Energy price for thermal energy production 0,04 0,04 0,04
14 Annual water consumption 3000 2800 3000
15 Water consumption per cycle
16 Water price 2 2 2
17 Annual detergent consumption 70 70 70
18 Detergent consumption per cycle
19 Cost of detergent 2 2 2
20 Annual softener consumption 15 15 15
21 Softener consumption per cycle
22 Cost of softener 2 2 2
23 Annual rising agent consumption 10 10 10
24 Rinsing agent consumption per cycle
25 Cost of rinsing agent 2 2 2
26 Warranty 2 2 2
27 Maintenance/service contract costs 40 50 60
28 Estimated maintenance costs
29 Expected product lifetime 10 8 8
30 Cost of disposal 10 10 10
31 Rated capacity 5 6 5
32 Rated capacity
EUR
kg
%
kg/h
EUR/kg
Liters/cycle
EUR/m3
kg/year
kg/cycle
EUR/kg
kg/year
kg/cycle
EUR/kg
kg/year
kg/cycle
EUR/MJ
Liters/year
kWh/cycle
min/cycle
W
Cycles/year
Use & end-of-life
Country
kWh/year
Purchase
EUR
EUR
EUR
W
MJ/year
MJ/cycle
Years
EUR/year
Years
-
UNIT
Electricity price
White goods
Washing machine
Product category
INPUT NAME
Product
Economic period considered
Discount rate
Amortization coefficient
PRODUCT SPECIFIC INPUTS The second set of data refers to use & end-of-life stages. In this section data such as energy and water consumption, product lifetime and cost of disposal are filled in. For some inputs the user may select an alternative option, set to facilitate data collection.
Points where changes are planned
See slides 26-27

18
PRODUCT SHEETS: Help
255 255 255
GENERAL DATA
N° UNIT VALUE [EU] European Union 0
1 % 2,50%
2 % 10,00% 10,00%
3 EUR/kWh 0,15
4 - EU 1 2 3 4 100
5 Years 10 Supplier_1 Supplier_1 Supplier_2 Supplier_3
Prod_1 Prod_2 Prod_3 Prod_4
PRODUCT SPECIFIC DATA
N° LIFE CYCLE PHASE INPUT NAMESupplier_1 -
Prod_1
Supplier_1 -
Prod_2
Supplier_2 -
Prod_3
Supplier_3 -
Prod_40
1 Purchasing cost 500 600 400
2 Delivery expenses 0 20 0
3 Installation cost 0 0 0
4 Number of cycles per year 150
5 Annual electricity consumption 350 357
6 Electricity consumption per cycle 1,8
7 Cycle duration 120
8 Power consumption in left on-mode 15
9 Power consumption in off-mode 5
10 Annual thermal energy consumption 750 500 800
11 Thermal energy consumption per cycle
12 Thermal energy source Light fuel oil Wood pellets Natural gas
13 Energy price for thermal energy production 0,04 0,04 0,04
14 Annual water consumption 3000 2800 3000
15 Water consumption per cycle
16 Water price 2 2 2
17 Annual detergent consumption 70 70 70
18 Detergent consumption per cycle
19 Cost of detergent 2 2 2
20 Annual softener consumption 15 15 15
21 Softener consumption per cycle
22 Cost of softener 2 2 2
23 Annual rising agent consumption 10 10 10
24 Rinsing agent consumption per cycle
25 Cost of rinsing agent 2 2 2
26 Warranty 2 2 2
27 Maintenance/service contract costs 40 50 60
28 Estimated maintenance costs
29 Expected product lifetime 10 8 8
30 Cost of disposal 10 10 10
31 Rated capacity 5 6 5
32 Rated capacity
EUR
kg
%
kg/h
EUR/kg
Liters/cycle
EUR/m3
kg/year
kg/cycle
EUR/kg
kg/year
kg/cycle
EUR/kg
kg/year
kg/cycle
EUR/MJ
Liters/year
kWh/cycle
min/cycle
W
Cycles/year
Use & end-of-life
Country
kWh/year
Purchase
EUR
EUR
EUR
W
MJ/year
MJ/cycle
Years
EUR/year
Years
-
UNIT
Electricity price
White goods
Washing machine
Product category
INPUT NAME
Product
Economic period considered
Discount rate
Amortization coefficient
HELP For each input, the orange button with the question mark displays the help window. Help windows provide information regarding the selected input (definition, WARNING, DEFAULT VALUES).

OUTPUT (section)
GENERAL INFORMATION The first page of the OUTPUT sheet displays the products under assessment (incomplete data are marked by a red ‘!’). In addition, this page features general remarks about the interpretation of results.
19
GENERAL INFORMATION
1
2
3
4 !
5
6
7
8
9
10
6
7
8
9
10
WG_WM-6
PRODUCT NAMES LEGEND
WG_WM-5
WG_WM-4
WG_WM-3
WG_WM-2
0
Supplier_3 - Prod_4
Supplier_2 - Prod_3
Supplier_1 - Prod_2
CODE PRODUCT NAME
WG_WM-1
DETAILS ON THE INTERPRETATION OF RESULTS:
Supplier_1 - Prod_1
0
0
0
0
0
WG_WM-10
DETAILS ON THE INTERPRETATION OF RESULTS:
Contents available:
• General information
• Life Cycle Costing results - Direct costs
• Cost distribution over time
• Externalities - Climate Change
• Externalities - Human health (disabled)
• Externalities - Ecosystem (disabled)
• Externalities - Resources availability (disabled)
• Overall Life Cycle Costing results - Direct costs
and externalities
WARNING: The tool shows results only for those
products where all necessary data to perform the
calculations have been filled in. Incomplete
products are marked with an “!” in the legend and
are greyed out in the results tables.
WARNING: externalities results for the impact
categories Human Health, Ecosystems and
Resources availability are disabled in this version
of the tool. For details, see the Technical
Specifications, Annex II.
ANALYSIS DETAILS
White goods
Washing machine
PRODUCT CATEGORY
PRODUCT
WG
WM
WG_WM-9
WG_WM-8
WG_WM-7
OUTPUT: direct costs
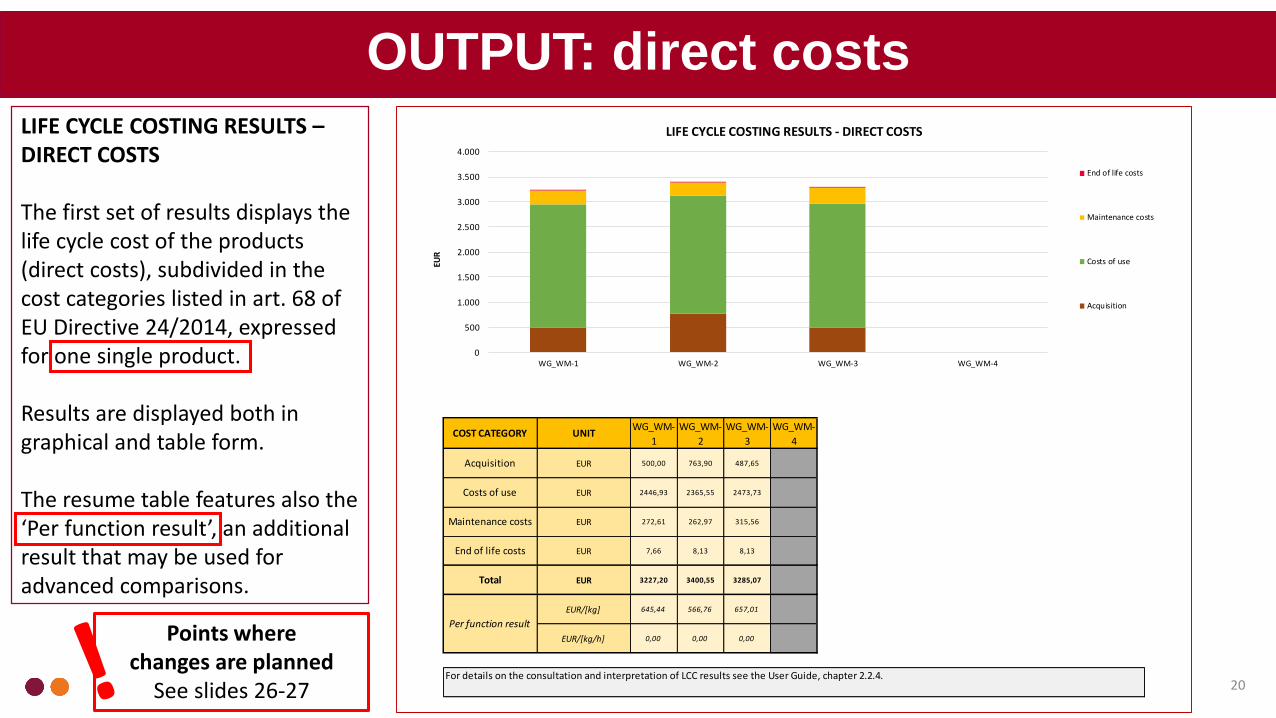
LIFE CYCLE COSTING RESULTS – DIRECT COSTS The first set of results displays the life cycle cost of the products (direct costs), subdivided in the cost categories listed in art. 68 of EU Directive 24/2014, expressed for one single product. Results are displayed both in graphical and table form. The resume table features also the ‘Per function result’, an additional result that may be used for advanced comparisons.
20
LIFE CYCLE COSTING RESULTS - DIRECT COSTS
1 2 3 4 5 6 7 8 9 10
WG_WM-
1
WG_WM-
2
WG_WM-
3
WG_WM-
4
WG_WM-
5
WG_WM-
6
WG_WM-
7
WG_WM-
8
WG_WM-
9
WG_WM-
10
500,00 763,90 487,65 0,00 0,00 0,00 0,00 0,00 0,00 0,00
2446,93 2365,55 2473,73 0,00 0,00 0,00 0,00 0,00 0,00 0,00
272,61 262,97 315,56 0,00 0,00 0,00 0,00 0,00 0,00 0,00
7,66 8,13 8,13 0,00 0,00 0,00 0,00 0,00 0,00 0,00
3227,20 3400,55 3285,07 0,00 0,00 0,00 0,00 0,00 0,00 0,00
645,44 566,76 657,01 0,00 0,00 0,00 0,00 0,00 0,00 0,00
0,00 0,00 0,00 0,00 0,00 0,00 0,00 0,00 0,00 0,00
COST CATEGORY
Acquisition
Costs of use
Maintenance costs
For details on the consultation and interpretation of LCC results see the User Guide, chapter 2.2.4.
EUR/[kg]
End of life costs
Total
Per function result
EUR
EUR/[kg/h]
UNIT
EUR
EUR
EUR
EUR
0
500
1.000
1.500
2.000
2.500
3.000
3.500
4.000
WG_WM-1 WG_WM-2 WG_WM-3 WG_WM-4
EUR
End of life costs
Maintenance costs
Costs of use
Acquisition
Points where changes are planned
See slides 26-27

DISTRIBUTION OF COSTS OVER TIME
YEARS
For details on the consultation and interpretation of cost distribution over time see the User Guide, chapter 2.2.4.
0
500
1.000
1.500
2.000
2.500
3.000
3.500
4.000
0 1 2 3 4 5 6 7 8 9 10
EUR
WG_WM-1 WG_WM-2 WG_WM-3 WG_WM-4
OUTPUT: direct costs
COSTS DISTRIBUTION OVER TIME Costs distribution over time shows the evolution of the cumulative costs year by year. Year 0 marks the purchase of the products. Vertical steps represent products substitutions. The final year marks the products life cycle cost (direct costs). Changes in the slope during the last year are due to the evaluation of the residual value of substituted products.
21

OUTPUT: externalities
EXTERNALITIES Externalities are calculated only for the impact category Climate Change and only related to the use phase. Externalities are reported per externality item. Externalities related to manufacturing are disabled.
22
EXTERNALITIES: CLIMATE CHANGE
1 2 3 4 5 6 7 8 9 10
WG_WM-
1
WG_WM-
2
WG_WM-
3
WG_WM-
4
WG_WM-
5
WG_WM-
6
WG_WM-
7
WG_WM-
8
WG_WM-
9
WG_WM-
10
3,40 2,71 3,27 0,00 0,00 0,00 0,00 0,00 0,00 0,00
Electricity79,69 80,74 81,29 0,00 0,00 0,00 0,00 0,00 0,00 0,00
Thermal energy27,89 0,08 20,92 0,00 0,00 0,00 0,00 0,00 0,00 0,00
Water0,73 0,68 0,73 0,00 0,00 0,00 0,00 0,00 0,00 0,00
Water discharges33,49 31,26 33,49 0,00 0,00 0,00 0,00 0,00 0,00 0,00
Detergent0,00 0,00 0,00 0,00 0,00 0,00 0,00 0,00 0,00 0,00
Softener0,00 0,00 0,00 0,00 0,00 0,00 0,00 0,00 0,00 0,00
Rinsing agent0,00 0,00 0,00 0,00 0,00 0,00 0,00 0,00 0,00 0,00
For details on the consultation and interpretation of Climate Change results see the User's Guide, chapter 2.2.4.
USE
USE
USE
Rinsing agent
Softener
Detergents
Water discharges
Water
Thermal energy
Electricity
-
EXTERNALITY ITEM
USE
USE
USE
USE
MANUFACTURING
LIFE CYCLE PHASE
UNIT: EUR
0
20
40
60
80
100
120
140
160
WG_WM-1 WG_WM-2 WG_WM-3 WG_WM-4
EUR
Rinsing agent
Softener
Detergents
Water discharges
Water
Thermal energy
Electricity
OUTPUT: externalities
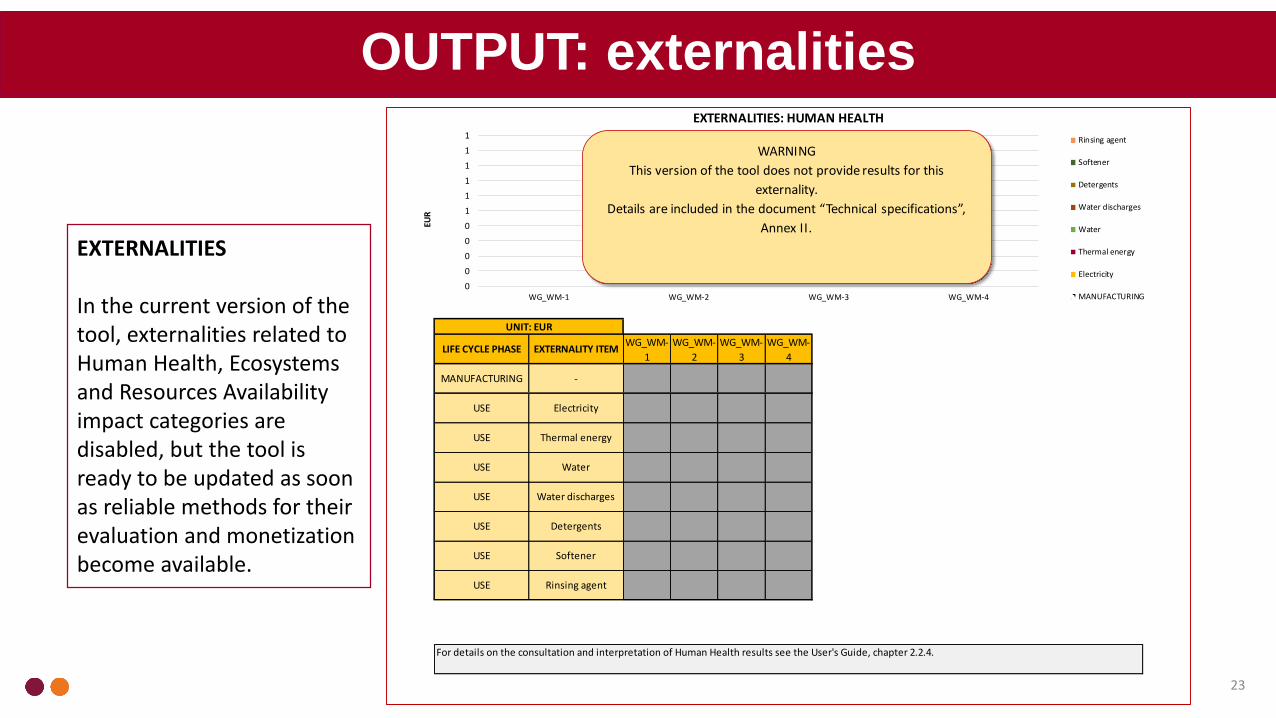
EXTERNALITIES In the current version of the tool, externalities related to Human Health, Ecosystems and Resources Availability impact categories are disabled, but the tool is ready to be updated as soon as reliable methods for their evaluation and monetization become available.
23
EXTERNALITIES: HUMAN HEALTH
1 2 3 4 5 6 7 8 9 10
WG_WM-
1
WG_WM-
2
WG_WM-
3
WG_WM-
4
WG_WM-
5
WG_WM-
6
WG_WM-
7
WG_WM-
8
WG_WM-
9
WG_WM-
10
0,00 0,00 0,00 0,00 0,00 0,00 0,00 0,00 0,00 0,00
Electricity0,00 0,00 0,00 0,00 0,00 0,00 0,00 0,00 0,00 0,00
Thermal energy0,00 0,00 0,00 0,00 0,00 0,00 0,00 0,00 0,00 0,00
Water0,00 0,00 0,00 0,00 0,00 0,00 0,00 0,00 0,00 0,00
Water discharges0,00 0,00 0,00 0,00 0,00 0,00 0,00 0,00 0,00 0,00
Detergent0,00 0,00 0,00 0,00 0,00 0,00 0,00 0,00 0,00 0,00
Softener0,00 0,00 0,00 0,00 0,00 0,00 0,00 0,00 0,00 0,00
Rinsing agent0,00 0,00 0,00 0,00 0,00 0,00 0,00 0,00 0,00 0,00
UNIT: EUR
USE Detergents
USE Softener
USE Rinsing agent
USE Water discharges
LIFE CYCLE PHASE EXTERNALITY ITEM
MANUFACTURING -
USE Electricity
For details on the consultation and interpretation of Human Health results see the User's Guide, chapter 2.2.4.
USE Thermal energy
USE Water
0
0
0
0
0
1
1
1
1
1
1
WG_WM-1 WG_WM-2 WG_WM-3 WG_WM-4
EUR
Rinsing agent
Softener
Detergents
Water discharges
Water
Thermal energy
Electricity
MANUFACTURING
WARNING
This version of the tool does not provide results for this
externality.
Details are included in the document “Technical specifications”,
Annex II.

24
OUTPUT: direct costs and externalities OVERALL LIFE CYCLE COSTING RESULTS - DIRECT COSTS AND EXTERNALITIES
1 2 3 4 5 6 7 8 9 10
WG_WM-
1
WG_WM-
2
WG_WM-
3
WG_WM-
4
WG_WM-
5
WG_WM-
6
WG_WM-
7
WG_WM-
8
WG_WM-
9
WG_WM-
10
3227,20 3400,55 3285,07 0,00 0,00 0,00 0,00 0,00 0,00 0,00
141,80 112,76 136,43 0,00 0,00 0,00 0,00 0,00 0,00 0,00
3369,01 3513,31 3421,50 0,00 0,00 0,00 0,00 0,00 0,00 0,00
For details about consultation and interpretation about the overall Life Cycle Costing results see the User's Guide, chapter 2.2.4
COST CATEGORY UNIT
DIRECT COSTS
EXTERNALITIES
EUR
EUR
TOTAL EUR
0
500
1.000
1.500
2.000
2.500
3.000
3.500
4.000
WG_WM-1 WG_WM-2 WG_WM-3 WG_WM-4
EUR
EXTERNALITIES
DIRECT COSTS
LIFE CYCLE COSTING RESULTS – DIRECT COSTS AND EXTERNALITIES The tool allows the user to display the sum of direct costs and externalities. This output can be enabled/disabled through a dedicated button in the OUTPUT section.
USER’S GUIDE
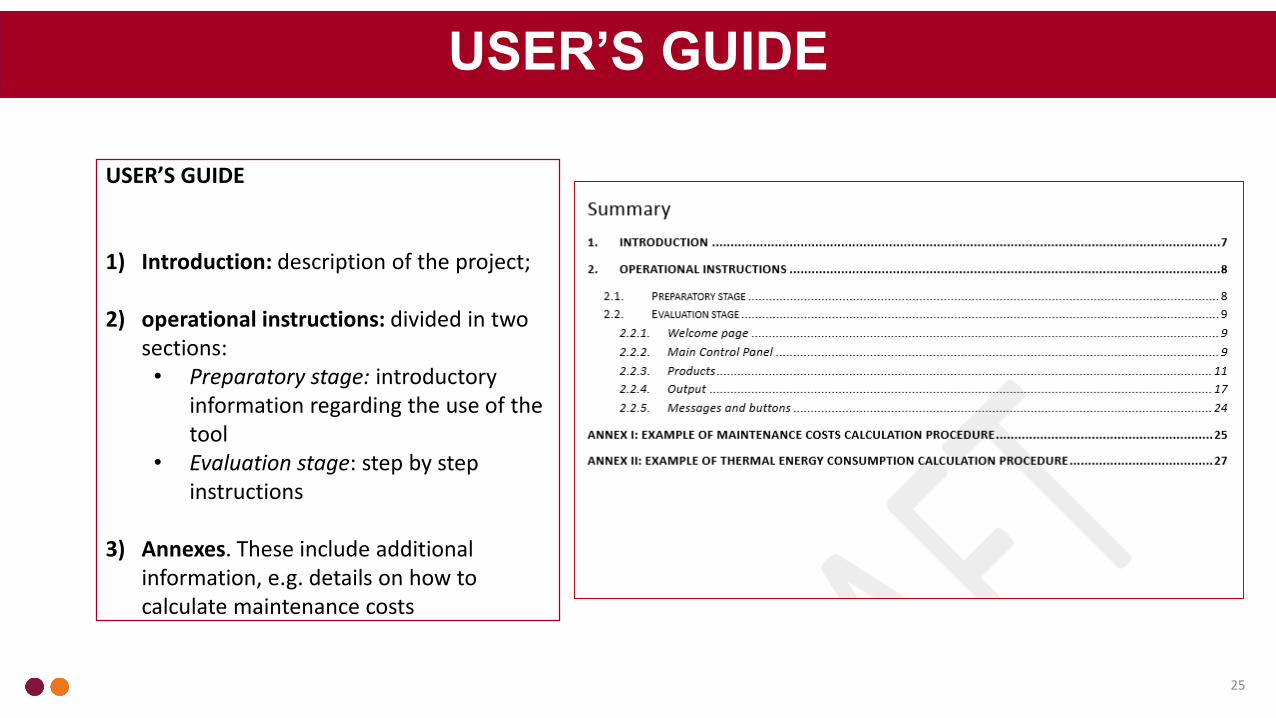
USER’S GUIDE 1) Introduction: description of the project;
2) operational instructions: divided in two
sections: • Preparatory stage: introductory
information regarding the use of the tool
• Evaluation stage: step by step instructions
3) Annexes. These include additional
information, e.g. details on how to calculate maintenance costs
25

26
Key changes to be implemented in the tool (1/2)
Alternative inputs Current situation: The user has the possibility to fill in data using alternative inputs. For example, in the case of washing
machines the user may: a) fill in the measured electricity consumption or b) estimate it using the number of cycles per year
and the electricity consumption per cycle.
The user selects alternative data for each product.
After the change: In case of a tender procedure, the user will select at the beginning of the assessment mode a) or b) and the
same model will be used for all the analyzed products.
Maintenance costs (related to the point above “Alternative inputs”) Current situation: the tool allows the user to input maintenance costs in two modes: expressed directly as maintenance costs
per year or estimated as a percentage of the purchase price.
After the change: In case of a tender procedure, the estimated percentage option will not be available.

27
Key changes to be implemented in the tool (2/2)
Expected product lifetime Current situation: The tool requires to fill in for each analyzed product an expected product lifetime (expressed in years). After the change: In case of a tender procedure, the user will fix at the beginning of the assessment the same lifetime for all the analyzed products.
Results for total purchased amount Current situation: results are provided with reference to buying only one single item. The tool does not provide results for the total purchased amount of each item. After the change: results will be provided both for one product and for the total purchased amount.
Use profile for IT equipment (related to the point above “Alternative inputs”) Current situation: for IT equipment, the operating hours defining the use profile are default values. After the change: the user will be able to fill in specific hours of use and the consumption per different modes.

TASK 3: second tool refinement
• GPP AG feedback (before May 4th)
• All suggestions, comments and proposed changes will be evaluated and discussed with DG Environment. All agreed changes will be included in the final version of the tool. The user’s guide and all other documents will be modified accordingly
• All text elements of the tool and the user’s guide will be provided in editable formats to the EC for translation purposes
• An additional technical document for the EC will describe the methods, technologies and coding architecture utilised, in order to allow a smooth hand over to future contractors for further tool maintenance
28
Next steps
TASK 4: tool completion
• The EC will provide the translation of all text elements of the tool and the user’s guide contents. All these texts will be used to update both the tool and the user’s guide
Expected project conclusion and delivery of the tool: June 2016

Studio Fieschi & soci Srl Via Cesare Lombroso, 25
10125 Torino – Italia Tel: +39 011 65 99 677 [email protected] [email protected]
www.studiofieschi.it
Contacts
29