Update on Central Luzon’s Socioeconomic Performance · Average Inflation Rate (Philippines ) 4.3...
20
Update on Central Luzon’s Socioeconomic Performance Greg L. Pineda NEDA 3 Asst. Regional Director
Transcript of Update on Central Luzon’s Socioeconomic Performance · Average Inflation Rate (Philippines ) 4.3...

Update on Central Luzon’s Socioeconomic Performance
Greg L. PinedaNEDA 3 Asst. Regional Director

GROSS DOMESTIC PRODUCT BY QUARTERGROWTH RATE (%), 2011-2015
4.9
3.63.2
4
6.4 6.3
7.3 7.2
7.77.9
7
6.3
5.6
6.7
5.5
6.6
5.0
5.60
0.0
1.0
2.0
3.0
4.0
5.0
6.0
7.0
8.0
9.0
Q12011
Q2 Q3 Q4 Q12012
Q2 Q3 Q4 Q12013
Q2 Q3 Q4 Q12014
Q2 Q3 Q4 Q12015
Q2

REGION / YEAR 11-12 12-13 13-14
Gross Domestic Product 6.8 7.1 6.1
NCR METRO MANILA 7.0 9.2 5.9
CAR CORDILLERA 1.0 5.4 3.2
I ILOCOS 5.2 6.8 5.7
II CAGAYAN VALLEY 8.1 6.2 6.4
III CENTRAL LUZON 6.5 4.4 9.0
IVA CALABARZON 7.3 6.7 5.1
IVB MIMAROPA 4.8 1.3 6.5
V BICOL 6.9 8.1 4.2
VI WESTERN VISAYAS 7.7 3.4 4.9
VII CENTRAL VISAYAS 9.4 7.4 8.8
VIII EASTERN VISAYAS (6.4) 4.5 (2.3)
IX
ZAMBOANGA
PENINSULA 12.9 4.1 6.5
X NORTHERN MINDANAO 7.2 5.3 7.2
XI DAVAO REGION 7.4 6.7 9.4
XII SOCCSKSARGEN 8.0 8.4 6.4
XIII CARAGA 10.7 8.1 7.8
ARMM MUSLIM MINDANAO 1.1 3.8 3.0
Source: Philippine Statistics Authority
GROSS REGIONAL DOMESTIC PRODUCT GROWTH RATE BY REGION
(At CONSTANT 2000 PRICES)

EMPLOYMENT RATE BY REGION: 2013 and 2014
REGION / YEAR 2013 2014
PHILIPPINES 92.8 93.2
NCR METRO MANILA 89.7 89.6
CAR CORDILLERA 95.4 94.5
I ILOCOS 91.7 91.6
II CAGAYAN VALLEY 96.8 96.3
III CENTRAL LUZON 91.3 91.7
IVA CALABARZON 90.8 91.8
IVB MIMAROPA 95.9 95.4
V BICOL 93.5 93.8
VI WESTERN VISAYAS 93.1 94.0
VII CENTRAL VISAYAS 93.7 94.0
VIII EASTERN VISAYAS - -
IX ZAMBOANGA PENINSULA 96.6 96.3
X NORTHERN MINDANAO 94.3 94.2
XI DAVAO REGION 93.1 94.2
XII SOCCSKSARGEN 95.6 96.4
XIII CARAGA 94.0 94.2
ARMM MUSLIM MINDANAO 95.4 96.5
Source: Philippine Statistics Authority

INDICATOR April January April
2014 2015 2015
Population 15 years and Over (‘000) 7,150 7,244 7,262
Labor Force (‘000) 4,544 4,396 4,532
Employed (‘000) 4,151 4,024 4,171
Unemployed (‘000) 393 373 360
Underemployed (‘000) 560 381 597
Labor Force Participation Rate (%) 63.6 60.7 62.4
Employment Rate (%) 91.4 91.5 92.0
Unemployment Rate (%) 8.6 8.5 8.0
Underemployment Rate (%) 13.5 9.5 14.3
Employment, Unemployment and Underemployment Rates, Region 3
Second Quarter 2014 and First and Second Quarters 2015
Note: Data for April 2015 is preliminary and is subject to change.
Source: Philippine Statistics Authority-RSSO 3

POVERTY THRESHOLD , INCIDENCE AND MAGNITUDE AMONG FAMILIES: REGION 3
Source: Philippine Statistics Authority
INDICATOR/ AREA 2006 2009 2012
ANNUAL PER CAPITA THRESHOLD
Philippines 13,357 16,871 18,935
Central Luzon 14,422 18,188 20,071
POVERTY INCIDENCE
Philippines 21.0 20.5 19.7
Central Luzon 10.3 10.7 10.1
MAGNITUDE OF POOR FAMILIES
Philippines3,809,283 4,036,915 4,214,921
Central Luzon206,568 232,928 240,079

1.6%
0.7%
2.1%
0.4%
1.0%
2.2%
2.9%
2.3%
0.0%
0.5%
1.0%
1.5%
2.0%
2.5%
3.0%
3.5%
Region 3 Aurora Bataan Bulacan Nueva Ecija Pampanga Tarlac Zambales
Inflation Rate by Province: Central Luzon, Second Quarter 2015
43.6 3.4 3.5
3.93.4
4.2 4.2 4.23.7
3.4
21.7 1.9
2.2 2.01.6
1.2
0.4
0.0
1.0
2.0
3.0
4.0
5.0
Jan Feb Mar Apr May Jun Jul Aug Sep Oct Nov Dec Jan Feb Mar Apr May Jun July
Inflation Rate by Month: Region 3Jan 2014 to July 2015 (2006 Base Year)

COMMODITY GROUP
2014 2015 2015
2ND
Quarter
1ST
Quarter
2ND
Quarter
Average CPI (Philippines ) 139.0 141.1 141.3
(Central Luzon) 139.6 141.4 141.8
Average Inflation Rate (Philippines ) 4.3 2.4 1.7
(Central Luzon) 3.6 1.9 1.6
I. Food and Non-Alcoholic Beverages 6.4 5.1 3.1
II. Alcoholic Beverages and Tobacco 1.4 4.8 5.4
III. Clothing and Footwear 2.7
2.2 2.0
IV. Housing, Water, Electricity, Gas and Other Fuels 1.4 -3.4 -1.2
V. Furnishings, Household Eqpt. and Routine
Maintenance of the House
0.7 0.7 1.1
VI. Health 3.3 1.6 1.5
VII. Transport 1.5 -0.8 -0.3
VIII. Communication -1.3 -1.0 -1.0
IX. Recreation and Culture2.6
1.3 1.3
X. Education 7.7 6.3 5.7
XII. Restaurants, Miscellaneous Goods & Services 1.1 0.7 0.7
Source: Philippine Statistics Authority-RSSO 3
CPI AND INFLATION RATE IN REGION 3Second Quarter 2014, First and Second Quarters 2015
(Year-on-Year Change, 2006 Base Year)

GROSS REGIONAL DOMESTIC PRODUCT LEVEL AND SHARES BY REGIONS: 2013(At CONSTANT 2000 PRICES, In Million Pesos)
REGION / YEAR2013 2014
LEVEL SHARE(%) LEVEL SHARE (%)
Gross Domestic Product 6,750,079 100.0 7,164,017 100.0
NCR METRO MANILA 2,455,951 36.4 2,599,970 36.3
CAR CORDILLERA 124,607 1.8 128,577 1.8
I ILOCOS 211,075 3.1 223,152 3.1
II CAGAYAN VALLEY 120,105 1.8 127,819 1.8
III CENTRAL LUZON 611,967 9.1 667,189 9.3
IVA CALABARZON 1,170,990 17.3 1,230,928 17.2
IVB MIMAROPA 110,664 1.6 117,879 1.6
V BICOL 136,799 2.0 142,579 2.0
VI WESTERN VISAYAS 266,914 4.0 279,900 3.9
VII CENTRAL VISAYAS 427,338 6.3 464,746 6.5
VIII EASTERN VISAYAS 149,858 2.2 146,354 2.0
IX ZAMBOANGA PENINSULA 137,178 2.0 146,099 2.0
X NORTHERN MINDANAO 250,339 3.7 268,337 3.7
XI DAVAO REGION 257,347 3.8 281,515 3.9
XII SOCCSKSARGEN 185,212 2.7 197,153 2.8
XIII CARAGA 84,439 1.3 91,047 1.3
ARMM MUSLIM MINDANAO 49,295 0.7 50,771 0.7
Source: Philippine Statistics Authority

GROSS REGIONAL DOMESTIC PRODUCT BY INDUSTRIAL ORIGIN: 2014
(At CONSTANT 2000 PRICES)
Agri., Hunting, Forestry and
Fishing
17%
Industry41%
Service42%
CENTRAL LUZON
Source: Philippine Statistics Authority

Region
At Constant 2000 Prices
2012 2013r 2014
NCR METRO MANILA 501,123 533,554 548,170
III CENTRAL LUZON 151,196 153,375 161,978
IVA CALABARZON 230,968 241,840 241,500
VI WESTERN VISAYAS 85,834 88,646 87,964
VII CENTRAL VISAYAS 135,996 144,322 149,244
Source: National Wages and Productivity Commission
LABOR PRODUCTIVITY OF SELECTED REGIONS2012 to 2013
r - revised

Investment Promotion Agency Q1 2014 Q1 2015 Percent Growth
Clark Development Corporation 358.6 4,636.4 1,192.8
Subic Bay Metropolitan Authority 11,318.4 191.6 98.3
Freeport Area of Bataan - 97.8
TOTAL 11,667 4,925.8 -57.8
Total Approved Foreign Investments by Investment Promotion
Agency Central Luzon, 1st Quarter, 2014- 2015 (in million pesos)
Source: Philippine Statistics Authority-RSSO 3

AREA 2nd Quarter 2014 2nd Quarter 2015Percent Change
2014-2015Percent Share to
Region
CENTRAL LUZON1,142,427 1,148,675 0.55 100.0
Aurora29,465 30,847 4.69 2.7
Bataan27,683 27,488 -0.70 2.4
Bulacan76,749 76,410 -0.44 6.7
Nueva Ecija804,937 809,374 0.55 70.5
Pampanga99,889 100,554 0.67 8.8
Tarlac83,540 86,058 3.01 7.5
Zambales20,164 17,944 -11.01 1.6
Source: Philippine Statistics Authority, RSSO3
Palay Production by Province: Central Luzon
First Quarter 2014 and 2015, In Metric Tons

AREA 2nd Quarter 2015 2nd Quarter 2015Percent Change
2014-2015Percent Share to
Region
CENTRAL LUZON 109,795 112,712 2.66 100.0
Aurora 7,616 8,784 15.34 7.8
Bataan 1,441 2,816 95.42 2.5
Bulacan 1,803 2,103 16.64 1.9
Nueva Ecija 10,146 14,049 38.47 12.5
Pampanga 26,169 26,301 0.50 23.3
Tarlac 62,096 58,220 -6.24 51.7
Zambales 524 439 -16.22 0.4
Source: Philippine Statistics Authority, RSSO3
Corn Production by Province: Central Luzon
First Quarter 2014 and 2015, In Metric Tons

COMMODITY 2nd Quarter 2014 2nd Quarter 2015Percent Change
2014-2015
Hog 484.29 511.42 5.6
Goat 17.28 18.09 4.7
Cattle 66.02 69.49 5.3
Carabao 39.13 38.28 -2.2
Chicken 383.89 403.37 5.1
Duck 6.27 6.60 5.3
Chicken Egg 104.24 107.85 3.5
Duck Egg 10.93 11.22 2.7
Source: Philippine Statistics Authority, RSSO3
Volume of Production in Livestock and Poultry: Central Luzon
Second Quarter 2014 and 2015, In Metric Tons

Crop 2nd Quarter 2014 2nd Quarter 2015Percent Change
2014 - 2015
Onion 100,590 30,996 -69
Eggplant 5,463 6,465 18
Mango 38,490 38,434 0
Mongo 3,077 3,293 7
Source: Philippine Statistics Authority-RSSO 3
Production in Other Major Crops: Central Luzon
2nd Quarter, 2014 and 2015 (in metric tons)
COMMODITY 2nd Quarter 2014 2nd Quarter 2015Percent Change
2014 - 2015
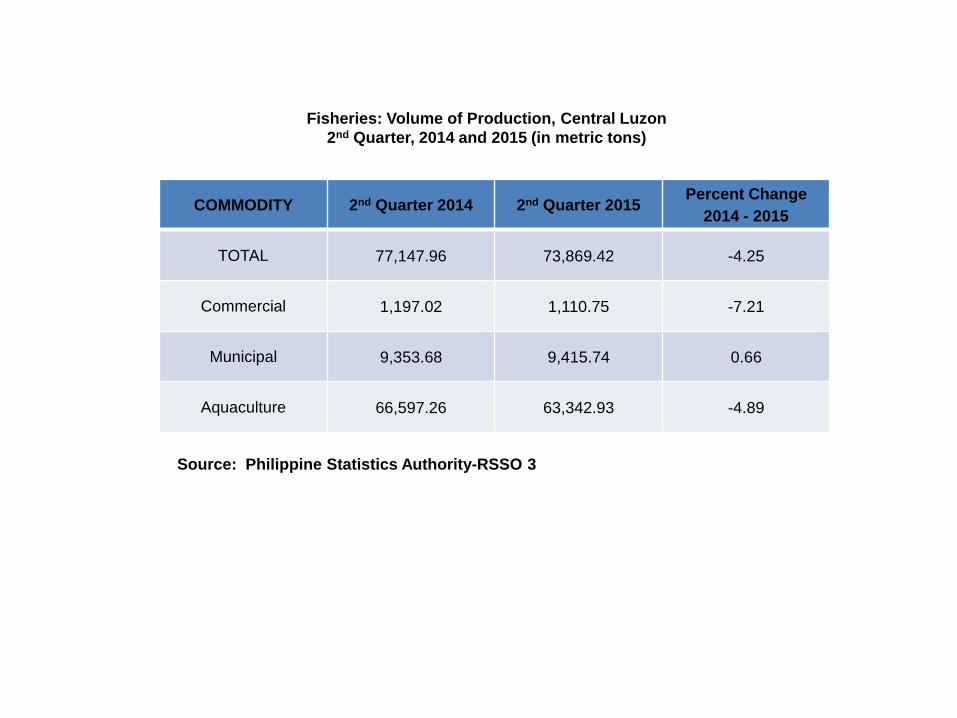
TOTAL 77,147.96 73,869.42 -4.25
Commercial 1,197.02 1,110.75 -7.21
Municipal 9,353.68 9,415.74 0.66
Aquaculture 66,597.26 63,342.93 -4.89
Fisheries: Volume of Production, Central Luzon
2nd Quarter, 2014 and 2015 (in metric tons)
Source: Philippine Statistics Authority-RSSO 3

Challenges
- Sustaining high growth- Providing massive quality employment- Sustaining declining poverty trend
- Improving labor productivity
- Potentially adverse effect of El Nino on agricultural production and food supply
- Increasing share of imported onions in the market- Providing immediate alternative livelihood to subsistence fisher folks - Unstable FDI flow

Opportunities and Potentials
- Low inflation regime- Strong consumer confidence
- Expanding investment in education
- Expanding production of corn, hog, goat, duck, chicken and chicken egg
- Implementation of big tickets, e.g.,BBMP II and CRK Terminal Building- Consolidation of development thinkers andbusiness players in the North and Central Luzonregions toward a common development agenda

Thank you