UPDATE OF FINANCE COMPANIES IN INDONESIA ...thereare961companiesengagedintheNonBankFinancial...
9
UPDATE OF FINANCE COMPANIES IN INDONESIA
Transcript of UPDATE OF FINANCE COMPANIES IN INDONESIA ...thereare961companiesengagedintheNonBankFinancial...

UPDATE OF FINANCE COMPANIESIN INDONESIA

In terms of the number of companies, there are 961 companies engaged in the Non Bank FinancialInstitutions (NBFI) industry, consisting of 278 companies engaged in the Financing Institutionsindustry, 265 in the Pension Fund, 263 in the Supporting Services Industry – NBFIs and 141 in theInsurance industry.
Of the such companies, there are 98 companies conducting business with sharia principles (9 fully-sharia companies and 89 Sharia units ).
14115%
26528%
27829%
141%
26327%
Insurance Companies Pension Funds
Financing Institutions Specific Financing Institutions
Supporting Services Industry - NBFIs
Number of NBFI Companies(Q 1/2014)
2

Financial HighlightsThe Growth of NBFI Asset (trillion)
3
No. Industry 2011 2012 2013 *) 2014 **)
QI
1 Insurance 481.75 569.32 638.23 483,35
2 BPJS - - - 185,22
3 Pension Fund 142.03 158.37 162.06 166.29
4 Financing Institutions294.55 356.08 420.45 421.29
5 Specific Financing Institutions 62.44 75.79 96.06 98.54
6 Supporting Services Industry - NBFIs 2.43 3.49 4.29 4.29
Total Aset 983.20 1.163.05 1.320.78 1.358,98
The performance of non-bankfinancial Institutions (NBFI)during the first quarter of 2014in general was a positive trend.
Total NBFI assets at the end ofthe first quarter of 2014increased about 1% comparedto the previous quarter, toRp1.358.98 trillion.
NBFI industry's largest marketshare is the insurance industrywith assets amounting to 41%of the total assets of NBFIs,followed by the FinancingInstitutions and pension fundswith 31% and 12% respectively.

Profile of Financing Institutions
4
• The Financing Institutions Industry consists of 201 Finance Companies (PP), 75 Venture
Capital Company (PMV), and 2 Infrastructure Financing Company (PPI).
• The Financing Institutions industry is still dominated by the Finance Companies which
has a market share of 95% of total industry.
0
50
100
150
200
250
PP PMV PPI
201
75
2
Number of Financing InstitutionsPeriod of March 2014
402.14 95%
8.24 2% 10.73
3%
Market Share of Financing Institutions Asset
Period of March 2014
PP
PMV
PPI

Profile of Finance Companies
5
There are 64 PP directly owned by a foreign company (Joint Venture), 137 national privateand 1 state-owned company.
The composition of the assets of the Joint Venture Companies amounted to Rp200.7 trillionor 50% of total industry and National Private companies amounted to Rp198.2 trillion or49%.
-
20
40
60
80
100
120
140
State-ownedCompany
Joint Venture National Private
1
64
137
Number of Finance Company based on Ownership Category
3.22 1%
200.71 50%
198.19 49%
Total Asset of each Category(In Trillions Rupiah)
State-ownedCompany
Joint Venture
National Private
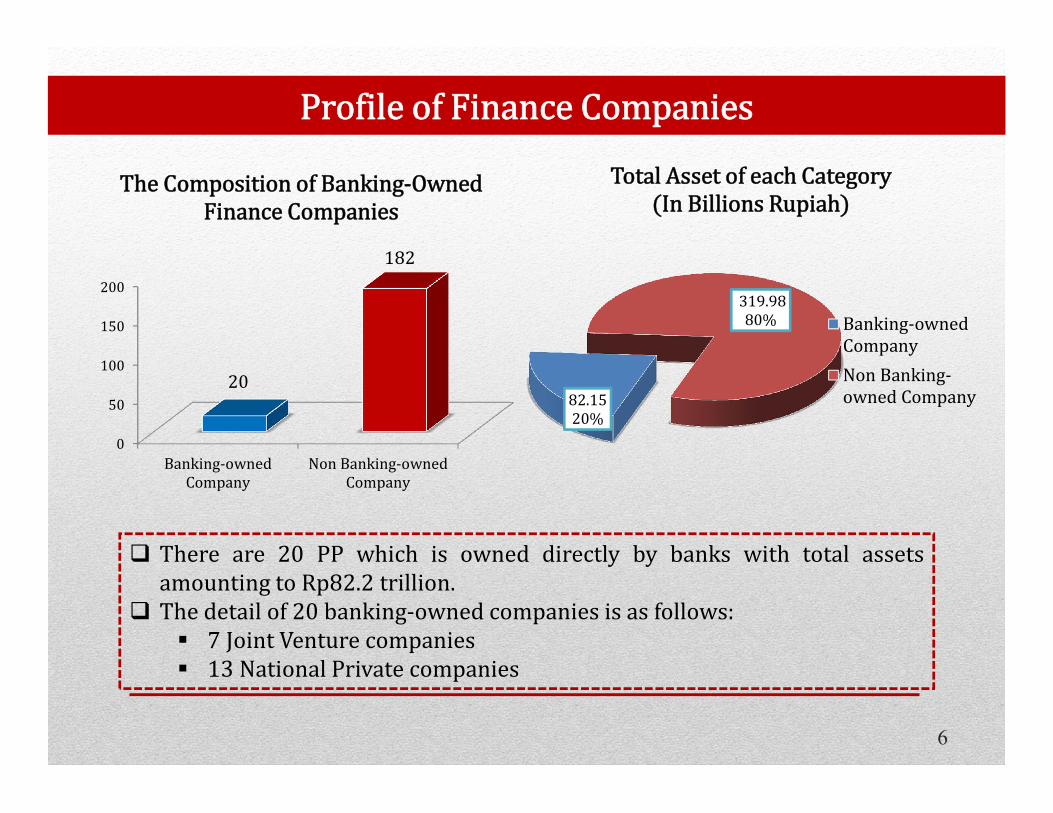
There are 20 PP which is owned directly by banks with total assetsamounting to Rp82.2 trillion.
The detail of 20 banking-owned companies is as follows: 7 Joint Venture companies 13 National Private companies
6
Profile of Finance Companies
0
50
100
150
200
Banking-ownedCompany
Non Banking-ownedCompany
20
182
The Composition of Banking-Owned Finance Companies
82.15 20%
319.98 80%
Total Asset of each Category(In Billions Rupiah)
Banking-ownedCompany
Non Banking-owned Company

The Growth of Finance Companies Asset
7
In the last 4-year period, the asset of finance companies industry experienced apositive growth with an average growth of 23.9%. However, in 2013 the averagegrowth of industry assets fell to 14.8%.
At the end of the first quarter of 2014, the growth of industry assets amounted to15.91% yoy.
-
50,000
100,000
150,000
200,000
250,000
300,000
350,000
400,000
450,000
2010 2011 2012 2013 Mar-14
230.30
291.38
341.77
400.62 402.13
186.35 245.29
302.07
348.02 352.44
Assets Financing ReceivablesIn Trillions Rupiah

In the last 4-year period, the financing receivables of Finance Companies industryexperienced a positive growth. As of the first quarter of 2014, the financing receivables grewby 13.84% y-o-y compared to March 2013.
The composition of financing receivables is still dominated by consumer finance receivablesamounting to Rp229, 7 billion or 65% of total receivables, followed by finance leaseamounted to Rp114, 8 trillion or controls 33% market share of total industry’s financing.
8
The Growth of Finance Companies Receivables
-
50,000
100,000
150,000
200,000
250,000
300,000
350,000
400,000
2010 2011 2012 Mar-13 2013 Mar-14
53,167 76,592 105,088 105,532 117,363 114,773
130,016
164,791
191,841 198,531 222,968 229,743
The Growth of Financing ReceivablesPeriod of Between 2010 and March 2014
(in millions rupiah)
Leasing Factoring Credit Card Consumer Finance
114,773 33%
7,926 2%
5 0%
229,743 65%
The Composition of Fianncing ReceivablesPeriod of March 2014
Leasing
Factoring
Credit Card
Consumer Finance
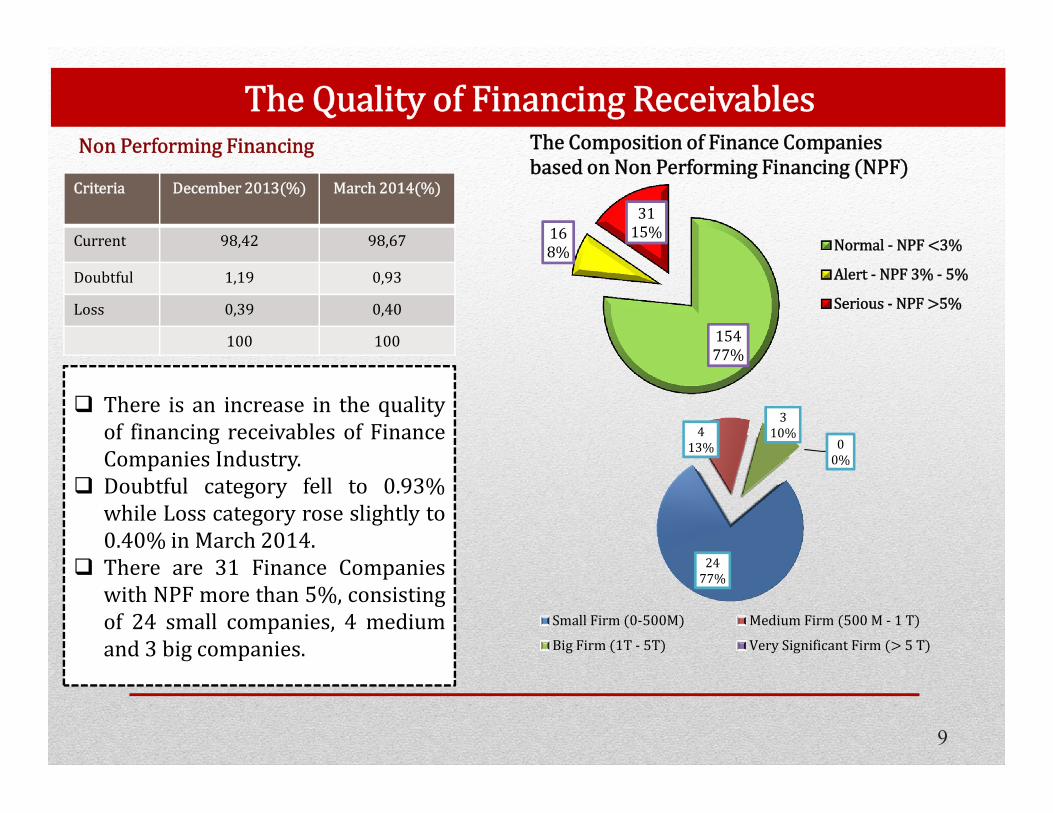
Criteria December 2013(%) March 2014(%)
Current 98,42 98,67
Doubtful 1,19 0,93
Loss 0,39 0,40
100 100
Non Performing Financing
There is an increase in the qualityof financing receivables of FinanceCompanies Industry.
Doubtful category fell to 0.93%while Loss category rose slightly to0.40% in March 2014.
There are 31 Finance Companieswith NPF more than 5%, consistingof 24 small companies, 4 mediumand 3 big companies.
The Quality of Financing Receivables
15477%
168%
3115%
The Composition of Finance Companies based on Non Performing Financing (NPF)
Normal - NPF <3%
Alert - NPF 3% - 5%
Serious - NPF >5%
2477%
413%
310%
00%
Small Firm (0-500M) Medium Firm (500 M - 1 T)
Big Firm (1T - 5T) Very Significant Firm (> 5 T)
9