Update: Mortality Attributable to HIV Infection/AIDS Among … · Update: Mortality Attributable to...
20
Current Trends Update: Mortality Attributable to HIV Infection/AIDS Among Persons Aged 25–44 Years — United States, 1990 and 1991 HIV Infection/AIDS Mortality — Continued During the 1980s, human immunodeficiency virus (HIV) infection emerged as a leading cause of death in the United States (1 ). This report updates national trends in deaths caused by HIV infection during 1990 and 1991 and indicates that HIV infection/ acquired immunodeficiency syndrome (AIDS) continues to cause an increasing pro- portion of all deaths. Data presented in this report were obtained from death certificates filed in all 50 states and the District of Columbia. Cause of death was reported by attending phy- sicians, medical examiners, and coroners; demographic characteristics were recorded by funeral directors. Data for 1991 are provisional (2 ); 1990 is the latest year for which final and more detailed mortality data are available ( 3 ). In 1991, 29,850 U.S. residents died from HIV infection; of these, 3% were aged <25 years; 74%, 25–44 years; and 23%, ≥45 years. HIV infection was the ninth leading cause of death overall, accounting for 1% of all deaths, and the third leading cause of death among persons aged 25–44 years, accounting for 15% of deaths in this age group (Table 1). In 1990, HIV infection was the second leading cause of death among men aged 25–44 years and the sixth leading cause of death among women in this age group (accounting for 17% and 5% of deaths, respectively) (Table 2). In 1991, the pro- portion of deaths caused by HIV infection in these two groups increased to 19% and 6%, respectively. While death rates from most other leading causes of death declined or remained relatively stable for men and women aged 25–44 years, the death rate for HIV infection steadily increased (Figures 1 and 2). In 1991, the death rate for HIV infection for men aged 25–44 years was seven times that for women in this age group; however, since 1985, proportionate increases in the rate were greater for women than for men. For men aged 25–44 years, the proportion of deaths caused by HIV infection in 1990 was 22% for Hispanics, 19% for blacks (non-Hispanic), 15% for whites (non-Hispanic), 7% for Asians/Pacific Islanders (non-Hispanic), and 3% for American Indians/Alaskan July 2, 1993 / Vol. 42 / No. 25 U.S. DEPARTMENT OF HEALTH AND HUMAN SERVICES / Public Health Service CENTERS FOR DISEASE CONTROL AND PREVENTION 481 Update: Mortality Attributable to HIV Infection/AIDS Among Persons Aged 25–44 Years — United States, 1990 and 1991 486 Progress Toward Global Eradication of Poliomyelitis, 1988–1991 495 Update: Outbreak of Hantavirus Infection — Southwestern United States, 1993 497 Publication of CDC Surveillance Summaries 499 Notice to Readers
Transcript of Update: Mortality Attributable to HIV Infection/AIDS Among … · Update: Mortality Attributable to...

Current Trends
Update: Mortality Attributable to HIV Infection/AIDSAmong Persons Aged 25–44 Years — United States, 1990 and 1991
HIV Infection/AIDS Mortality — ContinuedDuring the 1980s, human immunodeficiency virus (HIV) infection emerged as aleading cause of death in the United States (1 ). This report updates national trends indeaths caused by HIV infection during 1990 and 1991 and indicates that HIV infection/acquired immunodeficiency syndrome (AIDS) continues to cause an increasing pro-portion of all deaths.
Data presented in this report were obtained from death certificates filed in all50 states and the District of Columbia. Cause of death was reported by attending phy-sicians, medical examiners, and coroners; demographic characteristics were recordedby funeral directors. Data for 1991 are provisional (2 ); 1990 is the latest year for whichfinal and more detailed mortality data are available (3 ).
In 1991, 29,850 U.S. residents died from HIV infection; of these, 3% were aged<25 years; 74%, 25–44 years; and 23%, ≥45 years. HIV infection was the ninth leadingcause of death overall, accounting for 1% of all deaths, and the third leading cause ofdeath among persons aged 25–44 years, accounting for 15% of deaths in this agegroup (Table 1). In 1990, HIV infection was the second leading cause of death amongmen aged 25–44 years and the sixth leading cause of death among women in this agegroup (accounting for 17% and 5% of deaths, respectively) (Table 2). In 1991, the pro-portion of deaths caused by HIV infection in these two groups increased to 19% and6%, respectively.
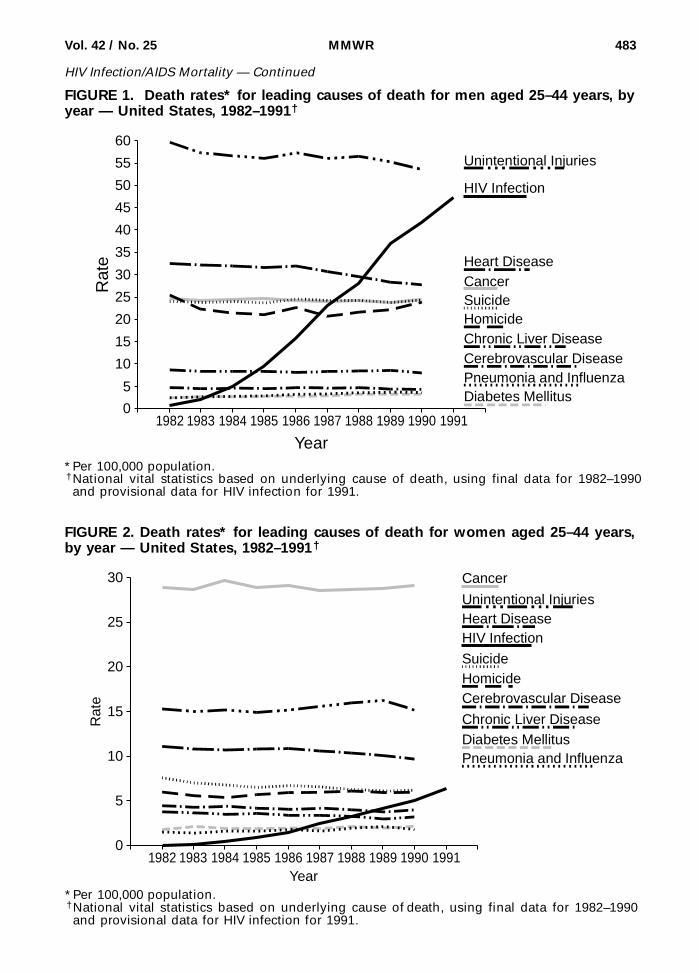
While death rates from most other leading causes of death declined or remainedrelatively stable for men and women aged 25–44 years, the death rate for HIV infectionsteadily increased (Figures 1 and 2). In 1991, the death rate for HIV infection for menaged 25–44 years was seven times that for women in this age group; however, since1985, proportionate increases in the rate were greater for women than for men.
For men aged 25–44 years, the proportion of deaths caused by HIV infection in 1990was 22% for Hispanics, 19% for blacks (non-Hispanic), 15% for whites (non-Hispanic),7% for Asians/Pacific Islanders (non-Hispanic), and 3% for American Indians/Alaskan
July 2, 1993 / Vol. 42 / No. 25
U.S. DEPARTMENT OF HEALTH AND HUMAN SERVICES / Public Health Service
CENTERS FOR DISEASE CONTROLAND PREVENTION
481 Update: Mortality Attributableto HIV Infection/AIDS Among PersonsAged 25–44 Years — United States, 1990and 1991
486 Progress Toward Global Eradicationof Poliomyelitis, 1988–1991
495 Update: Outbreak of Hantavirus Infection— Southwestern United States, 1993
497 Publication of CDC SurveillanceSummaries
499 Notice to Readers
Natives (non-Hispanic) (Table 3). HIV death rates* varied substantially by race/ethni-city: for men aged 25–44 years, rates for black, Hispanic, American Indian/AlaskanNative, and Asian/Pacific Islander men were approximately three times, twice, onethird, and one fourth, respectively, the rate for white men (Table 3).
TABLE 1. Percentage of deaths caused by HIV infection, rank of HIV infection amongall causes of death,* and death rate for HIV infection, by year of death and agegroup — United States, 1987–1991†
Year
All ages Aged 25–44 yrs
Totaldeaths
HIV-related deaths
Totaldeaths
HIV-related deaths
Deaths §(%)§ RankDeath rate¶ Deaths (%) Rank
Deathrate
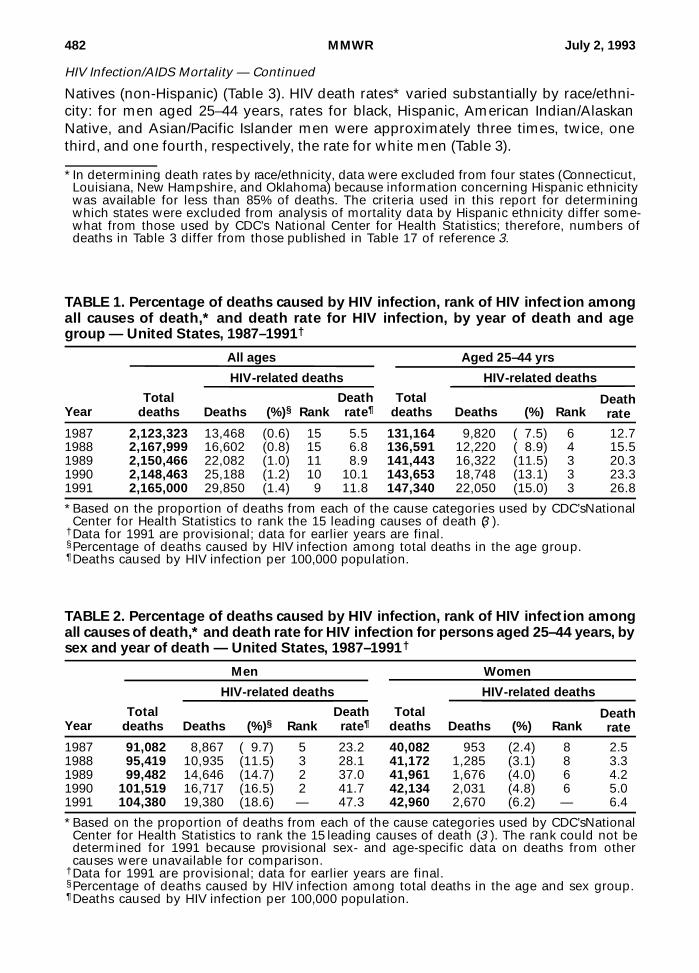
1987 2,123,323 13,468 (0.6) 15 5.5 131,164 9,820 ( 7.5) 6 12.71988 2,167,999 16,602 (0.8) 15 6.8 136,591 12,220 ( 8.9) 4 15.51989 2,150,466 22,082 (1.0) 11 8.9 141,443 16,322 (11.5) 3 20.31990 2,148,463 25,188 (1.2) 10 10.1 143,653 18,748 (13.1) 3 23.31991 2,165,000 29,850 (1.4) 9 11.8 147,340 22,050 (15.0) 3 26.8
*Based on the proportion of deaths from each of the cause categories used by CDC’s NationalCenter for Health Statistics to rank the 15 leading causes of death (3 ).
†Data for 1991 are provisional; data for earlier years are final.§Percentage of deaths caused by HIV infection among total deaths in the age group.¶Deaths caused by HIV infection per 100,000 population.
TABLE 2. Percentage of deaths caused by HIV infection, rank of HIV infection amongall causes of death,* and death rate for HIV infection for persons aged 25–44 years, bysex and year of death — United States, 1987–1991†
Year
Men Women
Totaldeaths
HIV-related deaths
Totaldeaths
HIV-related deaths
Deaths §(%)§ RankDeath rate¶ Deaths (%) Rank
Deathrate
1987 91,082 8,867 ( 9.7) 5 23.2 40,082 953 (2.4) 8 2.51988 95,419 10,935 (11.5) 3 28.1 41,172 1,285 (3.1) 8 3.31989 99,482 14,646 (14.7) 2 37.0 41,961 1,676 (4.0) 6 4.21990 101,519 16,717 (16.5) 2 41.7 42,134 2,031 (4.8) 6 5.01991 104,380 19,380 (18.6) — 47.3 42,960 2,670 (6.2) — 6.4
*Based on the proportion of deaths from each of the cause categories used by CDC’s NationalCenter for Health Statistics to rank the 15 leading causes of death (3 ). The rank could not bedetermined for 1991 because provisional sex- and age-specific data on deaths from othercauses were unavailable for comparison.
†Data for 1991 are provisional; data for earlier years are final.§Percentage of deaths caused by HIV infection among total deaths in the age and sex group.¶Deaths caused by HIV infection per 100,000 population.
*In determining death rates by race/ethnicity, data were excluded from four states (Connecticut,Louisiana, New Hampshire, and Oklahoma) because information concerning Hispanic ethnicitywas available for less than 85% of deaths. The criteria used in this report for determiningwhich states were excluded from analysis of mortality data by Hispanic ethnicity differ some-what from those used by CDC’s National Center for Health Statistics; therefore, numbers ofdeaths in Table 3 differ from those published in Table 17 of reference 3.
482 MMWR July 2, 1993
HIV Infection/AIDS Mortality — Continued
0
5
10
15
20
25
30
35
40
45
50
55
60
Rat
e
1982 1983 1984 1985 1986 1987 1988 1989 1990 1991
Year
Unintentional Injuries
Cancer
HIV Infection
Heart Disease
SuicideHomicideChronic Liver DiseaseCerebrovascular Disease
Diabetes MellitusPneumonia and Influenza
FIGURE 1. Death rates* for leading causes of death for men aged 25–44 years, byyear — United States, 1982–1991†
*Per 100,000 population.†National vital statistics based on underlying cause of death, using final data for 1982–1990and provisional data for HIV infection for 1991.
0
5
10
15
20
25
30
Rat
e
1982 1983 1984 1985 1986 1987 1988 1989 1990 1991Year
Unintentional Injuries
Cancer
HIV InfectionHeart Disease
SuicideHomicide
Chronic Liver Disease
Cerebrovascular Disease
Diabetes MellitusPneumonia and Influenza
*Per 100,000 population.†National vital statistics based on underlying cause of death, using final data for 1982–1990and provisional data for HIV infection for 1991.
FIGURE 2. Death rates* for leading causes of death for women aged 25–44 years,by year — United States, 1982–1991†
Vol. 42 / No. 25 MMWR 483
HIV Infection/AIDS Mortality — Continued

HIV
Infection/AID
S M
ortality — C
ontinued
48
4M
MW
RJ
uly 2
, 19
93
TABLE 3. Percentage of deaths caused by HIV infection, rank of HIV infection among all causes of death,* and death rate forHIV infection among persons aged 25–44 years, by sex and race/ethnicity — United States, 1990
Race/ Ethnicity
Men Women
Totaldeaths
HIV-related deathsTotal
deaths
HIV-related deaths
Deaths †(%)† RankDeath rate§ Deaths (%) Rank
Deathrate
Non-Hispanic White 60,710 9,170 (15.1) 2 31.4 25,354 434 ( 1.7) 9 1.5 Black 22,860 4,352 (19.0) 2 105.0 10,584 1,160 (11.0) 3 24.4 Asian/ Pacific Islander 1 ,255 90 ( 7.2) 6 7.4 711 6 ( 0.8) 12 0.5 American Indian/ Alaskan Native 894 24 ( 2.7) 7 10.0 390 3 ( 0.8) 11 1.2
Hispanic Puerto Rican 1 ,897 728 (38.4) 1 — 644 192 (29.8) 1 — Cuban 554 223 (40.3) 1 — 106 10 ( 9.4) 5 — Mexican 4 ,985 659 (13.2) 3 — 1 ,287 31 ( 2.4) 8 — Other 1 ,187 231 (19.5) 3 — 366 21 ( 5.7) 4 — Unspecified nationality 1 ,722 382 (22.2) 2 — 459 58 (12.6) 3 — Total 10 ,345 2,223 (21.5) 2 59.1 2 ,862 312 (10.9) 3 8.8
*Based on the proportion of deaths from each of the cause categories used by CDC’s National Center for Health Statistics to rank the15 leading causes of death.
†Percentage of deaths caused by HIV infection among total deaths in the age, sex, and racial/ethnic group.§Deaths caused by HIV infection per 100,000 population, excluding data from four states (Connecticut, Louisiana, New Hampshire, andOklahoma) because information concerning Hispanic ethnicity was available for less than 85% of deaths. The criteria used in this reportfor determining which states were excluded from analysis of mortality data by Hispanic ethnicity differ somewhat from those used byCDC’s National Center for Health Statistics; therefore, numbers of deaths differ from those published in Table 17 of reference 3. Deathrates could not be determined by national origin for Hispanics, because information on national origin was available for less than 85%of their deaths in 28 states and age-specific population data were unavailable by national origin.

For women aged 25–44 years, HIV infection accounted for 11% of deaths in 1990 forboth black and Hispanic women; however, the HIV death rate for black women wasnearly three times that for Hispanic women (Table 3). Both the proportions of deathscaused by HIV infection and the HIV death rates were substantially higher for blackand Hispanic women than for women of white and other racial/ethnic groups.
Among Hispanics aged 25–44 years, the proportion of deaths caused by HIV infec-tion in 1990 varied widely by national origin (including ancestry, not necessarilybirthplace) (Table 3). In particular, among men of Cuban and Puerto Rican origin, HIVinfection was the leading cause of death, accounting for approximately 40% of alldeaths, while among men of Mexican origin, the proportion was lower (13%). In thisage group, HIV infection was the leading cause of death among women of PuertoRican origin—accounting for approximately 30% of all deaths—but caused a smallerproportion of deaths among women of Cuban origin (9%), Mexican origin (2%), andother Latin American origin (6%).Reported by: Surveillance Br, Div of HIV/AIDS, National Center for Infectious Diseases; MortalityStatistics Br, Div of Vital Statistics, National Center for Health Statistics, CDC.Editorial Note: The findings in this report underscore the role of HIV infection as acause of death among men and women aged 25–44 years in the United States. Al-though deaths from all causes in this age group comprised only 7% of total U.S.deaths in 1991 (2 ), they impose a disproportionately high impact on society becauseof the loss of productive years of life and the loss of parents from families with youngchildren. The impact of HIV infection on death patterns is even greater in many largecities than in the total U.S. population. For example, for persons aged 25–44 years in1990, HIV was the leading cause of death among men in 64 (37%) of 172 cities withpopulations of at least 100,000 and among women in nine (5%) such cities (4 ).
In this report, the finding that rates of death for HIV infection were higher for blacksand Hispanics—particularly Hispanics of Puerto Rican origin—than for other racial/ethnic groups is consistent with reported rates for the incidence of AIDS (5,6 ). Suchcomparisons of racial/ethnic groups may assist in targeting prevention efforts togroups at greatest risk. Differences in risk among racial/ethnic groups may reflect so-cial, economic, behavioral, or other factors, rather than race/ethnicity directly (7 ).Further analyses are needed to better understand these associations.
The impact of HIV infection on U.S. mortality patterns is greater than indicated inthis report. This analysis was based on the underlying cause of death recorded ondeath certificates; however, previous studies suggest that, for persons aged25–44 years, deaths for which HIV infection is designated as the underlying cause rep-resent 65%–85% of all HIV-related deaths among men and 55%–80% of those amongwomen (8,9 ). In addition, provisional data for 1992 suggest that the number and pro-portion of deaths caused by HIV infection will increase beyond the levels described inthis report (10 ). Increased prevention efforts to interrupt transmission of HIV areneeded to decrease morbidity and mortality from HIV infection.
References 1. CDC. Mortality attributable to HIV infection/AIDS—United States, 1981–1990. MMWR 1991;
40:41–4. 2. NCHS. Annual summary of births, marriages, divorces, and deaths: United States, 1991.
Hyattsville, Maryland: US Department of Health and Human Services, Public Health Service,CDC, 1992. (Monthly vital statistics report; vol 40, no. 13).
Vol. 42 / No. 25 MMWR 485
HIV Infection/AIDS Mortality — Continued

3. NCHS. Advance report of final mortality statistics, 1990. Hyattsville, Maryland: US Departmentof Health and Human Services, Public Health Service, CDC, 1993. (Monthly vital statisticsreport; vol 41, no. 7, suppl).
4. Selik RM, Chu SY, Buehler JW. HIV infection as leading cause of death among young adultsin US cities and states. JAMA 1993;269:2991–4.
5. Diaz T, Buehler JW, Castro KG, Ward JW. AIDS trends among Hispanics in the United States.Am J Public Health 1993;83:504–9.
6. Selik RM, Castro KG, Pappaioanou M. Racial/ethnic differences in the risk of AIDS in the UnitedStates. Am J Public Health 1988;78:1539–45.
7. National Commission on AIDS. The challenge of HIV/AIDS in communities of color. Wash-ington, DC: National Commission on AIDS, December 1992.
8. Buehler JW, Devine OJ, Berkelman RL, Chevarley FM. Impact of the human immunodeficiencyvirus epidemic on mortality trends in young men—United States. Am J Public Health1990;80:1080–6.
9. Buehler JW, Hanson DL, Chu SY. Reporting of HIV/AIDS deaths in women. Am J Public Health1992;82:1500–5.
10. NCHS. Annual summary of births, marriages, divorces, and deaths: United States, 1992.Hyattsville, Maryland: US Department of Health and Human Services, Public Health Service,CDC, 1993. (Monthly vital statistics report; vol 41) (in press).HIV Infection/AIDS Mortality — Continued
International Notes
Progress Toward Global Eradication of Poliomyelitis, 1988–1991
Eradication of Poliomyelitis — ContinuedThe report of the last case of smallpox from Somalia in 1977 demonstrated that aninfectious disease could be eradicated globally. Because polioviruses have no animalreservoir and do not survive for long periods of time in the environment, and becauselifelong immunity to paralytic poliomyelitis is conferred by existing, effective vac-cines, poliomyelitis has been considered a candidate for eradication (1 ). In 1985, thePan American Health Organization (PAHO) initiated a regional poliomyelitis eradica-tion program. Based on the success of this program and high vaccination levelsachieved worldwide by the Expanded Program on Immunization (EPI), in May 1988,the World Health Assembly of the World Health Organization (WHO) adopted a reso-lution to eradicate poliomyelitis globally by the year 2000. This report summarizesprogress of the global poliomyelitis eradication initiative from 1988 through 1991*.
Global. Reported global vaccination coverage with three doses of oral poliovirusvaccine (OPV3) by age 1 year increased from 67% in 1988 to 84% in 1991 (Figure 1).During the same period, reported cases of poliomyelitis decreased 56%, from 32,286to 14,176 (Figure 1). From 1988 through 1991, there were substantial decreases in thenumber of countries/territories reporting poliomyelitis cases (88 [45%] of 196 and70 [34%] of 208, respectively) and the number of countries reporting more than 10cases per year (56 [29%] and 38 [18%], respectively) (Figure 2). In addition, the numberof countries reporting zero endemic cases increased from 107 (55%) to 129 (61%)†.
African Region. Reported coverage with OPV3 increased from 44% to 57%, whilereported cases of poliomyelitis decreased from 4546 to 2623; the number of countriesin the region reporting poliomyelitis cases decreased from 37 (79%) of 47 to 25 (53%)
*Based on surveillance data submitted to the EPI; because 1992 figures are provisional, 1991data were used for global and regional disease incidence.
†The difference between the number of countries reporting poliomyelitis cases or zero casesand the total number of countries reflects those not submitting reports.
486 MMWR July 2, 1993
HIV Infection/AIDS Mortality — Continued

of 47. In 1991, the African Region reported 19% of the global total of poliomyelitiscases.
Region of the Americas. Reported coverage with OPV3 increased from 82% to 89%,while reported cases of poliomyelitis decreased from 340 to nine; the number of coun-tries in the region reporting poliomyelitis cases decreased from 13 (28%) of 47 to two(4%) of 47. This region has reported no confirmed cases of poliomyelitis since Sep-tember 1991 in Peru.
Eastern Mediterranean Region. Reported coverage with OPV3 increased from 69%to 80%, while reported cases of poliomyelitis decreased from 2332 to 2035; the num-ber of countries in the region reporting poliomyelitis cases decreased from 17 (71%)of 24 to 15 (65%) of 23. In 1991, the Eastern Mediterranean Region reported 14% of theglobal total of poliomyelitis cases; 87% of the regional total were reported from Paki-stan and Egypt. Despite OPV3 coverage of greater than 85%, small outbreaks alsooccurred in Oman (1988–1989) and Jordan (1991–1992); 51% of 118 persons withacute poliomyelitis in Oman and 53% of 32 persons with acute poliomyelitis in Jordanhad received OPV3.
European Region. Reported coverage with OPV3 decreased from 86% to 82%, whilereported cases of poliomyelitis increased from 206 to 313; the number of countries inthe region reporting poliomyelitis cases increased from seven (23%) of 31 to 15 (33%)
(Continued on page 493)
0
10,000
20,000
30,000
40,000
50,000
Cas
es
1988 1989 1990 1991Year
Reported Cases
Per
cent
0102030405060708090
100OPV3 Coverage*
FIGURE 1. Reported coverage with three doses of oral poliovirus vaccine (OPV3) andpoliomyelitis cases, by year — worldwide, 1988–1991
*Percentage of children who have received at least three doses of oral poliovirus vaccine byage 1 year.
Vol. 42 / No. 25 MMWR 487
Eradication of Poliomyelitis — Continued
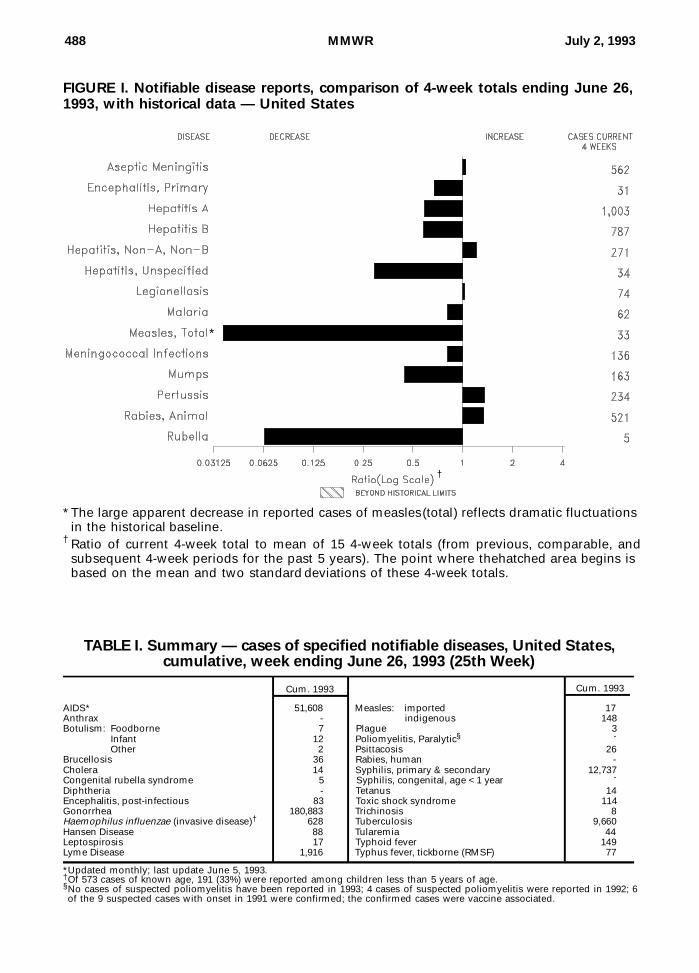
FIGURE I. Notifiable disease reports, comparison of 4-week totals ending June 26,1993, with historical data — United States
*The large apparent decrease in reported cases of measles (total) reflects dramatic fluctuationsin the historical baseline.
† Ratio of current 4-week total to mean of 15 4-week totals (from previous, comparable, andsubsequent 4-week periods for the past 5 years). The point where the hatched area begins isbased on the mean and two standard deviations of these 4-week totals.
AIDS* 51,608 Measles: imported 17Anthrax - indigenous 148Botulism: Foodborne 7 Plague 3
Infant 12 Poliomyelitis, Paralytic§ -
Other 2 Psittacosis 26Brucellosis 36 Rabies, human -Cholera 14 Syphilis, primary & secondary 12,737Congenital rubella syndrome 5 Syphilis, congenital, age < 1 year -
Diphtheria - Tetanus 14Encephalitis, post-infectious 83 Toxic shock syndrome 114Gonorrhea 180,883 Trichinosis 8Haemophilus influenzae (invasive disease)† 628 Tuberculosis 9,660Hansen Disease 88 Tularemia 44Leptospirosis 17 Typhoid fever 149Lyme Disease 1,916 Typhus fever, tickborne (RMSF) 77
Cum. 1993Cum. 1993
TABLE I. Summary — cases of specified notifiable diseases, United States,cumulative, week ending June 26, 1993 (25th Week)
*Updated monthly; last update June 5, 1993.†Of 573 cases of known age, 191 (33%) were reported among children less than 5 years of age.§No cases of suspected poliomyelitis have been reported in 1993; 4 cases of suspected poliomyelitis were reported in 1992; 6of the 9 suspected cases with onset in 1991 were confirmed; the confirmed cases were vaccine associated.
†
*
488 MMWR July 2, 1993

TABLE II. Cases of selected notifiable diseases, United States, weeks endingJune 26, 1993, and June 20, 1992 (25th Week)
UNITED STATES 51,608 3,303 250 83 180,883 233,891 9,929 5,583 2,219 298 539 1,916
NEW ENGLAND 2,166 45 4 4 3,810 4,819 155 161 218 5 14 247Maine 59 10 1 - 41 40 8 9 - - 4 3N.H. 63 9 - 2 30 60 14 53 197 1 2 20Vt. 14 7 2 - 14 13 3 3 2 - - 1Mass. 1,188 10 1 2 1,309 1,748 47 53 15 4 5 17R.I. 104 9 - - 174 362 49 14 4 - 3 54Conn. 738 - - - 2,242 2,596 34 29 - - - 152
MID. ATLANTIC 11,379 313 11 6 20,335 24,550 587 725 162 4 114 1,331Upstate N.Y. 1,938 123 3 3 4,037 5,070 179 200 93 1 35 969N.Y. City 6,197 104 1 - 5,067 8,400 177 121 1 - 3 3N.J. 2,072 - - - 3,410 3,387 156 209 48 - 16 129Pa. 1,172 86 7 3 7,821 7,693 75 195 20 3 60 230
E.N. CENTRAL 4,160 435 76 15 34,957 43,922 976 572 358 8 143 17Ohio 662 133 25 3 9,439 13,389 153 112 29 - 74 13Ind. 502 65 6 7 3,695 4,039 412 110 6 1 30 1Ill. 1,442 87 16 - 11,381 14,409 293 123 21 2 5 1Mich. 1,083 140 25 5 7,877 10,096 112 222 281 5 26 2Wis. 471 10 4 - 2,565 1,989 6 5 21 - 8 -
W.N. CENTRAL 2,163 192 11 - 8,945 12,498 1,250 337 97 5 35 37Minn. 431 46 5 - 320 1,409 205 31 3 4 1 4Iowa 130 42 1 - 602 833 16 12 4 1 5 5Mo. 1,270 45 - - 5,521 6,812 810 250 71 - 11 7N. Dak. - 5 2 - 23 43 43 - - - 1 1S. Dak. 20 7 3 - 150 84 10 - - - - -Nebr. 100 4 - - 476 754 113 8 9 - 14 1Kans. 212 43 - - 1,853 2,563 53 36 10 - 3 19
S. ATLANTIC 10,888 811 45 36 49,609 73,121 616 984 271 44 91 208Del. 208 8 3 - 642 838 6 73 63 - 7 106Md. 1,216 70 10 - 7,726 7,010 85 135 6 5 22 30D.C. 548 19 - - 2,681 3,535 3 14 - - 12 2Va. 731 79 15 3 5,651 8,672 64 73 20 18 2 19W. Va. 38 7 7 - 279 439 3 18 16 - 1 2N.C. 453 63 9 - 11,777 11,706 31 154 31 - 14 28S.C. 673 5 - - 4,842 5,389 7 18 - 1 10 1Ga. 1,562 53 1 - 4,660 23,200 57 35 21 - 12 -Fla. 5,459 507 - 33 11,351 12,332 360 464 114 20 11 20
E.S. CENTRAL 1,396 178 9 4 20,782 22,991 122 608 437 1 22 7Ky. 161 70 4 4 2,193 2,345 64 46 5 - 8 2Tenn. 528 27 4 - 6,326 7,345 23 505 424 - 11 3Ala. 463 49 1 - 7,418 7,843 25 54 3 1 1 2Miss. 244 32 - - 4,845 5,458 10 3 5 - 2 -
W.S. CENTRAL 5,311 298 19 - 21,411 23,806 924 753 101 81 15 10Ark. 227 15 - - 3,992 3,955 27 29 2 - - 1La. 727 24 - - 5,546 5,713 38 94 35 1 2 -Okla. 423 1 4 - 1,738 2,340 53 115 26 6 9 5Tex. 3,934 258 15 - 10,135 11,798 806 515 38 74 4 4
MOUNTAIN 2,599 184 12 3 5,148 5,919 2,012 280 151 49 48 4Mont. 15 - - 1 22 51 54 4 - - 5 -Idaho 43 6 - - 87 59 95 23 - 1 1 -Wyo. 28 3 - - 41 25 10 13 45 - 5 2Colo. 868 43 3 - 1,572 2,188 492 32 24 29 4 -N. Mex. 212 37 3 2 452 432 171 120 50 2 3 1Ariz. 881 63 4 - 1,920 1,982 690 43 9 7 9 -Utah 185 7 1 - 164 119 457 21 19 10 7 1Nev. 367 25 1 - 890 1,063 43 24 4 - 14 -
PACIFIC 11,546 847 63 15 15,886 22,265 3,287 1,163 424 101 57 55Wash. 764 - - - 1,850 2,020 363 98 93 7 8 1Oreg. 502 - - - 927 737 52 21 8 - - -Calif. 10,149 795 60 15 12,637 18,905 2,415 1,028 315 91 44 53Alaska 12 4 2 - 221 359 410 6 6 - - -Hawaii 119 48 1 - 251 244 47 10 2 3 5 1
Guam - 2 - - 38 36 2 2 - 1 - -P.R. 1,561 27 - - 209 84 36 180 22 2 - -V.I. 33 - - - 58 54 - 2 - - - -Amer. Samoa - - - - 14 20 10 - - - - -C.N.M.I. - 2 - - 42 32 - - - 1 - -
Reporting AreaCum.1993
Cum.1993
Cum.1992
Cum.1993
Cum.1993
Cum.1993
Cum.1993
Cum.1993
Cum.1993
Cum.1993
Cum.1993
Cum.1993
AsepticMenin-
gitisPost-in-fectious
AIDS* A
Encephalitis
Primary B NA,NB Unspeci-fied
Hepatitis (Viral), by typeLyme
DiseaseGonorrhea Legionel-losis
N: Not notifiable U: Unavailable C.N.M.I.: Commonwealth of Northern Mariana Islands*Updated monthly; last update June 5, 1993.
Vol. 42 / No. 25 MMWR 489

TABLE II. (Cont’d.) Cases of selected notifiable diseases, United States, weeks endingJune 26, 1993, and June 20, 1992 (25th Week)
UNITED STATES 439 3 148 1 17 1,951 1,300 32 888 44 1,233 783 2 107 106
NEW ENGLAND 22 - 42 - 2 44 56 - 5 4 295 67 - 1 6Maine 1 - - - - - 5 - - - 8 2 - 1 1N.H. 5 - - - - 12 12 - - 4 192 20 - - -Vt. 1 - 30 - 1 - 4 - - - 42 1 - - -Mass. 2 - 3 - - 8 16 - - - 19 33 - - -R.I. 2 - - - 1 20 1 - 2 - 2 - - - 4Conn. 11 - 9 - - 4 18 - 3 - 32 11 - - 1
MID. ATLANTIC 81 - 6 - 2 205 165 2 62 4 176 78 - 26 11Upstate N.Y. 28 - - - 1 108 76 2 24 4 77 24 - 4 8N.Y. City 24 - 2 - - 38 19 - - - 7 9 - 15 -N.J. 21 - 4 - 1 54 21 - 8 - 21 19 - 6 2Pa. 8 - - - - 5 49 - 30 - 71 26 - 1 1
E.N. CENTRAL 29 - 1 - - 32 184 3 133 7 177 71 - 2 7Ohio 6 - - - - 5 56 2 55 3 111 23 - 1 -Ind. 4 - - - - 19 30 - 3 2 26 12 - - -Ill. 14 - 1 - - 5 57 - 29 - 19 11 - - 7Mich. 5 - - - - 2 40 1 46 2 18 3 - 1 -Wis. - - - - - 1 1 - - - 3 22 - - -
W.N. CENTRAL 13 - 1 - 2 7 80 - 25 3 88 55 - 1 5Minn. 3 - - - - 6 2 - - - 43 18 - - -Iowa 1 - - - - 1 15 - 7 - 1 1 - - -Mo. 3 - 1 - - - 32 - 13 3 24 22 - 1 1N. Dak. 2 - - - - - 3 - 4 - 3 7 - - -S. Dak. 2 - - - - - 3 - - - 1 4 - - -Nebr. 1 - - - - - 4 - 1 - 5 2 - - -Kans. 1 - - - 2 - 21 - - - 11 1 - - 4
S. ATLANTIC 133 - 20 - 3 112 268 14 289 7 127 62 2 9 7Del. 1 - 3 - - 1 11 - 4 - 1 - - 2 -Md. 13 - - - 2 15 25 1 50 1 41 12 2 3 4D.C. 5 - - - - - 4 - - - 2 - - - -Va. 8 - - - 1 11 24 2 16 1 11 4 - - -W. Va. 2 - - - - - 10 - 6 - 6 2 - - -N.C. 78 - - - - 24 47 10 167 3 23 14 - - -S.C. - - - - - 29 20 1 14 - 5 7 - - -Ga. 3 - - - - - 61 - 9 - 5 8 - - -Fla. 23 - 17 - - 32 66 - 23 2 33 15 - 4 3
E.S. CENTRAL 12 - 1 - - 449 82 1 33 7 58 13 - - 1Ky. - - - - - 432 16 - - - 3 - - - -Tenn. 7 - - - - - 17 1 10 3 33 5 - - 1Ala. 3 - 1 - - - 30 - 18 4 20 7 - - -Miss. 2 - - - - 17 19 - 5 - 2 1 - - -
W.S. CENTRAL 11 - 1 - - 999 114 11 132 - 32 105 - 12 6Ark. 2 - - - - - 12 - 4 - 2 6 - - -La. - - 1 - - - 24 - 11 - 5 - - 1 -Okla. 4 - - - - 11 10 5 7 - 12 13 - 1 -Tex. 5 - - - - 988 68 6 110 - 13 86 - 10 6
MOUNTAIN 13 - 2 - - 12 111 - 35 7 87 118 - 4 4Mont. 2 - - - - - 10 - - - - 1 - - -Idaho - - - - - - 7 - 5 2 17 14 - 1 1Wyo. - - - - - 1 2 - 2 - 1 - - - -Colo. 7 - 2 - - 11 16 - 8 5 33 21 - - -N. Mex. 4 - - - - - 3 N N - 19 29 - - -Ariz. - - - - - - 61 - 6 - 10 37 - 1 2Utah - - - - - - 5 - 3 - 7 15 - 1 1Nev. - - - - - - 7 - 11 - - 1 - 1 -
PACIFIC 125 3 74 1 8 91 240 1 174 5 193 214 - 52 59Wash. 13 - - - - 10 37 - 8 1 20 56 - - 6Oreg. 3 - - - - - 19 N N - 3 14 - 1 1Calif. 106 3 64 1† 3 47 166 1 147 4 160 136 - 30 36Alaska - - - - - 9 10 - 5 - 3 - - 1 -Hawaii 3 - 10 - 5 25 8 - 14 - 7 8 - 20 16
Guam 1 U 2 U - 10 1 U 6 U - - U - 1P.R. - - 122 - - 244 6 - 1 - 1 9 - - -V.I. - - - - - - - - 3 - - - - - -Amer. Samoa - - 1 - - - - - - - 2 6 - - -C.N.M.I. - - - - 1 - - - 11 - - 1 - - -
Reporting AreaCum.1993
Cum.1993
Cum.19931993 Cum.
1993Cum.1993
Cum.1992 1993Cum.
1993Cum.19931993 Cum.
1992
Indigenous Imported*Malaria
Measles (Rubeola)RubellaMumps
Menin-gococcalInfections
1993
Total
Cum.1992 1993
Pertussis
*For measles only, imported cases include both out-of-state and international importations.N: Not notifiable U: Unavailable † International § Out-of-state
490 MMWR July 2, 1993

TABLE II. (Cont’d.) Cases of selected notifiable diseases, United States, weeks endingJune 26, 1993, and June 20, 1992 (25th Week)
UNITED STATES 12,737 16,478 114 9,660 9,864 44 149 77 3,633
NEW ENGLAND 215 315 5 189 162 - 8 1 470Maine 3 - 1 7 13 - - - -N.H. 21 24 2 4 - - - - 30Vt. 1 1 - 3 3 - - - 16Mass. 86 151 1 112 74 - 6 1 76R.I. 7 16 1 28 13 - - - -Conn. 97 123 - 35 59 - 2 - 348
MID. ATLANTIC 1,243 2,320 23 2,108 2,389 - 44 6 1,386Upstate N.Y. 103 187 12 189 300 - 9 1 1,036N.Y. City 628 1,280 1 1,284 1,394 - 26 - -N.J. 171 325 - 330 403 - 6 4 205Pa. 341 528 10 305 292 - 3 1 145
E.N. CENTRAL 1,981 2,402 36 1,038 1,000 3 14 5 35Ohio 577 350 15 148 156 1 5 4 4Ind. 177 114 1 113 82 1 1 - -Ill. 732 1,098 5 528 489 - 4 1 4Mich. 298 460 15 206 231 1 4 - 2Wis. 197 380 - 43 42 - - - 25
W.N. CENTRAL 783 655 8 214 232 13 2 6 176Minn. 14 44 2 26 60 - - - 23Iowa 32 21 4 22 21 - - - 34Mo. 652 489 - 115 94 4 2 4 5N. Dak. - 1 - 2 3 - - - 36S. Dak. 1 - - 10 14 7 - 2 19Nebr. 10 19 - 10 13 - - - 2Kans. 74 81 2 29 27 2 - - 57
S. ATLANTIC 3,431 4,638 13 1,690 1,878 1 18 27 1,007Del. 65 111 1 21 25 - 1 1 77Md. 182 348 - 175 130 - 3 2 296D.C. 196 209 - 80 59 - - - 6Va. 321 386 3 217 133 - 1 2 189W. Va. 3 9 - 41 30 - - - 41N.C. 957 1,140 3 244 253 - - 16 39S.C. 538 633 - 204 193 - - 1 84Ga. 569 951 - 360 423 - 1 1 233Fla. 600 851 6 348 632 1 12 4 42
E.S. CENTRAL 1,812 2,161 4 667 706 3 2 8 45Ky. 146 66 2 183 185 - - 3 7Tenn. 522 605 1 144 164 2 - 3 -Ala. 406 855 1 232 202 1 2 - 38Miss. 738 635 - 108 155 - - 2 -
W.S. CENTRAL 2,694 2,802 2 946 929 17 2 22 299Ark. 459 438 - 85 79 10 - - 16La. 1,161 1,231 - - 87 - 1 1 1Okla. 187 123 2 151 68 4 - 21 58Tex. 887 1,010 - 710 695 3 1 - 224
MOUNTAIN 113 195 7 219 246 2 5 2 47Mont. 1 3 - 5 - - - - 9Idaho - 1 1 6 12 - - - 1Wyo. 4 1 - 1 - 1 - 2 6Colo. 32 28 1 8 17 - 4 - 1N. Mex. 19 19 - 35 39 - - - 3Ariz. 50 97 1 108 112 - 1 - 25Utah 2 5 3 11 37 1 - - -Nev. 5 41 1 45 29 - - - 2
PACIFIC 465 990 16 2,589 2,322 5 54 - 168Wash. 27 49 2 127 143 1 4 - -Oreg. 47 24 - 53 49 2 - - -Calif. 387 910 14 2,255 1,979 2 48 - 152Alaska 2 3 - 24 36 - - - 16Hawaii 2 4 - 130 115 - 2 - -
Guam 1 2 - 28 34 - - - -P.R. 289 146 - 93 120 - - - 24V.I. 28 31 - 2 3 - - - -Amer. Samoa - - - 1 - - - - -C.N.M.I. 2 4 - 18 15 - - - -
Reporting AreaCum.1992
Cum.1993
Cum.1993
Cum.1993
Cum.1993
Cum.1993
Cum.1993
Cum.1993
Syphilis(Primary & Secondary)
Tula-remia
Rabies,AnimalTuberculosis
Typhus Fever(Tick-borne)
(RMSF)
Toxic-Shock
Syndrome
Cum.1992
TyphoidFever
U: Unavailable
Vol. 42 / No. 25 MMWR 491

NEW ENGLAND 630 450 104 53 14 9 56Boston, Mass. 170 106 30 21 6 7 21Bridgeport, Conn. 49 38 1 5 4 1 7Cambridge, Mass. 31 24 4 3 - - 2Fall River, Mass. 29 23 5 1 - - -Hartford, Conn. 55 34 14 5 1 1 3Lowell, Mass. 31 18 10 3 - - 2Lynn, Mass. 14 12 2 - - - 1New Bedford, Mass. 23 22 1 - - - 2New Haven, Conn. 44 27 8 8 1 - 2Providence, R.I. 49 34 12 3 - - 2Somerville, Mass. 6 4 1 1 - - -Springfield, Mass. 46 38 8 - - - 5Waterbury, Conn. 22 18 4 - - - -Worcester, Mass. 61 52 4 3 2 - 9
MID. ATLANTIC 2,691 1,664 566 324 63 73 121Albany, N.Y. 33 19 9 1 2 2 2Allentown, Pa. 17 12 4 1 - - 1Buffalo, N.Y. 92 63 19 5 3 2 2Camden, N.J. 35 18 10 3 1 3 2Elizabeth, N.J. 25 19 3 2 - 1 2Erie, Pa.§ 40 28 9 1 1 1 2Jersey City, N.J. 53 33 12 5 2 1 3New York City, N.Y. 1,379 819 308 199 24 29 46Newark, N.J. 84 35 18 23 3 4 7Paterson, N.J. 21 10 2 7 1 1 -Philadelphia, Pa. 504 307 107 53 22 15 29Pittsburgh, Pa.§ 59 40 10 5 - 4 3Reading, Pa. 10 7 - 2 - 1 -Rochester, N.Y. 112 90 17 3 1 1 12Schenectady, N.Y. 16 12 1 1 - 2 1Scranton, Pa.§ 35 34 1 - - - 2Syracuse, N.Y. 94 64 20 4 2 4 6Trenton, N.J. 27 15 4 6 - 2 -Utica, N.Y. 27 18 8 1 - - -Yonkers, N.Y. 28 21 4 2 1 - 1
E.N. CENTRAL 2,289 1,364 483 226 117 99 123Akron, Ohio 44 32 9 2 - 1 -Canton, Ohio 48 36 8 3 1 - 3Chicago, Ill. 590 217 146 106 72 49 20Cincinnati, Ohio 80 60 12 6 1 1 7Cleveland, Ohio 146 88 37 14 3 4 2Columbus, Ohio 197 123 47 14 6 7 6Dayton, Ohio 128 91 24 7 2 4 10Detroit, Mich. 214 132 47 21 9 5 10Evansville, Ind. 35 25 7 3 - - 2Fort Wayne, Ind. 66 47 8 7 2 2 1Gary, Ind. 22 12 3 7 - - -Grand Rapids, Mich. 65 46 8 5 3 3 9Indianapolis, Ind. 173 116 39 4 6 8 14Madison, Wis. 38 24 8 1 - 5 2Milwaukee, Wis. 133 101 25 7 - - 14Peoria, Ill. 45 35 5 2 2 1 7Rockford, Ill. 52 32 11 8 1 - 2South Bend, Ind. 40 29 8 1 1 1 3Toledo, Ohio 117 73 24 7 6 7 10Youngstown, Ohio 56 45 7 1 2 1 1
W.N. CENTRAL 727 530 112 45 24 16 41Des Moines, Iowa 40 31 7 1 1 - 2Duluth, Minn. 33 23 8 - 2 - 1Kansas City, Kans. 19 17 - 1 1 - 4Kansas City, Mo. 111 77 16 6 7 5 6Lincoln, Nebr. 29 19 9 1 - - -Minneapolis, Minn. 187 143 29 11 1 3 13Omaha, Nebr. 86 65 13 6 1 1 1St. Louis, Mo. 110 71 17 7 10 5 8St. Paul, Minn. 68 53 8 6 1 - 6Wichita, Kans. 44 31 5 6 - 2 -
S. ATLANTIC 1,106 667 236 126 33 43 51Atlanta, Ga. U U U U U U UBaltimore, Md. 290 167 75 34 7 7 22Charlotte, N.C. 68 41 15 6 2 4 2Jacksonville, Fla. 113 76 22 11 2 1 2Miami, Fla. 81 34 17 22 2 6 -Norfolk, Va. 56 30 15 6 2 3 5Richmond, Va. 82 50 15 5 8 4 3Savannah, Ga. 48 35 8 4 1 - 1St. Petersburg, Fla. 54 41 4 3 2 4 2Tampa, Fla. 160 107 35 15 2 1 11Washington, D.C. 126 64 26 18 5 13 3Wilmington, Del. 28 22 4 2 - - -
E.S. CENTRAL 785 501 169 66 29 20 60Birmingham, Ala. 91 61 16 9 3 2 6Chattanooga, Tenn. 92 50 23 9 3 7 5Knoxville, Tenn. 89 63 19 4 2 1 6Lexington, Ky. 75 45 20 6 1 3 6Memphis, Tenn. 159 107 29 13 9 1 15Mobile, Ala. 94 57 20 12 2 3 9Montgomery, Ala. 59 40 13 4 2 - 3Nashville, Tenn. 126 78 29 9 7 3 10
W.S. CENTRAL 1,536 935 286 178 81 53 89Austin, Tex. 66 45 11 10 - - 9Baton Rouge, La. 60 33 7 16 2 2 2Corpus Christi, Tex. 50 32 8 6 4 - 4Dallas, Tex. 191 117 32 23 10 9 4El Paso, Tex. 74 53 12 6 2 1 3Ft. Worth, Tex. 100 58 23 6 9 4 3Houston, Tex. 364 199 80 50 17 15 35Little Rock, Ark. 75 40 16 9 5 5 3New Orleans, La. 158 96 23 20 15 4 -San Antonio, Tex. 218 134 43 20 11 10 15Shreveport, La. 94 70 17 5 1 1 9Tulsa, Okla. 86 58 14 7 5 2 2
MOUNTAIN 764 494 142 85 23 20 41Albuquerque, N.M. 88 55 16 11 3 3 2Colo. Springs, Colo. 56 40 8 7 1 - 6Denver, Colo. 104 67 19 11 - 7 6Las Vegas, Nev. 106 63 30 12 - 1 1Ogden, Utah 24 18 1 3 2 - -Phoenix, Ariz. 180 105 37 23 10 5 16Pueblo, Colo. 19 16 1 1 1 - -Salt Lake City, Utah 83 56 12 9 2 4 6Tucson, Ariz. 104 74 18 8 4 - 4
PACIFIC 1,798 1,177 313 192 64 49 102Berkeley, Calif. 31 22 3 1 1 4 2Fresno, Calif. 75 56 11 4 3 1 3Glendale, Calif. 25 21 3 1 - - 1Honolulu, Hawaii 82 60 8 8 5 1 9Long Beach, Calif. 79 58 10 6 2 3 6Los Angeles, Calif. 432 258 88 61 15 8 21Pasadena, Calif. 20 9 7 2 - 2 2Portland, Oreg. 146 97 29 11 6 3 7Sacramento, Calif. 170 114 29 15 7 5 8San Diego, Calif. 125 76 23 12 4 10 6San Francisco, Calif. 151 79 33 32 5 2 3San Jose, Calif. 166 117 23 16 3 6 17Santa Cruz, Calif. 40 31 6 2 1 - 6Seattle, Wash. 140 94 20 17 7 2 2Spokane, Wash. 47 33 8 - 4 2 4Tacoma, Wash. 69 52 12 4 1 - 5
TOTAL 12,326¶ 7,782 2,411 1,295 448 382 684
Reporting Area>65 45-64 25-44 1-24 <1
P&I†TotalAll
Ages
All Causes, By Age (Years)Reporting Area
P&I†TotalAll
Ages
All Causes, By Age (Years)
>65 45-64 25-44 1-24 <1
*Mortality data in this table are voluntarily reported from 121 cities in the United States, most of which have populations of 100,000 ormore. A death is reported by the place of its occurrence and by the week that the death certificate was filed. Fetal deaths are notincluded.
†Pneumonia and influenza.§Because of changes in reporting methods in these 3 Pennsylvania cities, these numbers are partial counts for the current week. Completecounts will be available in 4 to 6 weeks.
¶Total includes unknown ages.U : U nava ila b le .
TABLE III. Deaths in 121 U.S. cities,* week endingJune 26, 1993 (25th Week)
492 MMWR July 2, 1993

of 45. In 1991, the European Region reported 2% of the global total of poliomyelitiscases; 68% of the regional total was from republics of the former Soviet Union.
Southeast Asian Region. Reported coverage with OPV3 increased from 57% to93%, while reported cases of poliomyelitis decreased from 22,814 to 6581; the numberof countries in the region reporting poliomyelitis cases (nine [82%] of 11) was un-changed. In 1991, the Southeast Asian Region reported 46% of the global total ofpoliomyelitis cases; 91% of the regional total was from India.
Western Pacific Region. Reported coverage with OPV3 increased from 89% to 95%,while reported cases of poliomyelitis increased from 2079 to 2615; the number ofcountries in the region reporting poliomyelitis cases decreased from six (17%) of 35 tofive (14%) of 35. In 1991, the Western Pacific Region reported 18% of the global total ofpoliomyelitis cases; 98% of the regional total was from the People’s Republic of Chinaand Vietnam.Reported by: Expanded Program on Immunization, World Health Organization, Geneva. Surveil-lance, Investigations, and Research Br, National Immunization Program; Respiratory andEnterovirus Br, Div of Viral and Rickettsial Diseases, National Center for Infectious Diseases,CDC.Editorial Note: Since 1988, all six WHO regions have reported substantial progresstoward poliomyelitis eradication, and poliomyelitis has apparently been completelyeliminated from one region.§ In the Region of the Americas, three major strategies
> 10 Cases1-10 Cases0 Reported CasesNo Report
FIGURE 2. Incidence of poliomyelitis — worldwide, 1991
§In April 1993, Canada reported isolation of wild poliovirus type 3 from asymptomatic membersof a religious group that objects to vaccination. This virus was likely imported because it wasidentical to a wild poliovirus type 3 that caused an outbreak among persons of a religiouscommunity objecting to vaccination in the Netherlands in 1992–1993 (2 ).
Vol. 42 / No. 25 MMWR 493
Eradication of Poliomyelitis — Continued

were used to eliminate poliomyelitis: 1) achievement of high vaccination coverage;2) maintenance of sensitive systems of clinical and laboratory surveillance; and3) implementation of supplementary vaccination activities, including national vaccina-tion days biannually for all children below a specified age (usually age 5 years,regardless of prior vaccination status) and door-to-door vaccination campaigns in ar-eas with a high incidence of poliomyelitis cases and/or low vaccination coverage (3 ).
In regions other than the Americas, vaccination strategies for poliomyelitis controlhave consisted primarily of routine vaccination. However, recent poliomyelitis out-breaks in highly vaccinated populations (4,5 ) and studies indicating suboptimalseroconversion to poliovirus types 1 and 3 following three doses of oral poliovirusvaccine in many tropical and subtropical regions suggest that routine vaccinationalone may be insufficient to eliminate wild poliovirus infections and that supplemen-tary activities, including national vaccination days, are necessary in countries wherepoliomyelitis is endemic (6 ).
In addition to the strategies used in the Region of the Americas, current globalpoliomyelitis eradication strategies include establishing and expanding polio-freezones and focusing additional resources on countries that are major exporters of wildpoliovirus (7 ). The Global Poliomyelitis Eradication Plan of Action, endorsed by theEPI Global Advisory Group, emphasizes achieving effective surveillance of acute flac-cid paralysis in all countries, initiating supplementary vaccination activities in allcountries, and establishing a fully operational laboratory network in all WHO regionsby 1995 with the goal of eliminating wild poliovirus transmission globally by the year2000 (7 ).
Despite progress in increasing vaccination coverage and decreasing the incidenceof poliomyelitis worldwide, there are at least five major barriers to global poliomyelitiseradication: 1) the presence of populations with suboptimal vaccination coverage, in-cluding unvaccinated subpopulations; 2) the failure of some countries and regions toidentify poliomyelitis eradication as a priority activity (including the implementationof national vaccination days); 3) inadequate managerial skills to implement surveil-lance and vaccination programs effectively in certain countries; 4) su boptimalimmunogenicity of oral poliovirus vaccine in many tropical and subtropical regions;and 5) inadequate commitment of financial resources at national and internationallevels (3 ).
The success of efforts to eradicate poliomyelitis in the Region of the Americas wasbased on the financial support of a broad coalition of national governments, inter-national donor agencies (e.g., Rotary International, the United Nations Children’sFund, the Inter-American Development Bank, the Canadian Public Health Association,and the United States Agency for International Development), the Pan AmericanHealth Organization, and nongovernment community organizations. The creation ofsuch coalitions—both regionally and globally—is of paramount importance in futureefforts. In addition, success in global disease eradication requires that unaffectedcountries provide necessary assistance to geographic areas lacking adequate re-sources (1 ). The success of the global poliomyelitis eradication initiative will entailfinding solutions to these financial, political, and technical challenges.
References1. CDC. International Task Force for Disease Eradication. MMWR 1990;39:209–12,217.
494 MMWR July 2, 1993
Eradication of Poliomyelitis — Continued

2. CDC. Isolation of wild poliovirus type 3 among members of a religious community objectingto vaccination—Alberta, Canada, 1993. MMWR 1993;42:337–9.
3. de Quadros CA, Andrus JK, Olive JM, de Macedo CG, Henderson DA. Polio eradication fromthe Western Hemisphere. Annu Rev Public Health 1992;13:239–52.
4. Reichler MR, Abbas A, Alexander J, et al. Outbreak of poliomyelitis in a highly immunizedpopulation in Jordan [Abstract]. In: Program and abstracts of the 32nd Interscience Conferenceon Antimicrobial Agents and Chemotherapy. Washington, DC: American Society for Microbi-ology, 1992.
5. Sutter RW, Patriarca PA, Brogan S, et al. Outbreak of paralytic poliomyelitis in Oman: evidencefor widespread transmission among fully vaccinated children. Lancet 1991;338:715–20.
6. Patriarca PA, Wright PS, John TJ. Factors affecting immunogenicity of oral poliovirus vaccinein developing countries: review. Rev Infect Dis 1991;13:926–39.
7. World Health Organization. Expanded Programme on Immunization Global Advisory Group,part II. Wkly Epidemiol Rec 1993;68:11–6.Eradication of Poliomyelitis — Continued
Emerging Infectious Diseases
Update: Outbreak of Hantavirus Infection —Southwestern United States, 1993
Outbreak of Hantavirus Infection — ContinuedAn outbreak of illness associated with hantavirus infection continues to be investi-gated by state health departments in New Mexico, Arizona, Colorado, and Utah; theIndian Health Service; and CDC, with the assistance of the Navajo Nation Division ofHealth (1–3 ). This report updates information regarding the outbreak and presentsinformation on two cases that occurred in the 10 months preceding this outbreak.
Laboratory evidence of acute hantavirus infection has been confirmed in 15 pa-tients who had onsets of illness from January 1 through June 30. Each of thesepatients has had one or more of the following: positive enzyme-linked immunosor-bent assay (ELISA) serology with elevated immunoglobulin M titers indicating recentinfection, seroconversion by ELISA, positive immunohistochemistry on formalin-fixedlung tissue, or amplification of hantavirus nucleotide sequences from frozen tissue. Ofthe 15 cases, 10 occurred in New Mexico, three in Arizona, and one in Colorado; 12(80%) occurred among persons aged 20–40 years. Eleven patients died. Similar ill-nesses in an additional 23 persons, 10 of whom died, are being investigated forpossible hantavirus infection.
Since June 6, a total of 668 rodents have been trapped in and around houses in 14different rural sites. Peromyscus maniculatus (deer mouse) comprised 63% (range:36%–88%) of all rodents trapped and 85% of those trapped in homes. Of the first 283rodents tested, hantavirus antibodies were detected in 23%.
In June 1993, two persons were identified who had evidence of hantavirus infec-tions in 1992. In November 1992, fever and acute respiratory distress occurred in aresident of the outbreak area. Recent serologic evaluation of an acute serum specimenobtained at the time of illness showed evidence of hantavirus infection. In August1992, fever and myalgias followed by adult respiratory distress syndrome occurred ina person who resided outside the outbreak area; onset of illness was approximately2 weeks after this person had returned home from a trip to the four-state area. Thetraveler had engaged in outdoor activities and was exposed to rodents and rodentexcreta during both indoor and outdoor activities during the trip. A serum sample
Vol. 42 / No. 25 MMWR 495
Eradication of Poliomyelitis — Continued
tested in June 1993 showed elevated immunoglobulin G titers to hantavirus. Althougha high immunoglobulin G titer in a single, recently obtained serum sample does notdefinitively establish the occurrence of a hantavirus infection at the time of illness, theserologic data and the clinical illness are strongly suggestive of hantavirus infection.Reported by: F Koster, MD, H Levy, MD, G Mertz, MD, A Cushing, MD, S Young, PhD, K Foucar,MD, J McLaughlin, PhD, B Bryt, MD, Univ of New Mexico School of Medicine, T Merlin, MD,Lovelace Medical Center, Albuquerque; R Zumwalt, MD, P McFeeley, MD, K Nolte, MD, NewMexico Office of the Medical Investigator; MJ Burkhardt, MPH, Secretary of Health, N Kalish-man, MD, M Gallaher, MD, R Voorhees, MD, M Samuel, DrPH, M Tanuz, G Simpson, MD,L Hughes, PhD, E Umland, MD, G Oty, MS, L Nims, MS, CM Sewell, DrPH, State Epidemiologist,New Mexico Dept of Health. R Levinson, MD, F Yerger, MD, B Allan, MD, Scottsdale; P Rubin,Phoenix; K Komatsu, MPH, C Kioski, MPH, K Fleming, MA, J Doll, PhD, C Levy, MS, TM Fink,P Murphy, B England, MD, M Smolinski, MD, B Erickson, PhD, W Slanta, L Sands, DO, ActingState Epidemiologist, Arizona Dept of Health Svcs. P Shillam, MSPH, RE Hoffman, MD, StateEpidemiologist, Colorado Dept of Health. S Lanser, MPH, CR Nichols, MPA, State Epidemiolo-gist, Utah Dept of Health. L Hubbard-Pourier, MPH, Div of Health, Navajo Nation, Window Rock,Arizona. J Cheek, MD, A Craig, MD, R Haskins, MPH, B Muneta, MD, B Tempest, MD, M Carroll,MD, LA Shands, MPH, JP Sarisky, MPH, RE Turner, L White, P Bohan, MS, Indian Health Svc.Div of Field Epidemiology, Epidemiology Program Office; National Center for EnvironmentalHealth; Div of Bacterial and Mycotic Diseases, Div of Vector-Borne Infectious Diseases, ScientificResources Program, and Div of Viral and Rickettsial Diseases, National Center for InfectiousDiseases, CDC.Editorial Note: The identification of two persons with evidence of hantavirus infectionthat occurred in 1992 suggests that hantavirus infection has been present previouslybut was not recognized. Investigations are now in progress to identify whetherchanges in the local environment or other factors have been associated with the in-creased occurrence and/or transmission of this infection. Preliminary data from fieldinvestigations indicate that P. maniculatus is the likely reservoir of this virus. Alth oughthe exact mechanism of hantavirus transmission to humans is unknown, potentiallyhazardous exposures include direct aerosolization of urine and other potentially infec-tive rodent body fluids, secondary aerosolization of dried rodent excreta,contamination of food, and direct contact with virus-bearing rodents or their excretaor saliva.
Additional studies are under way to identify practical and effective means of pre-venting infection caused by hantaviruses. Residents and travelers in New Mexico,Arizona, Colorado, and Utah are advised to avoid any activities that may result in con-tact with wild rodents or rodent excreta or disruption of rodent burrows. The followingspecific recommendations for residents and travelers are based on current knowledgeof transmission of other hantaviruses: 1) avoid activities that can result in contact withwild rodents, disruption of rodent burrows, or aerosolization of dried rodent excreta;2) store food appropriately to avoid contamination with rodents and rodent excreta;and 3) dispose of food and trash properly to avoid attracting rodents.
References1. CDC. Outbreak of acute illness—Southwestern United States, 1993. MMWR 1993;42:421–4.2. CDC. Update: outbreak of hantavirus infection—Southwestern United States, 1993. MMWR
1993;42:441–3.3. CDC. Update: outbreak of hantavirus infection—Southwestern United States, 1993. MMWR
1993;42:477–9.
Outbreak of Hantavirus Infection — Continued
496 MMWR July 2, 1993
Outbreak of Hantavirus Infection — Continued

Surveillance Summaries
Publication of CDC Surveillance Summaries
Since 1983, CDC has published the CDC Surveillance Summaries under separatecover as part of the MMWR series. Each report published in the CDC SurveillanceSummaries focuses on public health surveillance; surveillance findings are reportedfor a broad range of risk factors and health conditions.
Summaries for each of the reports published in the most recent (June 4, 1993) issueof the CDC Surveillance Summaries (1 ) are provided below. All subscribers toMMWR receive the CDC Surveillance Summaries, as well as the MMWR Recommen-dations and Reports, as part of their subscriptions.
SURVEILLANCE FOR DIABETES MELLITUS — UNITED STATES, 1980–1989Problem/Condition: In 1989, approximately 6.7 million persons reported that they
had diabetes, and a similar number probably had this disabling chronic disease with-out being aware of it. Diabetes mellitus is the most important cause of lower extremityamputation and end-stage renal disease, the major cause of blindness amongworking-age adults, a major cause of disability, premature mortality, congenital mal-formations, perinatal mortality, and health-care costs, and an important risk factor forthe development of many other acute and chronic conditions (e.g., diabetic ketoaci-dosis, ischemic heart disease, and stroke). Surveillance data describing diabetes andits complications are critical to increasing recognition of the public health burden ofdiabetes, formulating health-care policy, identifying high-risk groups, developingstrategies to reduce the burden of this disease, and evaluating progress in diseaseprevention and control.
Reporting Period Covered: This report summarizes data from CDC’s diabetes sur-veillance system, evaluating trends in diabetes and its complications by age, sex, andrace for the years 1980–1989 (end year depending on data source).
Description of System: CDC has established an ongoing and evolving surveillancesystem to analyze and compile periodic, representative data on the disease burden ofdiabetes and its complications in the United States. Data sources currently includevital statistics, the National Health Interview Survey, the National Hospital DischargeSurvey, and Medicare claims data for end-stage renal disease.
Results and Interpretation: These surveillance data indicate that the disease bur-den of diabetes and its complications is likely to grow as the population ages, thateffective intervention strategies are needed to prevent diabetes and its complications,that prevention efforts need to be intensified among groups at highest risk, includingblacks, and that important gaps exist in periodic and representative data for de-scribing the burden of diabetes and its complications.
Actions Taken: CDC is currently exploring possible data sources to address the sur-veillance data gaps on blindness, adverse outcomes of pregnancy, and the publichealth burden of diabetes among minority groups.Authors: Linda S. Geiss, M.A., William H. Herman, M.D., Merilyn G. Goldschmid, M.D., FrankDeStefano, M.D., M.P.H., Division of Diabetes Translation, National Center for Chronic DiseasePrevention and Health Promotion, CDC. Mark S. Eberhardt, Ph.D., Office of Analysis andEpidemiology, National Center for Health Statistics, CDC. Earl S. Ford, M.D., M.P.H., RobertR. German, M.P.H., Jeffrey M. Newman, M.D., M.P.H., David R. Olson, Ph.D., Stephen J. Sepe,
Vol. 42 / No. 25 MMWR 497

M.P.H., John M. Stevenson, Ph.D., Frank Vinicor, M.D., M.P.H., Scott F. Wetterhall, M.D., M.P.H.,Julie C. Will, Ph.D., Division of Diabetes Translation, National Center for Chronic Disease Pre-vention and Health Promotion, CDC.
LABORATORY-BASED SURVEILLANCE FOR MENINGOCOCCAL DISEASE IN SELECTED COUNTIES — UNITED STATES, 1989–1991
Problem/Condition: Neisseria meningitidis is a leading cause of bacterial meningi-tis and septicemia in the United States. Accurate surveillance for meningococcaldisease is required to detect trends in patient characteristics, antibiotic resistance, andserogroup-specific incidence of disease.
Reporting Period Covered: January 1989 through December 1991.Description of System: A case of meningococcal disease was defined by the isola-
tion of Neisseria meningitidis from a normally sterile site, such as blood or cerebro-spinal fluid, in a resident of a surveillance area. Cases were reported by contacts ineach hospital laboratory in the surveillance areas. The surveillance areas consisted ofthree counties in the San Francisco metropolitan area, eight counties in the Atlantametropolitan area, four counties in Tennessee, and the entire state of Oklahoma.
Results: Age- and race-adjusted projections of the U.S. population suggest that ap-proximately 2600 cases of meningococcal disease occurred annually in the UnitedStates. The case-fatality rate was 12%. Incidence declined from 1.3 per 100,000 in 1989to 0.9 per 100,000 in 1991. Seasonal variation occurred, with the highest attack rates inFebruary and March and the lowest in September. The highest rates of disease wereamong infants, with 46% of cases in those ≤2 years of age. Males accounted for 55% oftotal cases, with an incidence among males of 1.2 per 100,000, compared with 1.0 per100,000 among females (relative risk [RR]=1.3, 95% confidence interval [CI]=1.0–1.6).The incidence was significantly higher among blacks (1.5 per 100,000) than whites (1.1per 100,000), with a relative risk of disease for blacks of 1.4 (95% CI=1.1–1.8). Sero-group B caused 46% of cases and serogroup C, 45%. Thirty-eight percent of isolateswere reported to be resistant to sulfa; none were reported to be resistant to rifampin.
Interpretation: The decline in incidence of meningococcal disease from 1989 to1991 cannot be explained by any change in public health control measures; this trendshould be monitored by continued surveillance. The age, sex, and race distributionand seasonality of cases are consistent with previous reports. The proportion ofN. meningitidis isolates resistant to sulfa continues to be substantial. A relativelysmall proportion of cases is potentially preventable by the use of the currently avail-able polysaccharide vaccine, which induces protection against serogroups A, C, Y, andW135 and is effective only for persons >2 years of age.
Actions Taken: Current recommendations against the use of sulfa drugs for treat-ment or prophylaxis of meningococcal disease unless the organism is known to besulfa sensitive should be continued. Since resistance to rifampin is rarely reported, itcontinues to be the drug of choice for prophylaxis. The development of vaccines effec-tive for infants and vaccines inducing protection against serogroup B would beexpected to have a substantial impact on disease.Authors: Lisa A. Jackson, M.D., Jay D. Wenger, M.D., Meningitis and Special Pathogens Branch,Division of Bacterial and Mycotic Diseases, National Center for Infectious Diseases, CDC. TheMeningococcal Disease Study Group.
Reference1. CDC. CDC surveillance summaries (June 4). MMWR 1993;42(no. SS–2).
Surveillance Summaries — Continued
498 MMWR July 2, 1993

Notice to Readers
Change in Source of Information:Availability of Varicella Vaccine
for Children with Acute Lymphocytic Leukemia
Notice to Readers — ContinuedAn investigational, live, attenuated varicella vaccine continues to be available freeof charge through Merck Research Laboratories (West Point, Pennsylvania) to anyphysician requesting it for certain pediatric patients (aged 12 months–17 years) withacute lymphocytic leukemia (ALL) (1 ). However, the source of information about eligi-bility criteria and vaccine administration has changed (1 ) and is now available fromthe Varivax Coordinating Center, Bio-Pharm Clinical Services, Inc., 4 Valley Square,Blue Bell, PA 19422; telephone (215) 283-0897.
An Investigational New Drug application for the vaccine is on file with the Food andDrug Administration. Varicella vaccine is being provided to this group of patients foruse through a study protocol to monitor and evaluate safety. Patients must meetspecified criteria, including no clinical history of varicella and continuous remissionfor at least 12 months. The physician must provide information outlined in the proto-col, and the protocol and consent form for the study must be approved by theinstitution’s Investigational Review Board.Reported by: National Immunization Program, CDC.
Reference1. CDC. Availability of varicella vaccine for children with acute lymphocytic leukemia. MMWR
1992;41:326–7.
Reported cases of measles, by state — United States, weeks 21–25, 1993
Vol. 42 / No. 25 MMWR 499

The Morbidity and Mortality Weekly Report (MMWR) Series is prepared by the Centers for Disease Controland Prevention (CDC) and is available on a paid subscription basis from the Superintendent of Documents,U.S. Government Printing Office, Washington, DC 20402; telephone (202) 783-3238.
The data in the weekly MMWR are provisional, based on weekly reports to CDC by state healthdepartments. The reporting week concludes at close of business on Friday; compiled data on a national basisare officially released to the public on the succeeding Friday. Inquiries about the MMWR Series, includingmaterial to be considered for publication, should be directed to: Editor, MMWR Series, Mailstop C-08, Centersfor Disease Control and Prevention, Atlanta, GA 30333; telephone (404) 332-4555.
✩U.S. Government Printing Office: 1993-733-131/83014 Region IV
Director, Centers for Disease Control andPreventionWilliam L. Roper, M.D., M.P.H.
Deputy Director, Centers for Disease Controland PreventionWalter R. Dowdle, Ph.D.
Acting Director, Epidemiology Program OfficeBarbara R. Holloway, M.P.H.
Editor, MMWR SeriesRichard A. Goodman, M.D., M.P.H.
Managing Editor, MMWR (weekly)Karen L. Foster, M.A.
Writers-Editors, MMWR (weekly)David C. JohnsonPatricia A. McGeeDarlene D. RumphCaran R. Wilbanks
500 MMWR July 2, 1993