UPDATE KOMMT NOCH PORR AG FY 2016 PORR AG Q3 2016 1H … · 501-53 FY 16 147 - 353 Reduction of EUR...
39
Investor Presentation August 2016 1H 2016 of PORR AG PORR AG Q3 2016 NEW BUILDING Investor Presentation November 2016 PORR AG FY 2016 Intelligent Building... Investor Presentation April 2017 UPDATE KOMMT NOCH
Transcript of UPDATE KOMMT NOCH PORR AG FY 2016 PORR AG Q3 2016 1H … · 501-53 FY 16 147 - 353 Reduction of EUR...

Investor Presentation
August 2016
1H 2016 of PORR AG
PORR AG Q3 2016NEW BUILDING
Investor Presentation
November 2016
PORR AG FY 2016Intelligent Building...
Investor Presentation
April 2017
Cover Update
UPDATE KOMMT NOCH

Disclaimer• This presentation was prepared by PORR AG (the "Company") solely for use at investors’ meetings and is provided solely for
informational purposes.
• This presentation dates from April 2018. The facts and information contained herein might be subject to revision in the future.
Neither the delivery of this presentation nor any further discussions of the Company with any of the recipients shall, under any
circumstances, create any implication that there has been no change in the affairs of the Company since such date. None of
the Company or any of its subsidiaries or any of its shareholders or any of such person's directors, officers, employees or
advisors nor any other person makes any representation or warranty, express or implied as to, and no reliance should be placed
on, the accuracy or completeness of the information contained in this presentation. None of the Company or any of its
subsidiaries or any of its shareholders or any of such person's directors, officers, employees and advisors nor any other person
shall have any liability whatsoever for any loss howsoever arising, directly or indirectly, from any use of this presentation. The
same applies to information contained in other material made available at the meeting.
• This document is selective in nature and is intended to provide an introduction to, and overview of, the business of the
Company. Wherever external sources are quoted in this presentation, such external information or statistics should not be
interpreted as having been adopted or endorsed by the Company as being accurate.
• This presentation contains forward-looking statements relating to the business, financial performance and results of the
Company and/or the industry in which the Company operates. These statements generally are identified by words such as
"believes", "expects", "predicts", "intends", "projects", "plans", "estimates", "aims", "foresees", "anticipates", "targets", and
similar expressions. The forward-looking statements, including but not limited to assumptions, opinions and views of the
Company or information from third party sources, contained in this presentation are based on current plans, estimates,
assumptions and projections and involve uncertainties and risks. Various factors could cause actual future results, performance
or events to differ materially from those described in these statements. The Company does not represent or guarantee that the
assumptions underlying such forward-looking statements are free from errors nor do they accept any responsibility for the
future accuracy of the opinions expressed in this presentation. No obligation is assumed to update any forward-looking
statements.
• By accepting this presentation you acknowledge that you will be solely responsible for your own assessment of the market and
of the market position of the Company and that you will conduct your own analysis and be solely responsible for forming your
own view of the potential future performance of the Company's business.
Investor Presentation ● 26/04/2018 ● Page 2

Highlights FY 2017
Double-digit top-line growth above market average
Second best EBT result in PORR’s history
Strong order book at EUR 6.4bn ensures full utilization
far beyond 2018, landmark projects wins
Net debt at EUR 147.4m better than expected, down from Q3
peak by EUR 353m
Dividend of EUR 1.10 – unchanged at record level,
attractive dividend policy and yield
Outlook FY 2018: output growth to EUR 5bn
Investor Presentation ● 26/04/2018 ● Page 3

Top-Line Growth Outperforms Market
2014 2015 2016 2017
3.43.5
3.9
3.2
2013
Delivery of mid-term output target in
Germany of more than EUR 1bn
Output at EUR 4.7bn – an all time high
Resilient top-line growth of 20.7%,
outperforming market
(Europe: 3% / Peers: 7%)
• Double-digit CAGR 2013-2017: 10.6%
• 12.3% organic / 8.4% acquisition growth
4.7
Production output (EURbn)
Investor Presentation ● 26/04/2018 ● Page 4
20.7%

Strong Order Book Supports Selective Bidding
Order Backlog in EUR m
4,804
6,367
Top 10 Projects
1 Stated values are project values at time of contract award
2016 2017
Selected Projects Country
Brenner Base Tunnel2
Highway A1 Rhine Bridge
Bratislava Ringroad D4R7
Koralmtunnel
Fildertunnel (Stuttgart)
Tunnel Albaufstieg
Al Wakrah Stadium
SL-G Slab Track General
Office Europaallee Zürich
AT
DE
DE
QA
CH
DE
SK
AT
QA
966.0
300.3
304.8
297.1
266.4
234.9
201.5
161.5
152.5
PlanEUR m1
2018-2024
2016-2020
2013-2021
2011-2019
2016-2018
2015-2018
2015-2020
2012-2019
2018-202432%
Investor Presentation ● 26/04/2018 ● Page 5
2 Brenner Base Tunnel project entry in April 2018
Metro Green Line Doha QA 943.6 2013-2018

New Orders with Landmark Projects
4,150
6,301
Top Order Wins
1 Stated values are project values at time of contract award
2016 2017
Order Intake in EUR m
52%
Selected Projects Country
Brenner Base Tunnel2
A1 Rhine Bridge Leverkusen
Deep Tunnel Stormwater System,
Dubai
BMW München Freimann
Railroad LK 354 Poznan-Pila
U5 Europaviertel, Frankfurt
Musaimeer Pumping Station, Doha
Railway Tunnel Erdinger Ringschluss
Office Building Baloise Park, Basel
S7 National road Mlawa - Strzegowo
PL
DE
QA
CH
PL
DE
AE
DE
DE
139.4
304.8
114.0
112.5
104.4
99.8
92.5
86.5
86.3
2018-2024
2017-2019
2017-2019
EUR m1 Plan
Investor Presentation ● 26/04/2018 ● Page 6
2017-2022
2017-2021
2017-2018
2018-2020
2017-2020
2018-2021
AT 966.0 2018-2024
2 Brenner Base Tunnel project entry in April 2018
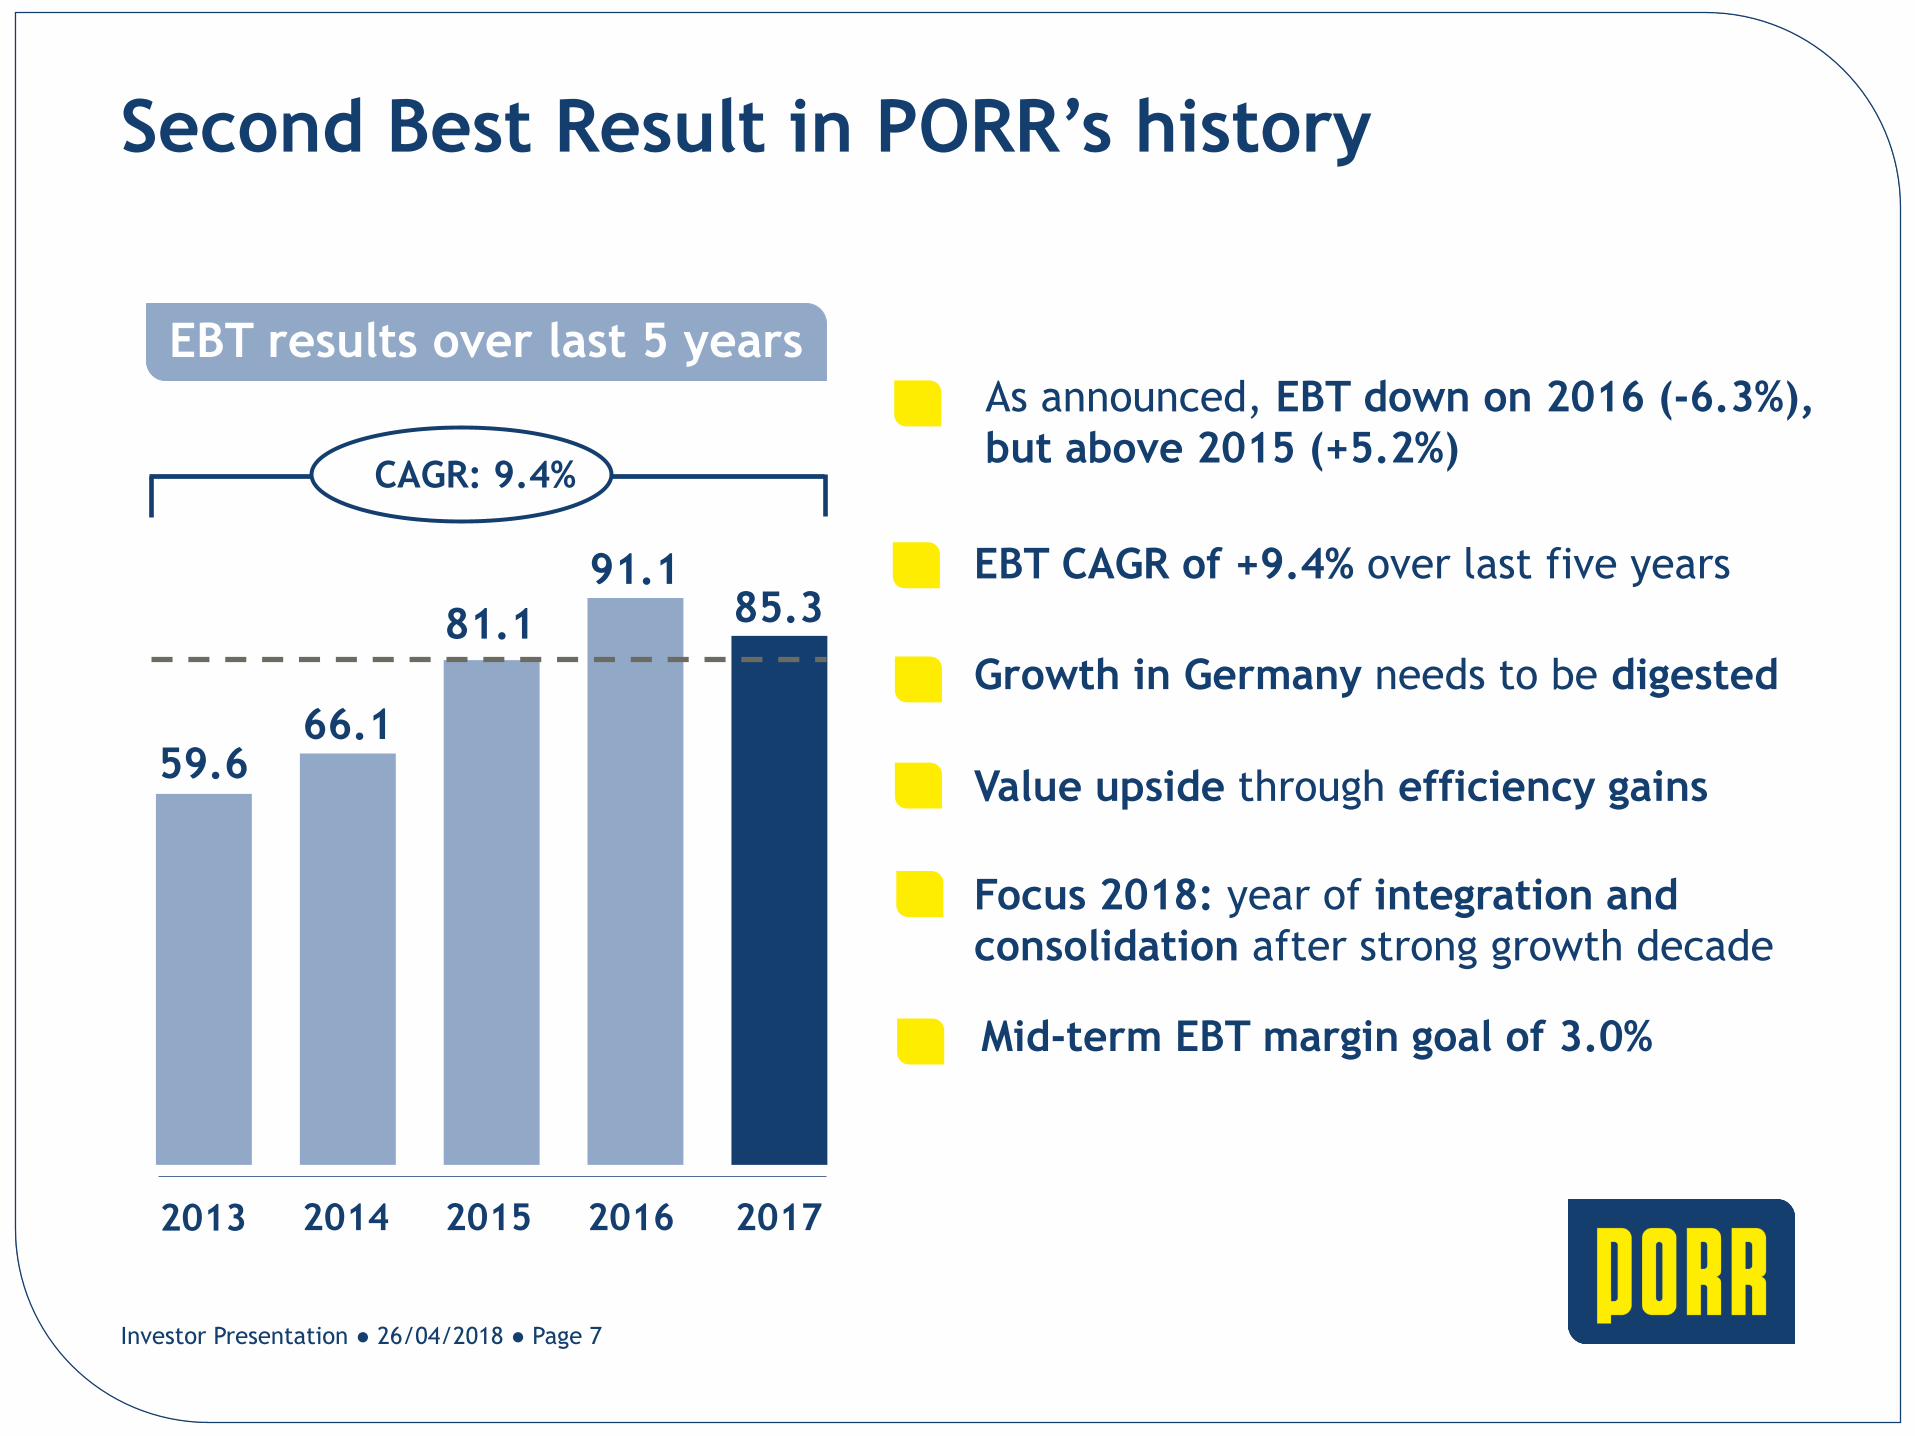
Second Best Result in PORR’s history
Growth in Germany needs to be digested
Focus 2018: year of integration and
consolidation after strong growth decade
Value upside through efficiency gains
EBT CAGR of +9.4% over last five years
As announced, EBT down on 2016 (-6.3%),
but above 2015 (+5.2%)
EBT results over last 5 years
Investor Presentation ● 26/04/2018 ● Page 7
Mid-term EBT margin goal of 3.0%
2014 2015 2016 2017
66.1
81.1
91.1
59.6
2013
85.3
CAGR: 9.4%

Net Debt Better Than Expected
Q1 HY 9M FY/17
195
375
501
-53
FY 16
147
- 353
Reduction of EUR -353m in Q4/17 alone
Net Debt 2017 of 147.4m in line with
market expectations
Strict focus on net debt
2017: year of acquisitions and
investments
Proof of PORR’s ability to steer
key financials
Investor Presentation ● 26/04/2018 ● Page 8

• Fit for future
• Process & cost
optimisation
2018: Year of Consolidation
RESET
EXPAND
CONSOLIDATE
YIELD
2011 – 2012
2013 – 2017
2018
2019-2020
• Innovation leader
• Technical
excellence
• Bundle operations
• Integration
• Focus on operational
excellence
• Paperless site
• Transformation
• Teamwork
Investor Presentation ● 26/04/2018 ● Page 9

PORR in 2018
STRONG CORE INTERNATIONAL
• Five home
markets with
strong local power
• #1 Scale in Austria
• Differentiate
through portfolio
of projects with
different sizes
Investor Presentation ● 26/04/2018 ● Page 10
• PORR competes
internationally in
selective projects
in civil engineering
• Sectors fit with
competitive know-
how
OPERATIONAL
• Focus on
operational
excellence,
project control,
cash and cost
discipline
THINK BEYOND
• Portfolio
complemented by
activities driving
construction and
margins
• E.g. export
products, PPP-
projects

Record Dividend Unchanged
2013 2014 2015 2016 2017
Dividend yield
0.50
0.75
1.001
1.10 1.10
Shareholder focus:
consistent dividend policy
(30-50% payout ratio2)
Top-end dividend yield of 3.9%
in the sector
EUR 1.10 dividend per share –
high level unchanged
Dividends per share (EUR)
Investor Presentation ● 26/04/2018 ● Page 11
1 In 2015 excluding additional scrip dividend; 2 based on net profit and depending on M&A strategy
3 Restated excl. discontinued operations
4.00%3 3.37%3 3.58% 2.83% 3.95%

Construction market outlook to remain strong in 2018
Outlook 2018
EUR 5bn production output
Record order book supports growth and selective bidding
Focus on operational excellence
Investor Presentation ● 26/04/2018 ● Page 12

PORR as an Investment
• Market leader in Austria
• Strong footprint in five European home markets (87% of total)
• Demand outperforms construction supply
Strong Core
• Landmark projects across every sector
• One-stop-shop: value chain in-house
• Order backlog of EUR 6.4bn: full capacity utilization far beyond 2018
USP
• Attractive dividend policy
• Continuity in payout ratio (30-50% of net profit)
• Shareholder value first
Capital Market
• Focus on profitability and sound balance sheet
• Focus on risk-profile and balanced quality of order book
• Focus on innovation and technology
Focus
Investor Presentation ● 26/04/2018 ● Page 13

About PORR

PORR – At a Glance
Key Facts
1AT/CH/CZ
(home markets)
2DE
(home market)
3International
(project market)
4Environmental,
healthcare & serv.Home markets
Project markets Target markets
PORR, a leading full service
provider in the construction
sector
Building Infrastructure Civil engineering Environmental
Employees
~17,719Production
EUR 4.7bn
EBT
EUR 85.3mBacklog
EUR 6.4bn
Business Units Markets
QA
Investor Presentation ● 26/04/2018 ● Page 15

Leading in home markets
Profitable project markets
Promising target markets
3%
sustainable
EBT margin
Not the biggest,
but the best
Focus on earnings
instead on output
Strict cost & risk
management
Strong capital base
Leading role in
innovation and
technology
Excellent
customer relationship
Best place to work
Intelligent Growth
No Change in Strategy – Focus on Execution
Investor Presentation ● 26/04/2018 ● Page 16

Construction matters
80% of population to live in
urban areas in Europe by 2050
Infrastructure investment
gap remains
Ongoing urbanisation Infrastructure New Standards
▪ Ongoing urbanization and ageing infrastructure as key drivers of growth
▪ Sizeable investment plans in infrastructure
“Paperless” in construction
unleashes value
(Germany: 270bn by 2030, Austria: 30bn by 2022, Poland/PKP: 83bn by 2020)
▪ Technology capture the shift of client needs as well increasing
complexity of projects
Source: UN, BBVA Research, German national transport plan 2030, BMVIT, PKP
Investor Presentation ● 26/04/2018 ● Page 17

Construction Markets on a Growing Path
1 Euroconstruct-19 Countries, 2 Without Qatar
Source: 84th EUROCONSTRUCT Summary Report, European Commission
Home Markets (87% Production Share)
Project Markets (13% Production Share)
Target Markets
487.7
2017 Civil Engineering
Market in EUR bn
2017 Total Construction
Market in EUR bn
2017 Civil Engineering
Market2 in EUR bn
2017 – 2020
2017 - 2020
2017 – 2020
60.0
18.3
+1.4%
CAGR
+4.6%
CAGR
+2.4%
CAGR
1,503
2017 Total Construction
Market1 in EUR bn
QA
Investor Presentation ● 26/04/2018 ● Page 18

Selected Future Trends in ConstructionRele
vance
Degree of implementation/maturity
BIM Portfolio
related impacts
Organisational
impacts
Regional
impacts
Technological
impacts
War for talent
Smart home
Green building
Focus on core business
Geographical expansion
Energy efficiency
Improved materials
Apps
Service expansion
Urban mining
3D printing
In-house utilities
P O R TDetermining the
dimensions for
strategy definition
high
low
highlow
Source: Roland Berger
Investor Presentation ● 26/04/2018 ● Page 19

General/Total Contractor with Expertise in Lean Construction
Design
Financial
Engineering
Construction
Operation
Preparation
Genera
l Contr
acto
r
Tota
l Contr
acto
r
• PORR focus purely on construction and builds as much
as possible itself
• Strong core competencies alongside the construction
value chain (e.g. Lean Construction)
• Within single segments PORR develops unique
expertise (e.g. civil engineering) to be „best in class“
• Where our specific knowledge gives us an edge, we
selectively extend our service portfolio, e.g.:
Operation
PPP in two
Austrian
children’s
hospitals
Financial Engineering
PPP-School “Berresgasse”
Campus in Vienna…
…and also in civil engineering
Bad Erlaa
Rohrbach
Investor Presentation ● 26/04/2018 ● Page 20
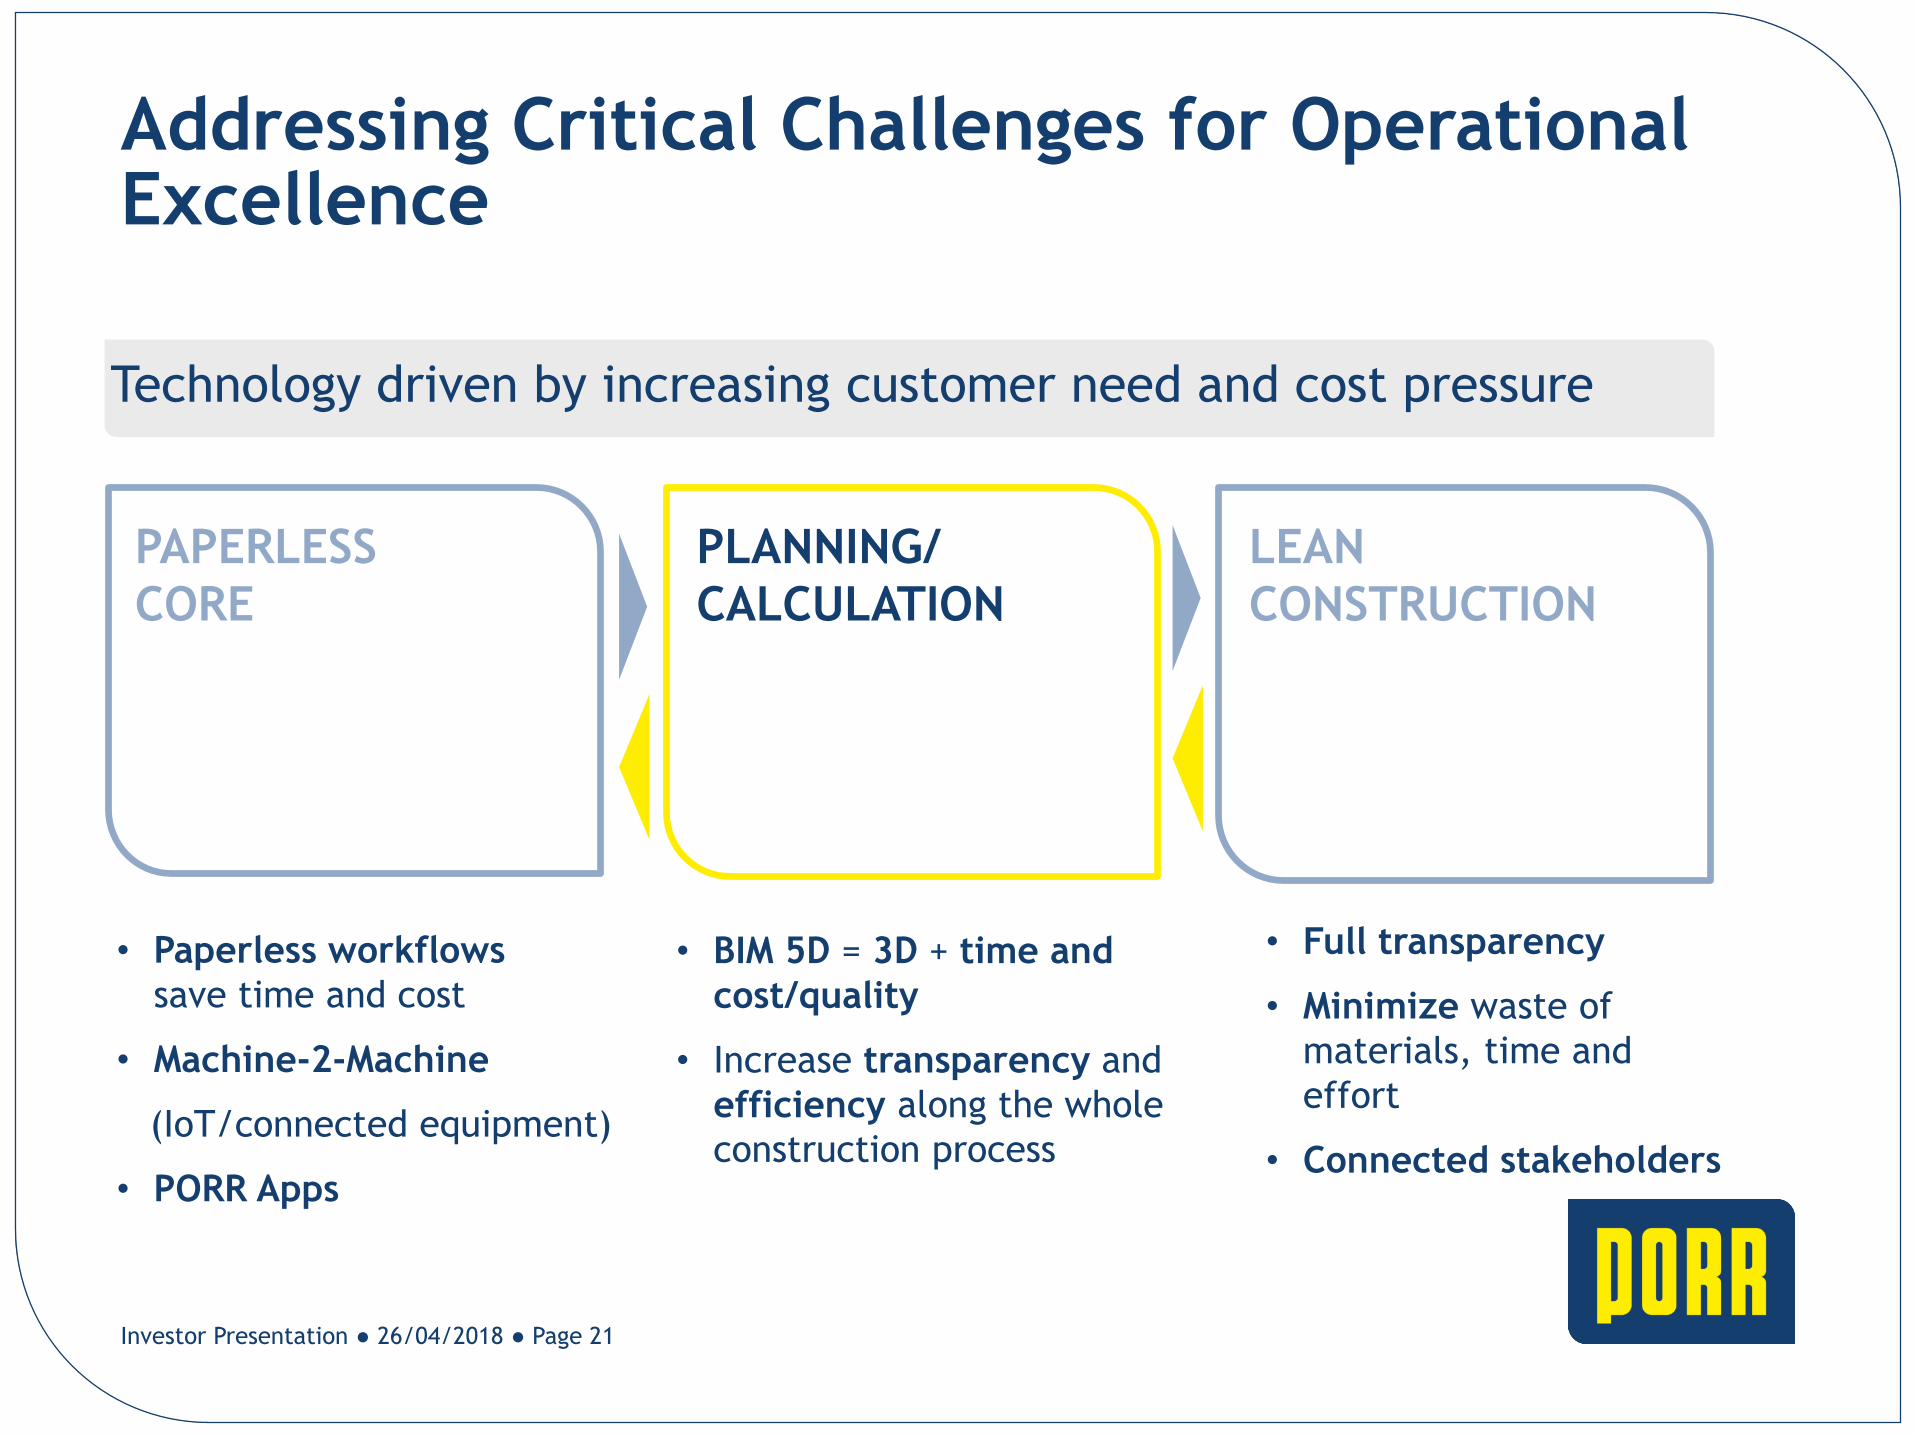
Addressing Critical Challenges for Operational Excellence
Investor Presentation ● 26/04/2018 ● Page 21
PAPERLESS
CORE
PLANNING/
CALCULATION
LEAN
CONSTRUCTION
Technology driven by increasing customer need and cost pressure
• Paperless workflows
save time and cost
• Machine-2-Machine
(IoT/connected equipment)
• PORR Apps
• BIM 5D = 3D + time and
cost/quality
• Increase transparency and
efficiency along the whole
construction process
• Full transparency
• Minimize waste of
materials, time and
effort
• Connected stakeholders
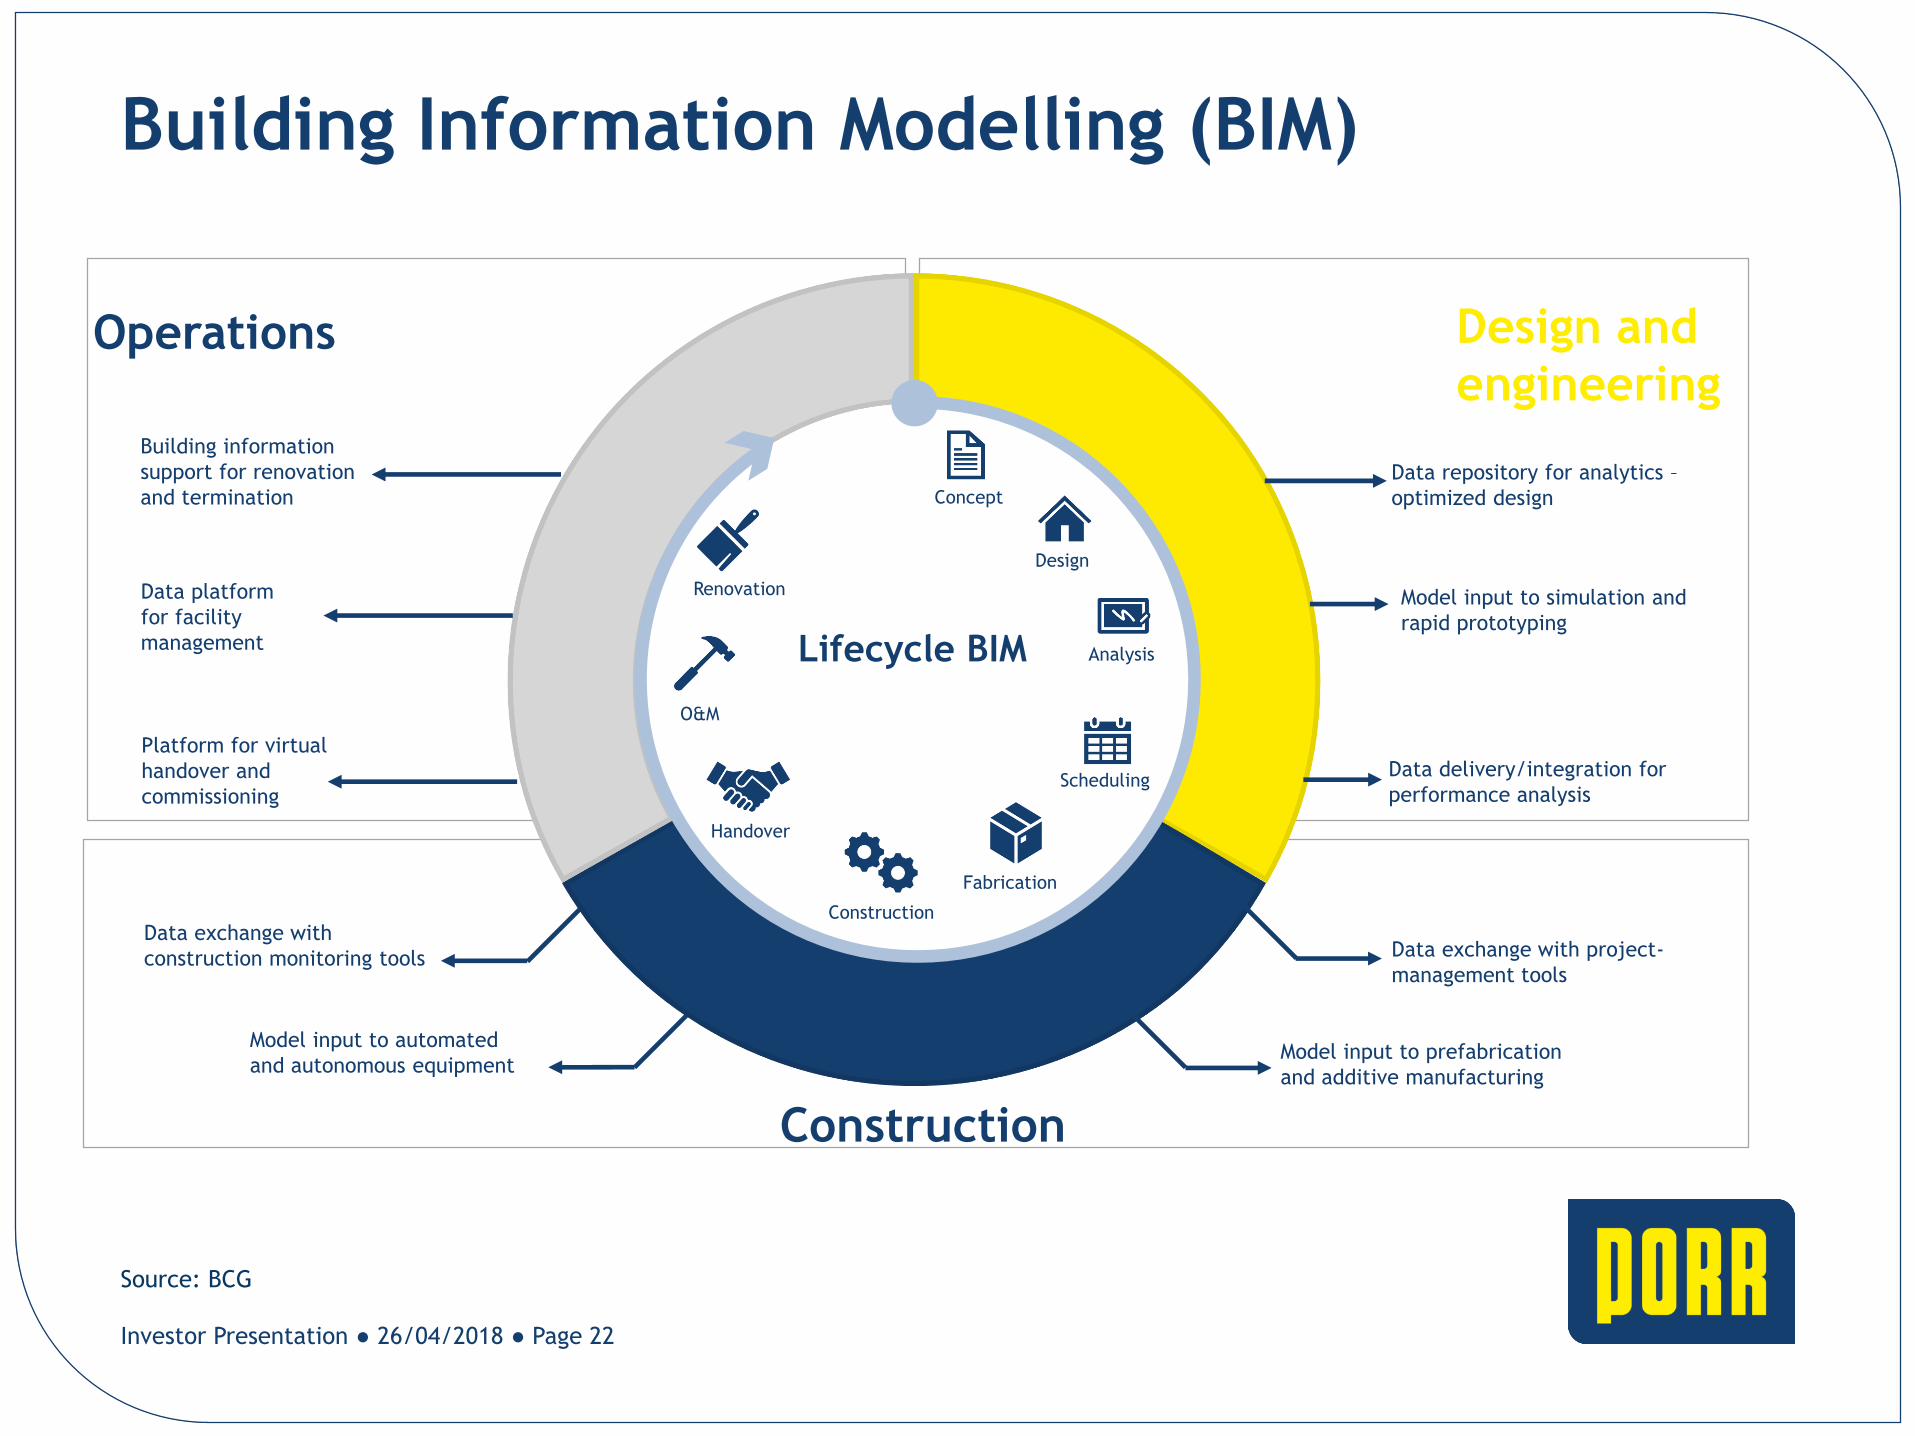
Building Information Modelling (BIM)
Construction
Investor Presentation ● 26/04/2018 ● Page 22
Handover
Construction
O&M
Lifecycle BIM
Operations Design and
engineering
Data exchange with project-
management tools
Platform for virtual
handover and
commissioning
Concept
Design
Analysis
Scheduling
Fabrication
Data platform
for facility
management
Building information
support for renovation
and termination
Renovation
Data delivery/integration for
performance analysis
Model input to simulation and
rapid prototyping
Data repository for analytics –
optimized design
Data exchange with
construction monitoring tools
Model input to automated
and autonomous equipment Model input to prefabrication
and additive manufacturing
Source: BCG

LEAN @ BMW
Investor Presentation ● 26/04/2018 ● Page 23
▪ LEAN in Design & Construction
▪ Integrated BIM Model
▪ Collaboration and Partnering
▪ Supply Chain Involvement
(off-site pre-produced material)
▪ Full Visibility (Live Track)
▪ Stability through Takt Planning
▪ Zero Claims
▪ Zero Delay
▪ Zero Days Schedule Deviation
▪ Great Team Spirit
ALIGNMENT TO. RESULTS SO FAR.

Roadmap 2020: Selected Examples
DIGITAL
TRANSFORMATION
DIGITAL
TRANSFORMATION
Digitalization of
equipment
maintenance
process
E-Invoicing to
customers with
automatic bookingE-Commerce &
Webshop
Standardised plan-/
actuals comparison
on line item level
Early scanning of
incoming invoices
and automatic initial
account assignment
Construction site ID
Centralized dunning
system
Working safety-App
(Lessons learned;
communication in
case of emergency)
E-learning tools
Reporting of non-
financial KPIs
(standard across the
group)
Investor Presentation ● 26/04/2018 ● Page 24

M&A Activities by 2017
Expertise Building Regional Expansion
Design
Construction
Operation
Preparation
Financial
Engineering
G&P
Investor Presentation ● 26/04/2018 ● Page 25
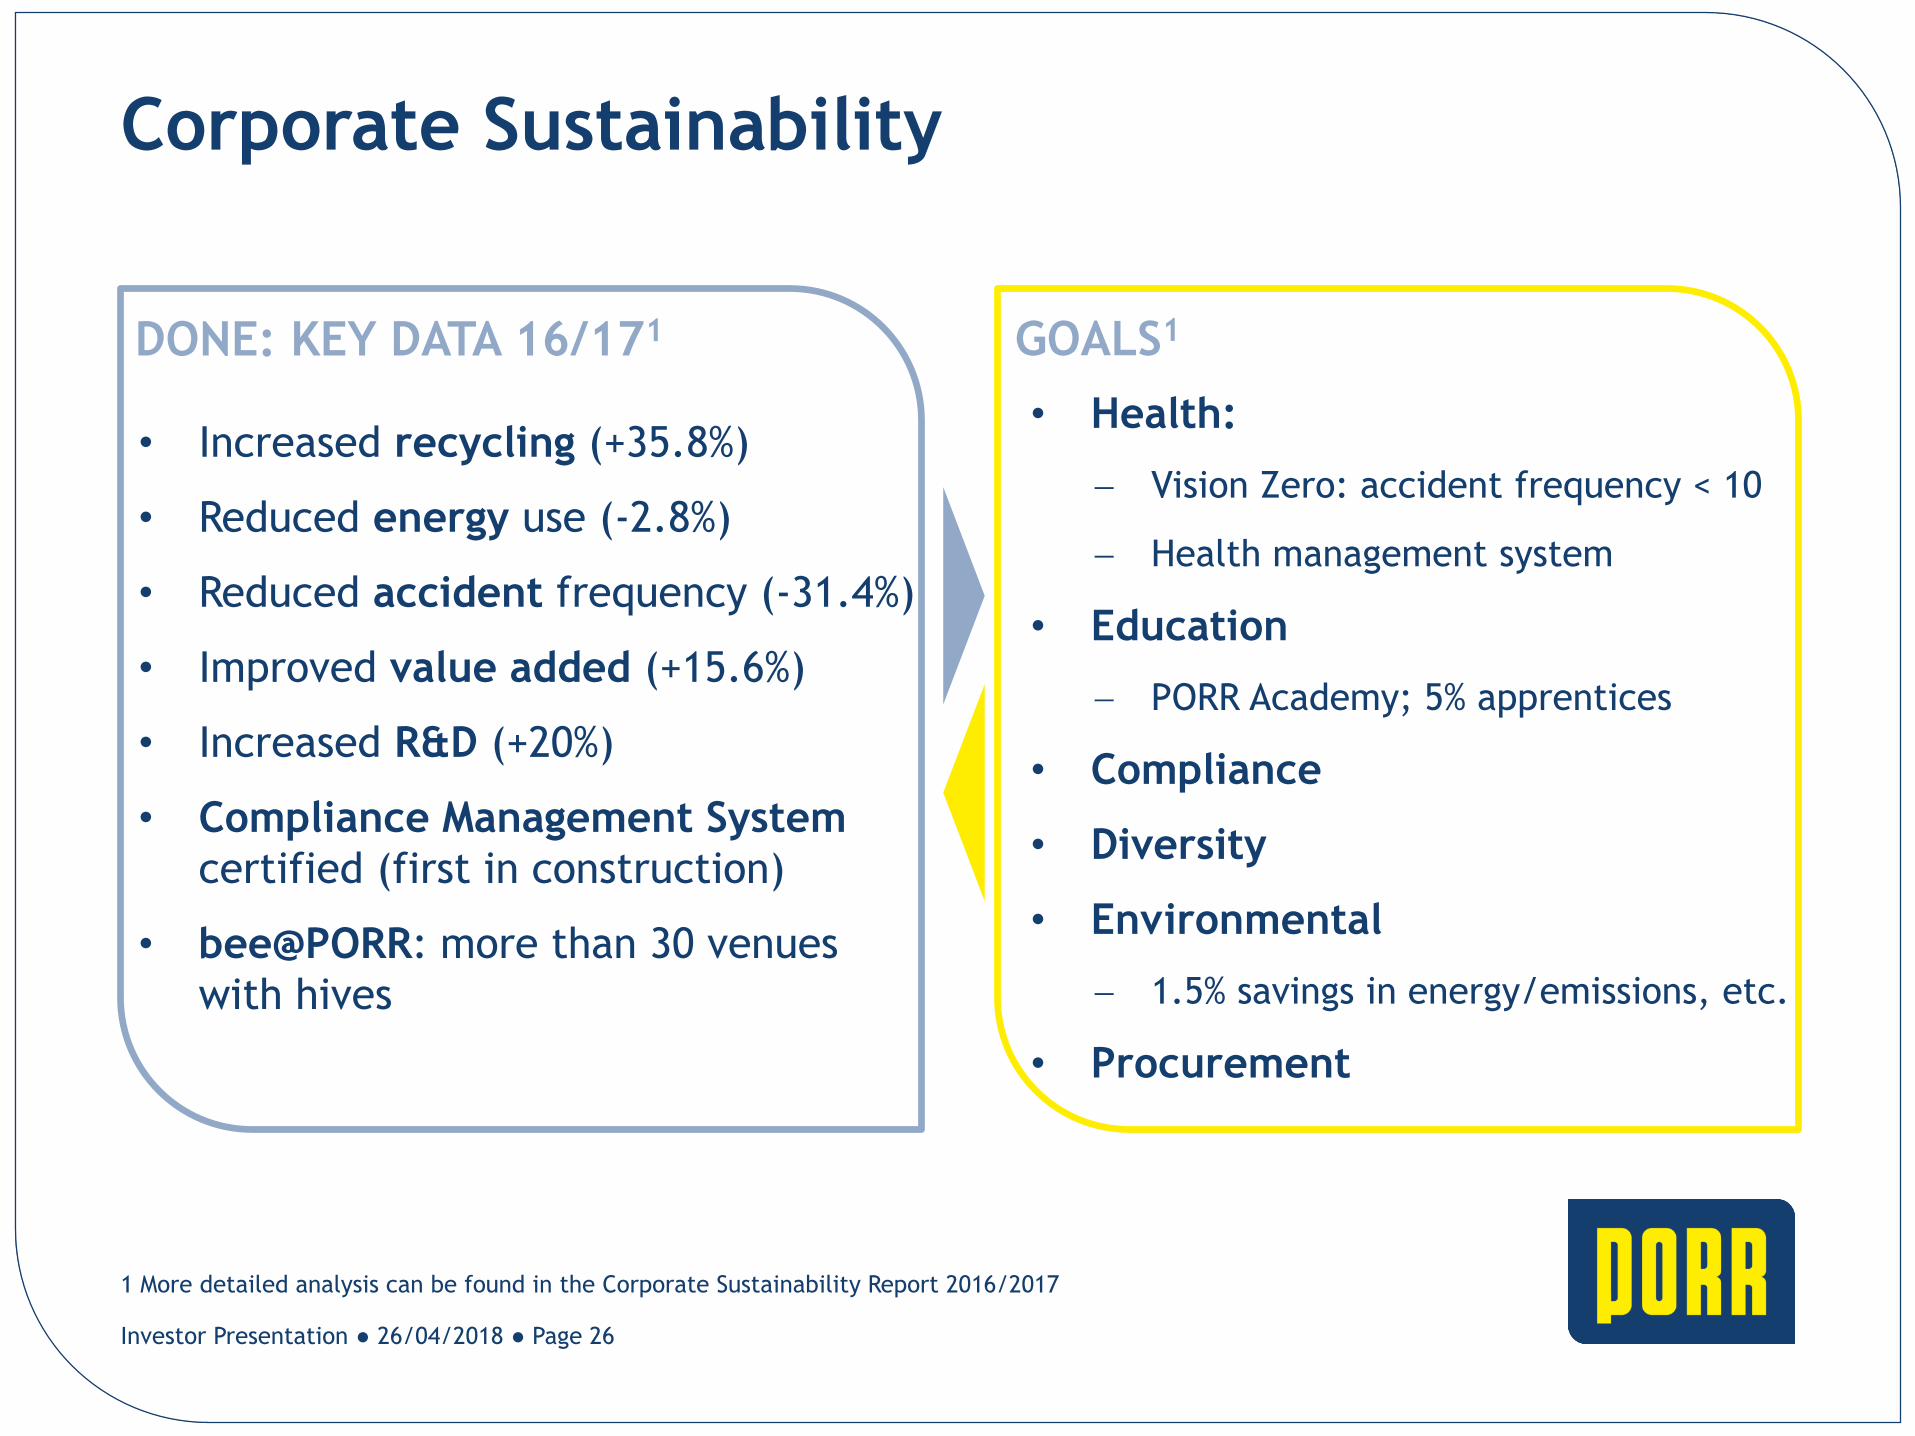
Corporate Sustainability
Investor Presentation ● 26/04/2018 ● Page 26
DONE: KEY DATA 16/171
• Increased recycling (+35.8%)
• Reduced energy use (-2.8%)
• Reduced accident frequency (-31.4%)
• Improved value added (+15.6%)
• Increased R&D (+20%)
• Compliance Management System
certified (first in construction)
• bee@PORR: more than 30 venues
with hives
1 More detailed analysis can be found in the Corporate Sustainability Report 2016/2017
• Health:
Vision Zero: accident frequency < 10
Health management system
• Education
PORR Academy; 5% apprentices
• Compliance
• Diversity
• Environmental
1.5% savings in energy/emissions, etc.
• Procurement
GOALS1

Best Place to Work @ PORR
WAR FOR TALENT
• Employees and
clients require
highly flexible
organisations
• Demographics
lead to a shortage
of skilled
employees
• Urbanisation
results in a local
concentration
of demand
OUR ANSWER: BEST PLACE TO WORK - Concept
Work&Life@PORR
• Flexible models of working hours and leave
• Nursing and health support programs
Diversity@PORR
• Women@PORR: Promotion of women
• Openness for religious, ethnical and sexual diversity
PORR Academy
• Attractive trainings for blue-and white-collar workers
• In-house education for international deployments
Investor Presentation ● 26/04/2018 ● Page 27

Shareholder Structure
46.3%1
Ownership Structure Free Float – Geographical Split
Syndicate (Strauss Group, IGO-Ortner Group) Free float
17.7%
29.0%
20.6%
6.9%
5.3%
9.5%
11.0%Austria
UK
US
Germany
France
Central and Northern Europe
Other
53.7%
1 of which 5.85% Heitkamp Construction GmbH, 4.05% Wellington Management Group LLP and 3.37% PORR
Management and PORR AG (treasury shares)
Investor Presentation ● 26/04/2018 ● Page 28
Financial Performance

Key Financials
Investor Presentation ● 26/04/2018 ● Page 30
Key Earnings Figures (EUR m)
Production output
Revenue
Net-profit
EBT
Key Assets and Financial Figures (EUR m)
Equity
Equity ratio
Net debt/Net cash ()
Total assets
Key Share Data and Staff (EUR m)
Earnings per share (in €)
Dividend per share (in €)
Market capitalization (in €m)
Number of shares (weighted average)
Staff (average)
31.12.2017
4,738.2
63.7
4,292.9
85.3
2,884.8
597.0
20.7%
147.4
2.09
1.102
810.0
29,095,000
17,719
3,925.3
66.8
3,417.1
31.12.2016
91.1
2,362.1
440.9
18.7%
(53.3)
2.23
1.10
1,132.4
29,095,000
15,328
3,523.8
61.0
3,139.7
31.12.2015
81.1
2,304.0
412.1
17.9%
(186.5)
813.2
29,095,000
2.02
1.001
13,878
1 Excl. script dividend 2 Proposal to Annual General Meeting
% ∆
20.7%
25.6%
(6.3%)
(4.7%)
35.4%
2.0 PP
(6.3%)
-
(28.5%)
15.6%
-
(>100 %)
22.1%

Consolidated Income Statement
Production output2
Revenue
Share of profit/loss of companies accounted for under
the equity method
Staff expense
Other operating result3
Depreciation, amortisation & impairment
EBITDA
- in % of Production output
EBIT
- in % of Production output
Financial result
EBT
- in % of Production output
Taxes
Profit for the period
(EUR m1)
Production output²
Cost of Materials
Purchased services
1 Rounding differences can appear, 2 Output of consortiums and all associates are included proportionally in production output which
deviates from revenues pursuant to IFRS, 3 Own work capitalised in non-current assets included
Cost of materials and other related production services
4,292.9
59.2
(909.3)
(2,034.7)
(1,036.1)
(171.3)
200.7
(110.5)
90.2
(4.9)
85.3
(21.6)
63.7
4,738.2
(2,944.0)
2016
3,417.1
46.3
(643.9)
(1,607.5)
(874.1)
(150.6)
187.3
(87.3)
100.1
(9.0)
91.1
(24.2)
66.8
3,925.3
4.8%
2.5%
2.3%
(2,251.4)
% 17/16
25.6%
7.1%
(9.8%)
(6.3%)
(4.7%)
20.7%
28.0%
41.2%
26.6%
18.5%
13.8%
26.6%
(45.5%)
(10.8%)
30.8%
4.2%
1.9%
1.8%
Investor Presentation ● 26/04/2018 ● Page 31
2017 2015
3,523.8
3,139.7
46.2
(2,060.8)
(1,409.4)
(807.6)
(151.6)
(651.4)
165.9
4.7%
(78.2)
87.8
2.5%
(6.7)
81.1
2.3%
(20,1)
61.0

Ratios:
Statement of Financial Position
(EUR m)
Ass
ets
Equit
y &
liabilit
ies
Total assets
Current assets
Non-current assets
Net debt/Net cash ()2
Equity ratio
Equity1
Non-current liabilities
Current liabilities
Total equity and liabilities
1 Incl. Non-controlling interests, 2 Bonds & SSD plus financial liabilities less cash and cash equivalents
31.12.2017
1,037.1
2,884.8
597.0
587.1
1,700.7
2,884.8
147.4
20.7%
1,847.7
801.3
2,362.1
440.9
562.7
1,358.5
2,362.1
1,560.8
(53.3)
18.7%
715.9
2,304.0
412.1
551.7
1,340.2
2,304.0
1,588.1
(186.5)
17.9%
31.12.2016 31.12.2015
Investor Presentation ● 26/04/2018 ● Page 32

Share: Share:Share: Share:
Business Units (1/2)
BU 4ENVIRONMENTAL,
HEALTHCARE & SERV.
BU 1AT/CH/CZ
BU 2GERMANY
BU 3INTERNATIONAL
Description
• PORR’s largest
business unit
• Home markets with
all services
• Residential, office,
industrial and road
construction
Regional
Focus
• PORR’s 2nd largest
market
• Home market with all
services
• Residential, office,
industrial, road
construction and
special civil
engineering (Franki,
Stump)
• PORR’s unit for
technical leadership
• Focus on project
business
• Especially tunnel
and railway
construction
• PORR’s unit for
promising niches
• Focus on project
business
• Demolition, waste
treatment, PPP,
recycling, health
care, property &
facility management
Production1
(in EUR m)2,428 741 1.308 27% 225 5%
1 Share of production output of PORR AG Holding ~1.0%
51% 16%
Investor Presentation ● 26/04/2018 ● Page 33

Business Units (2/2)
KPIs
BU 1
Investor Presentation ● 26/04/2018 ● Page 34
BU 2
BU 3
BU 4
• Market share gains / Hinteregger
• Top-line and order book growth
• EBT affected by project-shifts in general
building and a small part in Germany
• Output growth with high portion on increase
facade services
• EBT significantly increases up to EUR 6.3m
2,428
741
1,308
225
Eur m
% growth
+14%
+63%
+21%
+3%
+26%
1,499
>100%
2,561
+15%
6,7%
124
Margin 2.5%
(9.8)
26.8
Margin 2.1%
6.3
Output Backlog EBT Comments
2,097 60.1
neg.
Margin 2.8%
• Selective bidding thanks full order book
• Two large projects in Qatar and Dubai were won
• Negotiations with Qatar according 2017
increased logistic costs continue
• More than doubled with acquisitions
• Growth in Germany must be digested
• Except on general building, all other sectors
contribute positively to EBT
Remark: Excluding the share of production output of PORR AG Holding ~1.0%

Maturity Profile of PORR‘s Financial Liabilities
17 23 23 2013
47
55
11
3730
5
21
30
18
27
20
2018 2019 2020 2021 2022 from 2023
52
87
103
37
50
69
Investor Presentation ● 26/04/2018 ● Page 35
Bonds SSD floating Term loans SSD fix
1
Remark: chart excludes leasing liabilities, FX-hedge-liabilities and short term project related cash overdrafts

Net Working Capital Development
2016 2017 2016 2017 2016 2017
Inventories Trade Receivables Trade payables
74,73973,274
930,029
785,630
1,032,040
1,301,576
Investor Presentation ● 26/04/2018 ● Page 36
Net Working Capital: 2016: 217,673
2017: 344,275
6.4%
8.0%+160bps
% of sales
Main topics 2017: • Newly consolidated companies
• Growth
• Large-scale infrastructure projects
121 91
1 DIO (days inventory outstanding) 2 DSO (days sales outstanding) 3 DPO (days payable outstanding)
992 1112 1273 1283
tEUR

Country:
Value:
Schedule:
DE
EUR 243.9m
2012-2019
Country:
Value:
Schedule:
QA
EUR 943.6m
2013-2018
Country:
Value:
Schedule:
QA
EUR 201.5m
2016-2018
Country:
Value:
Schedule:
CH
EUR 152.5m
2015-2020
2019
2018
Landmark Projects
2020
Investor Presentation ● 26/04/2018 ● Page 37
Brenner Base Tunnel
Metro Green Line Doha ARGE Tunnel Albaufstieg Europaallee Zürich LotsAl Wakrah Stadium
Expressway S17 Ryki
Country:
Value:
Schedule:
PL
EUR 117.3m
2013-2018
The Icon Vienna
Country:
Value:
Schedule:
AT
EUR 37.0m
2015-2018
Country:
Value:
Schedule:
AT
EUR 966m
2018-2024
2024

Top Intakes 2017
• Railroad LK 354 Poznan-Pila/PL/112.5m
• U5 Europaviertel, Frankfurt/DE/104.4m
• Expressway D3, Cadca/SK/73.9m
• Varodd bridge, Kristiansand/NO/59.4m
• Mur Powerstation, Graz/AT/49.7m
Q1
• BMW München Freimann/DE/114.0m
• Office build. Frank. Allee/DE/69.4m
• E18 Rugtvedt-Dordal, Stathelle/NO/58.8m
• Sewage plant Oslo Bekkelaget/NO/29.1m
• Appart. Building Old Brewery/AT/24.7m
Q2 Q4
• A1 Rhine Bridge Leverkusen/DE/304.8m
• Deep Tunnel Stormwater, Dubai/AE/139.4m
• Musaimeer Pumping Station, Dubai/AE/99.8m
• S-Bahn-Tunnel Erdinger Ringschluss/DE/92.5m
• Office Build. Baloise Park, Basel/CH/86.5m
Q3
• Railroad E30 Kedzierzyn-Opole/PL/79.8m
• App. Buildg. MGC L. Böhm Street/AT/49.3m
• PPP Campus Berresgasse (School)/AT/42.5m
• Office Building Neue Spreespeicher/DE/41.0m
• SeeSee Tower-Home-Living, Vienna/AT/37.5m
Investor Presentation ● 26/04/2018 ● Page 38

IR Information for PORR AG
Share Information Financial Calendar 2018
IR Contact
For further information please contact
the Investor Relations department
T +43 (0) 50 [email protected]
Share price1 EUR 28.80
Market capitalisation EUR 832.1m
Official market Vienna Stock Exchange
Prime Market
Number of shares 29,095,000
outstanding
Ticker symbol POS VI
ISIN AT0000609607
Research Reports
Berenberg Bank
Erste Group
Hauck & Aufhäuser
Kepler Cheuvreux
Raiffeisen Centrobank
SRC Research Buy
1 as of April 24, 2018
26.04.2018 Annual Financial Report 2017
26.04.2018 Press conference
28.05.2018 Q1 2018
29.05.2018 138th Annual General Meeting
05.06.2018 Trade ex-dividend
07.06.2018 Dividend payment (FY 2017)
29.08.2018 H1 2018
29.11.2018 Q3 2018
Hold
Hold
Buy
Hold
Hold
Buy
Investor Presentation ● 26/04/2018 ● Page 39