Update – Performance of C595 / M 240 Type IL Portland ... · Wayne Wilson – Holcim (US) Inc....
24
Strength. Performance. Passion. Update – Performance of C595 / M 240 Type IL Portland-Limestone Cement NCC Spring 2013 April 2, 2013 Tim Cost, PE, FACI
Transcript of Update – Performance of C595 / M 240 Type IL Portland ... · Wayne Wilson – Holcim (US) Inc....

Strength. Performance. Passion.
Update – Performance of C595 / M 240 Type IL Portland-Limestone Cement
NCC Spring 2013 April 2, 2013
Tim Cost, PE, FACI

Update – Performance of Type IL PLC 4-2-13 © 2013 Holcim (US) Inc
Update – Performance of C595 / M 240 Type IL PLC
• Last year, spring 2012 – Oklahoma City meeting PLC Synergies that Enhance Concrete Performance
• This update: Review, PLC background & performance trends Concrete testing program in Georgia using PLC &
OPC samples provided by 5 different companies Evaluation of project data & performance trends Research underway on PLC synergies at MSU
2

Update – Performance of Type IL PLC 4-2-13 © 2013 Holcim (US) Inc
Portland-limestone cement (PLC): what is it?
• Slightly modified version of portland cement Contains up to 15% finely ground, raw limestone Improves the environmental footprint of concrete without
increasing cost or detracting from performance Now available throughout the US Can be made at any portland cement manufacturing plant
• Relatively new in the US but significant history elsewhere• Supplied under ASTM C1157 in the US for several years• Now included in blended cement specifications (ASTM
C595-12 and AASHTO M 240-12, Type IL) 5% to 15% limestone
Review
3

Update – Performance of Type IL PLC 4-2-13 © 2013 Holcim (US) Inc
How is PLC made, and what’s different about it?
• Crushed limestone is fed to the mill with the clinker and gypsum• The limestone is more easily ground than the harder clinker and
becomes concentrated in the finest particles• Overall fineness must be higher (for equivalent performance)
Production rate is slowed Additional grinding energy used is more than offset by energy savings
associated with lower clinker content• Particle size distribution is enhanced• Hydration is enhanced by both physical and chemical interaction;
greater overall cementitious efficiency is possible• Sustainability benefits are significant via reduced associated carbon
emissions and embodied energy (less clinker)
Review
4

Update – Performance of Type IL PLC 4-2-13 © 2013 Holcim (US) Inc
Reported performance of PLC – literature reviewReview
5
Favorable SCM interaction Similar response to admixtures No differences in management of air Similar water demand, slump loss Excellent finishing properties Similar strength development Similar setting performance Similar shrinkage, heat of hydration, and durability attributes Some beneficial synergies of both strength and setting are possible
in combination with SCM’s, heavily influenced by fineness and PSD
• Generally equivalent to OPC in identical concrete mixtures, when PLC Blaine is ± 100 m2/kg higher
• Performance trends:

Update – Performance of Type IL PLC 4-2-13 © 2013 Holcim (US) Inc
Conclusions, PLC “synergies” study presented last year
• Plant-produced PLC (ground in a ball mill) had more enhanced PSD and synergy with SCM’s than any simulations using separate components
• This synergy potential clearly improved as fineness of PLC grinds increased, resulting in: Increasing strength benefits with SCM’s, especially
Class C fly ash Decreasing SCM set retardation effects
Review
6

Update – Performance of Type IL PLC 4-2-13 © 2013 Holcim (US) Inc
Typical PSD’s and fineness differentials (PLC vs. OPC) that seem to influence enhanced PLC synergy with SCM’s
7

Update – Performance of Type IL PLC 4-2-13 © 2013 Holcim (US) Inc
PLC vs. OPC concrete testing program in Georgia
• 6 cement companies participating, samples provided by 5: Argos, Buzzi Unicem, Cemex, Holcim, Lehigh, National 2 cement samples, each plant: Type I or II OPC and Type IL PLC No special requirements; PLC as per C595/M240 Type IL
− No direction suggested for PLC production targets All testing done at Heidelberg Technology Center, Atlanta
• Four concrete mixtures made with each cement sample: 100% cement, 25% C ash, 25% F ash, 40% slag cement All mixes: 611 lb/cy total cementitious, water content adjusted for
constant slump (4” to 5”), 4 fl oz/cwt Type A WR, 2.5 fl oz/yd AEA Actual slumps 3.75” to 5.25” (avg ± 4.5”), w/cm ≈ 0.46 – 0.51 Air contents were variable, 1.5% to 5.5% (2 outliers higher), fly
ash mixes generally 2% to 3% lower, slag mixes slightly lower than straight cement
Presented strength data normalized for 4% air content, using factor of 5.5% Δ psi / 1% Δ air content; no slump normalization
ASTM C1202 (RCP) and C157 (shrinkage) on some mixes8

Update – Performance of Type IL PLC 4-2-13 © 2013 Holcim (US) Inc
PLC vs. OPC sample characteristics
9
• OPC’s all normal production samples
• Similar clinker used for PLC’s• Broad range of PLC limestone
contents (6% to 16%)• Range of PLC fineness• Range of limestone purity
(% CaCO3), 76% to 98%• Range of PLC-OPC fineness
differentialOPC and PLC % limestone and
Blaine fineness by cement source

Update – Performance of Type IL PLC 4-2-13 © 2013 Holcim (US) Inc
PSD’s of cements from each source
10

Update – Performance of Type IL PLC 4-2-13 © 2013 Holcim (US) Inc
PSD’s of cements from each source
11
Δ = 4.26 µm
Δ = 3.44 µm
Δ = 1.10 µm
Δ = 0.86 µm
Δ = 0.27 µm
PLC = 16% LSOPC = 4.6% LS
PLC = 11.6% LSOPC = 3.7% LS
PLC = 12.6% LSOPC = 1.1% LS
PLC = 10.2% LSOPC = 3.4% LS
PLC = 6.2% LSOPC = 2.7% LS

Update – Performance of Type IL PLC 4-2-13 © 2013 Holcim (US) Inc
Concrete data – normalized strength and set, each mixture
No SCM mixtures
25% Class C fly ash mixtures
A B C D E
A B C D E
25% Class F fly ash mixtures
40% slag cement mixtures
A B C D E
A B C D E
Nor
mal
ized
Com
pres
sive
Str
engt
h, M
Pa
Initi
al S
et, H
ours
Nor
mal
ized
Com
pres
sive
Str
engt
h, M
Pa
Initi
al S
et, H
ours
12

Update – Performance of Type IL PLC 4-2-13 © 2013 Holcim (US) Inc
Concrete data – normalized strength averages, each category
13

Update – Performance of Type IL PLC 4-2-13 © 2013 Holcim (US) Inc
Permeability and shrinkage testing – selected mixtures
14
ASTM C1202 chloride ion penetration at 56 days(one mix type from each source)
ASTM C157 (modified) length change at 28 days(all mixes from each of sources A, C, E)
16% limestone
6% limestone

Update – Performance of Type IL PLC 4-2-13 © 2013 Holcim (US) Inc
Data observations
• PLC’s performed almost identically to OPC’s Even though PLC limestone content ranged from
6.2% to 16% and other properties varied Equivalent in each mixture category
• No performance trends suggest that usage distinctions (PLC vs. OPC) are needed
• Variability of performance was much greater as influenced by cement source or by mixture category than as influenced by cement type (PLC vs. OPC)
15
Update – Performance of Type IL PLC 4-2-13 © 2013 Holcim (US) Inc
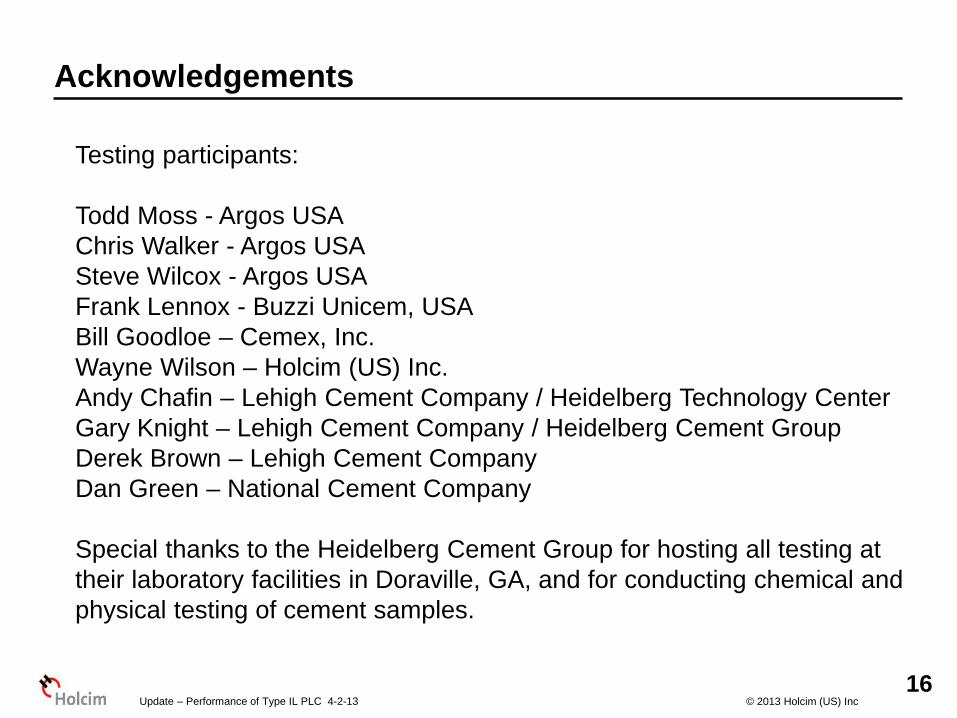
Acknowledgements
Testing participants:
Todd Moss - Argos USAChris Walker - Argos USASteve Wilcox - Argos USAFrank Lennox - Buzzi Unicem, USABill Goodloe – Cemex, Inc.Wayne Wilson – Holcim (US) Inc.Andy Chafin – Lehigh Cement Company / Heidelberg Technology CenterGary Knight – Lehigh Cement Company / Heidelberg Cement GroupDerek Brown – Lehigh Cement CompanyDan Green – National Cement Company
Special thanks to the Heidelberg Cement Group for hosting all testing at their laboratory facilities in Doraville, GA, and for conducting chemical and physical testing of cement samples.
16

Update – Performance of Type IL PLC 4-2-13 © 2013 Holcim (US) Inc
Research project: Mississippi State University
• Study of PLC synergies and how they can be optimized, including use / production guidance
• PhD dissertation• Lab study with considerable bench testing and concrete
5 cement companies furnishing cements and limestone 3 SCM categories
• Full-scale construction project(s), mixture development support and performance monitoring
17

Update – Performance of Type IL PLC 4-2-13 © 2013 Holcim (US) Inc
Concrete strength equality plots – early Holcim data
18
25% C ash 25% F ash
No SCM
• Concrete mixtures made with multiple samples of OPC and PLC from two sources, over 4 years
• PLC: avg. ± 8% limestone, 520 Blaine• OPC: avg. ± 1.5% limestone, 380 Blaine• Strength synergies evident with SCM’s,
especially Class C fly ash

Update – Performance of Type IL PLC 4-2-13 © 2013 Holcim (US) Inc
On-campus construction project with PLC: Davis-Wade Stadium
• $75 million expansion and renovation
• Increase capacity by 11.5% to 61,337
• Various improvements• ± 35,000 cy concrete• Considerable interest in
sustainable attributes of materials
• Most structural concrete made with PLC and 50% replacement (ternary) mixtures using both slag and Class C fly ash
• CEE project support19
quaternary?

Update – Performance of Type IL PLC 4-2-13 © 2013 Holcim (US) Inc
On-campus construction project with PLC: Davis-Wade Stadium
20

Update – Performance of Type IL PLC 4-2-13 © 2013 Holcim (US) Inc
MSU Davis-Wade Stadium mixtures
• Most structural concrete 50% replacement ternary mixtures using PLC (50/30/20)
• Data shown from 540 pcy mixtures, non-AE
0
1000
2000
3000
4000
5000
6000
7000
Type I/II PLC "1" PLC "2" Type I/II PLC "1" PLC "2" Type I/II PLC "1" PLC "2"
Com
pres
ive
Stre
ngth
(psi
)
7 Day
14 Day
28 Day
21
quaternary

Update – Performance of Type IL PLC 4-2-13 © 2013 Holcim (US) Inc
Mixture equivalency: 0% vs. 50% SCM’s comparison
0% SCM’s
50% SCM’s
• Equivalency plots for 540 pcy mixtures, no AE, 0% SCM’s vs. 50/30/20
• Blaines: OPC = 390 PLC1 = 500 PLC2 = 550
• Compressive strengths through 28 days
22

Update – Performance of Type IL PLC 4-2-13 © 2013 Holcim (US) Inc
Summary / conclusions / recommendations
• PLC’s can be used seamlessly as a substitution for OPC’s in mix designs typical of those used for transportation structures and similar applications, without operational distinctions or differences in performance.
• Equivalent performance (PLC vs. OPC) is possible for a broad range of cement characteristics and limestone contents, within specification limits.
• The hydration synergies contributed by limestone help explain equivalent performance and it may be possible to extend related performance benefits with increased fineness, especially in combination with SCM’s.
• These hydration synergies become more robust as fineness increases and can effect higher total cementitious efficiency in concrete, relative to OPC.
• Opportunities for research: increased understanding of PLC synergies and how they can best be optimized (PLC properties and use guidance).
23

Update – Performance of Type IL PLC 4-2-13 © 2013 Holcim (US) Inc
Questions?
24
Tim Cost, PE, [email protected]
Spring 2013 NCCUpdate – Performance of C595 / M 240 Type IL PLC