Up-Scaling of SMAPVEX16 Soil Moisture Field Data - SMAP ... · Thiessen Polygon • Thiessen...
33
Up-Scaling of SMAPVEX16 Soil Moisture Field Data - SMAP Cal/Val Workshop Amherst MA Matthew Friesen, Jarrett Powers, Heather McNairn, Anna Pacheco, Hassan Bhuiyan AAFC Science & Technology Branch Winnipeg, MB June 20, 2017
Transcript of Up-Scaling of SMAPVEX16 Soil Moisture Field Data - SMAP ... · Thiessen Polygon • Thiessen...

Up-Scaling of SMAPVEX16
Soil Moisture Field Data -
SMAP Cal/Val Workshop
Amherst MA
Matthew Friesen, Jarrett Powers, Heather McNairn,
Anna Pacheco, Hassan Bhuiyan
AAFC Science & Technology Branch
Winnipeg, MB
June 20, 2017
SMAPVEX16-MB Field Campaign
• Canada conducted a 2016 field study with NASA (SMAPVEX16-MB)
to improve soil moisture retrievals from the satellite and examine new
approaches to compensate for the loss of the SMAP radar.
• The campaign follows the highly successful pre-launch field campaign
(SMAPVEX12) conducted in MB in 2012 and an earlier campaign
(CANEX10) in SK in 2010. A smaller freeze-thaw campaign was
conducted in MB in 2015.
• The 2016 study was located in the same area as AAFC’s soil moisture
network. The network is a core validation site for NASA for the
duration of the SMAP mission.
• AAFC, Environment Canada, University of MB/Guelph/Sherbrooke/MB
Ag conducted the field component of the 2016 campaign. NASA
contributed airborne sensors.
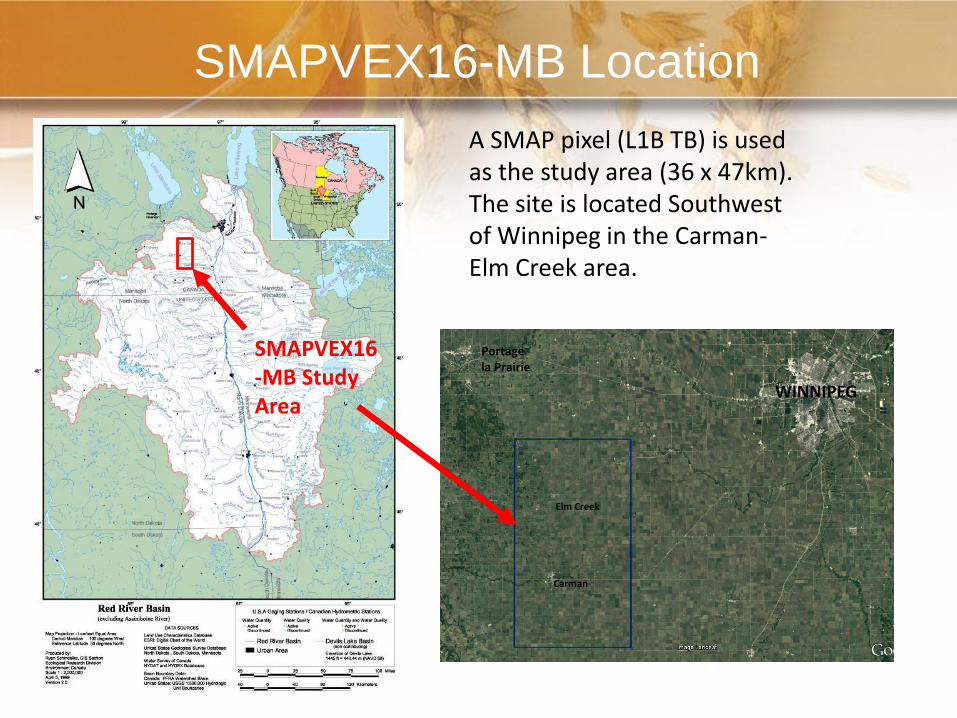
SMAPVEX16-MB Location
SMAPVEX16-MB Study Area
WINNIPEG
Portagela Prairie
Carman
Elm Creek
A SMAP pixel (L1B TB) is used as the study area (36 x 47km). The site is located Southwest of Winnipeg in the Carman-Elm Creek area.

SMAPVEX16-MB Annual Crops
A total of 50 fields were selected for sampling. 21 fields from the SMAPVEX12 were used for the 2016 campaign.
MB Crop Insurance and AAFC Annual Crop Inventory (derived from satellite imagery) was analyzed to look at cropping trends in the study area.
Soybeans, wheat and canola accounted approximately 70% of crops grown in the study area (2 and 5 year average). Other crops include corn, oats, field beans and forages.
Fields were selected based on the dominant crops represented within the study area.

SMAPVEX16-MB Soils
Soil surface textures within the SMAPstudy area. Data is from the 1:20k Canada-Manitoba Soil Survey Report D60.
Clay and Fine Loamy soils account for approximately 76.5% of the study area.
Coarse Loamy and Sand soils account for 23.5% of the study area.
Fields were selected based on soil surface texture representation within the study area.
SMAPVEX16-MB Objectives
1. Investigate anomalous retrievals (under-estimation of soil
moisture values/rapid dry-downs following a precipitation
event) from the SMAP satellite. This is a common
occurrence on agricultural core-validation sites with annual
crop production.
2. Improve up-scaling processes for core-validation sites.
Data collected from the campaign will be useful in
determining if the methods AAFC has developed to up-
scale soil moisture data for SMAP are valid.
3. Develop and evaluate down-scaling approaches that utilize
SMAP radiometer data given the loss of the radar. These
include the use of other active radar sensors.
4. Deploy ground-based instruments (radiometer and
scatterometer) to better understand soil moisture and
vegetative contribution to microwave responses.

AAFC RISMA InstrumentationThe MB Real-time In-situ Soil Monitoring for Agriculture (RISMA ) network has 9 permanent soil moisture stations located in the Carman-Elm Ck. The stations support AAFC remote sensing, soil sensorresearch and are a core validation site for the SMAP mission.• 3 Soil moisture probes at surface
(vertical) • 3 Probes at 5 cm, 20cm, 50cm and
100 cm• Probes are 50-100 feet from field
edge• Tipping bucket rain gauge, air temp,
relative humidity, solar radiation (2014)
• Data is transmitted hourly via cell modem
• Site-specific calibrations were developed to convert RDCs to volumetric soil moisture values
RISMA 7 south of Elm Creek, MB
Soil profile prior to install
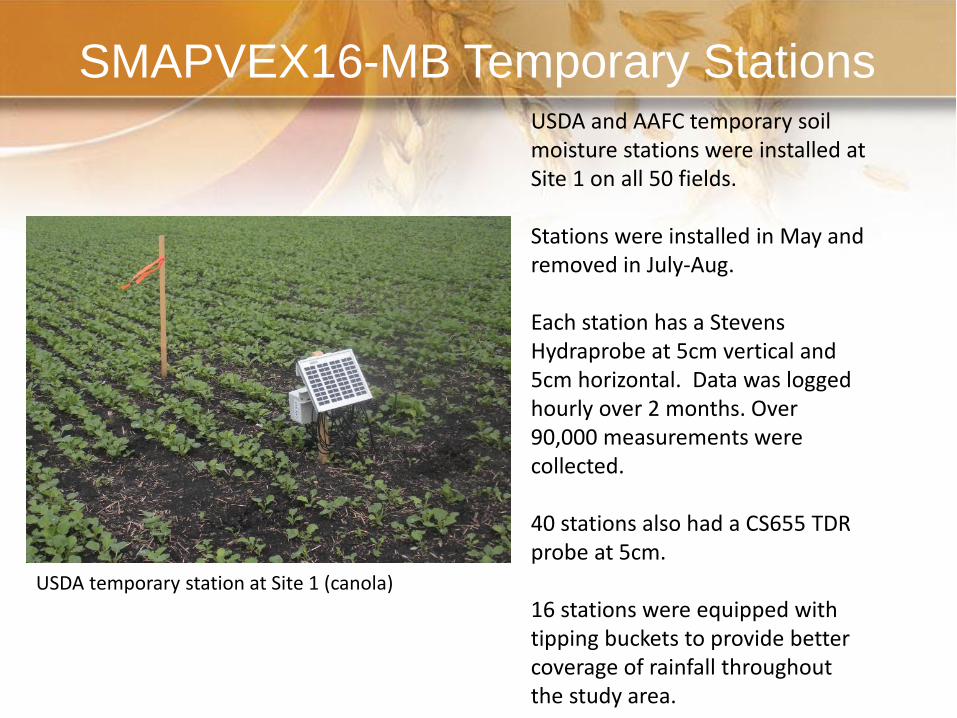
SMAPVEX16-MB Temporary StationsUSDA and AAFC temporary soil moisture stations were installed at Site 1 on all 50 fields.
Stations were installed in May and removed in July-Aug.
Each station has a Stevens Hydraprobe at 5cm vertical and 5cm horizontal. Data was logged hourly over 2 months. Over 90,000 measurements were collected.
40 stations also had a CS655 TDR probe at 5cm.
16 stations were equipped with tipping buckets to provide better coverage of rainfall throughout the study area.
USDA temporary station at Site 1 (canola)
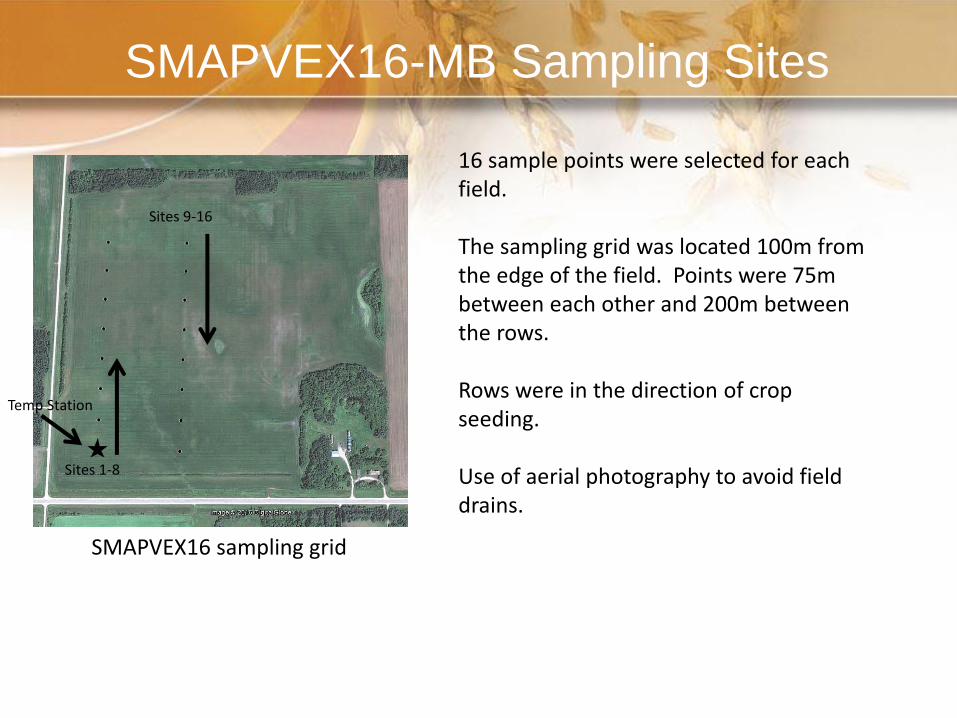
SMAPVEX16-MB Sampling Sites
16 sample points were selected for each field.
The sampling grid was located 100m from the edge of the field. Points were 75m between each other and 200m between the rows.
Rows were in the direction of crop seeding.
Use of aerial photography to avoid field drains.
Sites 1-8
Sites 9-16
SMAPVEX16 sampling grid
Temp Station

SMAPVEX16-MB Soil Moisture SamplingStevens POGOs were used to measure Real Dielectric Values (RDC) at all 16 locations in each of the fields.
3 measurements/site (48 readings per field) were made each sampling day. Approximately 30,000 measurements over the campaign
Core samples and 3 readings were taken at Site 1 and at one other rotating site. Core samples were used to develop site-specific calibrations for the POGO and temp station data.POGO calibration sampling in corn
SMAPVEX16-MB Soil Moisture Sampling
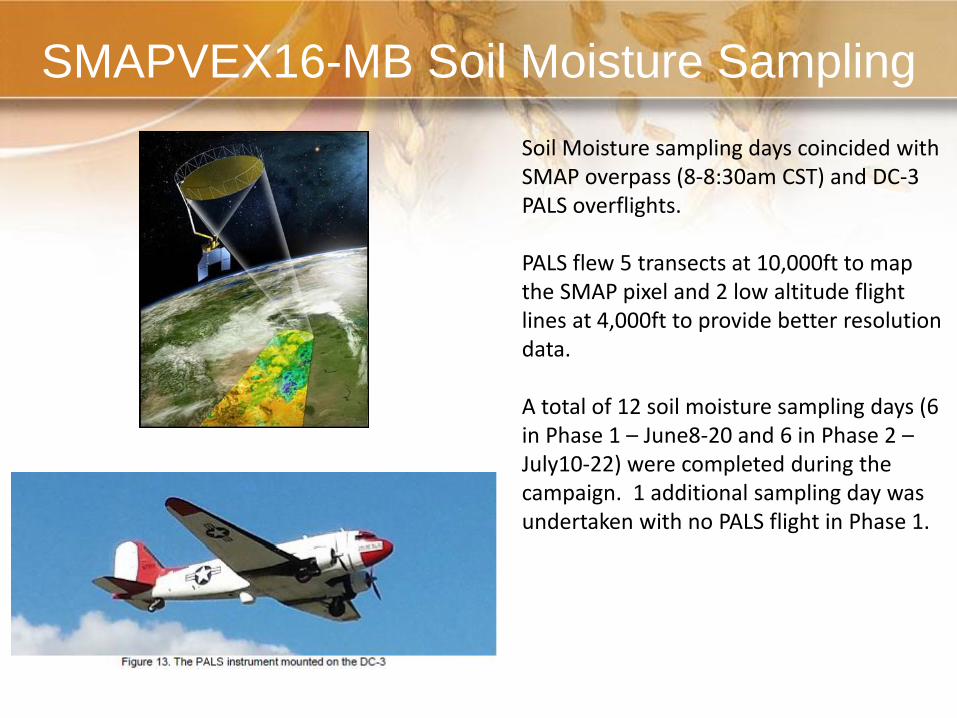
Soil Moisture sampling days coincided with SMAP overpass (8-8:30am CST) and DC-3 PALS overflights.
PALS flew 5 transects at 10,000ft to map the SMAP pixel and 2 low altitude flight lines at 4,000ft to provide better resolution data.
A total of 12 soil moisture sampling days (6 in Phase 1 – June8-20 and 6 in Phase 2 –July10-22) were completed during the campaign. 1 additional sampling day was undertaken with no PALS flight in Phase 1.
Up-Scaling Analysis
1) Use field data collected during soil moisture sampling days (handheld
sensor data) to validate temporary station data.
2) Utilize temporary station surface soil moisture data that was collected
from SMAPVEX16 study fields and compare to data collected from
the AAFC permanent stations (RISMA) network.
3) Investigate different up-scaling methods (arithmetic average, soil-
weighted, Thiessen polygon).
4) Compare results to SMOS and SMAP (L3_SM_P_E) to upscaling
methods that use SMAPVEX16 study fields and RISMA data.

POGO Field Data and Temporary Station
Handheld (POGO) soil moisture data that was collected at the 16 field sites was compared to soil moisture data collected from the vertical 5cm hydraprobe that was installed at Site 1.
POGO data from 45 of the 50 SMAPVEX16 study fields that fell within the new L3_SM_P_E pixel were used for the comparison. A mean soil moisture value was calculated from the 16 field sites (3 readings per site—48 readings in total).
Vertical 0-5cm hydraprobe values that were recorded at 8 and 9am (CDT) were extracted and averaged. This was done to coincide with the SMAP and PALS overpass.
POGO Field Data and Temporary Station• Given that fields were selected to contain uniform surface soil textures/crops and
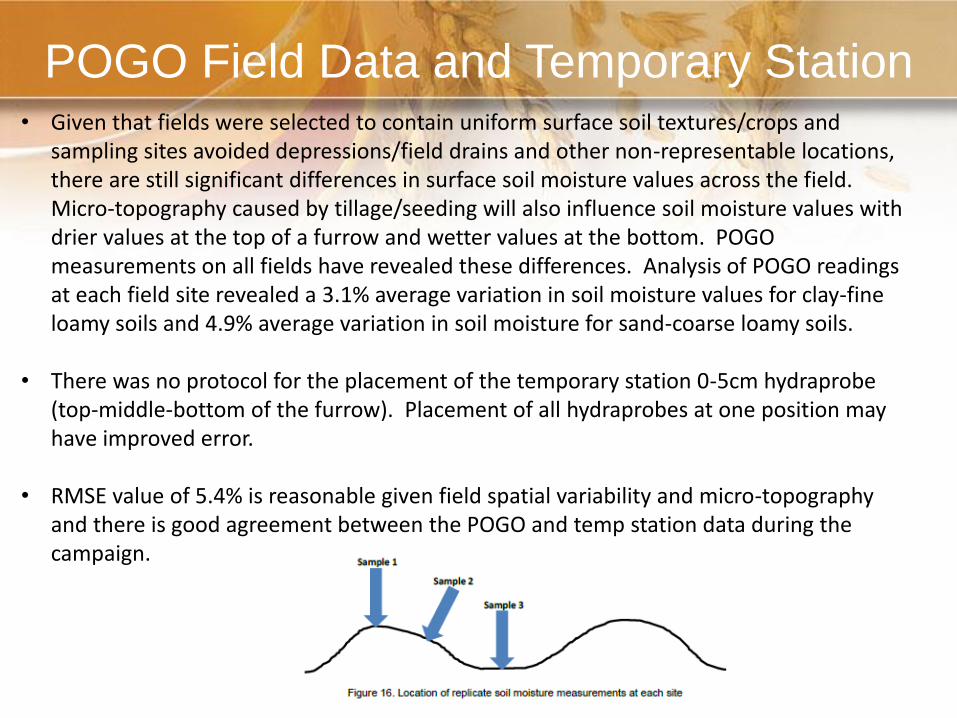
sampling sites avoided depressions/field drains and other non-representable locations, there are still significant differences in surface soil moisture values across the field. Micro-topography caused by tillage/seeding will also influence soil moisture values with drier values at the top of a furrow and wetter values at the bottom. POGO measurements on all fields have revealed these differences. Analysis of POGO readings at each field site revealed a 3.1% average variation in soil moisture values for clay-fine loamy soils and 4.9% average variation in soil moisture for sand-coarse loamy soils.
• There was no protocol for the placement of the temporary station 0-5cm hydraprobe(top-middle-bottom of the furrow). Placement of all hydraprobes at one position may have improved error.
• RMSE value of 5.4% is reasonable given field spatial variability and micro-topography and there is good agreement between the POGO and temp station data during the campaign.

RISMA – Temp Station Comparison
RISMA station data was downloaded for the same period (June-July) and the 0-5cm hydraprobe data was extracted.
Only 7 of the 9 RISMA stations were used. Station 4 was shutdown in May due to multiple probe failures at various depths. Station 7 had incomplete data June-July due to power issues.
5 stations have Clay-Fine Loamy surface texture (Stations 2, 3, 5, 6, 8).
2 stations have Coarse Loamy-Sand surface texture (Stations 1, 9).
Both RISMA and Temp station data were processed using different upscaling approaches and results were compared.
Arithmetic Average
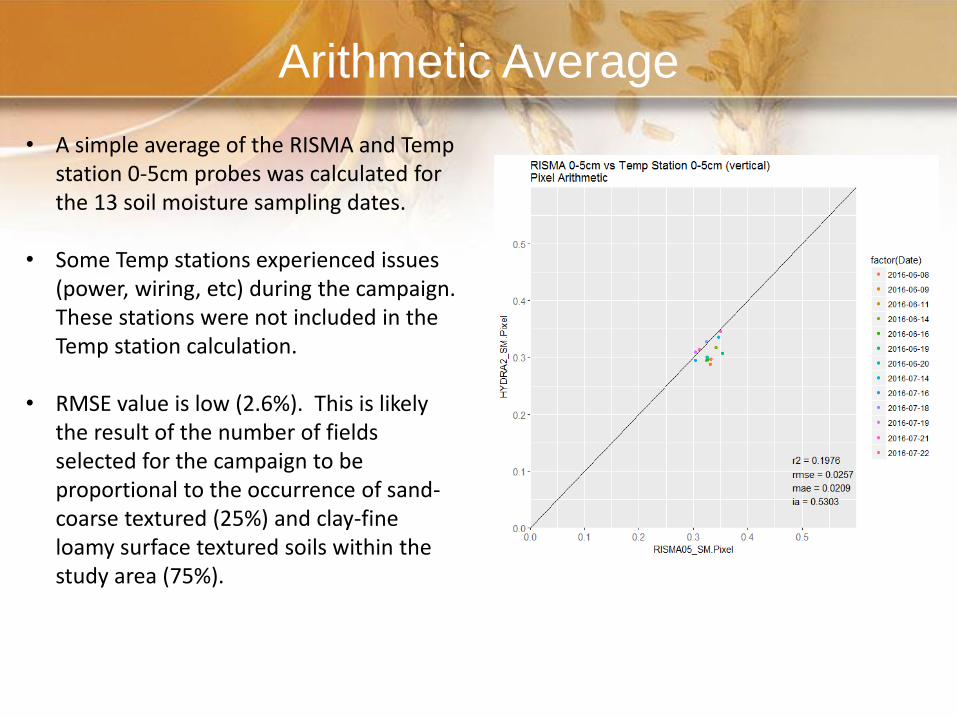
• A simple average of the RISMA and Temp station 0-5cm probes was calculated for the 13 soil moisture sampling dates.
• Some Temp stations experienced issues (power, wiring, etc) during the campaign. These stations were not included in the Temp station calculation.
• RMSE value is low (2.6%). This is likely the result of the number of fields selected for the campaign to be proportional to the occurrence of sand-coarse textured (25%) and clay-fine loamy surface textured soils within the study area (75%).

Thiessen Polygon
• Thiessen polygons were created from the locations of the RISMA and Temp stations. Area-weighted values were used to calculate a soil moisture value for the 0-5cm probes. Values were calculated for the 13 soil moisture sampling dates.
• Some Temp stations experienced issues (power, wiring, etc) during the campaign. These values were replaced with POGO data that was collected from Site 1.
• RMSE value is low (3.2%) but slightly higher than the arithmetic average.

Soil-Weighted Thiessen Polygon• Thiessen polygons were created from the
locations of the RISMA and Temp stations. The polygons were further partitioned by the soil texture map separating clay-fine loamy soils and sand-coarse loamy soils. Area-weighted values were used to calculate a soil moisture value for the 0-5cm probes. These values were calculated for the 13 soil moisture sampling dates.
• Some Temp stations experienced issues (power, wiring, etc) during the campaign. These values were replaced with POGO data that was collected from Site 1.
• RMSE value is (2.5%), slightly lower than using the Thiessen polygon approach.

Soil-WeightedUsing the soil texture map, a 65% weighting was applied to soil moisture measurements from sites on clay-fine loamy soils and a 35% weighting was applied to sites on sand-coarse loamy soils. The weightings were used to calculate a soil moisture value for the 0-5cm probes. This is the approach that is currently used for validation of SMAP data from the Carman CVS (5cm probes only).
Some Temp stations experienced issues (power, wiring, etc) during the campaign. These stations were not included in the Temp station calculation.
RMSE value is (2.5%), identical to the Soil Weighted Thiessen polygon approach.
65%
35%
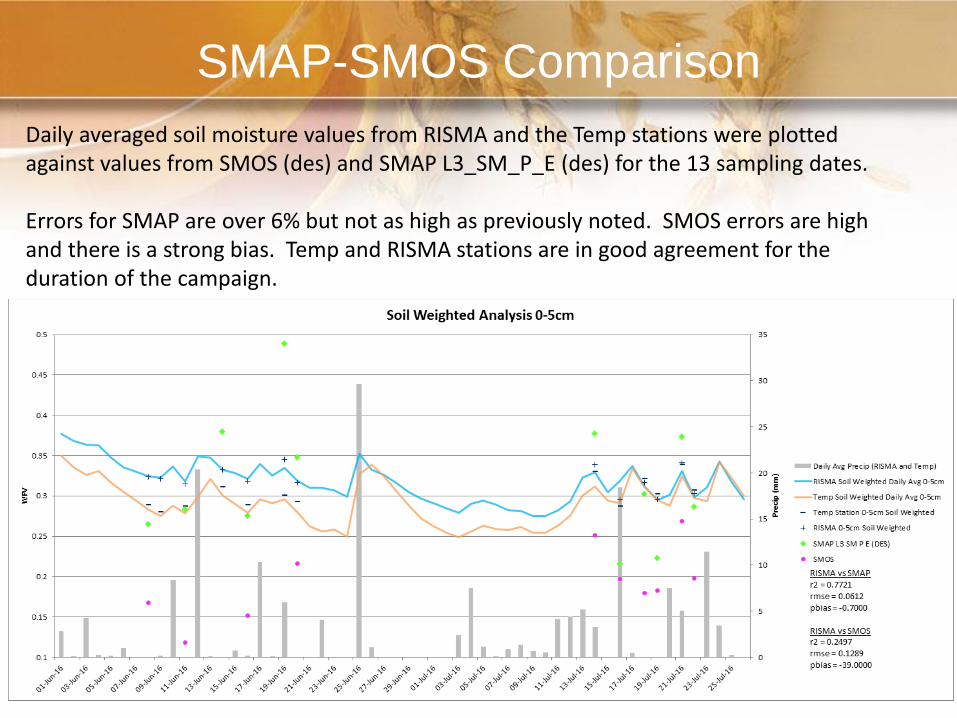
SMAP-SMOS Comparison
Daily averaged soil moisture values from RISMA and the Temp stations were plotted against values from SMOS (des) and SMAP L3_SM_P_E (des) for the 13 sampling dates.
Errors for SMAP are over 6% but not as high as previously noted. SMOS errors are highand there is a strong bias. Temp and RISMA stations are in good agreement for the duration of the campaign.

Discussion
• Analysis of the different upscaling approaches using data from AAFC’s RISMA stations show no significant differences in comparison to the SMAPVEX16 temp stations. There was a small reduction in error when a soil-weighted approach was used for up-scaling.
• Overall, the 7 RISMA stations were in good agreement when compared to soil moisture values from the 45 temp stations…….2.5-3.2% RMSE depending on up-scaling method.
• SMAP L3_SM_P_E retrievals do not agree as well with the RISMA network (rapid drydowns and underestimated soil moisture values). Although RMSE values are less than previous years (10% or more).
• SMOS errors are higher and all underestimated. SMOS footprint may be shifted further west into the coarser-textured soils?
• Lack of dynamic range (soils were mostly wet for both phases of the campaign) in soil moisture. Expect better agreement between in-situ measurements and satellite retrievals.
Comparing VWC from SMAP vs SMAPVEX16-
MB
• The vegetation water content retrievals from SMAP were compared to those calculated from the field data during the SMAPVEX16-MB field campaign.
• SMAP accounts for its vegetation contribution by computing the vegetation optical thickness, which is derived from the vegetation water content (VWC). The VWC is estimated from NDVI climatology, which is created from a 10-year average of normalized difference vegetation index values from MODIS.
• To compare the SMAP VWC with the field VWC, this study will use the crop biomass data collected during SMAPVEX16-MB.
• The general methodology includes:• Deriving temporal crop VWC from the SMAPVEX16-MB ground data.• Estimating average VWC for the SMAPVEX16-MB pixel by using AAFC’s 2016 annual
crop inventory and filling data gaps with SMAPVEX12-MB data.• Extracting 2016 temporal VWC from the SMAP L3 product and scaling to the
SMAPVEX16-MB pixel.• Comparing the 2016 temporal VWC from the SMAPVEX16-MB with the SMAP L3
VWC.

Comparing SMAP and Field VWC - Methodology

Deriving Crop VWC from SMAPVEX16-MB
• Destructive crop biomass samples were collected throughout the SMAPVEX16-MB field campaign. For wide-spaced row crops such as corn, soybeans or black beans, five plants per row in two consecutive rows (10 in total) were collected for each sampling site. For narrow-spaced row crops such as wheat, oats, or canola, plants were collected using a 0.5m x 0.5m quadrate.
• Wet crop biomass was weighed in the lab, oven dried and then re-weighed. VWC was calculated by subtracting the dried from the wet weights, and scaled if required to kg/m² units.
• VWC was then averaged for each sample site and then for each field. An average crop VWC was calculated by averaging VWC for each crop type.

Results – SMAPVEX16-MB Crop VWC

Estimating VWC for the SMAPVEX16-MB Pixel

Results – SMAPVEX16-MB Average Crop VWC
• All land classes within the SMAP ROI are listed on the table. VWC data in 2016 were collected for the classes in green shade (graph) whereas surrogate classes from the 2016 dataset will be used for crops with similar plant structures. The other classes will be simply ignored, but these only represent 4.26% of the SMAP ROI.

Results – Combining Field VWC from
SMAPVEX16-MB and SMAPVEX12-MB
• The field VWC collected for grassland and forest during SMAPVEX12-MB was combined with the one collected for SMAPVEX16-MB.
• The graph on the left shows VWC for all classes including the forest, whereas the graph on the right only shows the VWC for agricultural crops.
• Forest VWC was calculated by Mahta (2012).
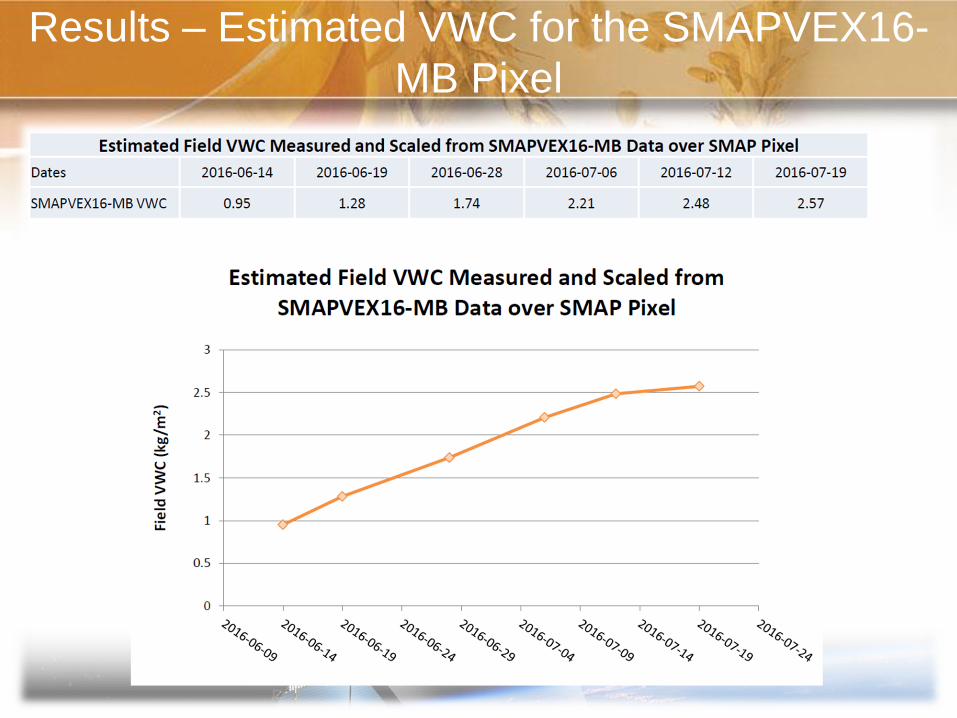
Results – Estimated VWC for the SMAPVEX16-
MB Pixel
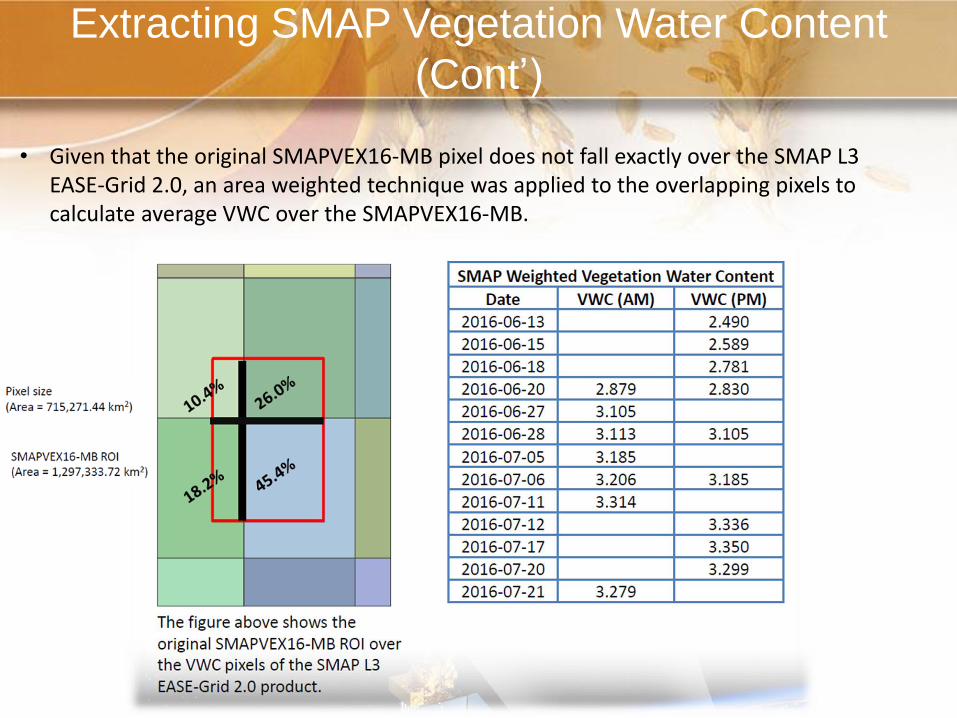
Extracting SMAP Vegetation Water Content
(Cont’)
• Given that the original SMAPVEX16-MB pixel does not fall exactly over the SMAP L3 EASE-Grid 2.0, an area weighted technique was applied to the overlapping pixels to calculate average VWC over the SMAPVEX16-MB.
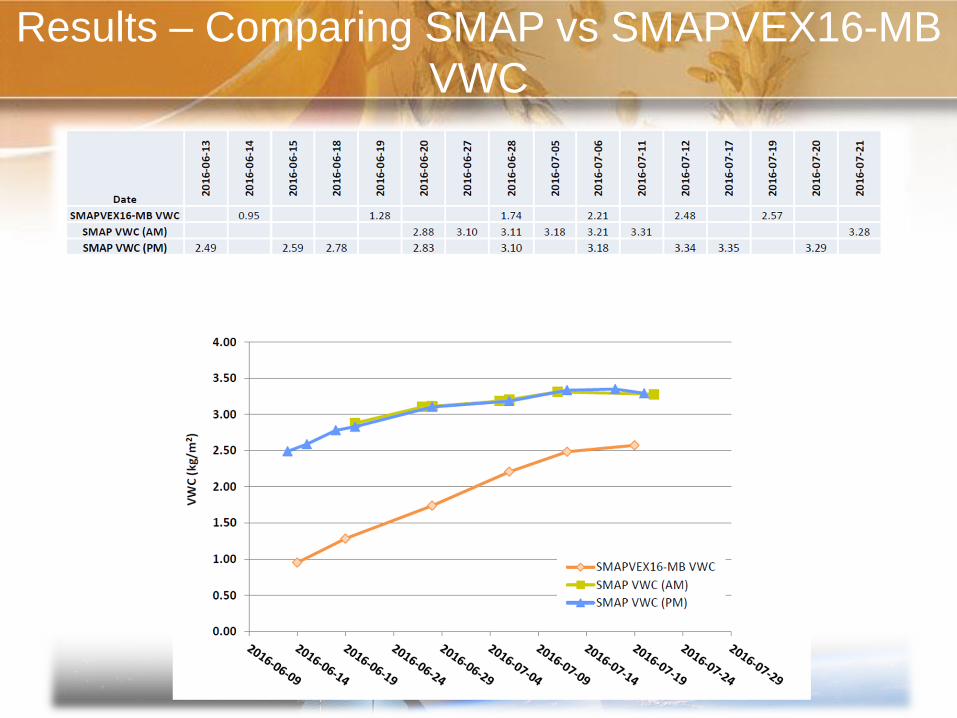
Results – Comparing SMAP vs SMAPVEX16-MB
VWC
Conclusions and Recommendations
• AAFC is investigating potential sources of error that could explain SMAP’s underestimation of soil moisture over the Carman site. A study has been conducted to compare SMAP’s 2016 estimated vegetation water content (VWC) vs SMAPVEX16-MB’s measured VWC.
• AAFC has determined from the analysis of SMAPVEX16-MB’s data and a scaling method (based on an area weighted technique) that the VWC ingested into the SMAP soil moisture retrieval algorithm is overestimated throughout the growing season for the SMAP pixel over Carman, Manitoba.
• The VWC overestimation is quite significant in the early stages of crop growth (approximately 1.5 kg/m²), i.e. June. At the peak of biomass, the overestimation is reduced but still important (close to 0.75 kg/m²).
• The SMAPVEX16-MB measured VWC could be ingested into the SMAP soil moisture retrieval algorithm over the 2016 growing season to identify if this reduces retrieved soil moisture errors. Re-processing the 2016 SMAP soil moisture data with the measured VWC will aid in better understanding the impact of the VWC overestimation on the soil moisture retrievals over the Carman SMAP pixel.
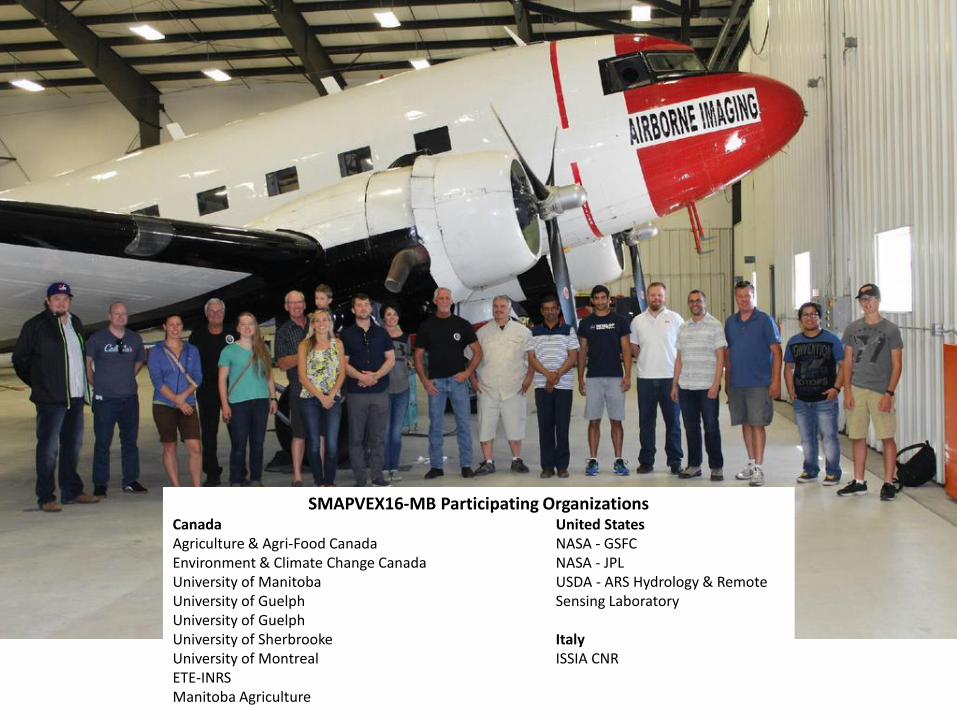
SMAPVEX16-MB Participating OrganizationsCanada United StatesAgriculture & Agri-Food Canada NASA - GSFCEnvironment & Climate Change Canada NASA - JPLUniversity of Manitoba USDA - ARS Hydrology & Remote University of Guelph Sensing LaboratoryUniversity of GuelphUniversity of Sherbrooke ItalyUniversity of Montreal ISSIA CNRETE-INRS Manitoba Agriculture