Up Goer 4 - University of Notre Dameame40462/Reports2015/group5_FinalReport.pdf · Up Goer 4 Final...
46
Up Goer 4 Final Report May 6, 2015 Group 5 – Balsa Bombers Michael Martel, Erik Nelson, Cecilia Ruiz, John Sontag
-
Upload
duongkhanh -
Category
Documents
-
view
214 -
download
0
Transcript of Up Goer 4 - University of Notre Dameame40462/Reports2015/group5_FinalReport.pdf · Up Goer 4 Final...

Up Goer 4 Final Report May 6, 2015 Group 5 – Balsa Bombers Michael Martel, Erik Nelson, Cecilia Ruiz, John Sontag
Page | 1
Table of Contents List of Figures ................................................................................................................................................ 2
List of Tables ................................................................................................................................................. 3
Conceptual Design ........................................................................................................................................ 4
Design Drivers ........................................................................................................................................... 4
Wing Design .............................................................................................................................................. 4
Vertical and Tail Design ............................................................................................................................. 6
Control Surfaces Design ............................................................................................................................ 8
Payload Configuration ............................................................................................................................... 8
Fuselage Design......................................................................................................................................... 9
Stability Prediction .................................................................................................................................. 10
Final Conceptual Design .......................................................................................................................... 11
Modifications to Conceptual Design ....................................................................................................... 12
Detailed Design ........................................................................................................................................... 13
Modifications to Detailed Design ............................................................................................................ 13
Construction ................................................................................................................................................ 14
Performance Predictions ............................................................................................................................ 16
Flight Tests .................................................................................................................................................. 17
Crash 1 .................................................................................................................................................... 17
Reconstruction ........................................................................................................................................ 17
Crash 2 .................................................................................................................................................... 18
Mission Analysis ...................................................................................................................................... 27
Final Recommendations ............................................................................................................................. 28
References .................................................................................................................................................. 29
Appendix A: Conceptual Design Spreadsheets ........................................................................................... 30
Appendix B: Detailed Drawings ................................................................................................................... 34
Appendix C: Video Snapshots of Fatal Crash .............................................................................................. 41
Appendix D: Senior Design Forms ............................................................................................................... 42

Page | 2
List of Figures
Figure 1. Side-view drawing showing locations of main wing and vertical tail on fuselage. ........................ 6
Figure 2. Top-view drawing showing locations of main wing and horizontal tail on fuselage. .................... 7
Figure 3. Pilot scaling recommendations. (Photos taken from Trainer Scaling PDF provided on the
Aerospace Design website) ........................................................................................................................... 8
Figure 4. Side view of passenger configuration. ........................................................................................... 9
Figure 5. Top view of passenger configuration. ............................................................................................ 9
Figure 6. Side view of assembled fuselage sections. .................................................................................. 10
Figure 7. Top view of conceptual design. ................................................................................................... 11
Figure 8. Front view of conceptual design .................................................................................................. 11
Figure 9. Side view of conceptual design. ................................................................................................... 12
Figure 10. Photographic evidence of the damage our plane sustained from the harsh landing. .............. 17
Figure 11. The problem. .............................................................................................................................. 18
Figure 12. Steady, level flight. ..................................................................................................................... 19
Figure 13. Rolling......................................................................................................................................... 20
Figure 14. Rolled too far, upside down. ...................................................................................................... 21
Figure 15. Nosedive. ................................................................................................................................... 22
Figure 16. Attempting to pull out of dive – wings flexing. .......................................................................... 23
Figure 17. Total failure. ............................................................................................................................... 23
Figure 18. Looks of defeat. .......................................................................................................................... 24
Figure 19. Wing after the crash. ................................................................................................................. 25
Figure 20. Wingbox after the crash. ............................................................................................................ 26
Figure A - 1. Wing design calculations. ....................................................................................................... 30
Figure A - 2. Tail design calculations. .......................................................................................................... 31
Figure A - 3. Calculations for stability coefficients of an empty aircraft design. ........................................ 32
Figure A - 4. Calculations for stability coefficients of a fully loaded aircraft design. .................................. 33
Figure B - 1. Full plane modular assembly. ................................................................................................ 34
Figure B - 2. Nosecone and wingbox drawings. ......................................................................................... 35
Figure B - 3. Cargo bay drawing. ............................................................................................................... 36
Figure B - 4. Fuselage tail drawing. ............................................................................................................ 37
Figure B - 5. Left wing drawing. .................................................................................................................. 38
Figure B - 6. Tail drawing. ........................................................................................................................... 39
Figure B - 7. Three view aircraft drawing. .................................................................................................. 40
Page | 3
List of Tables
Table 1. Weight Estimate .............................................................................................................................. 5
Table 2. Main wing airfoil characteristics. .................................................................................................... 6
Table 3. Vertical Tail Design. ......................................................................................................................... 7
Table 4. Horizontal Tail Design. ..................................................................................................................... 8
Table 5. Control surface decisions. ............................................................................................................... 8
Table 6. Predicted performance metrics. ................................................................................................... 16

Page | 4
Conceptual Design
Design Drivers
We propose to design an aircraft that will serve as an air taxi for the Crazy Air Taxi Planes, LLC
(CATplanes). They are an air taxi service focused on getting their patrons to their destinations quickly
while providing a thrilling experience. The goal is to create a prototype remote controlled aircraft to
compete for a contract.
The design goal of this vehicle is to offer a fast commute while still keeping in mind the safety of
our passengers. The airplane will fly a flight path that includes a 360 degree turn and a length of distance
of roughly 1000 feet. As a result, the goal is to create a fast, maneuverable and safe aircraft.
The intent of our design is to focus on the maneuverability of our vehicle in order to provide the
quickest and safest flight experience. Our power plant will be supplied by CATplanes and therefore will
be the same as the rest our competition. As a result, our main design driver is to optimize our turn rate
for the purpose of creating a highly maneuverable plane.
Wing Design
With turn rate as our primary design driver, wing loading was selected to give the fastest turn
rate. For a more maneuverable plane, it is best to have a low wing loading. As a result we chose to set
our wing loading as close to 1.5 lb. /ft.2 as possible.
When analyzing the equations for instantaneous and sustained turn rates, shown below,
another important design characteristic we chose to focus on was that of aspect ratio.
�̇�𝑖𝑛𝑠𝑡𝑎𝑛𝑡𝑎𝑛𝑒𝑜𝑢𝑠 =𝑔√𝑛2 − 1
𝑉
�̇�𝑚𝑎𝑥−𝑠 =
𝑔√𝑞𝜋𝐴𝑒𝑊/𝑆 [(
𝑇𝑊)
𝑚𝑎𝑥−
𝑞𝐶𝐷0
𝑊/𝑆] − 1
𝑉
As shown in the sustained turn rate equation, a higher aspect ratio combine with a low wing
loading will give us optimum rates. As a result, we chose to set our aspect ratio to 10. By choosing a
wing loading of 1.5 lb./ft2 and an estimated weight of 6.5 lbs. (shown in Table 1), the area of our wing
was calculated as 4 ft2. These design decisions combined with our airfoil data explained further below,
allowed us to use the above equations to estimate an instantaneous turn rate of 84 degrees per second
and a sustained turn rate of 68 degrees per second.
Page | 5
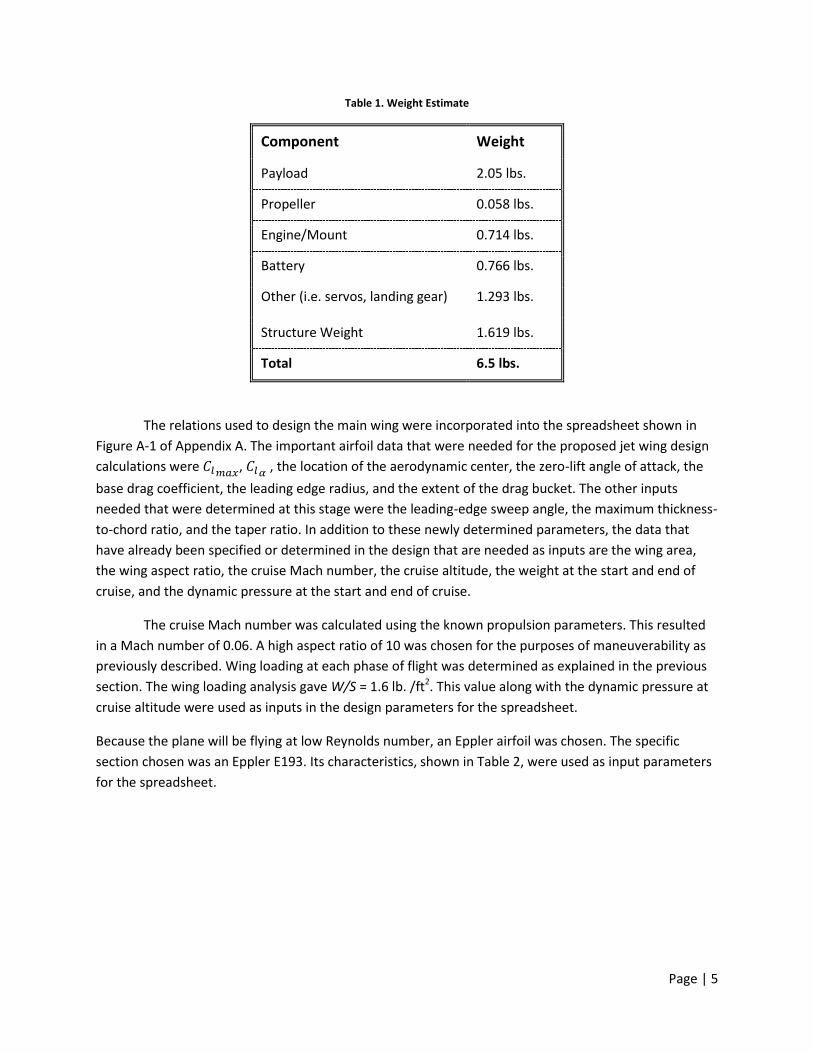
Table 1. Weight Estimate
Component Weight
Payload 2.05 lbs.
Propeller 0.058 lbs.
Engine/Mount 0.714 lbs.
Battery 0.766 lbs.
Other (i.e. servos, landing gear) 1.293 lbs.
Structure Weight 1.619 lbs.
Total 6.5 lbs.
The relations used to design the main wing were incorporated into the spreadsheet shown in
Figure A-1 of Appendix A. The important airfoil data that were needed for the proposed jet wing design
calculations were 𝐶𝑙𝑚𝑎𝑥, 𝐶𝑙𝛼
, the location of the aerodynamic center, the zero-lift angle of attack, the
base drag coefficient, the leading edge radius, and the extent of the drag bucket. The other inputs
needed that were determined at this stage were the leading-edge sweep angle, the maximum thickness-
to-chord ratio, and the taper ratio. In addition to these newly determined parameters, the data that
have already been specified or determined in the design that are needed as inputs are the wing area,
the wing aspect ratio, the cruise Mach number, the cruise altitude, the weight at the start and end of
cruise, and the dynamic pressure at the start and end of cruise.
The cruise Mach number was calculated using the known propulsion parameters. This resulted
in a Mach number of 0.06. A high aspect ratio of 10 was chosen for the purposes of maneuverability as
previously described. Wing loading at each phase of flight was determined as explained in the previous
section. The wing loading analysis gave W/S = 1.6 lb. /ft2. This value along with the dynamic pressure at
cruise altitude were used as inputs in the design parameters for the spreadsheet.
Because the plane will be flying at low Reynolds number, an Eppler airfoil was chosen. The specific
section chosen was an Eppler E193. Its characteristics, shown in Table 2, were used as input parameters
for the spreadsheet.

Page | 6
Table 2. Main wing airfoil characteristics.
Airfoil Data
Name Eppler E193
Clmax 1.3
Clα 0.11 1/deg
a.c. 0.25 c
α0L -3 deg
Cd0 0.01
rle 0.015 c
ClminD 0 - 5
(t/c)max 0.10 c
A taper ratio of 0.40 was chosen and the decision was made to not have a leading-edge sweep
angle. We chose to add a taper to our wing because it gives the most ideal form of lift distribution since
the wing planform is closer to the ideal ellipse shape. As for the leading-edge sweep, the decision to not
have the sweep was made because we did not believe that the aerodynamic benefits would be as
significant on a small scale aircraft. The thickness to chord ratio was set as 0.10 to get a higher 𝐶𝑙𝑚𝑎𝑥
according to our airfoil’s characteristics. The results of our chosen parameters gave a wing span of 6.3 ft.
with a mean aerodynamic chord of 0.7 ft.
For this design, the drag coefficient for the wing at cruise was determined to be 𝐶𝐷 = 0.007. In
determining the base drag coefficient, 𝐶𝐷0, the form factor was calculated as 1.30. The value for 𝐶𝐷0 in
this case is 0.006, giving an overall drag force at cruise Mach number and altitude of 0.136 pounds. The
total wing L/D for this design is 13.5.
Vertical and Tail Design
For the vertical stabilizer, a size coefficient, 𝐶𝑉𝑇, of 0.07 was chosen. This number was based on
the coefficient from Table 6.1 (Corke, 123) for a fighter plane since our goal is to make a maneuverable
aircraft. The length, 𝐿𝑉𝑇, was chosen as 2.3 ft. A side view drawing of the aircraft showing the fuselage,
main wing, and vertical tail is shown in Figure 1. A taper ratio of 𝜆 = 0.40 was chosen. An aspect ratio of
𝐴𝑉𝑇 = 1.00 was determined by the range specified in Table 6.5 (Corke, 127).
Figure 1. Side-view drawing showing locations of main wing and vertical tail on fuselage.
𝑙𝑉𝑇 = 2.3𝑓𝑡

Page | 7
Once again, Eppler airfoils were chosen for the horizontal tail due to the low Reynolds number
our aircraft will be flying at. For the horizontal and vertical tails the section chosen was an Eppler E472.
This is a symmetric airfoil in the same family as the airfoil used for the main wing. With these decisions,
the calculations resulted in the following vertical tail design described in the following table.
Table 3. Vertical Tail Design.
𝑺𝑽𝑻 0.7840 ft.2 𝒃 0.8 ft. 𝒄𝒓 0.9 ft. 𝒄𝒕 0.36 ft.
𝒅𝑪𝑳𝒅𝜶
⁄ 0.024 per degree
𝑪𝑫𝒐 0.004674
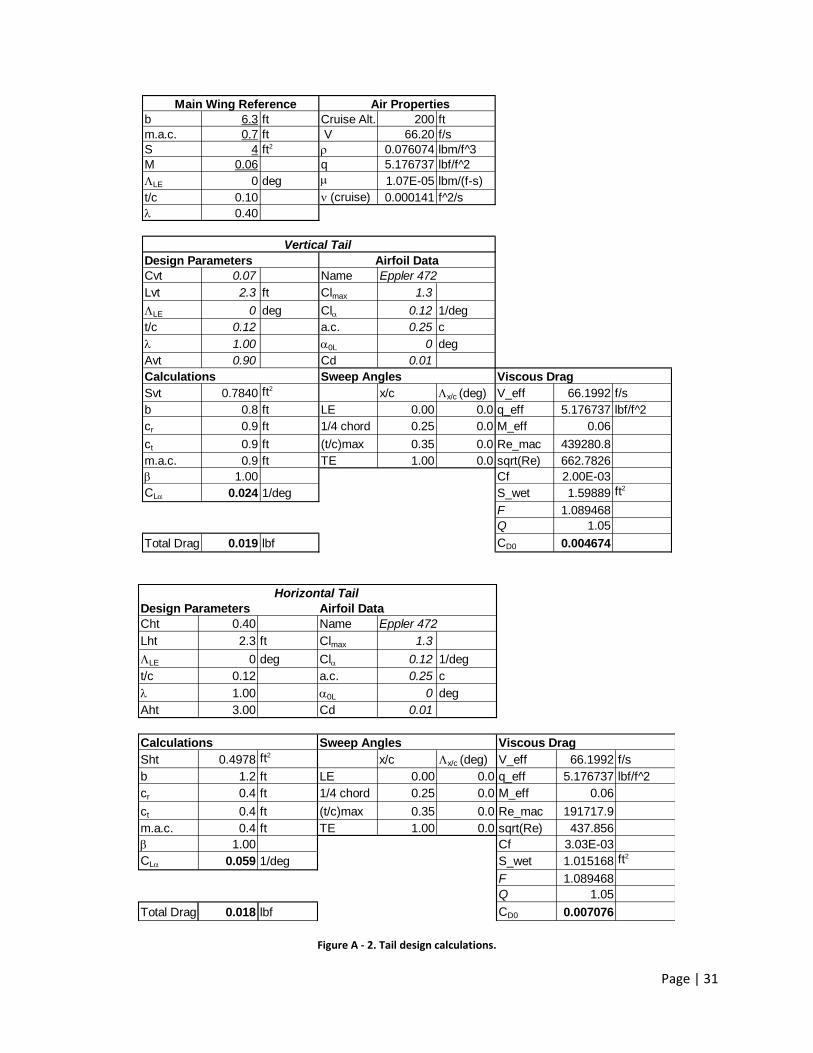
For the horizontal stabilizer, size coefficient, 𝐶𝐻𝑇 = 0.40, was chosen. This was based on the
coefficient from Table 6.1 (Corke, 123) for a fighter plane. The length, 𝐿𝐻𝑇, was chosen as 2.3 ft., for a
conventional tail design. A top view drawing of the aircraft showing the fuselage, main wing, and
horizontal tail, is shown in Figure 2. A taper ratio of 𝜆 = 1.00 was chosen to make the stabilizer a flat
plate. An aspect ratio of 𝐴𝐻𝑇 = 3.0 was determined by the range specified in Table 6.5 (Corke, 127).
Figure 2. Top-view drawing showing locations of main wing and horizontal tail on fuselage.
Though the calculations from the spreadsheet, shown in Figure A-2, gave a good starting point
for our horizontal tail size, we decided to increase the stabilizer based on the scaling recommendations
from the pilots. The area was increased to 0.6 ft2. The following table shows the final horizontal tail
design size.
𝑙𝐻𝑇 = 2.3𝑓𝑡
Page | 8
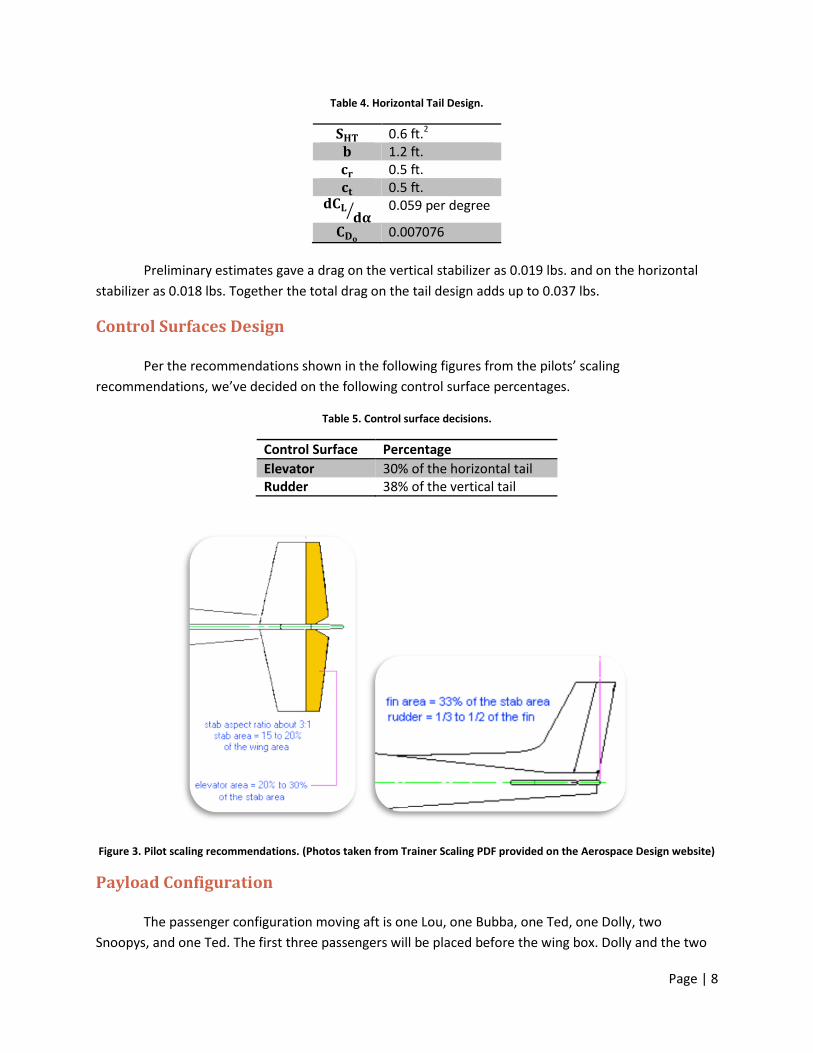
Table 4. Horizontal Tail Design.
𝐒𝐇𝐓 0.6 ft.2 𝐛 1.2 ft. 𝐜𝐫 0.5 ft. 𝐜𝐭 0.5 ft.
𝐝𝐂𝐋𝐝𝛂
⁄ 0.059 per degree
𝐂𝐃𝐨 0.007076
Preliminary estimates gave a drag on the vertical stabilizer as 0.019 lbs. and on the horizontal
stabilizer as 0.018 lbs. Together the total drag on the tail design adds up to 0.037 lbs.
Control Surfaces Design
Per the recommendations shown in the following figures from the pilots’ scaling
recommendations, we’ve decided on the following control surface percentages.
Table 5. Control surface decisions.
Control Surface Percentage
Elevator 30% of the horizontal tail Rudder 38% of the vertical tail
Figure 3. Pilot scaling recommendations. (Photos taken from Trainer Scaling PDF provided on the Aerospace Design website)
Payload Configuration
The passenger configuration moving aft is one Lou, one Bubba, one Ted, one Dolly, two
Snoopys, and one Ted. The first three passengers will be placed before the wing box. Dolly and the two

Page | 9
Snoopys will lie on top of the wing box where they can easily be moved to properly place the center of
gravity. Ted will be placed as far aft as possible in the cargo bay right before the tail section of the
fuselage. The total weight of the passenger payload is 2.05 lbs. and will span the length of the cargo bay.
The cargo bay's height and width are informed by the largest passengers with Ted, the tallest, measuring
3.75 in. high and Dolly, the widest, measuring 5 in. wide.
Figure 4. Side view of passenger configuration.
Figure 5. Top view of passenger configuration.
Fuselage Design
The proposed fuselage design is divided into three sections: the nosecone, the cargo bay, and
the tail support section. The nosecone's sole purpose is to house the propeller motor. The tail support
section will house the battery as well as provide a moment arm for the tail control surfaces. The cargo

Page | 10
bay houses the passenger payload and the wing box as well as provides a support structure for the loads
experienced by the wing.
The current geometry for the fuselage is as follows. A 2 x 2 in. flat panel tapers over 5 inches
into a 4 x 5.5 in. section to form the nosecone. This 4 x 5.5 in. section extends uniformly over the 20 in.
to form the cargo bay. At the end of the cargo bay this section sweeps over another 20 in. into a 1 x 1 in.
flat panel. This tail section sweeps from the base upward meaning the top surface of the fuselage is flat
over the cargo bay and tail section. This geometry yields a total fuselage length of 45 in. (3.75 feet). The
proposed design incorporated a bottom-mounted wing with a dihedral of 3°. The wing box is placed 2 in.
from the aft end of the cargo bay and extends forward 11 in., the length of the wing root chord, and 1
in. deep into the cargo bay. Figure 6 shows the assembled fuselage sections.
Figure 6. Side view of assembled fuselage sections.
The length of the cargo bay allows for some variation in the placement of the payload and
electronics. This allows for subtle alteration of the center of mass placement post-construction to
ensure flight and stability performance meets the requirements of the mission and the expectations of
the pilot. In order to access the passengers and electronics in the cargo bay, we’ve designed the cargo
bay to have a top cover that can be removed and attached via magnets.
Stability Prediction
After creating a detailed model of our design, we were able to properly calculate the center of
gravity to make sure that our design was stable. The equations used to calculate the stability coefficients
were integrated into the spreadsheets shown in Figures A-3 and A-4 in Appendix A.
Calculations for stability were done for the empty design as well as the fully loaded design. In
both cases, the wing center of lift is at 14.1” from the nose.
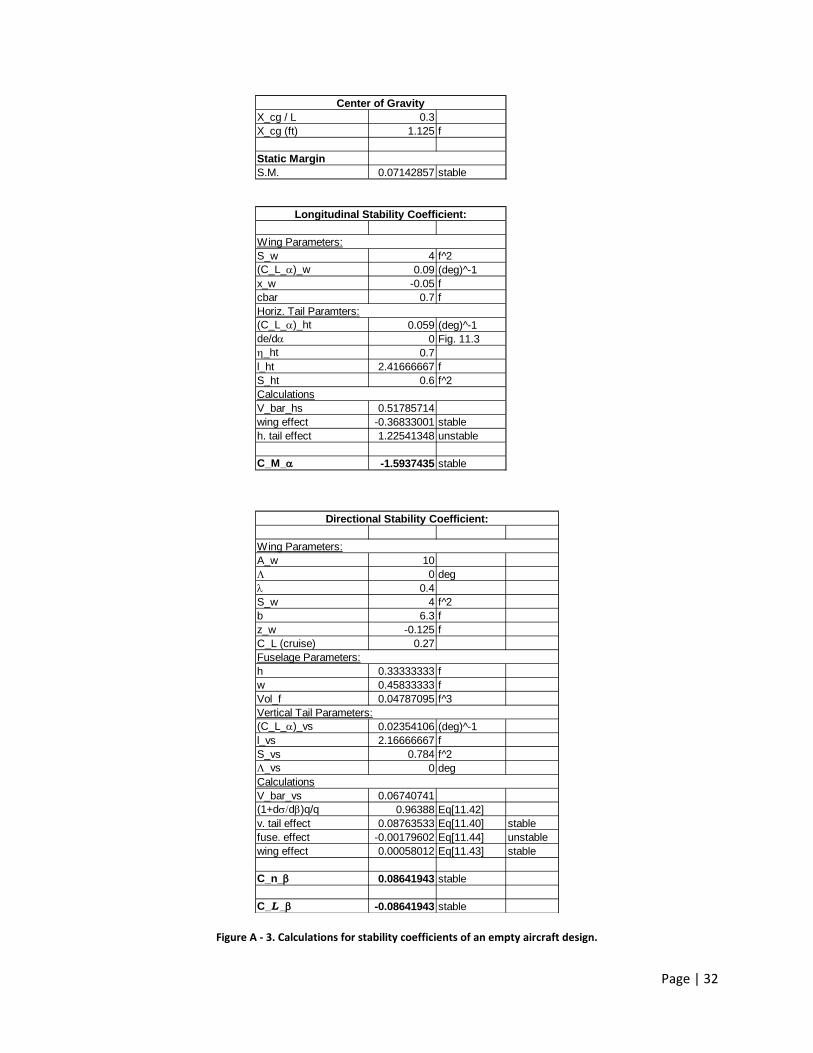
In the case of our empty aircraft, the center of gravity is at 13.5”, giving a static margin of
0.0714. This static margin revealed that our plane is statically stable since it is greater than zero. The
analysis of the longitudinal stability coefficient showed that the contribution of the wing was stabilizing.
The total longitudinal stability coefficient was a stable value of CM,alpha = -1.59. This is actually more
stable than we would like the plane but it is still within the stable range.
Nosecone Cargo Bay Tail
5” 20” 20”
Page | 11
The analysis of the directional stability showed that our plane is stable. Our calculations resulted
in a stable coefficient of 𝐶𝑛𝛽 = 0.0824. The lateral stability coefficient was estimated as the negative of
the directional stability coefficient, 𝐶𝐿𝛽 = -0.0824.
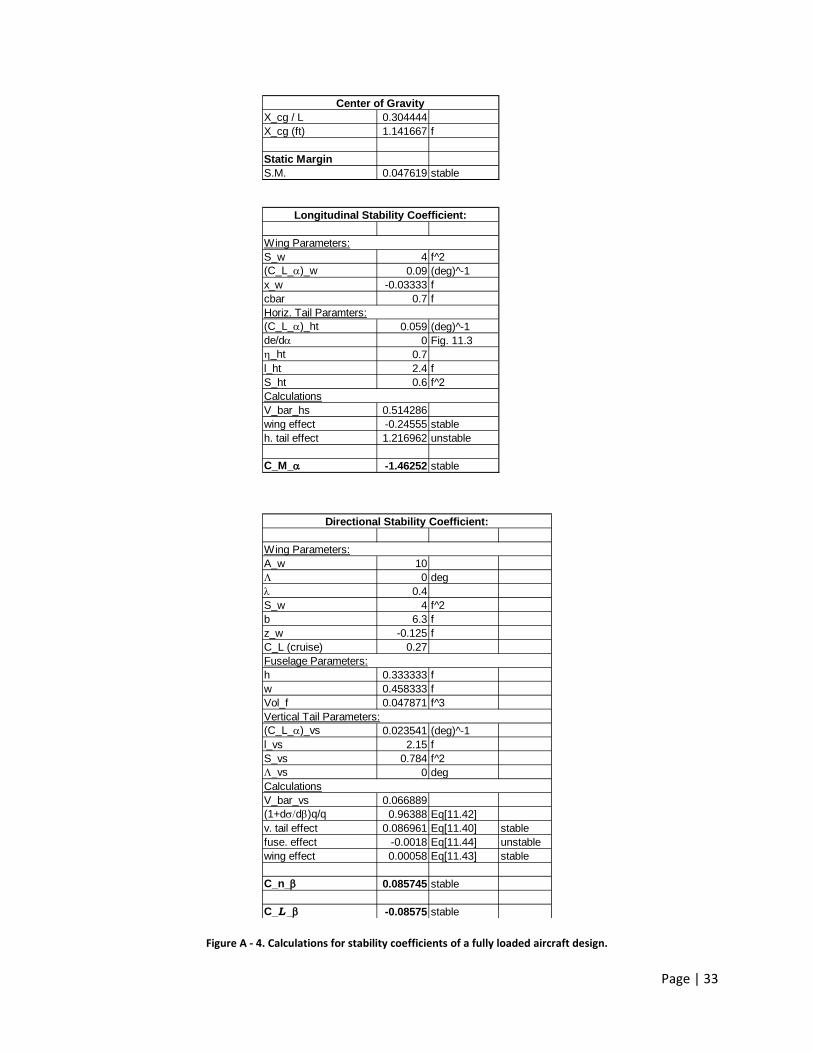
Running the stability analysis for our fully loaded plane, we found our plane to be stable as well,
keeping in mind that we have a lot of freedom to adjust our payload and battery if need be. The center
of gravity is at 13.7”, giving a static margin of 0.0476. This static margin revealed that our plane is
statically stable since it is greater than zero. The analysis of the longitudinal stability coefficient showed
that the contribution of the wing was stabilizing. The total longitudinal stability coefficient was a stable
value of CM,alpha = -1.46. This is actually more stable than we would like the plane but it is still within the
stable range.
The analysis of the directional stability showed that our plane is stable. Our calculations resulted
in a stable coefficient of 𝐶𝑛𝛽 = 0.0814. The lateral stability coefficient was estimated as the negative of
the directional stability coefficient, 𝐶𝐿𝛽 = -0.0814.
Final Conceptual Design
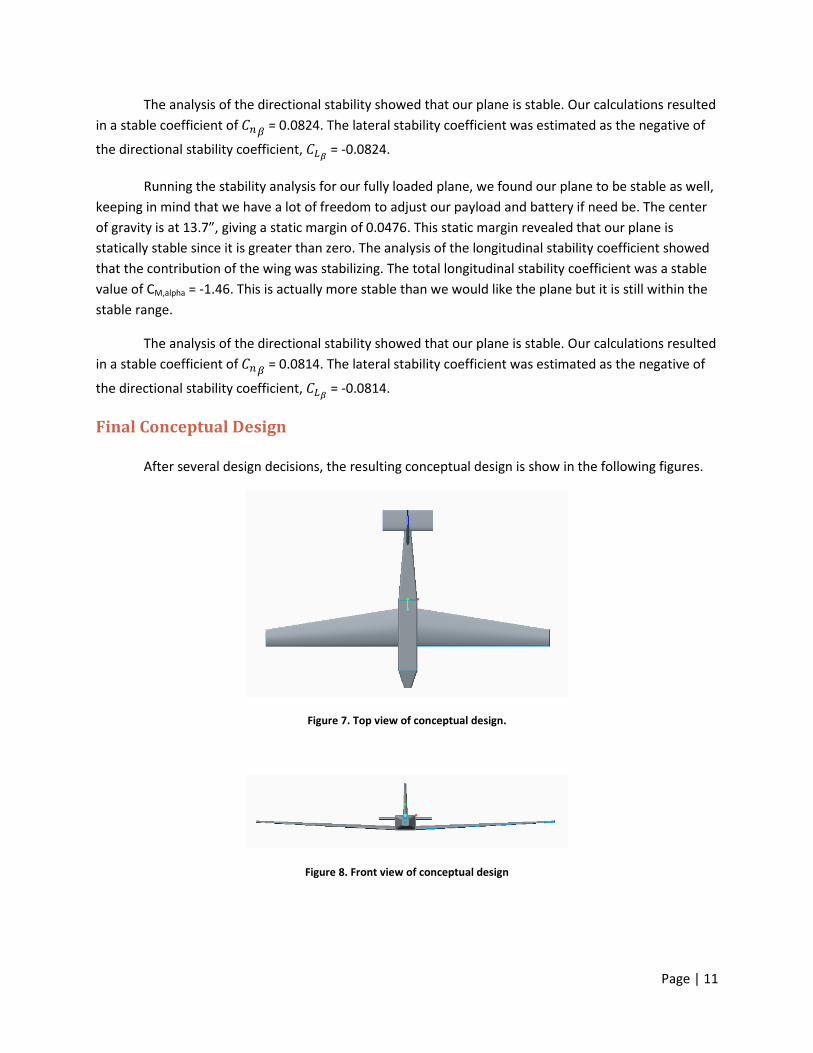
After several design decisions, the resulting conceptual design is show in the following figures.
Figure 7. Top view of conceptual design.
Figure 8. Front view of conceptual design

Page | 12
Figure 9. Side view of conceptual design.
Modifications to Conceptual Design
After presenting our conceptual design, we came away with a few modifications to our design.
The main concern was that of structural strength of our fuselage which is why we planned to add
triangle stock for reinforcement. This triangle stock will be added into the corners of the fuselage,
especially where each section meets with another. For example, where the nosecone is bolted to the
cargo bay and where the cargo bay is bolted to the tail end of the fuselage.
A major redesign to our conceptual aircraft is the redesign of our nosecone. While we originally
thought of placing the moto inside the nosecone, we were informed that this design would not work.
The motor needs to be able to rotate freely since, the entire motor moves when the propeller spins.
With our original nosecone, this motion would be impeded and so we redesigned the nosecone to not
fully encase the motor. In addition, we made the decision to add a second layer of plywood between the
front of the plane’s nosecone and the mount of the motor.

Page | 13
Detailed Design
To prepare for construction, we created detailed drawings. They are shown in Appendix B.
These were the drawings used to laser cut the wood to construct our aircraft.
Modifications to Detailed Design
After reviewing our detailed drawings, we planned to make some more modifications before
commencing the phase of construction. As we designed, the electronics layout was not completely clear
to us and so we had to adjust our wing’s ribs. We added holes to the ribs to be able to feed wire and
Tygon tubing through the wing since the pitot tube would be on a wingtip and the servos for the
ailerons need to be connected via wire to the flight receiver located in the cargo bay.
A second modification was to add holes to the nosecone to allow air to flow through into the
fuselage. This was a suggestion made by the pilots, TA’s, and professors with the main concern being the
temperature of the motor and battery during flight.
Page | 14
Construction
Our design implemented several unique construction methods as well as some tried and true.
The most common feature among all the groups was the use of a puzzle piece design. This design used
interlocking groves along the edges of each piece in order to maximize joint strength and ease of
construction. The only drawback to this method is that each joint needed to be nearly perpendicular.
This necessitated a boxlike fuselage instead of an ovular design. Under the flight regime we were in,
there was very little difference in drag between the box and ovular designs so this drawback was
negligible.
One of the methods unique to our group was how we attached our wing to the fuselage. Most
groups used rubber bands to keep the wing attached, however, we wanted a more robust and less
wasteful design. We decided to use a series of bolts coupled with ‘fish eye’ grooves to accomplish this.
The ‘fish eye’ grove looks similar to the shape of a light bulb in that one end has a circle the same radius
as the head of the bolt, while the other end is a smaller circle with the same radius as the screw portion
of the bolt. This allows the bolts on the fuselage to slide into the wingbox ‘fish eyes’ at their large ends
and then slide over to the small ends. Once on the small end, the bolt stays snug. To prevent sliding in
flight, two dowels were slid into separate holes going through both the fuselage and wingbox. This
design proved to be very robust and created a much sturdier joint between the wing and fuselage.
In constructing our wing’s main spar, we had originally planned on tapering the spar to account
for the decreasing size of the ribs, but achieving the perfect taper using only the shop belt sander was a
logistical nightmare. Instead, we decided to use a stair step design on the spar which had the same
effect as the tapering but was much easier to construct. This method actually worked much better than
the taper would have because we had the added benefit of dictating precisely where each rib would be
located.
Because we had a low mounted wing, our design required the use of dihedral. Instead of
building the dihedral into the wings themselves, we decided to use our wingbox as an artificial dihedral
producer. This allowed us the ease of constructing a straight wing. To get dihedral from the wingbox, we
used two vertical supports built in for each side of the wing. These vertical supports had holes cut out
that would house the main spar and dowels in the wing, however, these holes were cut such that the
holes on the inner support were slightly lower than the outer ones. This required the spar and dowels to
be at the precise angle we desired for our dihedral. To create a flush connection with the root rib, the
outer vertical support was angled slightly so that the front and back of the wingbox were actually
trapezoidal in shape instead of rectangular.
Another unique design we implemented was the use of magnets to secure the roof of our cargo
bay. The magnets held extremely well and made opening and closing the hatch simpler than other
designs using rubber bands or latches. The only issue we ran into was the magnets being so strong that
they would pull free from the structure because the CA wasn’t strong enough. We ended up using a bit
of epoxy to solidify those connections and didn’t have any further issues.

Page | 15
Throughout the construction phase, we added triangle stock in several places along the fuselage
to strengthen joints and provide more bending support. It was difficult to model this in our detailed
design before we had all the electronics and passengers in their final configurations. As such, this
process was more unpredictable and random than intentional but the extra support worked very well
and didn’t add much to the overall weight.
On the issue of weight, the construction phase proved to throw us for a loop when compared
with our detailed design predictions. This discrepancy was mostly from misjudging how much glue
would be used in the total construction process as well as having density values for ply and balsa being
roughly the same. In actuality, the density of the ply was much larger than that of the balsa and our CAD
predictions of the structure weight were vastly shy of the actual weight. A more accurate density value
should be requested of the supplier to get a more accurate initial prediction.
The last unique construction design was our tail and landing gear. Early on, we made the
decision to build a tail that had an airfoil instead of a flat plate. This actually turned out to be vastly
easier than stick building a flat plate and performed better. There’s really no reason a flat plate design
should have been chosen over the airfoil design. Our vertical tail had three dowels that protruded
through the root rib and slid into corresponding holes in the top of the fuselage. CA was then used to
secure the connection between the rib and the fuselage. The vertical tail was actually several inches
forward of the end of the fuselage so that the front of the rudder lined up with the end. This allowed the
horizontal tail to be attached directly to the back of the fuselage which kept the rudder and elevator
from interfering. The connection between the horizontal tail and the fuselage used two dowels lined up
vertically in the center as well as two plates CA’d to the outside of the fuselage. A third dowel went
through the side of the fuselage and through both plates to secure the tail from rotating on a horizontal
axis. This connection worked very well in flight even though it didn’t quite stand up to impact stresses.
Our tail wheel design was originally unique before all the other groups scrapped their tail wheel
kits and copied us. We used a simple metal rod that went into the rudder at a 45 degree angle and then
came down vertically. We had to bend the rod around the two vertical dowels in the horizontal tail
wheel to allow for proper rotation and clearance. The end of the rod was bent at a 90 degree angle and
the tail wheel was attached. This design was a bit structurally questionable in the beginning. The rod
rotated within the rudder and this bent the whole structure sideways. A rubber band (despite our
disgust with this lame form of securing stuff) was jerry rigged to the rod to keep it in place, but
eventually (thank goodness!) we added a second rod further back in the rudder that then bent at a 90
degree angle and reattached to the main rod. This prevented the structure from rotating and was much
more stable. A few extra rods were also soldered to the main rod to make this whole structure nigh
indestructible (until we dive bombed straight into the corn field), and then it bent a little.

Page | 16
Performance Predictions
The table below shows the predictions for our performance metrics before any flight testing was
done. These calculations were done using equations and spreadsheets taken from Thomas Corke’s
textbook, Design of Aircraft.
Table 6. Predicted performance metrics.
Predicted Measured Predicted Measured
Weight, fuselage lb 1.2 2
Weight, wing lb 1.6 3
Weight, empty lb 2.8 5.9
Weight, payload 2.05
Weight, loaded lb 4.85 7.95
Location, CG in. 13.5 14.05 13.8 13.95
Location, center of lift in. 14.2 14 14.2 14
Static Margin 0.08 0.05
Wing area ft^2 4
Wing span ft 6.3
Aspect ratio 10
Wing loading lb/ft^2 0.7 1.475 1.21 1.9875
Minimum level speed ft/s 60 60
Maximum level speed ft/s 68 68
Maximum rate of climb ft/s 54.3 8.8
Best gliding descent rate ft/s 1.58 2.08
Best glide speed ft/s 18 16
Maximum L/D 13.5 7.8
Load factor 3 3
Max instantaneous turn rate deg/s 204 116
Max sustained turn rate deg/s 76 75
Take-off distance ft 80 114
Landing distance ft 485 545
Lap time s 22 24
Empty LoadedMetric Units

Page | 17
Flight Tests
Crash 1
The aircraft performed to our expectations during its inaugural flight in terms of
maneuverability and flight-speed. It sustained damage on landing as a result of a high approach speed
that caused the plane to pitch up and resume flying after briefly touching down on the forward wheels.
The aircraft quickly lost lift upon leaving ground effect and rolled left, cartwheeling forward on the left
wing before crashing nose first. The left wing tip was first to touch the ground; it sustained no apparent
damage except for the pitot-tube which was bent ninety degrees. The nose hit the ground second and
the fuselage sheared at the cargo bay section between the main wing leading edge and the nosecone,
fracturing through the plywood. The horizontal stabilizer broke off at a structural weak point where it
attached to the fuselage. The figure below gives an overview of the damage from the harsh landing.
The high landing speed was likely result of the aircraft's high aspect ratio (10.0) and 0.4 taper
ratio, both of which lead to a decreased induced drag. Induced drag dominates other forms of drag
during landing. There was also concern about a lack of elevator authority. The pilot indicated that the
aircraft might have benefited from a larger elevator because it would give the aircraft more pitch control
as it slowed down. A further concern was the seemingly high angle of attack on landing which might
have contributed to the excess lift.
Figure 10. Photographic evidence of the damage our plane sustained from the harsh landing.
Reconstruction
Following the crash on our maiden flight, a few changes were made to the plane design as
recommended by the pilots and professors. Analysis of the crash led to the discovery of its causes. First
off, it was believed that on approach for landing, the plane was not able to flare sufficiently to bleed off
Page | 18
excess speed. Therefore, the first change that was made was to increase the size of the elevator by
increasing its width by a factor of 1.5 to ensure adequate pitch control on landing. In a similar vein, it
was found that the plane was at too high of an angle of attack once it was fully on the ground, resulting
in too much lift and a “bouncing” effect. To negate this, the rear landing gear was lengthened by 2
inches to decrease the angle of attack from 11⁰ to 7⁰. A third change that was made was the addition of
extra triangle stock in the fuselage. The structural failure after the initial crash was to be expected due
to the extreme loading that the fuselage was subject to. Nevertheless, it was decided that extra support
would only benefit the plane’s strength and would not add substantial weight. The final change that was
made came from multiple failed attempts at landing. On each of our three initial flights, the nylon bolts
securing the forward landing gear ripped through the ¼” plywood in the bottom of the fuselage. In order
to prevent this from happening again and to ensure that the only failure point would be the nylon bolts
themselves (where it should be), an extra ¼” of plywood was added to the bottom of the fuselage where
the landing gear was attached.
Crash 2
After making the modifications described in the previous section, the plane was flown again to
attempt to complete the designated mission. Due to technological failure, there is regrettably no
quantitative data with which to analyze the flight. However, we have video evidence of the flight and
rough time measurements to work with. Initially, the plane flew spectacularly: taking tight turns and
flying fast just as it was designed to do. Stopwatch measurements from the TAs recorded a lap time of
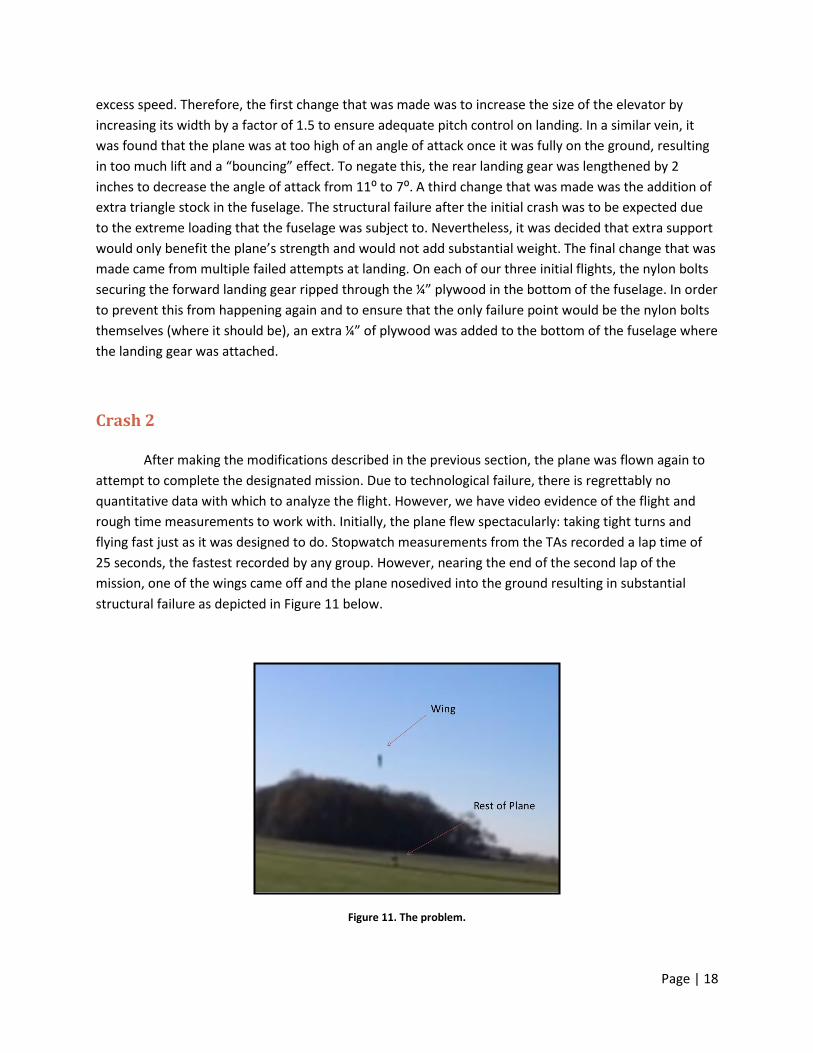
25 seconds, the fastest recorded by any group. However, nearing the end of the second lap of the
mission, one of the wings came off and the plane nosedived into the ground resulting in substantial
structural failure as depicted in Figure 11 below.
Figure 11. The problem.

Page | 19
Seeing the wing come off clearly explains the general idea of the plane’s failure, but it is a little
more difficult to understand what events took place to result in that failure. The following figures were
taken directly from the video of the flight and will be explained in further detail.
Figure 12. Steady, level flight.
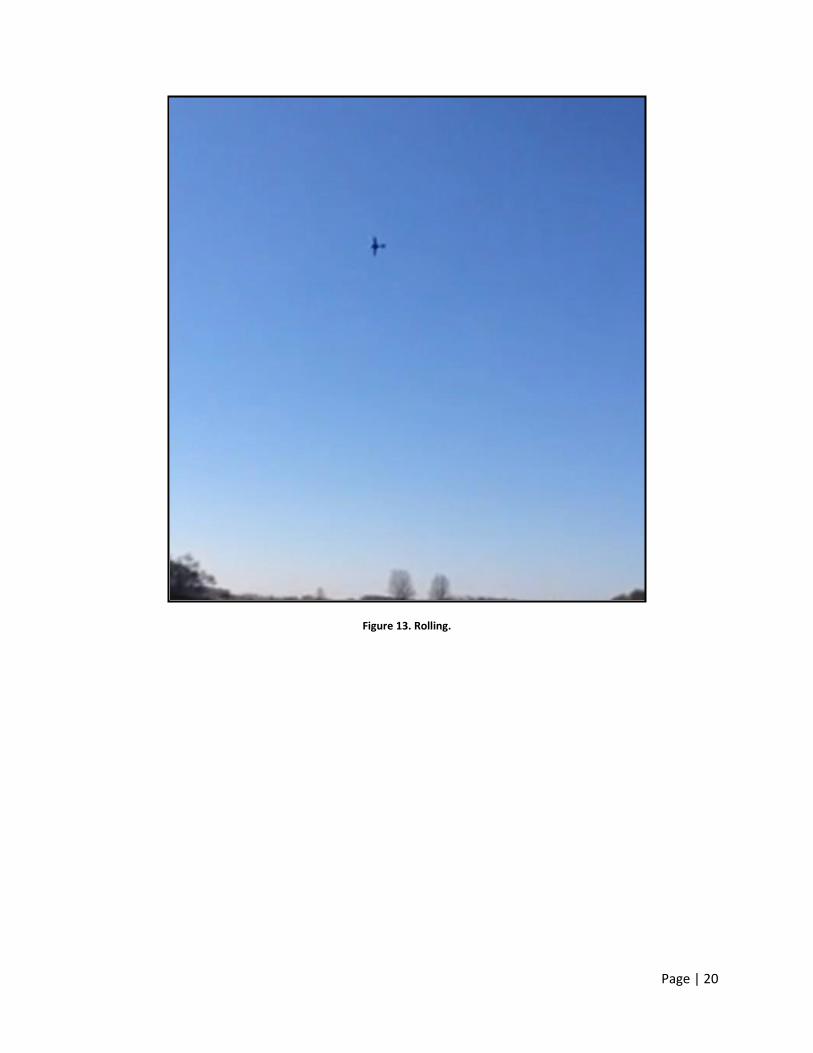
Page | 20
Figure 13. Rolling.
Page | 21
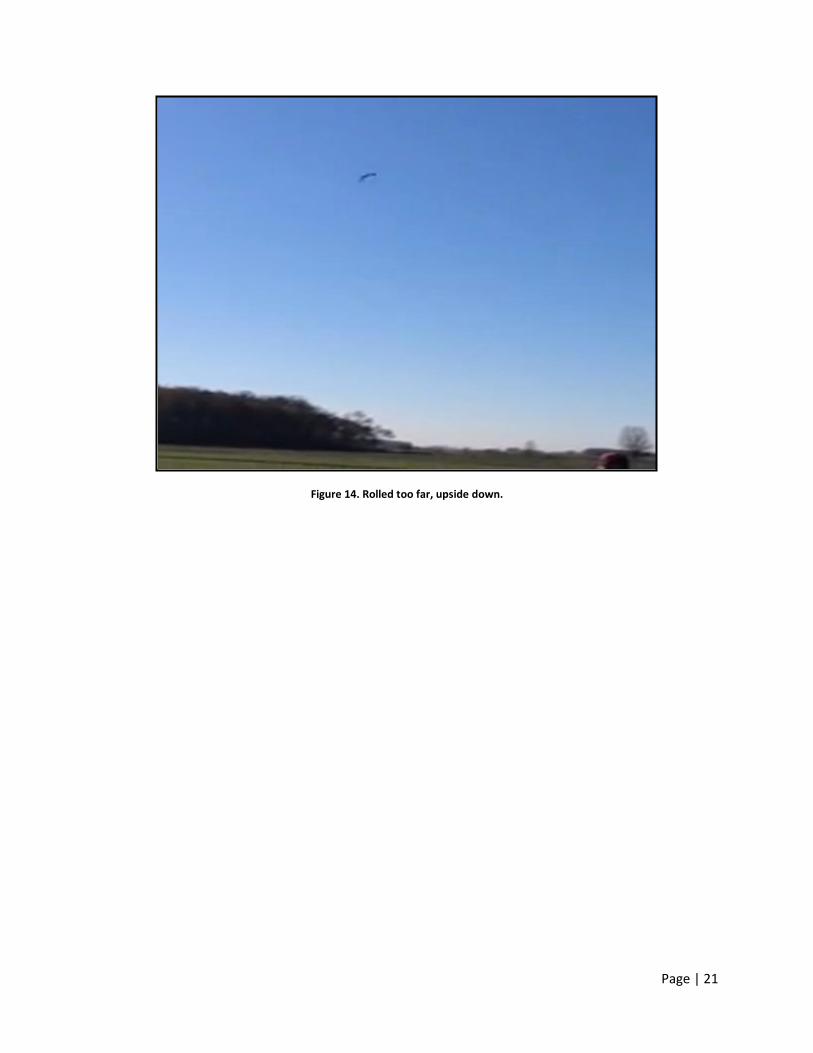
Figure 14. Rolled too far, upside down.

Page | 22
Figure 15. Nosedive.
Page | 23
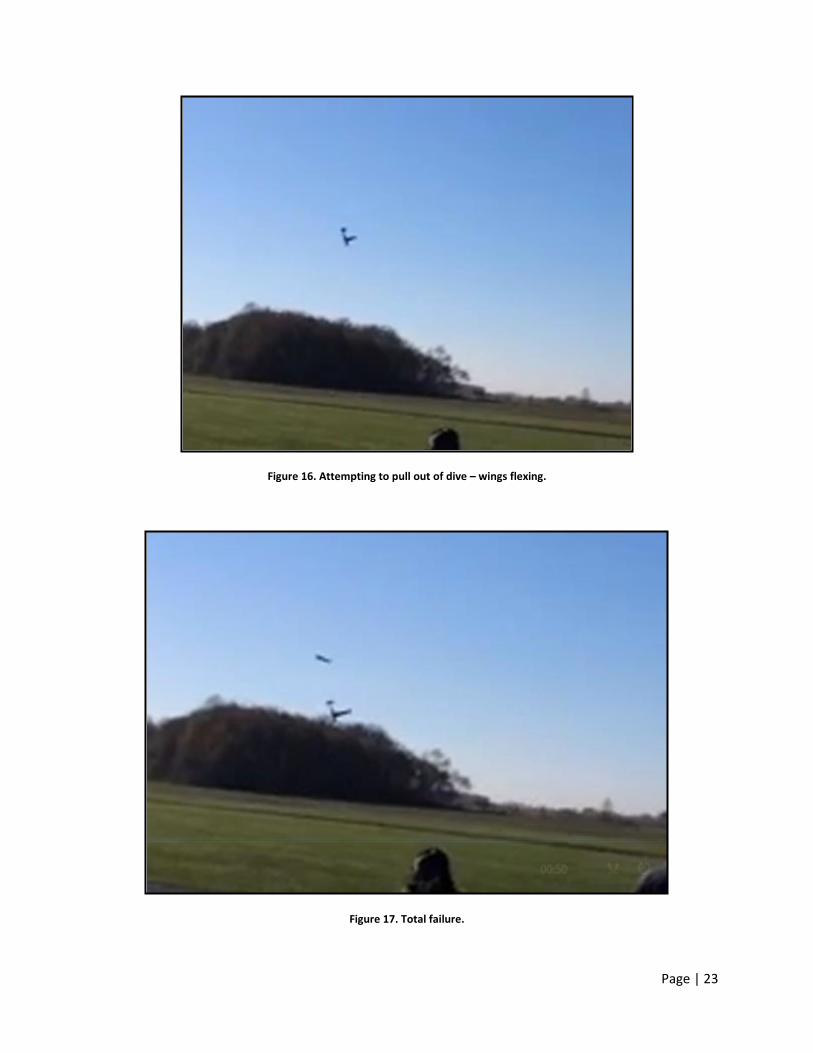
Figure 16. Attempting to pull out of dive – wings flexing.
Figure 17. Total failure.

Page | 24
Figure 18. Looks of defeat.
Considering the above figures, it is easy to see the series of events that took place before the
crash. The plane was initially performing well in steady, level flight. A roll maneuver was initiated that
could not be corrected resulting in the airplane to begin flying upside-down. This orientation forced the
nose to pitch toward the ground. In an attempt to save the plane, the pilot tried to pull the plane out of
the dive. With the extremely large wingspan and flexible nature of the wing structure, the wings flexed
under the high G-load and one side came off. From that point on, the flight was no longer salvageable
and the crowd had to watch it meet the ground at high speed (see Ceci’s expression).
Figures 19 and 20 below show the extent of the damage at the failure point. From these, we
have deduced that the glue holding the wingbox together is what failed. The first figure shows that the
main spar of the wing is fully intact and seems to have simply slid out of the wingbox. The second figure
shows the structural integrity of the frame of the wingbox, but its near total failure at the connections.

Page | 25
Figure 19. Wing after the crash.

Page | 26
Figure 20. Wingbox after the crash.
The root of the problem has yet to be discovered. What caused the initial rolling motion? The
initial thought that came to mind was pilot error, the pilot simply put in too much aileron and rolled the
plane. But these pilots have years of experience and the roll occurred at a point in the lap where no
turning should have been done, so that possibility will be ruled out for now. The most likely scenario was

Page | 27
that the wing was already slightly damaged from multiple rough landings and hard turns. This minor
damage caused one side of the wing to stall and created the rolling moment that initiated the crash. It is
difficult to determine the cause of the crash without detailed accounts from the pilot or data from the
numerous electronics mounted in the plane, but this structural fatigue is the most likely cause.
Mission Analysis
Though our aircraft’s final flight ended in a fatal crash, we were able to gather some insight into
the completion of the mission. All of our design decisions were made with the intent of making a fast,
maneuverable plane. From the one timed lap we do have, we accomplished this objective with a 25
second lap time. This is a remarkably close number to our estimated lap time of 22 seconds in an
unloaded case (see Performance Prediction section above). As for our ground mission, we were able to
accomplish a time of 82.6 seconds. We believe that our magnetized cargo bay was a very efficient design
that allowed easy access to our cargo bay and thus helped us with our ground mission.
Unfortunately, we were not able to accomplish the entire mission but in the end, our team was
content with the decisions we made when designing and constructing our plane.

Page | 28
Final Recommendations
We estimated our takeoff weight with a common density value for plywood that did not reflect
the properties of the plywood we ultimately purchased. This proved costly as our assembled plane was
almost two pounds heavier than anticipated. It would be our recommendation to over-estimate the
weight of future planes to account for not only material uncertainties but also to factor in the noticeable
weight contributions from glue and monokote.
We designed our control surfaces sizes to meet those indicated by conventional sizing
equations. In retrospect, we could have made them considerably larger with minimal weight or
structural concerns. This would have made it easier for the pilots to trim the plane to their satisfaction.
The wing, at times, felt structurally weak and displaced significantly at the tips. While it was able
to sustain level flight and make controlled turns it might have benefited from a second hardwood spar.
Had the plane not possessed dihedral, we could have used a single spar from wingtip to wingtip, going
through the wingbox to stiffen the wing.
Finally it would have been useful to plan out the electronics layout while designing the fuselage.
If we had considered the electronics arrangement more we might have allocated cargo bay space
differently Further consideration would have saved some improvising towards the end of construction.

Page | 29
References
AME 40462: Aerospace Design II. Web. Spring 2015. < http://www3.nd.edu/~ame40462/>.
Corke, Thomas C. Design of Aircraft. Upper Saddle River, N.J.: Prentice Hall, 2003. Print.

Page | 30
Appendix A: Conceptual Design Spreadsheets
Figure A - 1. Wing design calculations.
Design Parameters
M 0.06 Name
S 4 ft2Clmax 1.3
A 10.0 Cla 0.11 1/deg
LLE 0 deg a.c. 0.25 c
t/c 0.10 a0L -3 deg
l 0.40 Cd0 0.01
W c-start 1.835105 lbf/f^2 rle 0.015 c
W c-end 1.835105 lbf/f^2 ClminD 0 - 5
q c-start 5.18 lbf/f^2 (t/c)max 0.10 c
q c-end 5.18 lbf/f^2
Cl c-start 0.09
Cl c-end 0.09
Calculations Sweep Angles
b 6.3 ft x/c Lx/c (deg)
Meff 0.06 LE 0.00 0.0
cr 0.9 ft 1/4C 0.25 -2.5
ct 0.4 ft a.c 0.25 -2.5
m.a.c. 0.7 ft (t/c)max 0.10 -1.0
TE 1.00 -9.7
b 1.00
CLa 0.090 1/deg Viscous Drag
CLo 0.27 V_eff 66.1992 f/s
atrim -2.0 deg q_eff 5.176737 lbf/f^2
CLtrim 0.089 Re_mac 3.16E+05
k 0.039789 sqrt(Re) 562.0453
CD 0.007 Cf 2.36E-03
L/D 13.53 S_wet 8.12016 ft2
F 1.300773
Q 1
Total Drag 0.135667 lbf CD0 0.006239
Airfoil Data
Eppler E193
Page | 31
Figure A - 2. Tail design calculations.
b 6.3 ft Cruise Alt. (ft) 200 ft
m.a.c. 0.7 ft V 66.20 f/s
S 4 ft2 r 0.076074 lbm/f^3
M 0.06 q 5.176737 lbf/f^2
LLE 0 deg m 1.07E-05 lbm/(f-s)
t/c 0.10 n (cruise) 0.000141 f^2/s
l 0.40
Design Parameters
Cvt 0.07 Name Eppler 472
Lvt 2.3 ft Clmax 1.3
LLE 0 deg Cla 0.12 1/deg
t/c 0.12 a.c. 0.25 c
l 1.00 a0L 0 deg
Avt 0.90 Cd 0.01
Calculations Sweep Angles Viscous Drag
Svt 0.7840 ft2x/c Lx/c (deg) V_eff 66.1992 f/s
b 0.8 ft LE 0.00 0.0 q_eff 5.176737 lbf/f^2
cr 0.9 ft 1/4 chord 0.25 0.0 M_eff 0.06
ct 0.9 ft (t/c)max 0.35 0.0 Re_mac 439280.8
m.a.c. 0.9 ft TE 1.00 0.0 sqrt(Re) 662.7826
b 1.00 Cf 2.00E-03
CLa 0.024 1/deg S_wet 1.59889 ft2
F 1.089468
Q 1.05
Total Drag 0.019 lbf CD0 0.004674
Airfoil Data
Air Properties Main Wing Reference
Vertical Tail
Design Parameters Airfoil Data
Cht 0.40 Name Eppler 472
Lht 2.3 ft Clmax 1.3
LLE 0 deg Cla 0.12 1/deg
t/c 0.12 a.c. 0.25 c
l 1.00 a0L 0 deg
Aht 3.00 Cd 0.01
Calculations Sweep Angles Viscous Drag
Sht 0.4978 ft2x/c Lx/c (deg) V_eff 66.1992 f/s
b 1.2 ft LE 0.00 0.0 q_eff 5.176737 lbf/f^2
cr 0.4 ft 1/4 chord 0.25 0.0 M_eff 0.06
ct 0.4 ft (t/c)max 0.35 0.0 Re_mac 191717.9
m.a.c. 0.4 ft TE 1.00 0.0 sqrt(Re) 437.856
b 1.00 Cf 3.03E-03
CLa 0.059 1/deg S_wet 1.015168 ft2
F 1.089468
Q 1.05
Total Drag 0.018 lbf CD0 0.007076
Horizontal Tail
Page | 32
Figure A - 3. Calculations for stability coefficients of an empty aircraft design.
X_cg / L 0.3
X_cg (ft) 1.125 f 13.5
Static Margin
S.M. 0.07142857 stable
S_w 4 f^2
(C_L_a)_w 0.09 (deg)^-1
x_w -0.05 f
cbar 0.7 f
(C_L_a)_ht 0.059 (deg)^-1
de/da 0 Fig. 11.3
h_ht 0.7
l_ht 2.41666667 f
S_ht 0.6 f^2
V_bar_hs 0.51785714
wing effect -0.36833001 stable check: C_M_a =-S.M.*C_L_a
h. tail effect 1.22541348 unstable
C_M_a -1.5937435 stable
A_w 10
L 0 deg
l 0.4
S_w 4 f^2
b 6.3 f
z_w -0.125 f
C_L (cruise) 0.27
h 0.33333333 f
w 0.45833333 f
Vol_f 0.04787095 f^3
(C_L_a)_vs 0.02354106 (deg)^-1
l_vs 2.16666667 f
S_vs 0.784 f^2
L_vs 0 deg
V_bar_vs 0.06740741
(1+ds/db)q/q 0.96388 Eq[11.42]
v. tail effect 0.08763533 Eq[11.40] stable
fuse. effect -0.00179602 Eq[11.44] unstable
wing effect 0.00058012 Eq[11.43] stable
C_n_b 0.08641943 stable
C_L _b -0.08641943 stable
Wing Parameters:
Fuselage Parameters:
Vertical Tail Parameters:
Calculations
Center of Gravity
Longitudinal Stability Coefficient:
Wing Parameters:
Horiz. Tail Paramters:
Calculations
Directional Stability Coefficient:
Page | 33
Figure A - 4. Calculations for stability coefficients of a fully loaded aircraft design.
X_cg / L 0.304444
X_cg (ft) 1.141667 f 13.7
Static Margin
S.M. 0.047619 stable
S_w 4 f^2
(C_L_a)_w 0.09 (deg)^-1
x_w -0.03333 f
cbar 0.7 f
(C_L_a)_ht 0.059 (deg)^-1
de/da 0 Fig. 11.3
h_ht 0.7
l_ht 2.4 f
S_ht 0.6 f^2
V_bar_hs 0.514286
wing effect -0.24555 stable check: C_M_a =-S.M.*C_L_a
h. tail effect 1.216962 unstable
C_M_a -1.46252 stable
A_w 10
L 0 deg
l 0.4
S_w 4 f^2
b 6.3 f
z_w -0.125 f
C_L (cruise) 0.27
h 0.333333 f
w 0.458333 f
Vol_f 0.047871 f^3 82.721
(C_L_a)_vs 0.023541 (deg)^-1
l_vs 2.15 f
S_vs 0.784 f^2
L_vs 0 deg
V_bar_vs 0.066889
(1+ds/db)q/q 0.96388 Eq[11.42]
v. tail effect 0.086961 Eq[11.40] stable
fuse. effect -0.0018 Eq[11.44] unstable
wing effect 0.00058 Eq[11.43] stable
C_n_b 0.085745 stable
C_L _b -0.08575 stable
Wing Parameters:
Fuselage Parameters:
Vertical Tail Parameters:
Calculations
Center of Gravity
Longitudinal Stability Coefficient:
Wing Parameters:
Horiz. Tail Paramters:
Calculations
Directional Stability Coefficient:

Page | 34
Appendix B: Detailed Drawings
Figure B - 1. Full plane modular assembly.

Page | 35
Figure B - 2. Nosecone and wingbox drawings.

Page | 36
Figure B - 3. Cargo bay drawing.
Page | 37
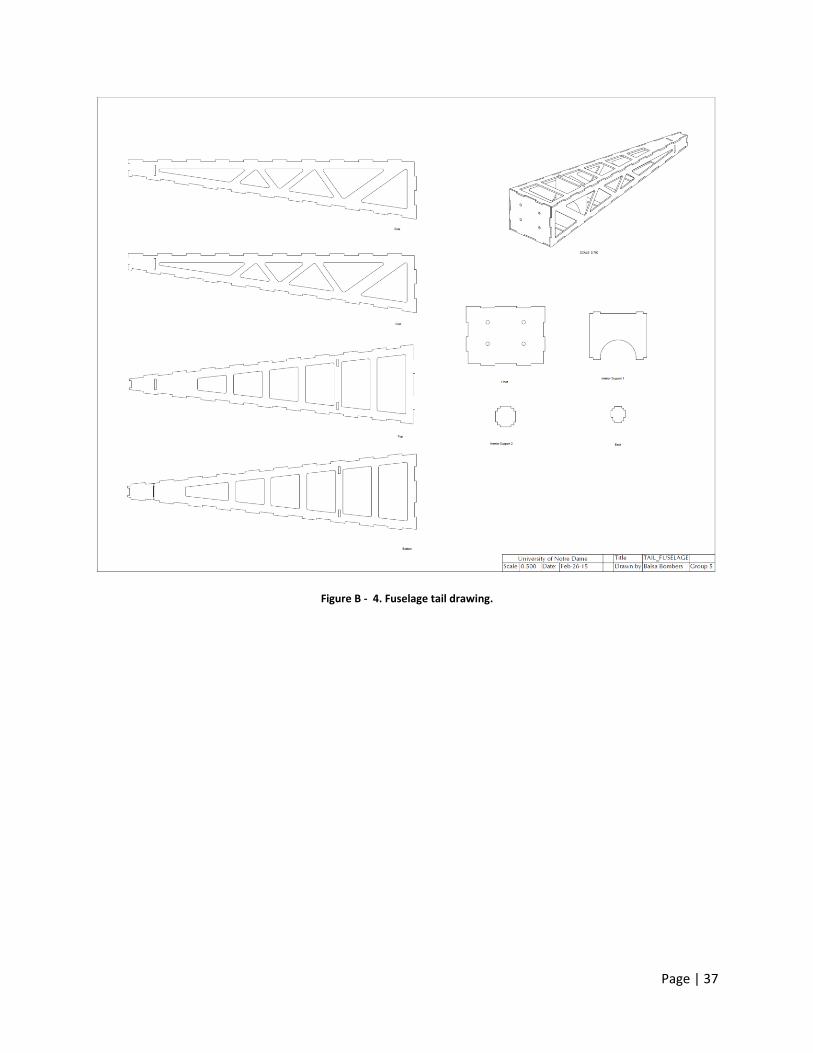
Figure B - 4. Fuselage tail drawing.

Page | 38
Figure B - 5. Left wing drawing.

Page | 39
Figure B - 6. Tail drawing.

Page | 40
Figure B - 7. Three view aircraft drawing.

Page | 41
Appendix C: Video Snapshots of Fatal Crash
Page | 42
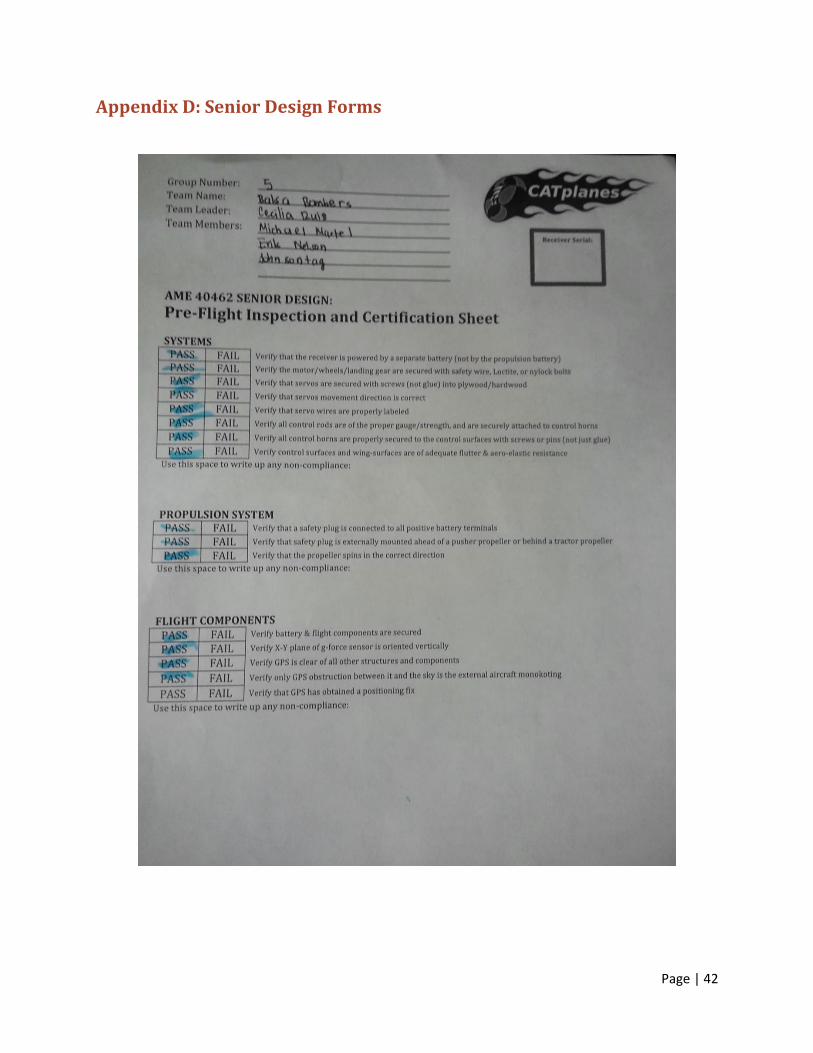
Appendix D: Senior Design Forms

Page | 43

Page | 44

Page | 45


![Dear Opera-goer, de Buenos Aires... · Dear Opera-goer, Let me offer an enthusiastic welcome to all who ... Argentine father of the [Argentine] tango, Astor Piazzolla, the tango opera,](https://static.fdocuments.us/doc/165x107/5f055ef17e708231d412a0eb/dear-opera-goer-de-buenos-aires-dear-opera-goer-let-me-offer-an-enthusiastic.jpg)