u.osu.edu · Web viewCurbing Earnings Management: Experimental Evidence on how Clawbacks Provisions...
49
Curbing Earnings Management: Experimental Evidence on how Clawbacks Provisions and Board Monitoring Affect Managers’ use of Discretion Abstract Concerns about earnings management and financial reporting quality have lead regulators to propose rules that clawback incentive-based compensation from managers when there is a financial restatement. Earnings management (EM) could, in theory, be curbed by internal governance mechanisms (e.g., strong boards) or by external governance mechanisms (e.g., clawbacks and other rules). We experimentally examine the impact of mandated clawbacks on managers’ EM behavior, conditional on firms’ board type (strong versus weak) We posit that aggregate earnings management will not be affected by mandated clawbacks. When boards are weak, we predict that mandated clawbacks simply shift EM from accrual-based methods to real-activities manipulation. When boards are strong, we predict that clawbacks will have little impact on EM. Our results are consistent with these predictions and suggest that clawbacks, at best, do little to deter EM (when boards are strong) and, at worst, may have counter-productive effects (when boards are weak).
Transcript of u.osu.edu · Web viewCurbing Earnings Management: Experimental Evidence on how Clawbacks Provisions...

Curbing Earnings Management: Experimental Evidence on how Clawbacks Provisions and Board Monitoring Affect Managers’ use of Discretion
Abstract
Concerns about earnings management and financial reporting quality have lead regulators to propose rules that clawback incentive-based compensation from managers when there is a financial restatement. Earnings management (EM) could, in theory, be curbed by internal governance mechanisms (e.g., strong boards) or by external governance mechanisms (e.g., clawbacks and other rules). We experimentally examine the impact of mandated clawbacks on managers’ EM behavior, conditional on firms’ board type (strong versus weak) We posit that aggregate earnings management will not be affected by mandated clawbacks. When boards are weak, we predict that mandated clawbacks simply shift EM from accrual-based methods to real-activities manipulation. When boards are strong, we predict that clawbacks will have little impact on EM. Our results are consistent with these predictions and suggest that clawbacks, at best, do little to deter EM (when boards are strong) and, at worst, may have counter-productive effects (when boards are weak).
I. INTRODUCTION
An extensive literature in accounting documents earnings management (EM) by firms
(Healy and Wahlen 1999, Nelson et al. 2002, Dichev et al. 2013). Healy and Wahlen (1999)
posit that “earnings management occurs when managers use judgment in financial reporting and
in structuring transactions to alter financial reports (p.368).” By exercising judgment or
discretion both in terms of accounting estimates and in terms of operational decisions, managers
can slant reported accounting numbers in a direction of their choice. This discretion available to
managers can be constrained by external governance mechanisms such as regulatory rules that
make it costlier to engage in EM. Alternatively, they can be constrained by internal governance
mechanisms such as monitoring by boards. Even regulators do not unanimously agree that rules
are better than internal governance when it comes to constraining managerial discretion. For
example, SEC Commissioner Gallagher, in a dissenting note against the Dodd-Frank clawback
rules notes that the proposed rules reflect a view that “a corporate board is the enemy of the
shareholder, not to be trusted to do the right thing”, implying that boards could accomplish part
(if not all) of the objectives of clawback rules (Gallagher 2015). There has however been little
empirical evidence on the relative effectiveness of internal versus external governance
mechanisms in curtailing EM. In this paper, we address this gap by examining the relative
impact of rules (clawbacks) versus monitoring (strong boards) on EM.
The literature on EM distinguishes between two broad methods of managing earnings.
Following this literature, we refer to the use of accounting discretion to manage earnings as
accruals-based earnings management (AEM) and the use of operational discretion to influence
reported earnings numbers as real earnings management (REM). REM differs from AEM in two
key respects—REM usually has direct cash flow consequences, AEM does not. REM can affect
a firm’s competitive advantage, AEM typically does not. We refer to the aggregate earnings
1
management using these two methods as total earnings management (TEM). Our study
experimentally examines how clawbacks versus boards influence managerial discretion and, in
turn, impact the various forms of EM.
Understanding the relative impact of clawbacks versus boards in curbing managerial
discretion is important for both theoretical and practical reasons. First, as noted earlier, empirical
evidence for the relative effectiveness of the two governance mechanisms on EM is limited.
Second, from a theoretical perspective, the tradeoff between REM and AEM represents an
important research area that remains largely unexamined (Libby et al. 2015). Although survey
evidence suggests that managers prefer REM to AEM (Graham et al. 2005), there is little
evidence in a controlled setting that speaks to the issue of whether managers trade-off AEM and
REM and how this tradeoff impacts TEM. Our experiment provides empirical evidence on how
managers make this tradeoff and its impact on TEM. Specifically, we argue that these two
governance mechanisms have varying influence on managers’ discretion resulting in differential
effects on AEM, REM, and TEM. Finally, from a policy perspective, regulators believe that
clawbacks, ultimately, improve financial reporting quality (SEC 2015).1 However, our
theoretical predictions, detailed below, suggest that while clawbacks may improve financial
reporting quality (by decreasing AEM), this improvement could come at the cost of increased
REM. Evidence on this claim should be of interest to regulators and other stakeholders in a firm
who may be concerned, not just about AEM, but also about the aggregate level of earnings
management—TEM—and how it can affect firm competitiveness in the long run.
We compare the impact of clawbacks versus strong board monitoring to a baseline
condition where there is no clawback and the board is weak. Relative to this baseline, we expect
1 The final rules proposed by the Securities and Exchange Commission requiring companies to adopt clawback provisions proposed under Dodd-Frank Act (2010) are titled: “Proposed Rules Designed to Improve Quality of Financial Reporting and Enhance Accountability Benefiting Investors” (emphases ours)
2
that clawbacks will reduce AEM, but this decrease will be offset by a corresponding increase in
REM which is beyond the purview of regulators. Clawbacks create incentives to avoid AEM by
making it potentially costlier (only AEM could lead to restatements which, in turn, trigger
clawbacks), but they also create behavioral incentives that make REM more appealing.
We develop our arguments and hypotheses by drawing on motivated reasoning theory
which posits that people’s directional preferences can influence how they evaluate, recall, and
search for information. A manager who recognizes that AEM is a potentially costlier option
because of clawbacks could more actively seek out and rationalize REM. For example, a project
that was previously thought to be an indispensable part of the firm’s marketing strategy may now
seem to be a perfectly reasonable candidate for a cut (to meet an earnings benchmark). Because
of this substitution effect (from AEM to REM), collectively, we expect TEM to be unaffected by
clawbacks relative to the baseline condition.
In contrast, strong boards, by definition, make managers more accountable and prior
research shows that accountability attenuates motivated reasoning (Crowley and Zentall 2013,
Lerner and Tetlock 1999). Managers are more likely to be held accountable both for accounting
estimates (AEM) and operational choices (REM). Consequently, we expect monitoring by strong
boards to reduce both AEM and REM such that TEM will be lower relative to our baseline
condition.
We test our predictions experimentally. We believe that an experiment is particularly
appropriate to address our research question for several reasons. First, the biggest challenge
facing archival studies testing for earnings management is specifying what earnings would be
under the null hypothesis—that is, what would unmanaged earnings look like (Jacob and
Jorgensen 2007). An experimental setting allows us to address this challenge directly with a
3
control / baseline condition which differs from our treatment conditions in only one respect (the
presence of clawbacks or monitoring by strong boards). Second, it is difficult to ascertain in
archival studies whether reductions in operational expenses are a function of changed business
conditions or a consequence of EM motivations. Holding constant all other factors except our
treatment of interest allows us to draw stronger causal inferences related to EM. Third, unlike
archival studies that are limited to examining the effects of existing regulatory regimes, an
experimental setting allows us to study the potential impact of a proposed regulatory regime (the
Dodd-Frank clawback provisions) for which archival data are unavailable (Kachelmeier and
King 2002, Libby et al. 2015).
We test our predictions experimentally using a 2 × 2 between-participants design. Our
two manipulations are clawbacks (present versus absent) and board strength (strong versus
weak). Across conditions, executive-MBA participants in the role of a CEO for a hypothetical
firm are told that their firm is significantly short of analysts’ earnings estimates for the upcoming
quarter—missing this benchmark could negatively affect the firm’s stock price, lead to
downgrades by analysts, and result in lost bonuses across the organization. The CEO can choose
to cut selling, general and administrative expenses (SG&A) in the current quarter to ensure that
the firm meets or exceed analysts’ earnings estimates.
The firm can cut SG&A by doing one or more of the following: (a) decrease the accrual
for warranty expense (AEM) or (b) postpone advertising expenses in the last quarter and reduce
current year expenses (REM) or (c) choose not to interfere in the financial reporting process.
Choices (a) and (b) are not mutually exclusive. That is, participants can choose some
combination of (a) and (b). Importantly, a dollar reduction in the warranty expense has exactly
the same impact on reported earnings per share (EPS) as a dollar reduction in advertising
4
expense. The dollar amounts cut from warranty expense, advertising expense, and the aggregate
cut in SG&A represent the dependent variables used to test our predictions relating to AEM,
REM, and TEM respectively.
In our baseline condition, there is no threat of clawback and monitoring by the board is
weak (the board has rubber-stamped CEO decisions in the past). In the clawback condition, we
tell participants that if they choose to manage accruals, there is a high probability of restatement
and they will be forced to return any bonus in the event of a restatement. In the (strong) board
condition, participants are told that the board has overruled the CEO’s proposals on four
occasions in the last three years on grounds of violating shareholder interests.2 All other
information is held constant across conditions.
Our results are broadly consistent with our predictions. Relative to our baseline condition,
clawbacks do not significantly impact TEM. We find that clawbacks reduce AEM, but they also
increase REM, as predicted. In contrast, monitoring by strong boards significantly reduces AEM,
REM, and TEM. We thus find that monitoring by strong boards may be a better mechanism to
curtail TEM. We also find some evidence of motivated reasoning. Managers who shift from
AEM to REM (under clawbacks) believe that their long-run competitive advantage will remain
intact even though their short-run competitive advantage will suffer, suggesting a biased
interpretation of the outcomes of REM.
Our study contributes to the literature on earnings management. First, we find that externally
mandated clawbacks reduce financial misstatements but that this reduction comes at the cost of
increased REM. While other studies (Chan et al, 2015) have found similar evidence for the
substitution effect of clawbacks, our study differs from them in important ways. First, Chan et al.
2 Our fourth condition where there is both a clawback and a strong board allows us to test the incremental effect of clawbacks over boards in our specific context. Because we do not have a specific prediction related to this condition, a detailed discussion of this condition is deferred to later sections.
5
study voluntary clawbacks adopted by firms whereas we study mandatory clawbacks proposed
by regulators. Even if voluntary clawbacks reduce restatements, Denis (2014) provides
compelling reasons why it is not certain that externally mandated clawbacks will yield a similar
result. Second, our evidence related to the substitution of AEM with REM comes from a
controlled experimental setting allowing us to make stronger causal inferences about precisely
what is driving this substitution. Third, our study proposes and finds that this substitution effect
can be mitigated by an internal governance mechanism—strong boards—while also mitigating
TEM.
Results of our study also clarify survey evidence suggesting that managers prefer REM to
AEM (Graham et al. 2005) by showing that this preference depends on the strength of firms’
internal governance mechanisms. In that sense, our evidence suggests that managerial discretion,
which underlies most of EM, is malleable, but firms’ internal governance mechanisms can
provide a check on the extent of this malleability. Our results suggest that policy makers who
view restatements as the most egregious symptom of EM may, indeed, be able to curtail
restatements with clawbacks, but at the cost of REM, which could damage firms’ long-term
competitiveness.
The rest of the paper is organized as follows. Section 2 outlines our theory and hypotheses.
Section 3 describes our experiment designed to test our hypotheses. Section 4 describes the
results and section 5 concludes with implications.
II. BACKGROUND AND THEORY
EARNINGS MANAGEMENT AND MANAGERIAL DISCRETION
Anecdotal and empirical evidence suggests that firm managers face considerable pressure
to meet external earnings benchmarks—specifically, analysts’ earnings estimates (Levitt 1998,
6
Kasznik and McNichols 2002, Brown and Caylor 2005, Graham et al. 2005). A large body of
research provides evidence that firms manage earnings around this benchmark (see Healy and
Wahlen 1999 and Dichev et al. 2013 for surveys of the earnings management literature).
Importantly, while markets appear to reward (punish) firms that meet/exceed (miss) this
benchmark, markets do not appear to clearly distinguish between firms based on how this
benchmark is met. The stock-price premium that accrues to firms that meet/exceed the
benchmark through earnings management is only marginally different from the premium that
accrues to firms that meet/exceed the benchmark without managing earnings (Bartov et al.
2002). In addition to firm-level benefits, there are individual benefits to managers to meet
earnings benchmarks. Performance-related bonuses are often linked to meeting earning
benchmarks (Armstrong et al. 2017). There is thus a clear incentive for managers to meet earning
benchmarks by managing earnings.
Managers facing a shortfall between their “unmanaged” earnings and analysts’ earnings
estimates can bridge the gap by using the discretion available to them from two broad sources.
The inherent discretion available in GAAP provides managers some latitude to report an income
number consistent with their preferences.3 For example, managers could use accounting
discretion and accrue a lower-than-usual allowance for bad and doubtful accounts, leading to an
income-increasing accrual. A second source of managerial discretion comes from operational
decisions. For example, managers can defer an R&D project to a subsequent accounting period,
again, leading to an increase in reported income for the current period, but this time not due to an
accrual. Following prior literature (e.g., Roychowdhury 2006), we refer to the use of accounting
discretion to manage earnings as accruals-based earnings management (AEM) and the use of
3 The discretion available under GAAP to manage accruals, however, is (a) not unlimited (Barton and Simko 2002) (b) does not always have to be income-increasing (Wahlen, Baginski & Bradshaw 2010) and (c) does not necessarily have to be against shareholder interest (Arya et al. provide a signaling story).
7
operational discretion to influence reported earnings numbers as real earnings management
(REM).
However, both forms of earnings management rely on managerial discretion. The role of
discretion is important because its presence suggests that explicit rules will not be able to
eliminate gamesmanship from managers attempting to achieve their preferred financial reporting
objectives. In addition, this inherent discretion can leave the decisions of even well-intended
managers open to bias, as explained later.
CORPORATE GOVERNANCE AND MANAGERIAL DISCRETION
Although definitions of corporate governance vary widely (Brickley and Zimmerman
2010), much of corporate governance is concerned with the constraints that managers place on
themselves or that investors place on managers to constrain managers from using their discretion
against the interest of investors (Shleifer and Vishny 1997). More specifically, corporate
governance can be viewed as “[a] collection of control mechanisms … to prevent or dissuade
potentially self-interested managers from engaging in activities detrimental to the welfare of
shareholders and stakeholders” (Larcker and Tayan 2011). These mechanisms that seek to
control managers’ discretion can be imposed by regulators or by a firm’s board of directors. We
examine two specific mechanisms that curtail managerial discretion and aim to deter earnings
management.
Externally mandated clawbacks are regulatory provisions that require managers to return
their incentive-based compensation if a firm restates its financial statements and it is determined
that managers were not entitled to the incentive-compensation based on the restated financials.
Clawbacks were mandated as part of the Sarbanes-Oxley Act (2002), but the scope of clawbacks
has expanded considerably under the provisions of the Dodd-Frank Act (2010). Mandatory
8
clawbacks are triggered only when firms restate their financial statements. Prior research
suggests that earnings management is a leading cause of financial restatements (Ettredge et al.
2010, Richardson et al. 2002). The implicit regulatory presumption behind clawbacks is that they
will deter managers from managing earnings and, thus, curtail restatements.4
A second mechanism for constraining managerial discretion is a strong board.
Empirically, Hazarika et al. (2012) provide evidence that strong boards act proactively to
discipline managers’ accrual manipulations well before the earnings management leads to a
restatement. Anecdotal evidence suggests that strong boards are also likely to constrain
operational decisions of a CEO that could destroy shareholder value. For instance, in 2001, Coca
Cola’s board turned down the CEO’s proposal to acquire Quaker Oats on the grounds that it
diluted shareholder interests (Mckay and Deogun, 2000). In 2009, General Motor’s board over-
ruled the CEO’s proposal to sell Opel forcing the CEO to resign (Vlasik, 2009). The knowledge
that strong boards could overrule their proposals could deter / constrain CEOs from exercising
their accounting or operational discretion.
The key difference between externally mandated clawbacks and boards when it comes to
constraining earnings management is that rules focus only on one source of discretion—
accounting discretion—leaving managers’ operational discretion unchecked. Boards, on the
other hand, can constrain both accounting and operational discretion (particularly when the board
believes that the discretion is likely against shareholder interests) and, can, in theory be far more
effective. Regulators and governance theorists seem to agree. For instance, Arthur Levitt, the
former commissioner of the SEC, in his “numbers game” speech, which focused largely on
4 See, for instance, comments from the SEC commissioners (emphases ours). Commissioner Aguilar (2015) stated that “the existence of a clawback policy should, among other things, incentivize executives to create a culture of compliance that results in accurate reporting of financial performance. The end result is that, hopefully, fewer financial statements will be required to be restated.” SEC Chair White stated that “the proposed rules would result in increased accountability and greater focus on the quality of financial reporting, which will benefit investors and the markets.”
9
earnings management, opined: “[t]his (earnings management) is a financial community problem.
It can't be solved by a government mandate: it demands a financial community response.” In a
similar vein, Jensen (1993) posits that “[t]he legal/political/regulatory system is far too blunt an
instrument to handle the problems of wasteful managerial behavior effectively.”5
Empirical evidence about the relative effects of these two sources of constraints on
managerial discretion is scarce.6 Most of the research has focused on the examining the relative
presence (absence) of the different types of earnings management without any particular focus of
rules versus monitoring constraints on managerial discretion. In addition, one criticism of the
empirical archival literature on EM is that any earnings management identified may be a result of
an omitted variable or could be capturing behavior other than intentional manipulation (Gunny
2010, Ball 2013). We, therefore, use an experimental setting that allows us to partly overcome
these criticisms by holding constant managerial incentives and the underlying economics of the
firm constant and ask the question: How do mandated clawbacks and boards influence
managerial discretion when managers face pressure to meet an external earnings benchmark? We
present our predictions in the next section.
CLAWBACKS AND MANAGERIAL DISCRETION
Our baseline case is where managers’ discretion is unconstrained, either by mandated
clawbacks or by strong boards. In this scenario, we expect managers to use both the accounting
and operational discretion that is available to them to fully meet any shortfall between
unmanaged earnings and the analysts’ consensus estimates. That is, we expect managers to
5 Also see Jensen (1986): “the external takeover market serves as a court of last resort that plays an important role in …….protecting shareholders when the corporation's internal controls and board-level control mechanisms are slow, clumsy, or defunct.”6 “[t]here is also a lack of literature examining interactions among accounting choices and how they are affected by context and the regulatory environment. The tradeoff between real and accruals earnings management represents one such broad category. Very few papers (including archival papers) over the last decade have examined this issue.” (Libby et al. 2015 p. 35)
10
engage in both AEM and REM such that they can meet the earnings benchmark. 7 This,
presumably, is the scenario that regulators are most concerned about. We expect however that
imposing a mandatory clawback will not significantly affect TEM relative to this baseline
condition. We argue that this occurs because mandatory clawbacks reduce manager’s propensity
to engage in AEM, but increase their propensity to engage in REM— in other words, a
substitution effect occurs—for two reasons.
The first reason for this substitution is strategic. AEM (particularly if it is aggressive)
increases the likelihood of restatements (Ettredge et al. 2010, Richardson et al. 2002).
Restatements trigger clawbacks and it is reasonable to expect managers to decrease AEM if it
increases the likelihood of subsequent restatement and, therefore, clawback. REM, on the other
hand, is relatively immune to regulatory scrutiny and managers have wide latitude when it comes
to discretionary spending decisions. Prior research shows that managers tradeoff AEM and REM
(Zang 2012, Bradeschter 2011). Therefore, if AEM becomes costly, it is likely that managers
will switch to REM for purely strategic reasons.
A second reason draws on research in psychology examining how people’s directional
goals influence how they evaluate, recall, and search for information. In our setting, a manager
facing a potential shortfall from analysts’ earnings estimates has a clear directional preference to
reduce expenses (either accruals or actual) in order to meet/exceed analysts’ earnings estimates.
This preference is likely to bias the way that manager evaluates information and the subsequent
judgments he makes—a psychological process known as motivated reasoning (Kunda 1990,
Epley and Gilovich 2016). Once the manager recognizes that AEM is a potentially costlier
7 We are agnostic about whether managers will utilize AEM or REM more in this baseline scenario. Although survey evidence suggests that managers have a distinct preference for REM (Graham et al), there is a large literature documenting that managers engage in accruals manipulation . Our predictions do not depend on the relative extent of AEM and REM, but if managers rely exclusively (or even largely) on REM in the baseline scenario, it would work against our ability to find support for our hypotheses.
11
option because of clawbacks, the manager may more actively seek out and rationalize REM. A
project that was previously thought to be an indispensable part of the firm’s fourth-quarter
marketing strategy may now seem to be a reasonable candidate for a cut. Importantly, motivated
reasoning may allow the manager to conclude that delaying the project to the next quarter may
not really impede the firm’s long-term competitive advantage. The inherent uncertainty of
operational outcomes allows managers to more easily engage in motivated reasoning and leads to
the same substitution effect from AEM to REM described earlier. Hribar et al. (2017) show that
bank’s loan-loss provisions (accruals) are influenced both by strategic discretion and
unintentional errors (based on sentiment), further supporting our expectation that both processes
can simultaneously (and additively) impact the substitution effect that we expect. Formally
stated:
H1a: Mandated clawbacks will not impact TEM relative to our baseline condition.H1b: Mandated clawbacks will reduce AEM relative to our baseline condition.H1c: Mandated clawbacks will increase REM relative to our baseline condition.
BOARDS AND MANAGERIAL DISCRETION
We turn next to the impact of strong boards relative to our baseline case where managers’
discretion is unconstrained, either by mandated clawbacks or by boards. In contrast to clawbacks,
we expect that strong boards will lead to a decrease in both AEM and REM relative to our
baseline condition. In other words, we do not expect a substitution effect. Consequently, we
expect a reduction in TEM when boards are strong relative to our baseline condition.
The pressure to meet external benchmarks does not disappear when firms have strong
boards, but strong boards provide an important constraint to motivated reasoning—
accountability. Crowley and Zentall (2013) argue that the most efficient way to attenuate
motivated reasoning seems to be accountability. They argue that having to justify one’s actions
12
to an audience can make people anticipate potential counter-arguments and impose greater
discipline on the arguments they generate. Consequently, they may change their mind—often,
though not always, for the better (Lerner & Tetlock 1999). Empirical evidence suggests that
strong boards deter attempts at AEM (Hazarika et al. 2012), but evidence that strong boards
constrain managers’ REM attempts is scarce. Prior research shows that even subtle cues that one
is under scrutiny can have large effects on behavior in real-world contexts (Bateson et al. 2006,
Burnham and Hare 2007). Therefore, we predict that even the expectation that one will be held
accountable can substantially attenuate motivated reasoning. Formally:
H2a: Strong boards will reduce TEM relative to our baseline condition.H2b: Strong boards will reduce AEM relative to our baseline condition.H2c: Strong boards will reduce REM relative to our baseline condition.
III. EXPERIMENT
PARTICIPANTS
Participants in our experiment are 127 students from an executive MBA program from a
top-ranked MBA program in the south-eastern U.S. On average, our participants have 14 years
of work experience and are 37 years old. This provides us some assurance that our participants
are likely to understand the incentive-structures for senior managers of publicly-traded firms
which is important, given our research question and our experimental context. Given our
participant pool, we do not expect that monetary incentives for participation will induce them to
exert additional effort on the experimental task. Consistent with other studies that employ a
comparable participant pool and examine questions related to earnings management (Clor Proell
and Maines 2014, Rose et al. 2014), we do not pay our participants for their participation.
PROCEDURE & SETTING
13

Participants in our experiment assume the role of a CEO of a hypothetical firm—Zeta.
They first see summarized financial statement data for three years for this firm. These data
suggest that Zeta’s recent financial performance has been strong. They are told that Zeta has met
or exceeded analysts’ EPS expectations in the past three years. Next, they are told that, for the
upcoming year, Zeta expects to fall short of analysts’ consensus EPS estimate. The principal
decision that participants make is how to deal with this shortfall. As we describe in greater detail
below, the choice(s) that participants make to address this shortfall represent(s) our primary
dependent variable. Before proceeding to the choices available to them to help them with their
decision, participants are told that if Zeta misses analysts’ earnings estimates, Zeta’s stock price
could decline, Zeta’s stock could be downgraded and employee bonuses across the board would
not be paid.8
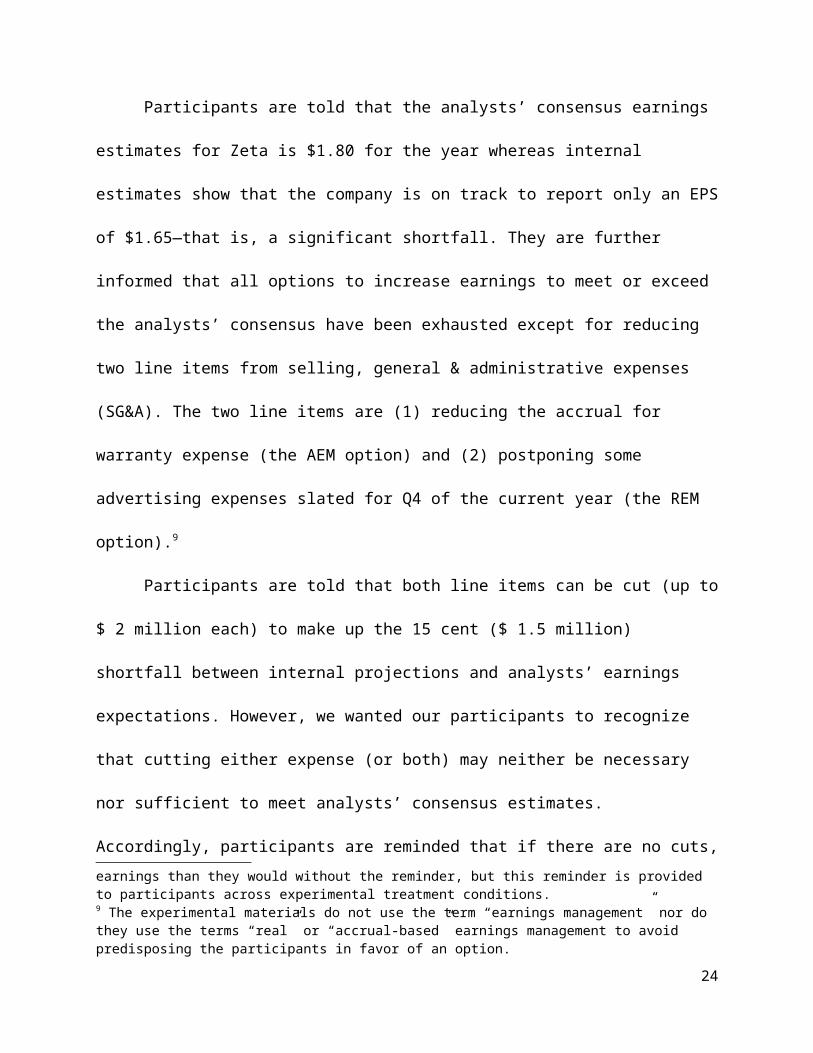
Participants are told that the analysts’ consensus earnings estimates for Zeta is $1.80 for
the year whereas internal estimates show that the company is on track to report only an EPS of
$1.65—that is, a significant shortfall. They are further informed that all options to increase
earnings to meet or exceed the analysts’ consensus have been exhausted except for reducing two
line items from selling, general & administrative expenses (SG&A). The two line items are (1)
reducing the accrual for warranty expense (the AEM option) and (2) postponing some
advertising expenses slated for Q4 of the current year (the REM option).9
Participants are told that both line items can be cut (up to $ 2 million each) to make up
8 We believe that the pressure to meet earnings benchmarks represents a key setting where earnings management pressures come to the fore. Anecdotal and survey evidence suggests that managers are keenly aware of the importance of meeting or exceeding analysts’ consensus (Graham et al. 2005). Several papers document the importance of meeting or beating analysts’ earnings expectations (MBE) and also the negative consequences of having a string of MBE interrupted (Burgstahler and Dichev 1997, Cheng and Warfield 2005). We remind participants of some of the adverse consequences associated with missing analysts’ estimates. Arguably, this reminder could encourage more participants to manage earnings than they would without the reminder, but this reminder is provided to participants across experimental treatment conditions. 9 The experimental materials do not use the term “earnings management” nor do they use the terms “real” or “accrual-based” earnings management to avoid predisposing the participants in favor of an option.
14
the 15 cent ($ 1.5 million) shortfall between internal projections and analysts’ earnings
expectations. However, we wanted our participants to recognize that cutting either expense (or
both) may neither be necessary nor sufficient to meet analysts’ consensus estimates.
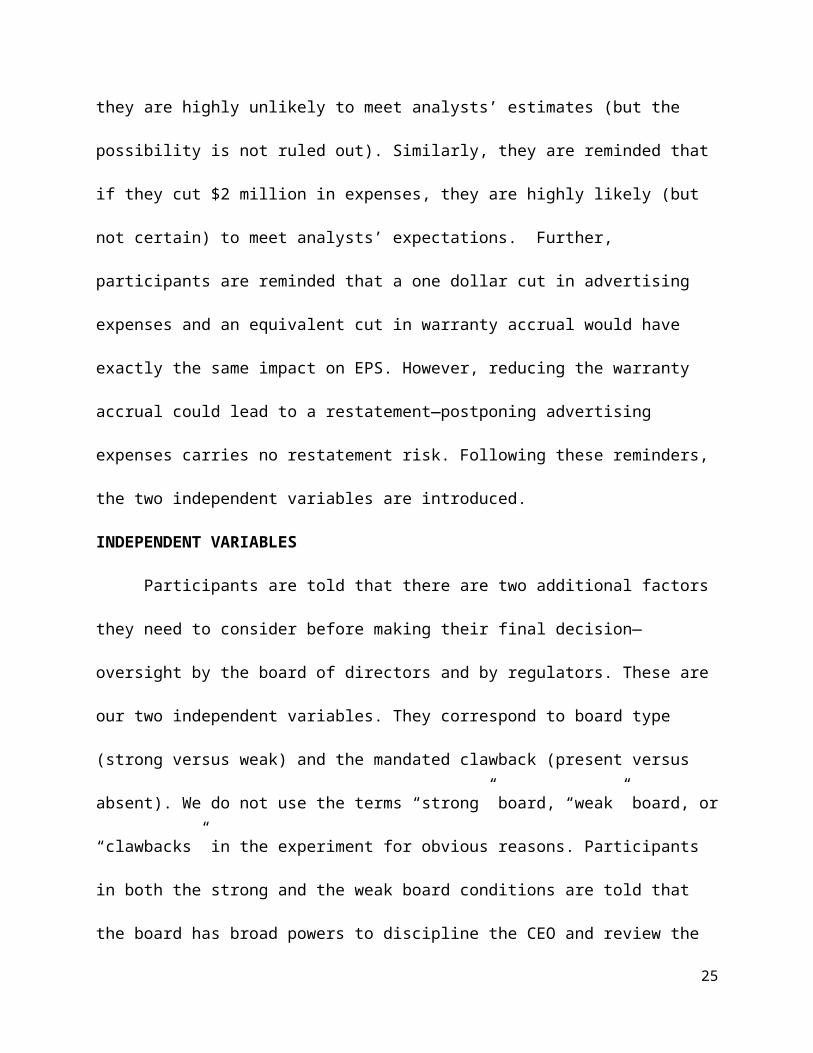
Accordingly, participants are reminded that if there are no cuts, they are highly unlikely to meet
analysts’ estimates (but the possibility is not ruled out). Similarly, they are reminded that if they
cut $2 million in expenses, they are highly likely (but not certain) to meet analysts’ expectations.
Further, participants are reminded that a one dollar cut in advertising expenses and an equivalent
cut in warranty accrual would have exactly the same impact on EPS. However, reducing the
warranty accrual could lead to a restatement—postponing advertising expenses carries no
restatement risk. Following these reminders, the two independent variables are introduced.
INDEPENDENT VARIABLES
Participants are told that there are two additional factors they need to consider before
making their final decision—oversight by the board of directors and by regulators. These are our
two independent variables. They correspond to board type (strong versus weak) and the
mandated clawback (present versus absent). We do not use the terms “strong” board, “weak”
board, or “clawbacks” in the experiment for obvious reasons. Participants in both the strong and
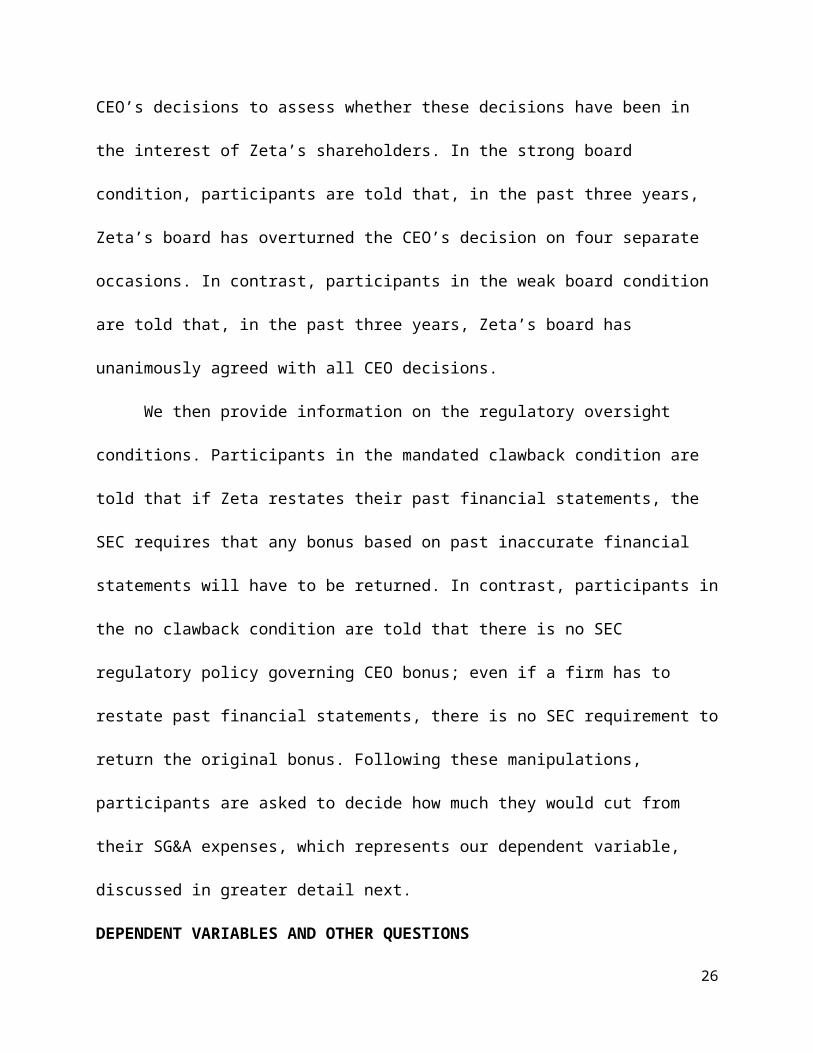
the weak board conditions are told that the board has broad powers to discipline the CEO and
review the CEO’s decisions to assess whether these decisions have been in the interest of Zeta’s
shareholders. In the strong board condition, participants are told that, in the past three years,
Zeta’s board has overturned the CEO’s decision on four separate occasions. In contrast,
participants in the weak board condition are told that, in the past three years, Zeta’s board has
unanimously agreed with all CEO decisions.
We then provide information on the regulatory oversight conditions. Participants in the
15
mandated clawback condition are told that if Zeta restates their past financial statements, the
SEC requires that any bonus based on past inaccurate financial statements will have to be
returned. In contrast, participants in the no clawback condition are told that there is no SEC
regulatory policy governing CEO bonus; even if a firm has to restate past financial statements,
there is no SEC requirement to return the original bonus. Following these manipulations,
participants are asked to decide how much they would cut from their SG&A expenses, which
represents our dependent variable, discussed in greater detail next.
DEPENDENT VARIABLES AND OTHER QUESTIONS
Participants are told to assume that it is sufficiently early in the fourth quarter such that
they have enough time to effect reductions of either warranty accruals or advertisement expense
(or both). Participants are first asked to indicate in their proposal to the board by how much they
would cut SG&A, in aggregate. Participants were told previously that both warranty accruals and
advertisement expense fall under the broad head of SG&A. Next, we ask participants to
disaggregate this amount (assuming it was non-zero) between the warranty accrual and the
advertisement expense. Again, participants are reminded that they can cut one or both of these
items, or choose not to cut either. The only constraint imposed is that the sum of the two cuts
should add up to the amount they specified in response to the first question. Participants’
response to the first question (the total cut to SG&A) represents our measure of total earnings
management and their responses to the warranty accrual and the advertisement expense questions
represent our measure of AEM and REM respectively.
Following their responses to our dependent variables, participants indicate whether their
choice was consistent with shareholder value maximization and how they believe their choice
will affect Zeta’s competitive position and stock price, both in the short and in the long run.
16

Next, participants answer two questions to confirm that they understood the manipulations as we
intended. Finally, participants answer a question not directly related to Zeta. The first question
asks them to indicate the extent to which they think that company boards are more important in
ensuring that companies do not misreport their financials compared to external regulators like the
SEC. Before participants are dismissed, we obtain demographic information to check whether
any of their responses vary systematically based on demographic variables.
IV. RESULTS
MANIPULATION CHECKS
To check that participants understood our manipulations as intended, we ask participants
two questions. For the board strength manipulation, we asked participants to rate the extent to
which they thought that Zeta’s board was likely to challenge their decisions. As expected,
participants in the strong (weak) board condition indicated that the board was more (less) likely
to challenge their decisions (Likelihoodstrong = 4.10 > Likelihoodweak = 2.97, t=3.46, p = .001). For
the clawback manipulation, participants provided a true / false response to the following
question: “If Zeta is required to restate their financial statements, SEC regulations require that
you will have to return your bonus if the restated financials made you ineligible for the bonus.”
One hundred eleven of the 122 participants answered this question correctly, suggesting that
most participants understood our manipulations as intended.10 While our reported analyses are
based on all responses, our inferences remain the same if we exclude participants who failed
manipulation checks.
HYPOTHESES TESTS
10 Five participants decomposed their total earnings management (TEM) inaccurately into the AEM and the REM components. That is, their AEM and REM does not add up to the TEM. We drop these participants. Therefore, our sample comes down from 127 to 122 participants.
17

Our main prediction is that mandated clawbacks will not significantly affect total
earnings management (TEM), but monitoring by a strong board will. Table I presents descriptive
statistics for all our treatment conditions. Figure I graphically presents the results for our
baseline condition and the two primary treatment conditions—clawbacks and strong boards.
Both Table I and figure I suggest that our main prediction is supported. Table II presents formal
tests of our hypotheses.
Recall that managers’ cuts to warranty expense and to advertising expense represent our
proxy for AEM and REM respectively and the aggregate represents our proxy for TEM. H1a
predicts that mandated clawbacks will not impact TEM relative to our baseline condition. Our
results are consistent with this prediction (TEMbaseline = 1.69 versus TEMclawback = 1.55, t = .903, p
= 0.370). Further, as predicted by H1b, we find that clawbacks lead to a significant decline in
AEM (AEMbaseline = 0.72 versus AEMclawback = 0.28, t = 3.780, p < 0.001). Finally, as predicted by
H1c, we find that clawbacks increase REM (REMbaseline = 0.97 versus REMclawback = 1.27, t = -
2.023, p = 0.024). Overall, we find strong support for the substitution effect we predict in H1—
the decrease in AEM following mandated clawbacks is offset by a corresponding increase in
REM.
H2a predicts that strong boards will reduce TEM relative to our baseline condition.
Results are consistent with this prediction (TEMbaseline = 1.69 versus TEMboards = 1.30, t = 2.589, p
= 0.012). As predicted by H2b and H2c, we find that strong boards reduce both AEM and REM
relative to our baseline (AEMbaseline = 0.72 versus AEMboards = 0.52, t = 1.842, p = 0.035 and
REMbaseline = 0.97 versus REMclawback = 0.78, t = 1.571, p = 0.061). Overall, we find that strong
boards reduce earnings management across the board.
ADDITIONAL ANALYSES
18
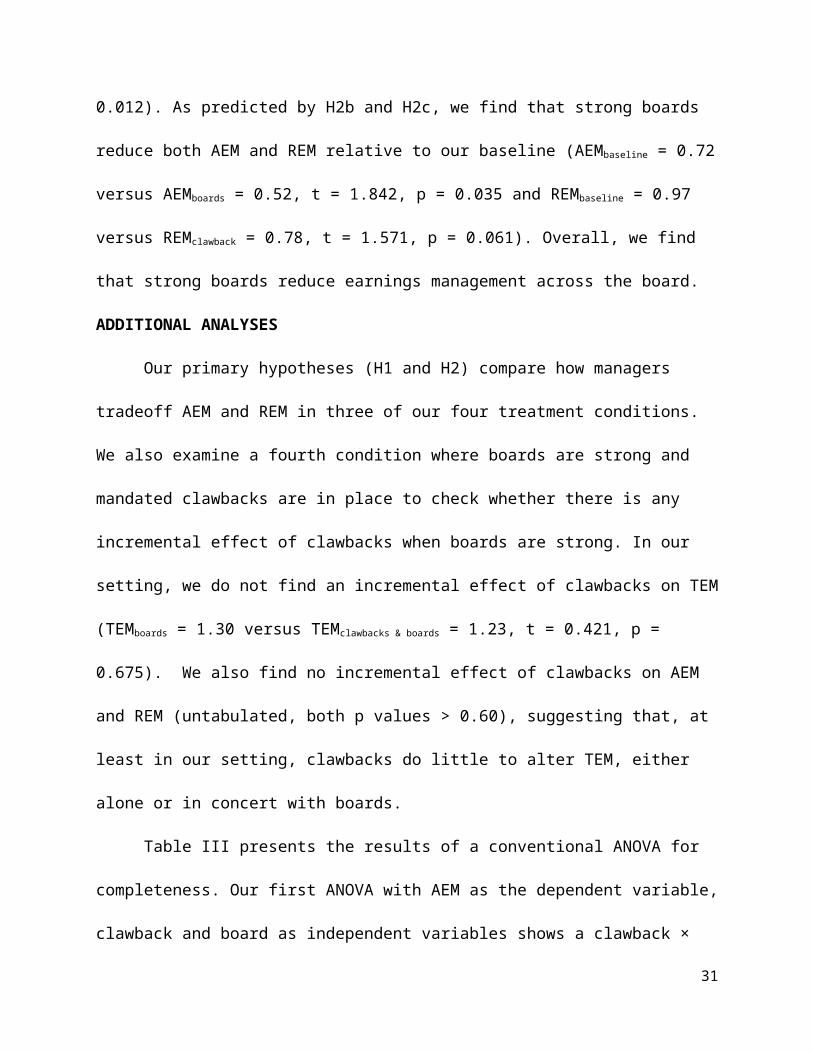
Our primary hypotheses (H1 and H2) compare how managers tradeoff AEM and REM in
three of our four treatment conditions. We also examine a fourth condition where boards are
strong and mandated clawbacks are in place to check whether there is any incremental effect of
clawbacks when boards are strong. In our setting, we do not find an incremental effect of
clawbacks on TEM (TEMboards = 1.30 versus TEMclawbacks & boards = 1.23, t = 0.421, p = 0.675). We
also find no incremental effect of clawbacks on AEM and REM (untabulated, both p values >
0.60), suggesting that, at least in our setting, clawbacks do little to alter TEM, either alone or in
concert with boards.
Table III presents the results of a conventional ANOVA for completeness. Our first
ANOVA with AEM as the dependent variable, clawback and board as independent variables
shows a clawback × board interaction effect (F = 6.898, p < .001). This interaction is consistent
with our primary result that mandated clawbacks decrease AEM and this decrease is steeper for
firms whose boards are weak than for firms whose boards are strong. That is, we find a
substitution between AEM and REM due to clawbacks, but not for firms with strong boards.
Next, an ANOVA with REM as the dependent variable also shows a significant clawback ×
board interaction effect (F = 3.322, p = .071). This interaction suggests that REM increases
significantly after clawbacks and this increase is steeper for firms with weak boards than for
firms with strong boards—the flip side of the substitution effect. Finally, an ANOVA with TEM
as the dependent variable shows a main effect for boards (F = 9.478, p = 0.003), consistent with
our main results. That is, strong boards curb TEM whereas clawbacks do not.
PROCESS MEASURES
Participants across treatment conditions believe that they are acting in the interest of
shareholder value maximization. On an 8-point scale ranging from 0 to 7 with higher values
19
indicating greater congruence with shareholder value maximization, participants across
conditions average 5.19, which is significantly above the midpoint (t = 13.7, p < 0.001). An
ANOVA by treatment condition reveals no significant difference in participants’ perceptions
across conditions that their decisions are consistent with shareholder value maximization (F =
0.807, p =.492).
However, participants in the clawback condition who shift from AEM to REM relative to
the baseline condition, on average, appear to recognize that this shift comes at some cost to
competitive advantage. On an 8-point scale (0 (7) indicating a negative (positive) impact on
competitive advantage), participants in the clawback condition, on average, rate that their cuts
could impact competitive advantage in the short-run more negatively than participants in the
baseline condition (3.269 vs. 4.074, t = -2.373, p = .021, 2-tailed). However, when the same
participants rate the long-run implications of their cuts on competitive advantage, this differential
assessment goes away (4.481 vs. 4.500, t = -.045, p = 0.964, 2-tailed). We interpret this result as
evidence of motivated reasoning―participants in the clawback condition appear to be
rationalizing that although the cuts to advertising expenses might affect their short-run
competitive advantage, these cuts will not affect the firm’s competitive advantage in the long-
run.
To better understand participants’ perceptions about how their decisions affect the firm in
the long run, we average their responses to two questions―how their total cuts affect the firm’s
stock price and competitive advantage in the long-run.11 We label this measure long-term impact
(LTI). A regression (untabulated) with LTI as the dependent variable, total earnings management
(TEM), board strength (BOARD), and the interaction term (TEM × BOARD) as independent 11 The Cronbach’s Alpha for these two measures is 0.86 suggesting that the two questions capture the same underlying construct. A factor analysis of participants’ responses to the post-experimental questions also reveal two clear factors―one denoting the long-run and the other denoting the short-run. Using the factor scores on the long-run factor as the dependent variable in the regression yields similar inferences.
20
variables reveals a significant TEM × BOARD interaction (p=0.03, one-tailed). Participants in
the weak board condition believe that TEM is positively associated with LTI whereas
participants in the strong board conditions believe that TEM is negatively associated with LTI.
We interpret this result as evidence consistent with our theory that strong boards constrain
motivated reasoning to some extent because participants’ views about the long-term impact of
their cuts appears to vary contingent on board strength.
We also run a regression with LTI as the dependent variable, total earnings management
(TEM), the likelihood of meeting / beating analysts’ benchmark (MB)12 and the interaction term
(TEM × MB) as independent variables. Again, the interaction term is significant―participants
who are likely (or highly likely) to meet the analysts’ earnings benchmark based on their cuts
believe that TEM is positively associated with LTI. In contrast, participants who are less likely to
meet the analysts’ benchmark believe that TEM is negatively associated with LTI. Again, this
result provides indirect evidence of motivated reasoning. Participants’ beliefs about the long-
term impact of their cuts should not depend on whether they meet or miss analysts’ benchmarks,
yet they do.
5. CONCLUSION
This study experimentally examines the relative impact of mandated clawbacks and
strong boards on managers’ earnings management behavior. We find that strong boards can
reduce TEM by reducing both AEM and REM relative to a baseline condition. Clawbacks,
however, do not appear to significantly impact TEM. Managers reduce AEM following
clawbacks, but this reduction in AEM in AEM is accompanied by a corresponding increase in
REM.
12 MB is an indicator variable that can assume one of two values―cuts below $1.5 million are coded as 1 (they are less likely to meet analysts’ benchmarks); cuts above $1.5 million are coded 0 (they are likely or highly likely to meet analysts’ benchmarks).
21
Our results suggest that mandated clawbacks are unnecessary at best and may have
counter-productive effects, at worst. When boards are strong, clawbacks do little to deter EM.
When boards are weak, clawbacks deter AEM, but substitute them with REM which could,
arguably, be more destructive to a firm. Policy makers who seek to curtail restatements may
indeed be able to do so with clawbacks, but the tradeoff in the form of increased REM could be
costly. Our results suggest that the regulatory emphasis on restatements as a means to reduce EM
may be misplaced. Instead, measures to strengthen boards may be more effective in curtailing
TEM thereby enhancing financial reporting quality.
Our experiment is subject to limitations. First, we use a very specific type of AEM
(warranty accruals) and REM (cutting advertising expense). Although these are representative
contexts in which EM has been studied, it is important to verify that our findings hold for
alternative contexts of AEM and REM. Second, governance theorists argue that externally
imposed sanctions can crowd out internal mechanisms for ensuring desirable behavior. Although
our experiment cannot speak to this important point, it is worth examining whether mandatory
clawbacks that curtail board discretion eventually end up weakening boards as feared by some
regulators (Gallagher 2015).
22
REFERENCES
Aguilar, J. 2015. Statement at an Open Meeting on Dodd-Frank Act “Clawback” Provision, U.S. Securities and Exchange Commission: retrieved from:
https://www.sec.gov/news/statement/making-executive-compensation-more-accountable-.html
Armstrong, C., J. Chau. C. Ittner, and J. Xiao. 2017. Internal versus external earnings per share goals andCEO incentives. Working Paper
Ball, R. 2013. Accounting Informs Investors and Earnings Management is Rife: Two QuestionableBeliefs. Accounting Horizons 27: 847-853.
Barton, J. AND P.J. Simko. 2002. The Balance Sheet as an Earnings Management Constraint. The Accounting Review 77: 1-27.
Bartov, E., D. Givoly, & C. Hayn. 2002. The rewards to meeting or beating earnings expectations. Journal of Accounting and Economics 33: 173-204.
Bateson, M., G. Nettle, and D. Roberts. 2006. Cues of being watched enhance cooperation in areal-world setting. Biology Letters. 2006. 412-414.
Burnham, T. C. & Hare, B. 2007. Engineering human cooperation – does involuntary neural activation increase public goods contributions? Human Nature 18: 88—108.
Brown, L., and M. Caylor. 2005. A Temporal Analysis of Quarterly Earnings Thresholds: Propensities and Valuation Consequences. The Accounting Review 80: 423-440.
Badertscher, B. 2011. Overvaluation and the Choice of Alternative Earnings Management Mechanisms. The Accounting Review 86: 1491-1518.
Brickley, J.A., and J. Zimmerman. 2010. Corporate governance myths: Comments onArmstrong, Guay, and Weber. Journal of Accounting and Economics 50: 235-
245.
Burgstahler, D. and I. Dichev. 1997. Earnings management to avoid earnings decreases and losses. Journal of Accounting and Economics 24: 99-126.
Chan, L. H., Chen, K. C., Chen, T. Y., & Yu, Y. 2015. Substitution between real and accruals-based earnings management after voluntary adoption of compensation clawback
provisions. The Accounting Review 90: 147-174.
Cheng, Q. and T. Warfield. Equity incentives and earnings management. The Accounting Review 80: 441-476.
Clor-Proell, S. and L. Maines. 2014. The Impact of Recognition Versus Disclosure on FinancialInformation: A Preparer's Perspective. Journal of Accounting Research 52: 671-
701.
23
Crowley, P. and T.R. Zentall. 2013. Comparative Decision Making. Oxford University Press.
The Dodd-Frank Wall Street Reform and Consumer Protection Act. U.S. House of Representatives.2010. Pub. L. 111-203, H.R. 4173. Washington, DC: GPO.
Denis, D. K. 2012. Mandatory clawback provisions, information disclosure , and the regulation of securities markets. Journal of Accounting and Economics 54 (2), 197-200.
Dichev, I., J.R. Graham, C.R. Harvey & S. Rajgopal. Earnings Quality: Evidence from theField. Journal of Accounting and Economics 56 (2013): 1-33.
Epley, N. and T. Gilovich. 2016. The Mechanics of Motivated Reasoning. Journal of EconomicPerspectives: 30: 3: 133–140
Ettredge, M. S.Scholz, K.R.Smith and L.Sun. 2010. How Do Restatements Begin? Evidence of Earnings Management Preceding Restated Financial Reports. Journal of BusinessFinance and Accounting 37: 332-355.
Gallagher (2015). Securities and Exchange Commission. Dissenting Statement at an Open Meeting on Dodd-Frank Act “Clawback” Provision.
http://www.sec.gov/news/statement/dissenting-statement-compensation-clawback-listing-standards.html
Graham, J. R., C. R. Harvey and S. Rajgopal. 2005. The Economic Implications of CorporateFinancial Reporting, Journal of Accounting and Economics 40: 3–73.
Gunny, K. 2010. The Relation Between Earnings Management Using Real ActivitiesManipulation and Future Performance: Evidence from Meeting Earnings
Benchmarks. Contemporary Accounting Research 27: 855-888.
Hazarika, S., J.M. Karpoff, & R. Nahata. 2012. Internal corporate governance, CEO turnover,and earnings management. Journal of Financial Economics 104: 44-69.
Healy, P. M., and J. M. Wahlen. 1999. A review of the earnings management literature and itsimplications for standard setting. Accounting Horizons 13 (4): 365-383.
Hribar, P., S.J. Melessa, C. Small., and J.H. Wilde. 2017. Does managerial sentiment affectaccrual estimates? Evidence from the banking industry. Journal of Accounting
and Economics 63: 26-50.
Jacob, J. and B.N. Jorgensen.2007. Earnings management and accounting income aggregation. Journal of Accounting and Economics 43: 369-390.
Jensen, M. 1986. The takeover controversy, analysis and evidence. Midland Corporate FinanceJournal 4: 6-32.
Jensen, M. 1993. The modern industrial revolution, exit, and the failure of internal control systems. Journal of Finance 48, 831–880
24
Kachelmeier, S. J., and King, R. R. 2002. Using laboratory experiments to evaluate accounting policy issues. Accounting Horizons, 16(3): 219-232.
Kasznik, R and M. McNichols. 2002. Does Meeting Expectations Matter? Evidence fromAnalyst Forecast Revisions & Share Prices. Journal of Accounting Research 40:
727-59.
Kunda, Z. The Case for Motivated Reasoning. Psychological Bulletin 108 (1990): 480–98.
Larcker, D., and B. Tayan. 2011. Corporate Governance Matters: A Closer Look at Organizational Choices and Their Consequences. Pearson FT Press.
Levitt, A. 1998. The numbers game. The CPA Journal 68 (12): 14-18.
Lerner, J.S. and P. Tetlock. 1999. Accounting for the effects of accountability. PsychologicalBulletin. 125(2):255-275.
Libby, R. K. Rennekamp, and N. Seybert. 2015. Regulation and the interdependent roles of
managers, auditors, and directors in earnings management and accounting choice.Accounting, Organizations, and Society 47: 25-42.
Mckay, B., and N. Deogun. Coca-Cola's Board Rejects Buying Quaker Oats to Obtain Gatorade.Wall Street Journal, (2000),
http://www.wsj.com/articles/SB974851025247848425; Accessed on 29th October, 2015.
Nelson, M., J. Elliott and R. Tarpley. 2002. Evidence from auditors about managers’ and auditors’ earnings management decisions. The Accounting Review, 77 (2002): 175-202.
Richardson, S., I. Tuna and M.Wu. 2002. Predicting Earnings Management: The Case ofEarnings Restatements, Working Paper.
Rose, J., A.M. Rose, C.s. Norman and C.R. Mazza. 2014. Will Disclosure of Friendship Ties between Directors and CEOs Yield Perverse Effects? The Accounting Review 89: 1545-1563
Roychowdhury, S. 2006. Earnings management through real activities manipulation. Journal of Accounting and Economics 42: 335-370
The Sarbanes-Oxley Act. U.S. House of Representatives. (2002). Pub. L. 107-204, Washington, DC.
Securities and Exchange Commission. 2015a. Proposed Rules Designed to Improve Quality ofFinancial Reporting and Enhance Accountability Benefiting Investors.
http://www.sec.gov/news/pressrelease/2015-136.html
Shleifer, A., and R, Vishny. 1997. A survey of corporate governance. Journal of Finance. 52: 737-783.
Vlasic, B. “G.M. Decides to Keep Opel, Its European Unit” New York Times, (2009) http://www.nytimes.com/2009/11/04/business/global/04gm.html Accessed on 29th October, 2015
25
Wahlen, J., S. Baginski, and M. Bradshaw. 2010. Financial Reporting, Financial Statement Analysis and Valuation: A Strategic Perspective. Cengage Learning.
Zang, A. 2012. Evidence on the Trade-Off between Real Activities Manipulation and Accrual-BasedEarnings Management. The Accounting Review. 87: 2 : 675 – 703.
26
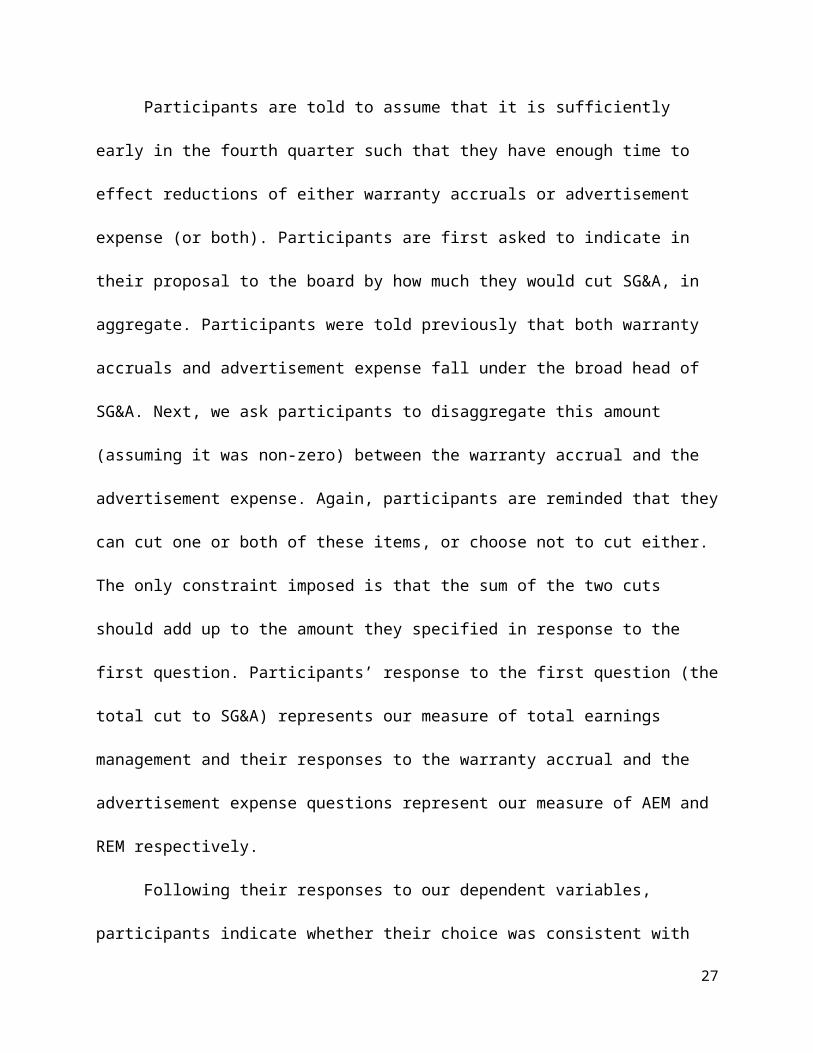
Figure I
Figure I graphically presents the impact of clawbacks and boards on AEM, REM, and TEM in three conditions. The numbers represent the proposed cuts to SG&A (in $ millions: see Table I for details). In the baseline condition, the boards are weak and there is no mandated clawback. The clawback condition is identical to the baseline condition except that clawbacks are mandatory for restatements. The strong board condition is identical to the baseline condition except that boards are strong.
27
TABLE I
Descriptive Statistics ($ millions)
ACCRUAL EARNINGS MANAGEMENT, REAL EARNINGS MANAGEMENT & TOTAL EARNINGS MANAGEMENT
Mean Judgments (Standard Deviation)
Board Strength
Mandated Clawback Strong Weak
Row
Means
Present0.51 (0.50)0.72 (0.57)1.23 (0.78)
n=32
0.28 (0.40)1.27 (0.67)1.55 (0.68)
n=26
0.41 (0.47)0.97 (0.67)1.37 (0.75)
n=58
Absent0.52 (0.38) 0.78 (0.47) 1.30 (0.64)
n=30
0.72 (0.49)0.97 (0.49)1.69 (0.56)
n=34
0.63 (0.45) 0.88 (0.48) 1.51 (0.63)
n=64
Column
Means
0.51 (0.44)0.75 (0.52)1.26 (0.71)
n=62
0.53 (0.50) 1.10 (0.58)1.63 (0.61)
n=60
Experimental participants in the role of a CEO indicate in their proposal to the board how much they would cut selling, general, and administrative (SG&A) expenses in the last quarter to increase the likelihood of meeting or exceeding analysts’ earnings estimates. The proposed cut in SG&A (in $ millions) represents our measure of Total Earnings Management (TEM).
Participants further indicate how much of this proposed cut in SG&A would come from warranty expense and from advertising expense. The proposed reduction in warranty expense constitutes our measure of Accrual Earnings Management (AEM). The proposed reduction in advertising expense constitutes our measure of Real Earnings Management (REM).
We manipulate two factors—board strength (strong versus weak) and mandated clawbacks (present versus absent) resulting in four treatment conditions.
This table presents descriptive statistics for participants’ proposed cuts to SG&A. The first row represents our measure of AEM, the second our measure of REM, and the third row represents TEM.
28
TABLE II: PLANNED COMPARISONS
PANEL A: Baseline versus Clawback condition
Test statistic
p-value
H1a Mandated clawbacks will not impact TEM relative to our baseline condition t = 0.903 0.370H1b Mandated clawbacks will reduce AEM relative to our baseline condition t = 3.780 < .001H1c Mandated clawbacks will increase REM relative to our baseline condition t = -
2.2030.024
PANEL B: Baseline versus Strong Boards condition
Test statistic
p-value
H2a Strong boards will reduce TEM relative to our baseline condition t = 2.589 0.012H2b Strong boards will reduce AEM relative to our baseline condition t = 1.842 0.035H2c Strong boards will reduce REM relative to our baseline condition t = 1.571 0.061
This table presents the planned comparisons between conditions that test our primary hypotheses. Details of the conditions are provided in Table I and Figure I. All p-values are one tailed (except for the p value testing H1a).
29
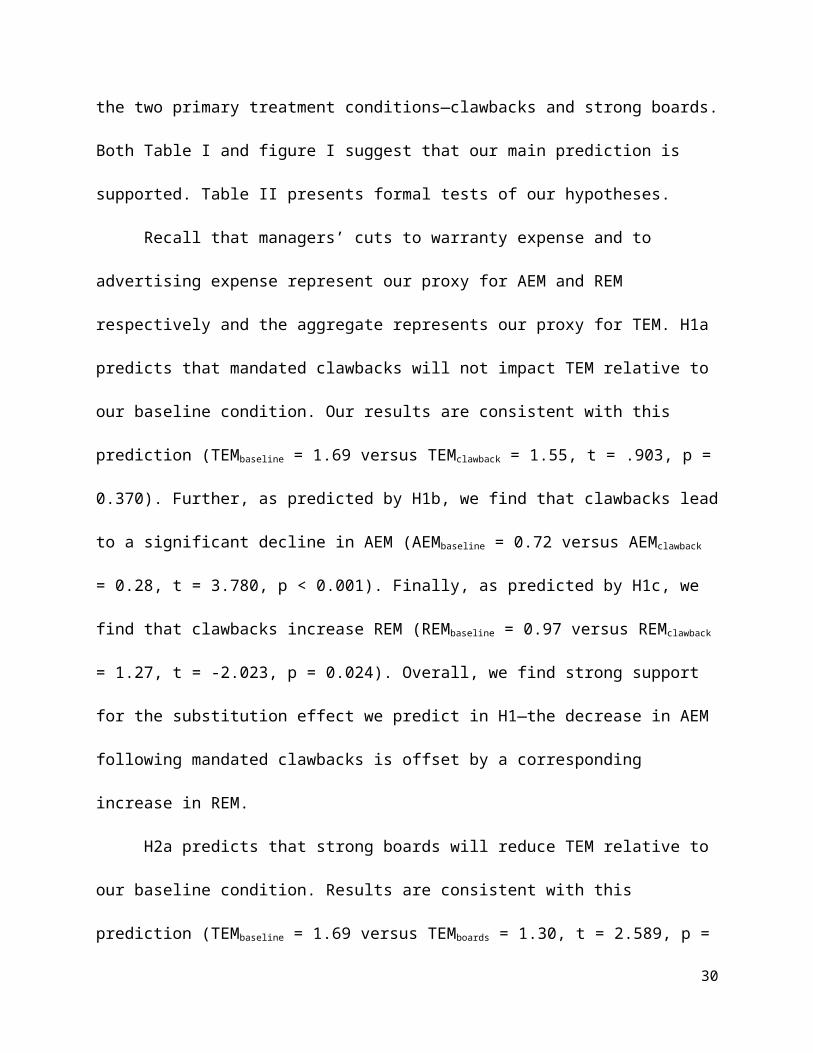
TABLE III: CONVENTIONAL ANOVAS
Panel A: Analysis of Variance: Accruals Earnings Management (AEM)
Source Sum of Squares
d.f. Mean Square
s
F-Statistic p-value
Clawback 1.576 1 1.576 7.834 0.006
Board 0.004 1 0.004 0.019 0.892
Clawback × Board 1.387 1 1.387 6.898 0.010
Error 23.732 118 0.201
Panel B: Analysis of Variance: Real Earnings Management (REM)
Source Sum of Squares
d.f. Mean Square
s
F-Statistic p-value
Clawback 0.419 1 0.419 1.415 0.237
Board 4.058 1 4.058 13.711 0.000
Clawback × Board 0.983 1 0.983 3.322 0.071
Error 34.921 118 0.439
Panel C: Analysis of Variance: Total Earnings Management (TEM)
Source Sum of Squares
d.f. Mean Square
s
F-Statistic p-value
Clawback 0.370 1 0.340 0.827 0.365
Board 3.815 1 3.815 8.531 0.004
Clawback × Board 0.035 1 0.035 0.078 0.781
Error 52.763 118 0.447
Panel A presents the results of an ANOVA with board strength and mandated clawbacks as the independent variables and the dollar amount of AEM as the dependent variable. Panels B & C present the results of an
30
ANOVA with the same independent variables, but with REM and TEM as the dependent variable respectively. All p-values are two tailed.
31